
Abstract
Objectives:
This study evaluates whether continuous glucose monitoring (CGM) metrics predict adverse neonatal outcomes among individuals undergoing gestational diabetes screening. Building on findings by Fishel Bartal et al, who reported an association between ≥10% time above 140 mg/dL and a composite neonatal outcome, this analysis examines 13 additional CGM-derived measures reflecting glycemic variability (GV) and glycemic extremes.
Methods:
Eighty-four pregnant individuals wore CGM devices for 10 days following a 1-hour 50 g glucose challenge test. Generalized estimating equation logistic regression models assessed associations between CGM metrics and a composite neonatal outcome consisting of large-for-gestational-age birth, need for intravenous glucose treatment, or shoulder dystocia. Model discrimination was quantified using the area under the receiver operating characteristic curve (AUROC).
Results:
Several CGM measures—including mean glucose, standard deviation (SD), maximum glucose, %Time >140 mg/dL, %Time >120 mg/dL, glucose management indicator (GMI), mean of daily differences (MODD), mean amplitude of glycemic excursions (MAGE), area under the CGM curve (AUC-CGM), and high blood glucose index (HBGI)—were significantly associated with adverse neonatal outcomes (P < .05). Metrics demonstrating higher discrimination than the original ≥10% time-above-range measure (AUROC = 0.643) included SD (0.656), MAGE (0.665), mean glucose (0.676), GMI (0.676), maximum glucose (0.683), %Time >120 mg/dL (0.683), AUC-CGM (0.692), HBGI (0.701), and %Time >140 mg/dL (0.703).
Conclusions:
Continuous glucose monitoring metrics reflecting sustained or high-level hyperglycemia, rather than GV-focused metrics, more strongly predicted adverse neonatal outcomes. These findings suggest that persistent or extreme maternal glucose elevations, rather than variability alone, may drive neonatal risk and support refining CGM-based screening approaches in pregnancy.
Keywords
Introduction
Gestational diabetes mellitus (GDM) is associated with a broad spectrum of adverse perinatal outcomes, including fetal macrosomia, shoulder dystocia, neonatal respiratory distress, and hypoglycemia.1,2 Despite these well-established risks, controversy remains regarding optimal diagnostic criteria for GDM. Current approaches rely primarily on oral glucose tolerance testing (OGTT) in the late second or early third trimester, using either a 2-step or 1-step protocol.3,4 However, these methods provide only a limited snapshot of glycemia and may fail to identify individuals with intermittent hyperglycemia or other dysglycemia patterns that confer risk for adverse neonatal outcomes. Furthermore, the thresholds defining abnormal glucose tolerance and the degree of hyperglycemia that warrants treatment remain subjects of ongoing debate.5,6
To address limitations of intermittent glucose testing, continuous glucose monitoring (CGM) offers a dynamic assessment of glucose fluctuations throughout the day and night. In a recent prospective study of 92 pregnant individuals undergoing standard 2-step GDM screening prior to 30 weeks’ gestation, 7 Fishel Bartal et al applied 10 days of CGM and evaluated multiple glycemic indices, including average glucose, time in range (TIR, %time glucose 70-140 mg/dL), time above range (TAR, %time glucose >140 mg/dL), time below range (TBR, %time glucose < 70 mg/dL), and coefficient of variation (CV). Although only one participant met diagnostic criteria for GDM, the study demonstrated that ≥10% time above 140 mg/dL was associated with a composite adverse neonatal outcome. These findings suggest that CGM can identify clinically relevant dysglycemia not captured by conventional OGTT screening, yet they also highlight the need to examine whether additional CGM-derived parameters—such as mean amplitude of glycemic excursions (MAGE), glucose management indicator (GMI), mean of daily differences (MODD), and others—might provide a more comprehensive view of glycemic extremes and glycemic variability (GV) in pregnancy.
As CGM use becomes increasingly common in pregnancy,8,9 emerging data suggest that existing glycemic targets may not accurately reflect physiologic euglycemia in this population. 10 There is growing interest in defining which CGM metrics most strongly predict adverse pregnancy outcomes and whether such measures can refine therapeutic goals. 11 While most guidelines emphasize TIR and TAR as the primary clinical benchmarks, 12 additional CGM metrics may better characterize the patterns of dysglycemia that contribute to neonatal morbidity. Here, we performed a secondary analysis of CGM data from Fishel Bartal et al 7 of pregnant patients without diabetes, hypothesizing that alternative CGM metrics that capture GV, or glycemic extremes better predict adverse neonatal outcomes than time above range.
Materials and Methods
Study Population and Outcome
Our analysis included 84 pregnant individuals enrolled in a prospective observational study at UT Health Houston McGovern Medical School (HSC-MS-18-0774) as described in the original analysis with available CGM data. 7 Individuals who were >18 years and seeking obstetrical care at ≤30 weeks of gestation and did not have a previous diagnosis of type 1 (T1D) or type 2 diabetes mellitus (T2DM) were eligible for inclusion. All participants had a blinded Dexcom G6 Pro CGM device for a 10-day period at the time of their 50 g 1-hour glucose challenge test (GCT). The CGM systems were placed on the day of the 1-hour 50 g GCT with the Dexcom G6 Pro having a 2-hour warm up period after placement where glucose readings are not recorded. The device took glucose readings (mg/dL) every 5 minutes continuously throughout the 10-day wearable period. At the end of this period, the patients were instructed to remove and return the device to the clinic where the data was downloaded and blinded to the research team. Following this, the 2-step screening method outlined by the American College of Obstetrics and Gynecology (ACOG) was used to determine GDM status. 3 An abnormal 1-hour 50 g GCT reading—defined by glucose readings ≥135 mg/dL—was followed by a 3-hour oral GTT which was used to diagnose GDM. If this diagnosis arose, follow-up with certified diabetes care specialists were planned. Further care followed ACOG guidelines. Participants were instructed to continue with follow-up as the main standard of care.
We targeted an adverse neonatal composite outcome including any of the following at the time of delivery: large for gestational age (LGA) (defined as newborn birth weight greater than the 90th percentile of expected weight given gestational age), shoulder dystocia, respiratory distress (defined as needing at least 4 hours respiratory support), need for intravenous (IV) glucose treatment for hypoglycemia, or neonatal death. 7
We evaluated a set of metrics derived from the CGM data which capture mean glucose, and glycemic extremes and GV. Continuous metrics include those which highlight average glucose: mean absolute glucose (MAG) 13 and GMI 14 ; those which capture GV: MAGE, 15 glucose variability percentage (GVP), 16 continuous overall net glucose action (CONGA), 17 MODD, 18 and average daily risk range (ADRR) 19 ; and those which measure glycemic extremes: low/high blood glucose index (LBGI/HBGI)20,21 and area under the curve (AUC-CGM). Both GMI and AUC-CGM were standardized into Z-scores to aid in interpretation. We also consider a set of binary metrics: if the participant had a glucose reading above 200 mg/dL (“Spike”), if the average glucose reading was above 120 mg/dL (mean120) or 130 mg/dL (mean130), and time above range was greater or equal to 10% (TAR ≥10%), the main variable of interest in Fishel Bartal et al. 7 Mean; standard deviation (SD); coefficient of variation (CV); minimum; maximum; time in, above, and below the 70 to 140 mg/dL range as well as the 70 to 120 mg/dL range; and percentage of glucose readings below 95 mg/dL were also evaluated. Metrics were calculated using all available CGM data and during shorter time windows—including daytime (6:01 am-11:59 pm) and nighttime (12:00 am-6:00 am).
Statistical Analysis
Associations between the CGM metrics and the adverse neonatal composite outcome were assessed using logistic regression models with robust variance estimators (eg, general estimating equations models) to account for correlation in outcomes among twins. Secondary analyses evaluated the association between CGM metrics and each component of the composite outcome as well as 50 g 1-hour GCT glucose reading and birthweight.
To assess diagnostic utility in predicting the adverse composite neonatal outcome, a receiver operating characteristic curve (ROC) was constructed and the area under the curve (AUC) was calculated for all metrics with a P-value <.05 from the robust logistic regression model. Further information on sensitivity, specificity, positive predictive value, negative predictive value, false positive rate, false negative rate, and accuracy is presented at decile thresholds for each of the metrics whose area under the receiver operating characteristic curve (AUROC) exceeded that of TAR ≥10%; the optimal value was determined by the associated Youden’s metric (the sum of sensitivity and 1 − specificity). All P-values are 2-sided and have not been adjusted for multiple comparisons. The significance threshold used in this exploratory analysis was P < .05. All analyses were performed using the R software (version 4.5.0; R Core Team, 2013; R Foundation for Statistical Computing, Vienna, Austria) using package rGV for additional CGM metrics. 22
Results
Eighty-four individuals were included in this analysis. The median (interquartile range) age was 28 years (22, 33) with a median body mass index (BMI) of 31.1 kg/m2 (26, 36). At application of CGM, the median gestational age was 25.6 (24.3, 27.0). Participants wore their CGM devices for a median duration of 9.44 (7.19, 9.83) days. Twenty-one adverse neonatal outcomes were recorded among 87 neonates from the 84 pregnancies (3 with twins) with only one individual having gestational diabetes (GDM) (Tables 1 and 2). The median average glucose (mg/dL) level was 106.1 (97.8, 112.6) with median standard deviation of 18.0 (15.4, 19.8) (Table 3).
Baseline Maternal Demographic Information.
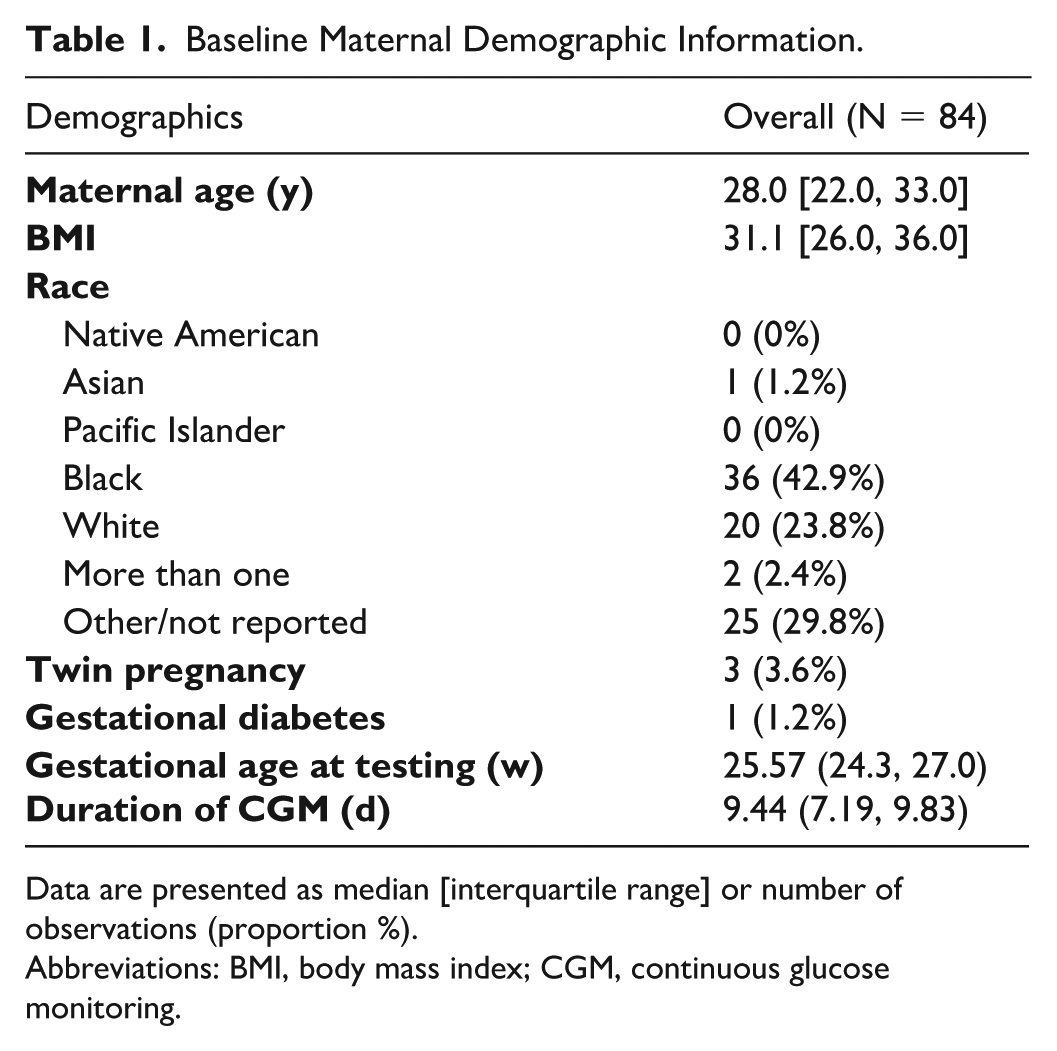
Data are presented as median [interquartile range] or number of observations (proportion %).
Abbreviations: BMI, body mass index; CGM, continuous glucose monitoring.
Neonatal Outcomes.
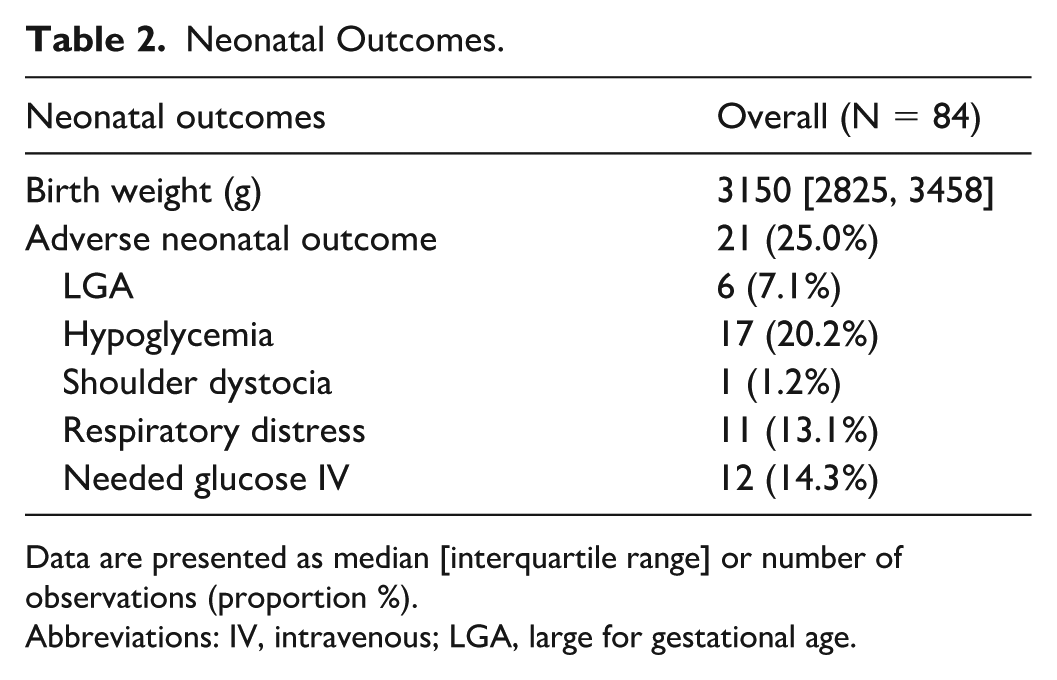
Data are presented as median [interquartile range] or number of observations (proportion %).
Abbreviations: IV, intravenous; LGA, large for gestational age.
CGM Metric Information Measured at End of 10-Day Period.
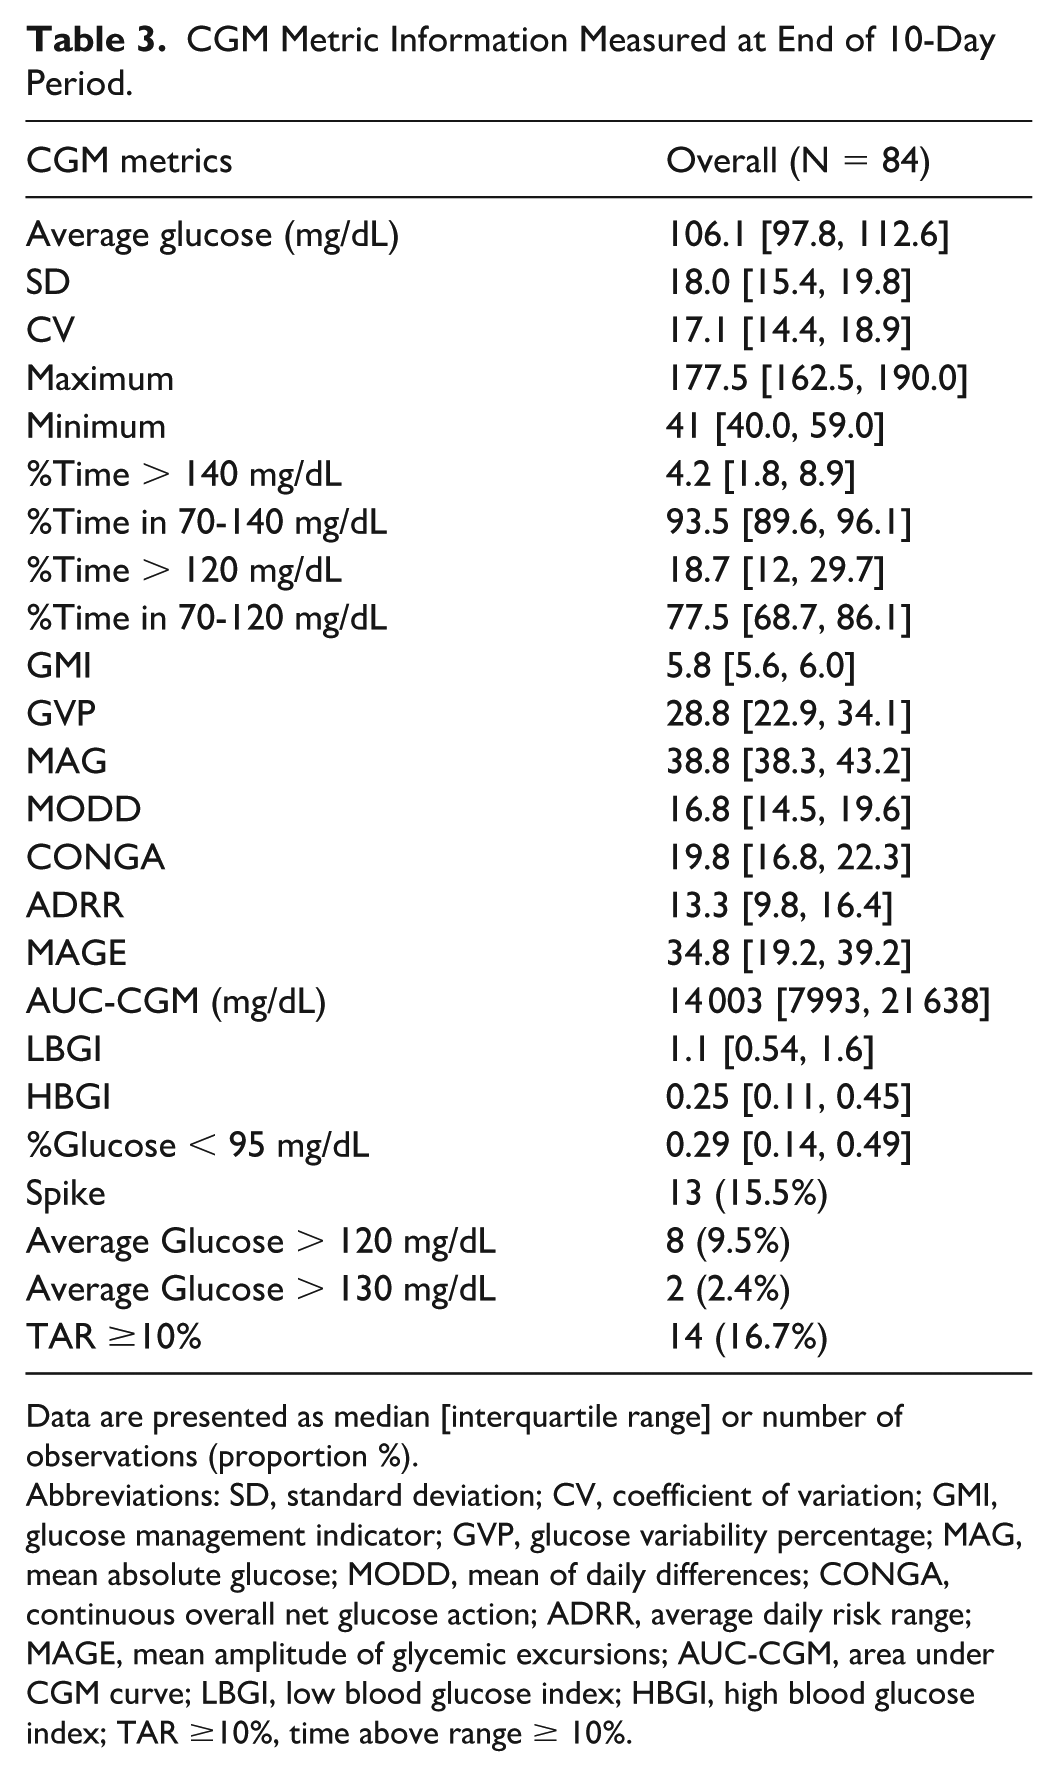
Data are presented as median [interquartile range] or number of observations (proportion %).
Abbreviations: SD, standard deviation; CV, coefficient of variation; GMI, glucose management indicator; GVP, glucose variability percentage; MAG, mean absolute glucose; MODD, mean of daily differences; CONGA, continuous overall net glucose action; ADRR, average daily risk range; MAGE, mean amplitude of glycemic excursions; AUC-CGM, area under CGM curve; LBGI, low blood glucose index; HBGI, high blood glucose index; TAR ≥10%, time above range ≥ 10%.
CGM Metrics and Outcomes
Many significant associations were found between the CGM metrics and the neonatal composite outcome (Figure 1, Supplemental Figure 1). Average glucose (odds ratio [OR]: 1.06; 95% CI: 1-1.12), standard deviation (OR: 1.16; 95% CI: 1.03-1.31), maximum (OR: 1.03; 95% CI: 1, 1.05), %Time > 140 mg/dL range (OR: 1.09; 95% CI: 1.01, 1.18), and %Time > 120 mg/dL range (OR: 1.04; 95% CI: 1-1.06) were all positively associated with the neonatal composite outcome. Similarly, GMI (OR: 10.24; 95% CI: 1.06-98.7), MODD (OR: 1.14; 95% CI: 1.01-1.3), MAGE (OR: 1.08; 95% CI: 1.02-1.15), AUC-CGM (OR: 2.78; 95% CI: 1.17-6.58), and HBGI (OR: 4.31; 95% CI: 1.1-16.85) were significantly associated with the composite outcome. Finally, the binary metrics mean120 (OR: 6.25; 95% CI: 1.33-29.3) and TAR ≥10% (OR: 5.85; 95% CI: 1.69-20.17) were significantly associated with the composite. Associations in the analysis of subcomponents generally yielded similar results with the previously described metrics having similar odds ratios and confidence intervals for need for IV glucose, respiratory distress, and LGA (Supplemental Table 1, Supplemental Figures 2-4). However, HBGI (OR: 0.03; CI: 0-0.52), AUC-CGM (OR: 0.51; CI: 0.27-0.99), and %time over 120 mg/dL (OR: 0.96; CI: 0.92-0.99) had negative significant associations with need for IV glucose (Supplemental Figure 2), rather than their positive associations with the full composite outcome. Results were similar across the daytime and nighttime windows and the full 24-hour window (Supplemental Table 2).
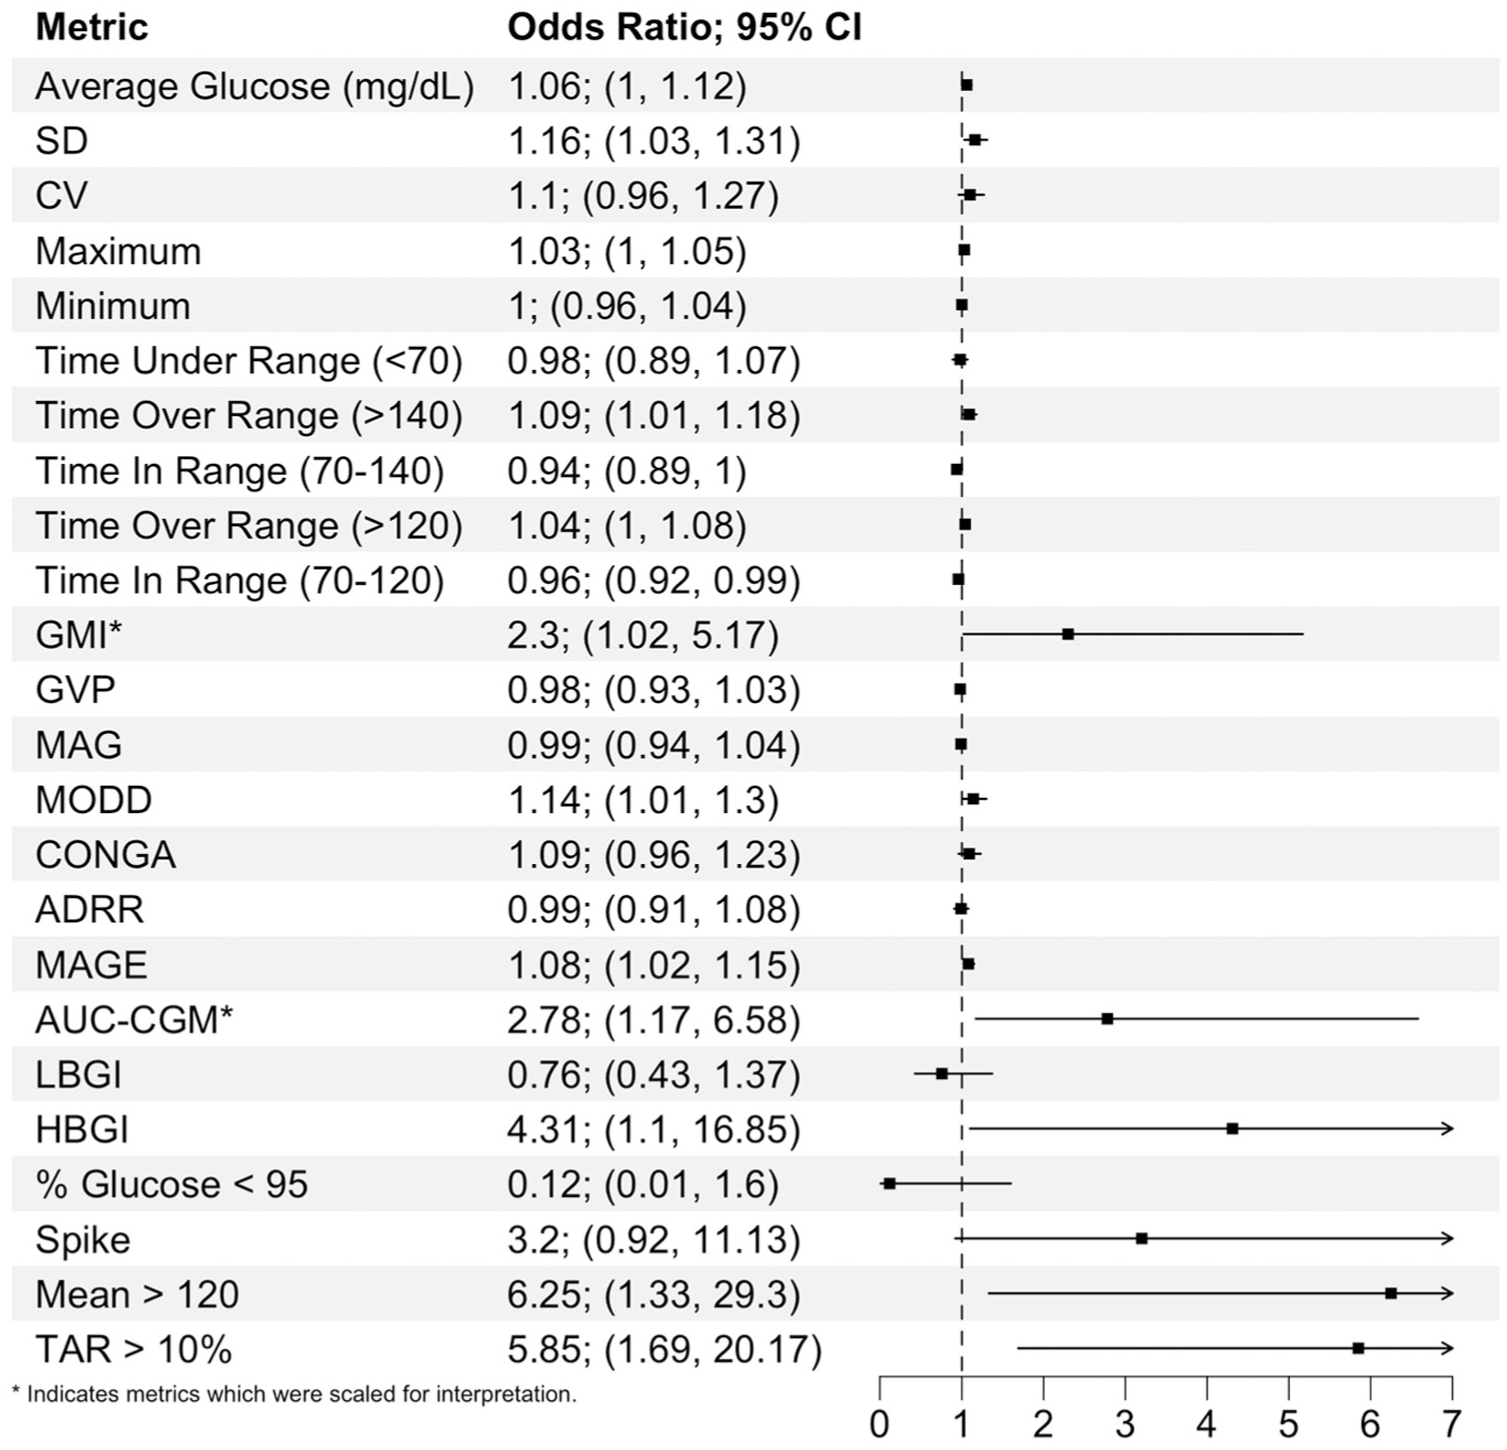
Summary of associations between the adverse neonatal composite outcome and CGM metrics.
In the original analysis, the AUROC for TAR ≥10% was 0.643 (95% CI: 0.53-0.76). 7 In this study, SD (AUROC: 0.656; CI: 0.518-0.794), MAGE (AUROC: 0.665; CI: 0.53-0.8), average glucose (AUROC: 0.676; CI: 0.53-0.82), GMI (AUROC: 0.676; CI: 0.53-0.82), maximum (AUROC: 0.683; CI: 0.55-0.82), %Time > 120 mg/dL (AUROC: 0.683; CI: 0.54-0.83), AUC-CGM (AUROC: 0.692; CI: 0.55-0.83), HBGI (AUROC: 0.701; CI: 0.56-0.84), and %Time > 140 mg/dL (AUROC: 0.703; CI: 0.56-0.84) had numerically larger areas under the ROC curve than TAR ≥10%, but no significant increases in AUROC were observed between these metrics. We compare the ROC of the metric with the highest AUROC (%Time > 140 mg/dL) with that of TAR ≥10% (Figure 2).
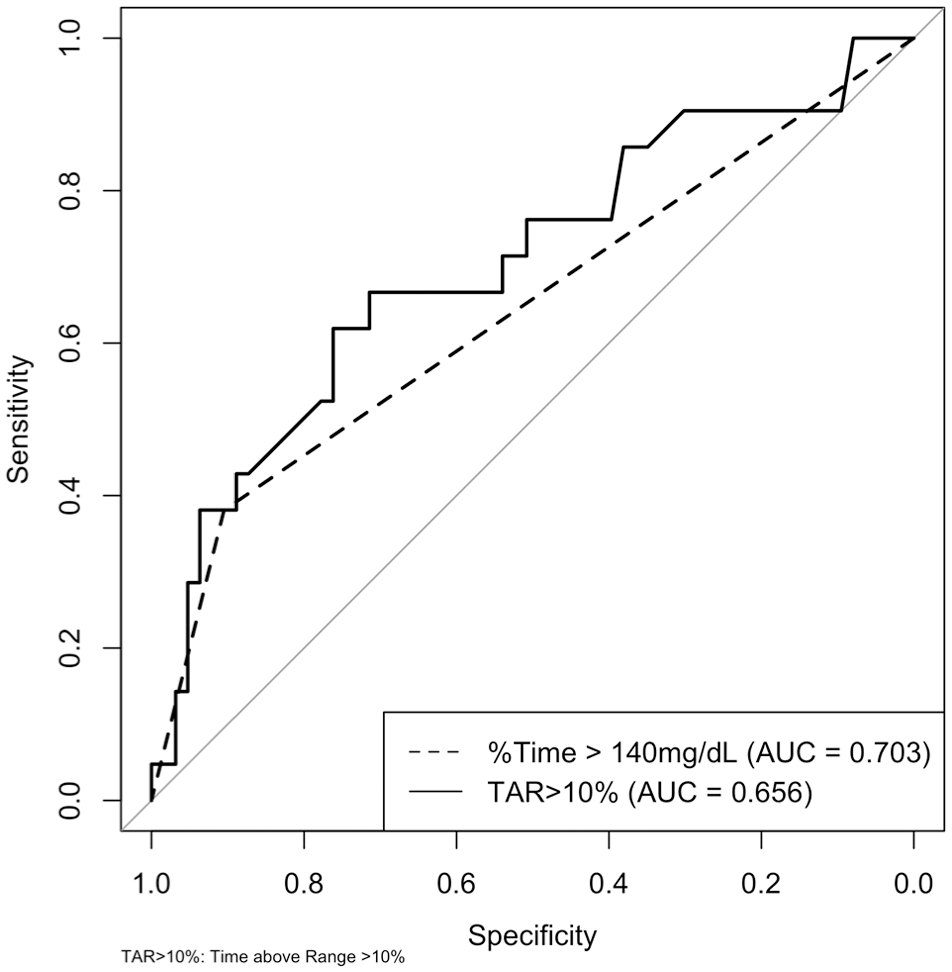
ROC curve comparing %time > 140 mg/dL (AUROC: 0.703) to TAR ≥10% (range: 63-140 mg/dL) (AUROC: 0.656).
We evaluated the optimal cut points for the best performing CGM metrics in terms of AUROC. The optimal cut point for %Time > 140 mg/dL in terms of the Youden’s index (0.35) was 5.96 (Table 4). With this threshold 67% of those who ultimately experience an adverse neonatal outcome would be correctly identified (sensitivity) and only 32% would be incorrectly identified as being at increased risk (false positive rate). These results are improved compared to TAR ≥10% which had a Youden’s index of 0.29, a sensitivity of 38%, and a false positive rate of 10% (Supplemental Table 3).
Diagnostic Performance Metrics of %Time > 140 mg/dL for Prediction of Composite Adverse Neonatal Outcome.
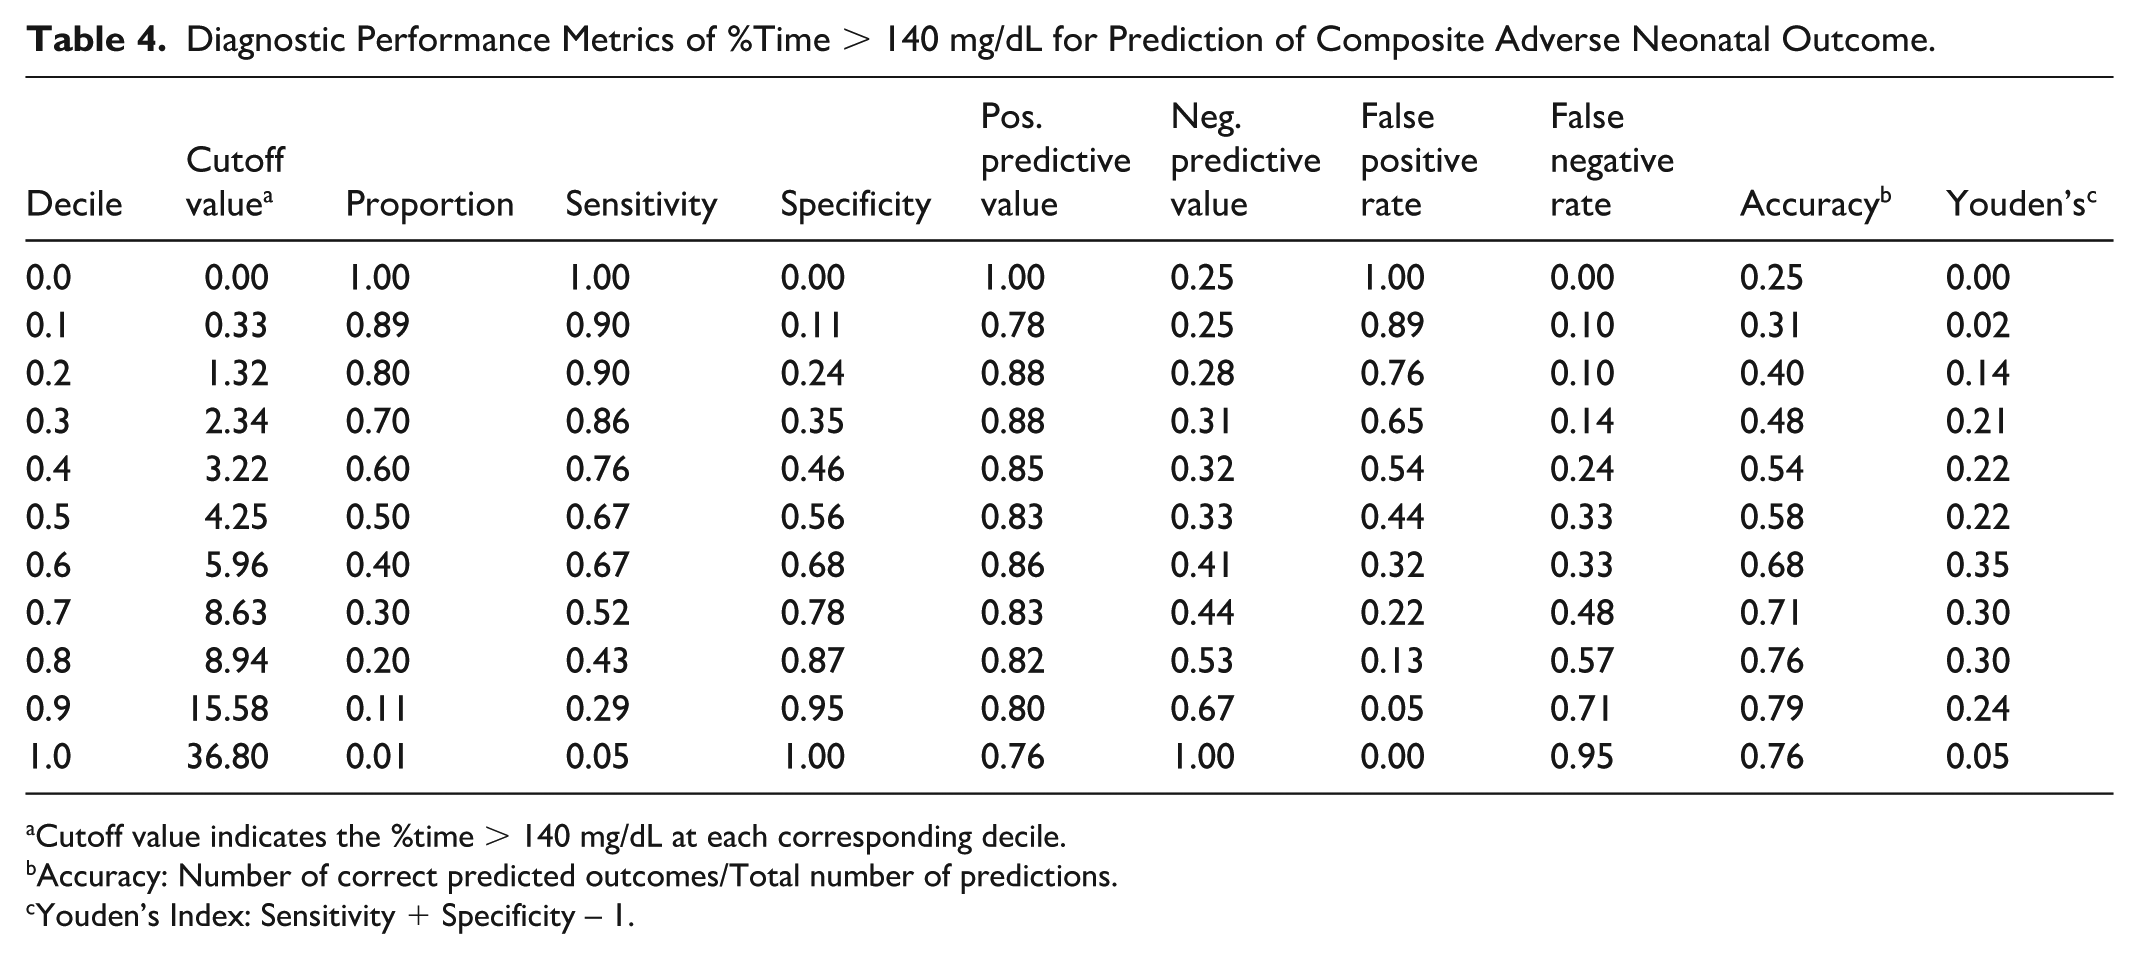
Cutoff value indicates the %time > 140 mg/dL at each corresponding decile.
Accuracy: Number of correct predicted outcomes/Total number of predictions.
Youden’s Index: Sensitivity + Specificity – 1.
Discussion
Supporting our hypothesis, we identified several CGM metrics significantly associated hyperglycemia and adverse neonatal composite outcomes among pregnant individuals without known diabetes undergoing GDM screening. Similar to the parent study, we found a significant relationship between TAR ≥10% and the composite outcome. Fishel Bartal et al 7 found that TAR ≥10% was more predictive of the composite outcome (as evidenced by a greater area under the curve) than a 1-hour GCT of ≥135, the threshold for an abnormal 1-hour 50-g GCT result. Among the additional metrics evaluated in this analysis, %Time > 140 mg/dL, AUC-CGM, HBGI, %Time > 120 mg/dL, maximum glucose, GMI, average glucose, MAGE, and SD had the strongest association with the adverse composite outcome, with the AUROC of these metrics exceeding that of TAR ≥10%. Although with the limited sample size, no significant differences in classification performance were identified. The cut point analysis (Table 4) found that the optimal threshold for the CGM metric with the highest AUROC (%time > 140 mg/dL) was around 6%. Compared to the target metric from the original study, the binary TAR ≥10%, this suggests a slightly more nuanced threshold than previously stated. Interestingly, all but one of the CGM metrics with AUROC values exceeding that of TAR ≥10% capture hyperglycemia. This suggests that hyperglycemia, more so than GV, is associated with adverse neonatal outcomes.
Beyond average glucose, SD, and % time above range measures, which are among metrics commonly used in CGM analysis of cohorts with T1DM, T2DM, and GDM, we identified associations with less commonly used metrics like AUC-CGM and HBGI which highlight glycemic extremes, and MAGE which captures GV.23-25 Area under the CGM curve and HBGI are novel metrics in the literature of CGM metrics for gestational diabetes. Area under the CGM curve captures the cumulative glucose profile and therefore scales with larger CGM. High blood glucose index behaves similarly though in its transformation of the glucose readings to risk scores it focuses on high glucose events. In both cases, profiles with generally higher glucose readings yield higher AUC-CGM and HBGI values reflecting the burden of hyperglycemia. We also see an association between adverse neonatal outcomes and MAGE—a metric developed specifically for capturing GV in patients with T2DM—a finding consistent with other studies.15,26,27
Interestingly, some of the CGM metrics did not show significant association with any of the subcomponents of the composite adverse outcome, likely due to the rarity of events. Glucose management indicator was significantly associated with increased risk for LGA; however, AUC-CGM and HBGI were not. Furthermore, when measuring the associations between these metrics and need for IV glucose, GMI did not have a significant relationship with this outcome whereas AUC-CGM and HBGI had significant, negative associations, a direction different from their relationships with the overall composite outcome. There were no significant relationships between any CGM metrics and respiratory distress. The associations with LGA appear to drive the overall association with the full adverse composite outcome.
The timing of this study’s administration of CGM devices and subsequent collection of CGM profile data is worthy of note. While many studies focus on glucose patterns in early pregnancy (first and second trimester), our CGM readings were taken during the end of these patients’ second and beginning of their third trimesters (24-28 weeks) at the time of their GCT and OGTT procedures for diagnosis of GDM. There are very few studies whose data collection took place during this period. Law et al 28 found an association between high CGM glucose readings at night (12:30 am-6:30 am) at 30 to 32 weeks and infants born LGA. Other studies of CGM measures in early pregnancy show connections between GV metrics and GDM diagnosis or adverse neonatal outcomes.25,26 Our findings coupled with those of the previous studies may indicate a need for timing-specific interpretation of CGM measures. Perhaps high GV readings is of most concern in early pregnancy and higher overall glucose readings is more concerning as the third trimester approaches.
It is also worth noting that our cohort’s demographic makeup is different than much of the current literature around GDM diagnosis which has focused on Asian populations.24-27 The racial and ethnical makeup of our US-based study was 1.2% Asian, 42.9% Black, and 23.8% White and 27.2% with Hispanic/Latina ethnicity. 7 Gestational diabetes mellitus rates in the United States have steadily increased over the past years, with the number of GDM cases increasing from 6.0% in 2016 to 7.8% in 2020, a 30% increase. In 2020, the highest rate of GDM diagnoses per birth (14.9%) belonged to non-Hispanic Asian women, 8.5% to Hispanic women, and only 7% and 6.5% to non-Hispanic White and Black women, respectively. The increase in GDM diagnosis rates from 2016 to 2020 were similar among non-Hispanic Black, White, and Asian populations, ranging from 28% to 35%. 29 While the majority of the GDM cases and subsequent studies have focused on Asian women, our cohort allows for generalization to other racial and ethnic groups, who also have experienced similarly increasing incidence of GDM.
Limitations for this secondary analysis largely follow those suggested in the parent study. 7 In particular, the findings are limited to a small sample at a single center. This limited our ability to accurately measure the association between some CGM metrics and outcomes—specifically the subcomponents which had few observed cases (eg, only 6 births were classified LGA). Similarly, only one participant was diagnosed with incidental gestational diabetes. Therefore, these results may not be generalizable to populations at greater risk for gestational diabetes. Nevertheless, because study participants without gestational diabetes exhibited CGM metrics associated with adverse neonatal outcomes, associations between CGM metrics and adverse neonatal outcomes would likely be even stronger in high-risk populations. In addition, given this is an exploratory analysis, some of the findings may be due to type-1 error. Youden’s J-index was used to determine the optimal threshold for consistency with the previous paper. However, other metrics could be considered that account for outcome rarity and differentially weight false positives and false negatives by patient burden, which will need to be determined in future studies using patient and provider input. For those who did use the CGM, some uncertainty remains around the optimal wear-time. Previous research suggests that a minimum of 14 days of CGM is optimal. 30 The capture duration for this study was limited by the 10-day duration of the Dexcom G6 sensor and for future studies, a slightly longer glucose collection period should be assessed. We acknowledge that lack of validation of these results against an external cohort is a weakness, although this could be possible as future trials (NCT05430204) are completed.
Conclusions
As CGM use expands beyond individuals with established diabetes to patients without diabetes undergoing GDM screening, there are opportunities to consider CGM metrics beyond conventional TIR and TAR goals. The association between adverse neonatal outcomes and CGM metrics capturing hyperglycemia, such as AUC-CGM and HBGI, suggests that future studies using CGM to screen for hyperglycemia during the late second and early third trimester, at the time of OGTT and GDM diagnosis, may enhance early detection of adverse neonatal outcomes.
Supplemental Material
sj-docx-1-dst-10.1177_19322968261461603 – Supplemental material for Continuous Glucose Monitoring Metrics for Predicting Adverse Neonatal Outcomes in Individuals Undergoing Gestational Diabetes Screening
Supplemental material, sj-docx-1-dst-10.1177_19322968261461603 for Continuous Glucose Monitoring Metrics for Predicting Adverse Neonatal Outcomes in Individuals Undergoing Gestational Diabetes Screening by Caleb Griffiths, Rafael Bravo Santos, Sarah A. Wernimont, Julie Anderson, Megan Kristan, Erika S. Helgeson, Lisa S. Chow and Michal Fishel Bartal in Journal of Diabetes Science and Technology
Supplemental Material
sj-png-1-dst-10.1177_19322968261461603 – Supplemental material for Continuous Glucose Monitoring Metrics for Predicting Adverse Neonatal Outcomes in Individuals Undergoing Gestational Diabetes Screening
Supplemental material, sj-png-1-dst-10.1177_19322968261461603 for Continuous Glucose Monitoring Metrics for Predicting Adverse Neonatal Outcomes in Individuals Undergoing Gestational Diabetes Screening by Caleb Griffiths, Rafael Bravo Santos, Sarah A. Wernimont, Julie Anderson, Megan Kristan, Erika S. Helgeson, Lisa S. Chow and Michal Fishel Bartal in Journal of Diabetes Science and Technology
Supplemental Material
sj-png-2-dst-10.1177_19322968261461603 – Supplemental material for Continuous Glucose Monitoring Metrics for Predicting Adverse Neonatal Outcomes in Individuals Undergoing Gestational Diabetes Screening
Supplemental material, sj-png-2-dst-10.1177_19322968261461603 for Continuous Glucose Monitoring Metrics for Predicting Adverse Neonatal Outcomes in Individuals Undergoing Gestational Diabetes Screening by Caleb Griffiths, Rafael Bravo Santos, Sarah A. Wernimont, Julie Anderson, Megan Kristan, Erika S. Helgeson, Lisa S. Chow and Michal Fishel Bartal in Journal of Diabetes Science and Technology
Supplemental Material
sj-png-3-dst-10.1177_19322968261461603 – Supplemental material for Continuous Glucose Monitoring Metrics for Predicting Adverse Neonatal Outcomes in Individuals Undergoing Gestational Diabetes Screening
Supplemental material, sj-png-3-dst-10.1177_19322968261461603 for Continuous Glucose Monitoring Metrics for Predicting Adverse Neonatal Outcomes in Individuals Undergoing Gestational Diabetes Screening by Caleb Griffiths, Rafael Bravo Santos, Sarah A. Wernimont, Julie Anderson, Megan Kristan, Erika S. Helgeson, Lisa S. Chow and Michal Fishel Bartal in Journal of Diabetes Science and Technology
Supplemental Material
sj-png-4-dst-10.1177_19322968261461603 – Supplemental material for Continuous Glucose Monitoring Metrics for Predicting Adverse Neonatal Outcomes in Individuals Undergoing Gestational Diabetes Screening
Supplemental material, sj-png-4-dst-10.1177_19322968261461603 for Continuous Glucose Monitoring Metrics for Predicting Adverse Neonatal Outcomes in Individuals Undergoing Gestational Diabetes Screening by Caleb Griffiths, Rafael Bravo Santos, Sarah A. Wernimont, Julie Anderson, Megan Kristan, Erika S. Helgeson, Lisa S. Chow and Michal Fishel Bartal in Journal of Diabetes Science and Technology
Footnotes
Acknowledgements
All the authors thank the diabetes educators’ team for their support with the enrollment of participants in this study and all individuals who participated in this study. In addition, the authors thank the Minnesota Lions Fund and Dr Sping Lin, PhD, and Ying-Ngoh Tan Lin Family Endowment for Diabetes Research.
Abbreviations
ACOG, American College of Obstetrics and Gynecology; ADRR, average daily risk range; AUC-CGM, area under CGM curve; BMI, body mass index; CGM, continuous glucose monitoring; CONGA, continuous overall net glucose action; CV, coefficient of variation; GCT, glucose challenge test; GDM, gestational diabetes mellitus; GMI, glucose management indicator; GV, glycemic variability; GVP, glucose variability percentage; HBGI, high blood glucose index; IV, intravenous; LBGI, low blood glucose index; LGA, large for gestational age; MAG, mean absolute glucose; MAGE, mean amplitude of glycemic excursions; Mean120, average glucose > 120 mg/dL; Mean130, average glucose > 130 mg/dL; MODD, mean of daily differences; OGTT, oral glucose tolerance test; SD, standard deviation; T1D, type 1 diabetes; T2DM, type 2 diabetes mellitus; TAR, time above range; TAR≥10%, time above range (70-140 mg/dL) ≥ 10%; TBR, time below range; TIR, time in range.
Author Contributions
Funding
The authors disclosed receipt of the following financial support for the research, authorship, and/or publication of this article: Study devices were provided by Dexcom, Inc. No additional funding was provided. Dexcom, Inc had no role in the study design; conduction of the study; collection, analysis, and interpretation of data; or manuscript writing.
Declaration of Conflicting Interests
The authors declared the following potential conflicts of interest with respect to the research, authorship, and/or publication of this article: Dr Lisa S. Chow has an investigator-initiated grant from DEXCOM for product only.
Supplemental Material
Supplemental material for this article is available online.
References
Supplementary Material
Please find the following supplemental material available below.
For Open Access articles published under a Creative Commons License, all supplemental material carries the same license as the article it is associated with.
For non-Open Access articles published, all supplemental material carries a non-exclusive license, and permission requests for re-use of supplemental material or any part of supplemental material shall be sent directly to the copyright owner as specified in the copyright notice associated with the article.