






Abstract
Background:
This study examined how automatic correction boluses (ABs) vary according to active insulin time (AIT) and glucose target settings, and how these parameters impact glycemic control in individuals with type 1 diabetes.
Methods:
Retrospective data from 287 individuals with type 1 diabetes using the MiniMed 780G system in auto-mode for at least 80% of the time over a minimum period of 6 months were analyzed. The AB delivery was evaluated in relation to different AIT and glucose target settings. Glycemic outcomes, including time in range (TIR 70-180 mg/dL), were assessed.
Results:
Automatic correction boluses accounted for 33.1% of bolus insulin and 18.3% of the total daily insulin dose (TDD). Active insulin time settings significantly influenced AB delivery: individuals using a 2-hour AIT showed higher percentages of ABs relative to both TDD and bolus insulin, as well as higher AB doses expressed in IU/kg/day. Shorter AIT settings were also associated with improved TIR. In contrast, glucose target settings ranging from 100 to 120 mg/dL did not significantly affect AB delivery or TIR.
Conclusion:
Active insulin time is a key modifiable parameter influencing AB delivery and glycemic outcomes. Shorter AIT settings were associated with increased AB administration and improved TIR, whereas glucose target settings had no significant impact on these outcomes.
Keywords
Introduction
The MiniMed 780G system represents an evolution in the development of MiniMed pump technologies of integrated insulin pumps with AID algorithms.1,2 It introduces several key advancements, including an enhanced automatic correction bolus (AB) module, more refined adaptive basal rate adjustments (auto-basal), and updated parameters governing exit criteria from automated mode.
In the MiniMed 780G system, an AB may be delivered every 5 minutes, provided the following conditions are met: (1) the maximum basal insulin rate has been reached, (2) the sensor glucose level exceeds 120 mg/dL, and (3) the calculated correction bolus amount, excluding insulin on board (IOB), exceeds 10% of the system’s maximum basal rate. The initial correction bolus (CBinit) is computed using the following formula:

where GS represents the sensor glucose level (mg/dL), ISF is the insulin sensitivity factor (mg/dL per unit), and IOB denotes the active insulin in circulation (units).1,2
Insulin on board is directly influenced by active insulin time (AIT), a modifiable parameter within the system. Consequently, the selected AIT setting significantly impacts both the frequency and magnitude of AB: a longer AIT results in prolonged IOB, thereby reducing CBinit. 3 Another modifiable parameter is the glucose target setting, which determines the glycemic threshold that the algorithm aims to achieve and maintain. Users can choose between 3 glucose target values: 100, 110, or 120 mg/dL. Lower glucose targets direct the algorithm toward achieving lower glycemic levels, potentially resulting in more frequent or larger correction boluses, whereas higher glucose targets are associated with higher intended glycemic targets.1-3
The system is notable for its user-friendly setup, with only 2 key adjustable parameters: glucose target and AIT. 4 A third modifiable setting, the insulin-to-carbohydrate (I/CHO) ratio, affects user-initiated (meal) boluses. Although it may indirectly influence algorithm behavior through its effects on postprandial glucose excursions and insulin-on-board, it is not expected to substantially affect the amount of insulin delivered automatically by the system as adaptive basal insulin. 5 Several studies in the literature have now demonstrated that the “optimal settings” for this system are a target set at 100 mg/dL and an AIT set at 2 hours.6-11 However, the relative contribution of glucose target versus AIT in shaping insulin delivery dynamics has not been clearly established. It is well acknowledged that AIT has a significant influence on ABs,6-11 which represent the key feature of this system compared with its predecessor, providing better hyperglycemia control. Nevertheless, how different AIT settings affect the amount of AB delivery remains unknown.
Within these premises, the present study extends previous findings by quantitatively evaluating the relationship between AIT settings and AB delivery in a real-world multicenter cohort. Therefore, the primary objective of this study was to assess how AB delivery varies in relation to different AIT and glucose target settings. We also assessed the impact of these settings on glycemic control by analyzing time in range (TIR70–180) values.
Patients and Methods
Ethical Approval
This multicenter study was carried out at 4 diabetes care facilities in Sicily, adhering to the ethical standards outlined in the Declaration of Helsinki. Approval was granted by the ethics committees of each participating institution, and all individuals provided written informed consent before being enrolled in the study.
Study Protocol
We conducted a retrospective analysis of insulin delivery and continuous glucose monitoring (CGM) data from the previous 30 days in a cohort of 287 consecutive patients with T1DM, including both adults (age >18 years, n = 234) and children/adolescents (age ≤18 years, n = 53). All patients were treated with the advanced hybrid closed-loop (AHCL) MiniMed 780G (Medtronic, Minneapolis, Minnesota), integrated with the Guardian 4 sensor. Inclusion criteria required participants to have used the system in closed-loop mode (SmartGuard) for a minimum of 6 months, with at least 80% of the total time spent in this mode.
From CGM reports, we extracted data on total daily insulin dose (TDD), total basal dose, total bolus dose, total manual bolus (MB) insulin, and AB insulin, in addition to standard glycemic outcome metrics. All modifiable system parameters influencing the algorithm were recorded, including glycemic target (100, 110, and 120 mg/dL) and AIT (hours). Additional clinical data collected included body weight, height, and body mass index (BMI, kg/m2). Since the study included both pediatric and adult participants, BMI values in pediatric subjects were interpreted descriptively and were not used for inferential analyses. Automatic correction boluses were expressed as a percentage of total boluses and of TDD and quantified in absolute terms (IU/kg/day). Participants were categorized according to their AIT settings into 3 groups: group 1 – AIT = 2 hours (n = 143; 49.8%), group 2 – AIT between 2 and 3 hours (n = 95; 33.1%), and group 3 – AIT ≥3 hours (n = 49; 17.1%). Similarly, they were classified based on glucose target settings as follows: group 1 – target = 100 mg/dL (n = 171; 59.6%), group 2 – target = 110 mg/dL (n = 71; 24.7%), and group 3 – target = 120 mg/dL (n = 45; 15.7%).
Statistical Analysis
Descriptive statistics were expressed as mean ± standard deviation (SD) for variables with a normal distribution and as median along with the interquartile range (IQR) for those not normally distributed. The Shapiro-Wilk test was used to assess data normality.
To compare differences in AB delivery and TIR70-180 values across groups, 1-way analysis of variance (ANOVA) was applied for normally distributed data, while the Kruskal-Wallis test was used for non-parametric comparisons. When significant differences were found, post hoc analysis was conducted using the Dunn test. The chi-squared test was employed to assess differences in the percentage of patients achieving a TIR70-180 >70% across AIT and glucose target groups. All statistical analyses were performed using MedCalc Software Ltd (Ostend, Belgium), version 19.6 (64-bit). A 2-sided P-value less than .05 was considered statistically significant.
Results
The mean age of the overall cohort was 36.3 ± 17.2 years, with an average body weight of 69.2 ± 17.1 kg and a mean BMI of 25.0 ± 4.8 kg/m²; however, these anthropometric values should be interpreted descriptively given the inclusion of both pediatric and adult participants. The cohort consisted of 138 females (48.1%) and 149 males (51.9%). The mean duration of T1DM was 21.7 ± 12.3 years, and participants had been using AHCL systems for an average of 25.5 ± 11.3 months.
Both pediatric and adult groups exceeded the recommended target for TIR (≥70%), with 69.2% of pediatric and 75.5% of adult participants achieving or surpassing this threshold. The percentage of time above range (TAR>180) remained below 25%, and time below range (TBR<70) was under 4% in both groups, indicating overall favorable glycemic control.
The mean insulin requirement delivered as ABs was 0.14 ± 0.09 U/kg/day, accounting for 33.1% of total bolus insulin (AB plus MB) and 18.3% of the TDD.
Significant differences in AB delivery were observed across the AIT groups. Patients in group 1 (AIT = 2 h) had a significantly higher percentage of ABs relative to TDD compared to both groups 2 and 3 (21.8% [16.4, 25.6] vs. 17.0% [13.8, 20.4] and 14.9% [10.6, 18.9], respectively; P < .0001 for both comparisons). The difference between groups 2 and 3 did not reach statistical significance (P = .39).
A similar trend was observed when AB was expressed as a percentage of total bolus dose: group 1 showed significantly higher values compared to both groups 2 and 3 (35.9% [26.5, 44.5] vs 29.6% [22.5, 36.9] and 28.2% [18.3, 37.9], respectively; P = .009 and P = .004). No significant difference was found between groups 2 and 3 (P = 1.0).
When expressed in insulin units per kilogram per day, patients with an AIT setting of 2 hours exhibited significantly higher AB delivery compared with both groups 2 and 3 (0.17 IU/kg/day [0.10, 0.24] vs 0.10 IU/kg/day [0.08, 0.13] and 0.08 IU/kg/day [0.05, 0.11], respectively; P < .0001 for both comparisons).
These findings suggest that setting AIT to 2 h leads the system to deliver substantially more insulin through ABs compared with longer AIT settings. In practical terms, patients using AIT = 2 h received a median of 0.17 U/kg/day as ABs, compared with 0.10 and 0.08 U/kg/day in the intermediate and longer AIT groups, respectively. For example, in a patient weighing 70 kg, this would correspond to approximately 12 U/day delivered as ABs with AIT = 2 hours vs about 7 U/day and 6 U/day with longer AIT settings. This indicates that shorter AIT settings promote a more aggressive and responsive insulin delivery profile, with a larger proportion of total insulin being administered as automated correction boluses.
In addition, the AIT of group 2 showed significantly higher values than the AIT of group 3 (P = .027) (Figure 1).
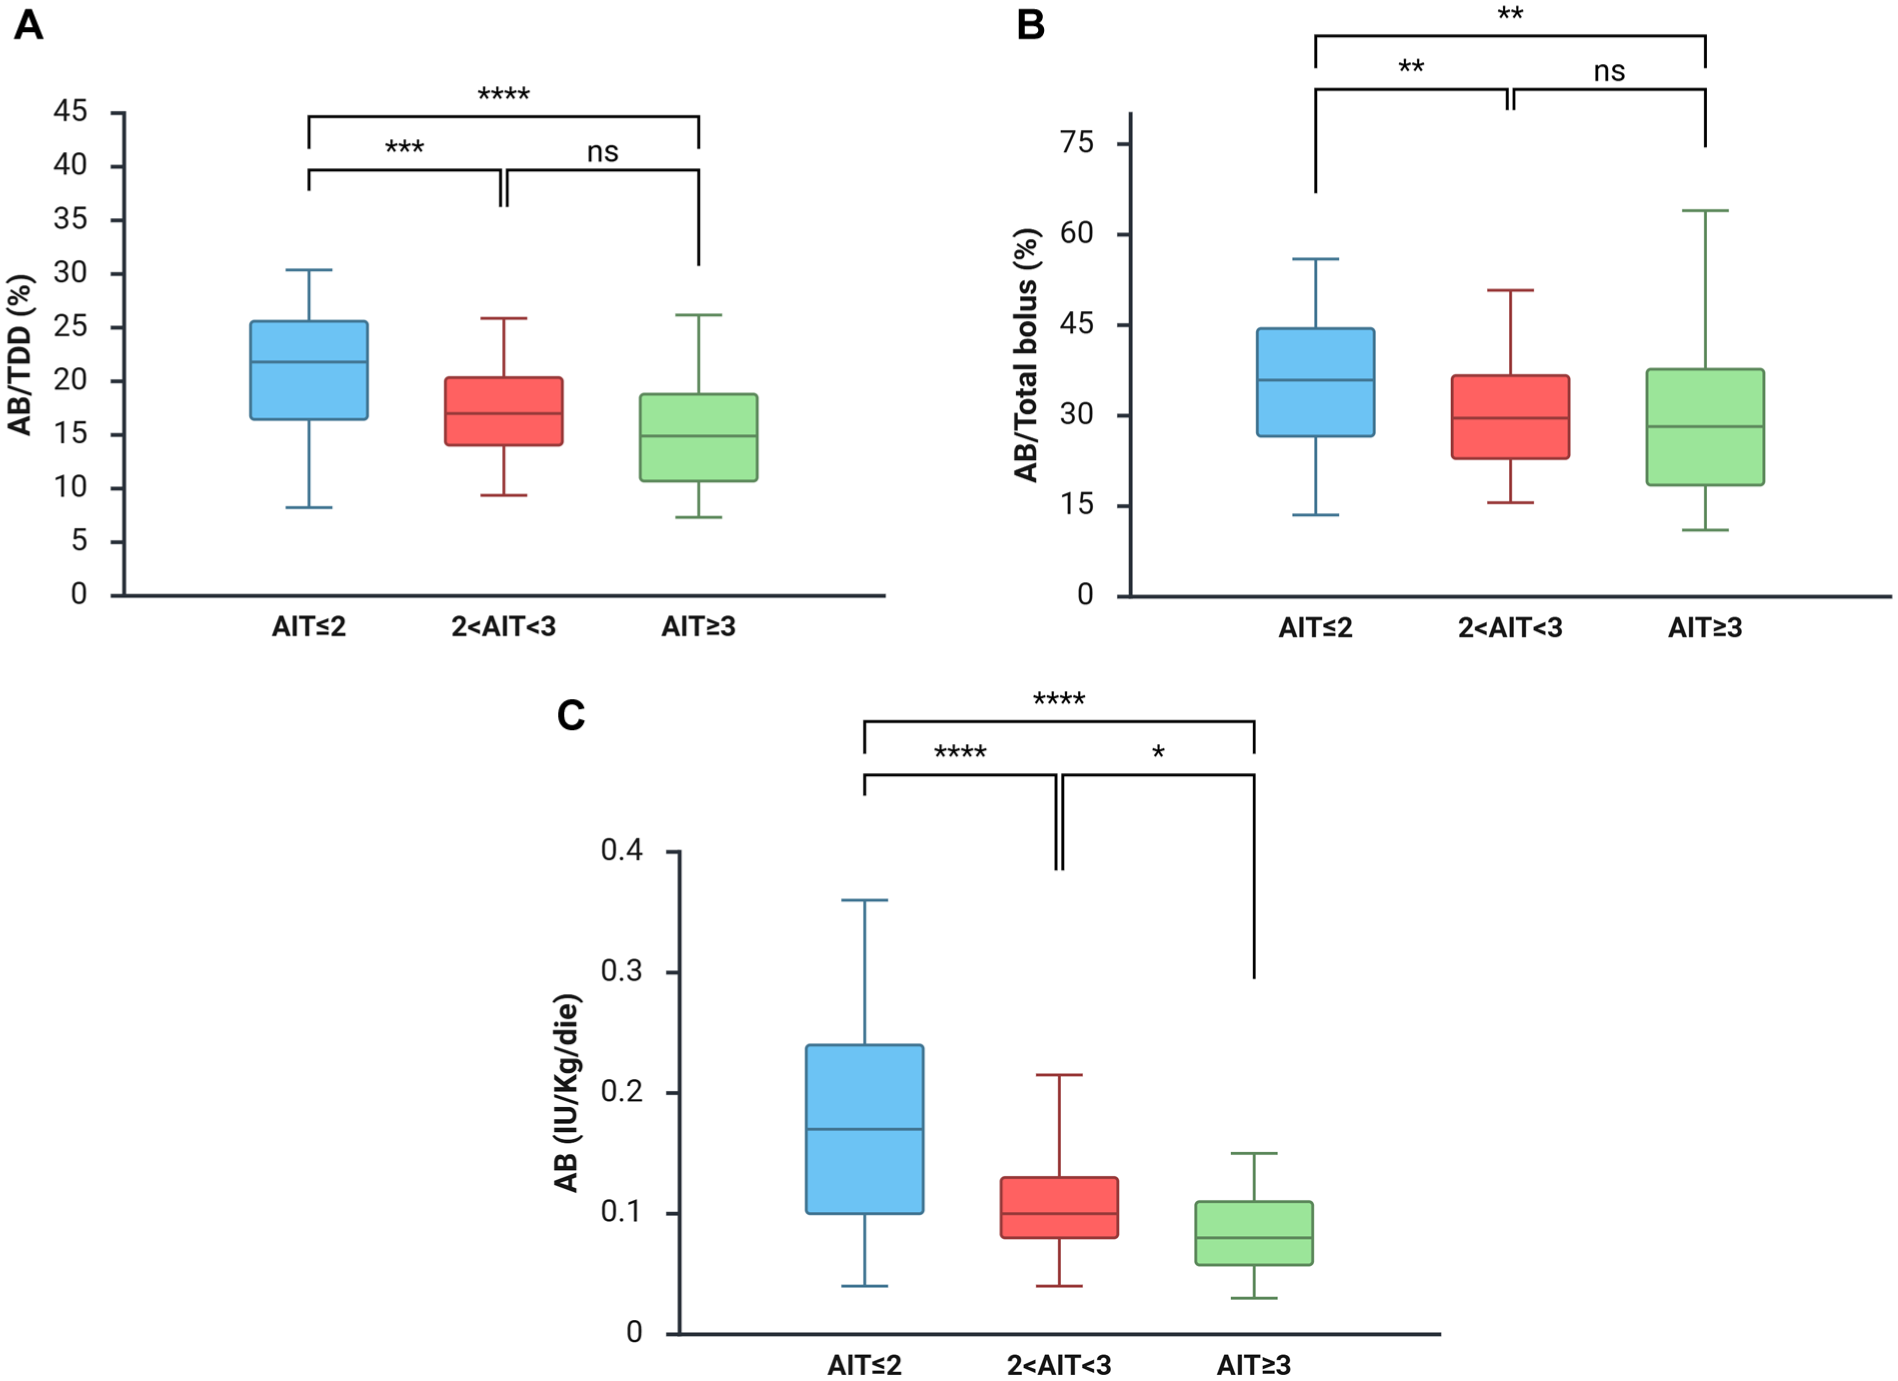
Automatic correction bolus (AB) stratified to active insulin time (AIT) groups.
Compared to both groups 2 and 3, patients of group 1 (AIT = 2 h) showed absolute increases in AB delivery of 3.6% and 5.5% of TDD, 4.1% and 5.3% of total bolus dose, and 0.067 and 0.095 U/kg/day, respectively. In contrast, variations in glucose target settings (100, 110, or 120 mg/dL) did not result in statistically significant differences in the amount of ABs delivered.
Furthermore, AIT settings were found to influence TIR70-180, with groups having AIT ≤2 and between 2 and 3 demonstrating higher TIR70-180 values compared to the group with AIT ≥3, as well as TBR54-69, with higher values found in the AIT ≤2 vs the AIT ≥3 group. However, the number of patients with TBR54-69>4% was not significantly different within the 2 groups (9.0% vs 2.1%; P = .11).
In contrast, variations in glucose target settings (100, 110, and 120 mg/dL) did not result in significant improvements in TIR (Table 1). Finally, the percentage of patients achieving TIR70-180 >70% did not differ significantly across AIT (P = .303) or glucose target groups (P = .355).
TIR and TBR across active insulin time (AIT) and glucose target groups.
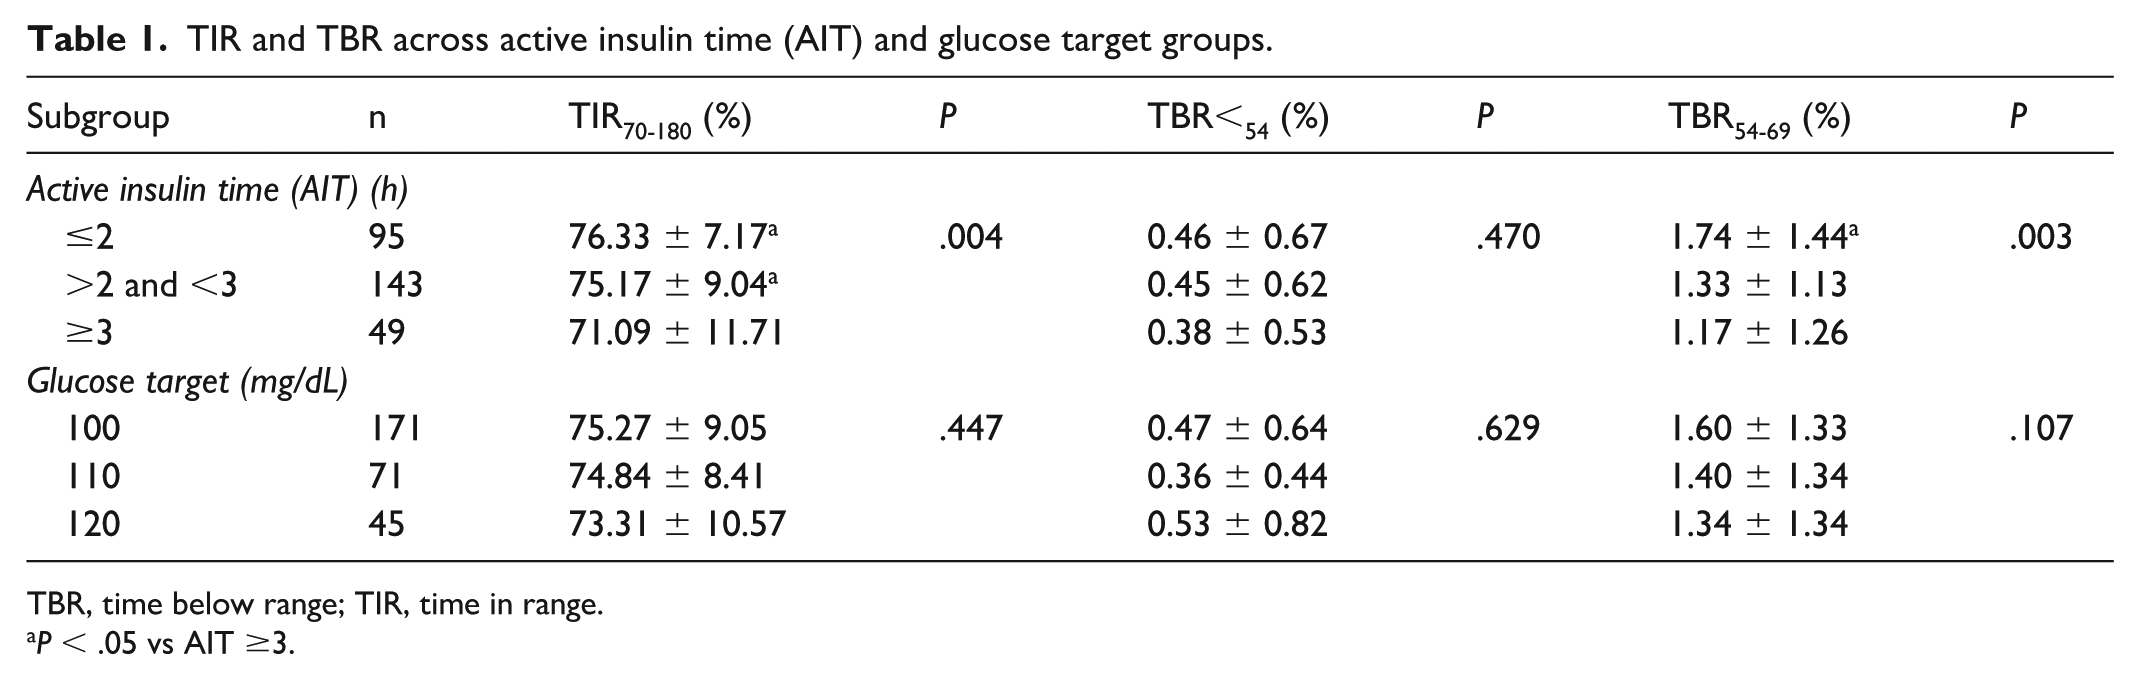
TBR, time below range; TIR, time in range.
P < .05 vs AIT ≥3.
Discussion
In this study, we investigated the impact of different AIT and glucose target settings on insulin delivery patterns and glycemic control in a large cohort of patients using AHCL systems. Our findings demonstrate that AIT is a key modifiable parameter that significantly affects both the frequency and magnitude of AB delivery, as well as glycemic outcomes. In contrast, adjustments to glucose target settings (100, 110, or 120 mg/dL) were not associated with meaningful differences in insulin delivery or glycemic metrics.
Patients with an AIT setting of 2 hours consistently exhibited higher AB delivery across all metrics – as a percentage of TDD, of total bolus insulin, and in absolute units (U/kg/day). The observed differences were clinically relevant, with absolute increases of up to 5.5% of TDD and nearly 0.1 U/kg/day in patients using the shortest AIT setting. These findings suggest that shorter AIT settings are associated with more frequent and greater AB delivery.
In contrast, variations in glucose target settings (100, 110, or 120 mg/dL) were not significantly associated with differences in AB delivery or TIR in our cohort. These findings differ from previous clinical trials and real-world studies reporting improved glycemic outcomes with lower glucose targets.5-10 This discrepancy may reflect the retrospective cross-sectional design of the present study, the specific characteristics of our real-world cohort, differences in user behaviors, or the relatively high overall glycemic performance observed across groups. Therefore, our results should not be interpreted as evidence that glucose target settings lack clinical relevance, but rather that, within our cohort, their association with glycemic outcomes appeared less pronounced than that observed for AIT settings. Glucose targets remain important tools for individualizing therapy according to patient characteristics and clinical needs.
From a clinical perspective, these findings highlight the pivotal role of AIT in tailoring AHCL therapy. Shorter AIT settings were associated with increased frequency and magnitude of AB delivery and with improved glycemic outcomes. However, this greater algorithmic aggressiveness may result in increased total insulin delivery, reflecting a more responsive adaptation of the system to insulin requirements rather than an inherently detrimental effect. Importantly, even in the group using the shortest AIT setting (2 h), which exhibited the highest AB delivery, both TBR<70 and TBR<54 remained consistently within the consensus-recommended targets, suggesting that the increased corrective insulin delivery did not compromise safety or lead to an excess risk of hypoglycemia (see Table 1).
Our findings are consistent with previous reports supporting the clinical relevance of AIT settings in the performance of the MiniMed 780G system. Previous real-world studies have shown that shorter AIT settings, including 2-hour AIT, are associated with improved TIR compared with longer AIT settings. 6 The present study extends existing evidence by providing quantitative estimates of the relationship between AIT settings and AB delivery across distinct AIT ranges within the same real-world population. Although our findings suggest that AIT settings may have a stronger association with AB delivery and glycemic outcomes than glucose target settings, these results should be interpreted cautiously given the discrepancy with previous literature. Prospective studies specifically designed to compare glucose target strategies are needed to better clarify their relative contribution to glycemic outcomes. In this context, it is noteworthy that previous evidence suggests that meal frequency may not substantially influence AB delivery, 5 although meal bolus behaviors and carbohydrate management strategies may still represent important confounding factors that were not specifically adjusted for in the present analysis.
Strengths of this study benefit from a relatively large sample size, the inclusion of both pediatric and adult patients, and the use of real-world data. However, several limitations should be acknowledged. The retrospective design precludes causal inference, and the analysis did not include detailed stratification by age group or baseline glycemic control. In addition, the study lacked long-term follow-up data to assess clinical outcomes beyond the 30-day evaluation period. Future prospective studies are warranted to explore whether the increased AB delivery associated with shorter AIT settings translates into meaningful clinical benefits, such as improved quality of life, reduced fear of hypoglycemia, or long-term metabolic improvements. Also, because the cohort included both pediatric and adult participants, anthropometric variables were reported descriptively, and pediatric BMI standard deviation scores were not available. Notably, during the relatively stable 30-day observation period, major changes in SmartGuard adaptive parameters or pump settings were considered unlikely, as algorithm-driven ISF adaptations are generally limited in the absence of significant intercurrent events and core therapeutic parameters are routinely adjusted only by the referring physician during scheduled follow-up visits.
In summary, among the modifiable parameters of the MiniMed 780G system, AIT appears to exert the greatest influence on both AB delivery and glycemic outcomes. In our cohort, an AIT setting of 2 hours was associated with improved glycemic outcomes without increased hypoglycemia risk, suggesting that it may represent the preferred setting. In our cohort, glucose target settings were not significantly associated with glycemic metrics. These findings support prioritizing AIT optimization to enhance the clinical performance of AHCL therapy while maintaining individualized treatment approaches when clinically indicated.
Footnotes
Abbreviations
AB, automatic correction bolus; AHCL, advanced hybrid closed-loop; AID, automated insulin delivery; AIT, active insulin time; ANOVA, analysis of variance; BMI, body mass index; CBinit, initial correction bolus; CGM, continuous glucose monitoring; GS, sensor glucose; I/CHO, insulin-to-carbohydrate ratio; IOB, insulin on board; IQR, interquartile range; ISF, insulin sensitivity factor; MB, manual bolus; SD, standard deviation; TAR, time above range; TBR, time below range; TDD, total daily insulin dose; TIR, time in range; T1DM, type 1 diabetes mellitus; U/kg/day, units per kilogram per day.

Funding
The authors received no financial support for the research, authorship, and/or publication of this article.
Declaration of Conflicting Interests
The authors declared no potential conflicts of interest with respect to the research, authorship, and/or publication of this article.
Data Availability Statement
Data will be made available upon request.