
Abstract
Epithelial ovarian cancer (EOC) cells are under intrinsic oxidative stress, which alters metabolic activity and reduces apoptosis. Key oxidative stress enzymes, including myeloperoxidase (MPO) and inducible nitric oxide synthase (iNOS), are upregulated and colocalized in EOC cells. Oxidative stress is also regulated, in part, by superoxide dismutase (SOD) and hypoxia-inducible factor (HIF) 1a. Dichloroacetate (DCA) converts anaerobic to aerobic metabolism and thus was utilized to determine the effects on apoptosis, iNOS, MPO, extracellular SOD (SOD-3), and HIF-1
Introduction
Ovarian cancer is the leading cause of death from gynecologic malignancies, yet the underlying pathophysiology is not clearly established. 1 The 5-year survival for patients with ovarian cancer has substantially improved due to advancements in surgical debulking and subsequent treatments with a combination of cytotoxic drugs; nonetheless, the overall cure rate remains approximately 30%. Clinical and epidemiological investigations have provided evidence supporting the role of reactive oxygen species (ROS) and reactive nitrogen species (RNS), collectively known as oxidative stress, in the etiology of cancer due to exogenous factors, including chronic inflammation.2,3 Oxidative stress plays an important role in the pathogenesis of ovarian cancer and is mediated by cross-talk between the tumor cells and the surrounding cellular stroma, which might influence phenotypic alterations in the tumor.4–6
Evidence from several studies has also suggested that cancer cells, as compared to normal cells, are under increased oxidative stress associated with oncogenic transformation, alterations in metabolic activity, and increased generation of ROS species including superoxide (O2•-), hydrogen peroxide (H2O2), and the hydroxyl radical.7,8 Enhanced ROS generation in cancer cells leads to increased accumulation of ROS-mediated reaction products, and their subsequent detection in the plasma and urine. 9 This increase in ROS may have significant consequences, such as stimulation of cellular proliferation, promotion of mutations and genetic instability, and alterations in cellular sensitivity to anticancer agents.8,9 A complex system of enzymatic antioxidants including superoxide dismutase (SOD), glutathione peroxidase, glutathione reductase, catalase, and nonenzymatic antioxidants such as glutathione, vitamins C, D, and E, lycopene, and omega 3 fatty acids are utilized to protect against these harmful pro-oxidants. 10 Moreover, extracellular SOD (SOD-3) is part of the SOD family and serves as a potent scavenger of O2•-. 11
Persistence of the oxidative stress state leads to mitochondrial dysfunction, preventing mitochondria-based glucose oxidation, an effect first observed by Warburg (ie, the Warburg effect). 12 Additionally, cancer cells are known to favor anaerobic metabolism despite the fact that oxygen is present. 13 Numerous agents that can interfere with redox cell signaling pathways have been identified.10,14–16 Specifically, dichloroacetate (DCA) has been shown to stimulate pyruvate dehydrogenase (PDH) enzymes in the metabolic pathway through the inhibition of pyruvate dehydrogenase kinases (PDK).12,17 Pyruvate dehydrogenase enzymes are essential in the glycolytic pathway for synthesizing pyruvate, which is subsequently used in the Kreb’s cycle to make acetyl-CoA. Also, through the inhibition of PDK in the pathway, DCA in return causes a decrease in both lactate formation and increase in lactate consumption in the body, leading to the oxidation process in the mitochondria. Therefore, DCA can be utilized to minimize the cellular response to hypoxia by forcing cells to undergo oxidative phosphorylation rather than glycolysis for obtaining energy. In this study, we have collected evidence that DCA can significantly induce apoptosis of epithelial ovarian cancer (EOC) cells by modulation of redundant pathways which contribute to the regulation of the redox status of the cells.
Materials and Methods
Culture of Human EOC Cell Lines
Human EOC cell lines, MDAH-2774 and SKOV-3, were obtained from American Type Culture Collection (ATCC, Manassas, Virginia). Cell lines were cultured in 75 cm2 cell culture flasks (Corning Incorporated, Corning, New York) with McCoy’s 5A medium (Invitrogen, Carlsbad, California) supplemented with 100 U/mL penicillin and 100 μg/mL streptomycin including 10% heat-inactivated fetal bovine serum (FBS) at 37°C in 5% CO2. Culture medium was replaced every 2 days.
Treatment of Human EOC Cells
For each experiment, cells were plated in 100 cm2 culture dishes at a density of approximately 5 × 10⁶ cells per dish. Cell cultures were treated with increasing doses of DCA (0, 20, 40, and 80 μg/mL; Sigma-Aldrich, St Louis, Missouri) for 24 hours. The doses of DCA were chosen based on our previously published studies.18,19 All experiments were performed in triplicate.
Real-Time Reverse Transcriptase-Polymerase Chain Reaction for Hypoxia-Inducible Factor 1a, Inducible Nitric Oxide Synthase, Myeloperoxidase, and SOD-3
RNA isolation
Total RNA was extracted from both SKOV-3 and MDAH-2774 cells using an RNeasy Mini kit (QIAGEN, Valencia, California), according to the protocol provided by the manufacturer
Reverse transcription
A 20-μL complementary DNA (cDNA) reaction volume was prepared with the use of QuantiTect Reverse Transcription kit (QIAGEN) according to the protocol provided by the manufacturer.
Real-time RT-PCR analysis
Real-time reverse transcriptase-polymerase chain reaction (RT-PCR) was performed with a QuantiTect SYBR Green RT-PCR kit (QIAGEN) and a Cepheid 1.2f Detection System (Cepheid, Sunnyvale, California). Each 25 μL reaction included 12.5 μL of 2× QuantiTect SYBR Green RT-PCR master mixes, 1 μL of cDNA template, and 0.2 μmol/L each of target-specific primer was selected with the aid of the software program, Beacon Designer (Premier Biosoft Int., Palo Alto, California). Human oligonucleotide primers (Hypoxia-Inducible Factor 1a [HIF-1a], inducible nitric oxide synthase [iNOS], myeloperoxidase [MPO], and SOD-3) which amplify variable portions of the protein coding regions are as follows: HIF-1a, which amplifies a 100 bp region, sense 5′-AGCCGAGGAAGAACTATGAAC-3′ and antisense 5′-ACTGAGGTTGGTTACTGTTGG-3′; iNOS, which amplifies a 145 bp region, sense 5′-GGCACAGAACTTAAGGATGG-3′ and antisense 5′-TTGTTAGGAGGTCAAGTAAAGG-3′; MPO which amplifies a 146 bp region, sense 5′-TGTGCTGATGAGAATACTGAG-3′ and antisense 5′-TTGTTTAAGGAGGGTAATTTGC-3′; and SOD-3, which amplifies a 78 bp region, sense 5′-GCCTCCATTTGTACCGAAAC-3′ and antisense 5′-AGGGTCTGGGTGGAAAGG-3′. Standards with known concentrations were designed specifically for HIF-1a (111 bp), iNOS (103 bp), MPO (110 bp), and SOD-3 (99 bp) using the Beacon Designer software, allowing for the construction of a standard curve using a 10-fold dilution series. A specific standard for each gene allows for absolute quantification of the gene in copy numbers, which can then be expressed per milligram of RNA.
The PCR reaction conditions for HIF-1a, iNOS, MPO, and SOD-3 were programmed as follows: an initial cycle was performed at 95°C for 900, 1200, 1000, and 850 seconds for HIF-1a, iNOS, MPO, and SOD-3, respectively. Next, there were 35 cycles of denaturation at 95°C for 15 seconds, annealing for 30 seconds at 60°C, 55°C, 56°C, and 60°C for HIF-1a, iNOS, MPO, and SOD-3, respectively, followed by a final cycle at 72°C for 30 seconds to allow the completion of product synthesis. Following real-time RT-PCR, a melting curve analysis was performed to demonstrate the specificity of the PCR product as a single peak. A control, which contained all the reaction components except for the template, was included in all experiments.
Detection of NO Levels
The nitrate/nitrite colorimetric assay (Griess assay) was used to measure the levels of stable NO by-products in EOC cells lines, MDAH-2774 and SKOV-3, before and after treatment with increasing concentrations of DCA. Nitrate is a stable oxidation product of NO, and its measurement serves as a convenient assay for NO production. Culture media was analyzed for NO using nitrate/nitrite colorimetric assay kit (Cayman Chemical, Ann Arbor, Michigan) per the manufacturer’s protocol. Nitrate/nitrite was determined at 540 nm using a microplate reader, and the concentration was calculated using nitrate standards.
Myeloperoxidase Activity Assay
Myeloperoxidase activity was measured in cell lysate obtained from EOC cell lines, MDAH-2774 and SKOV-3, before and after treatment with increasing concentrations of DCA using the NWLSS Myeloperoxidase Activity Assay kit (Northwest Life Science Specialties, Vancouver, Washington). Total cell lysates were prepared by treating cell pellets with a protein extraction reagent provided in the kit. Protein concentration of cell lysates was measured with the Pierce BCA Protein Assay kit (Thermofisher Scientific, Rockford, Illinois) per the manufacturer’s protocol. The same concentration of protein was utilized for each sample. Hypochlorous acid (HOCl) is formed from the MPO catalyzed reaction between chloride and hydrogen peroxide. Hypochlorous acid is rapidly trapped by β-amino acid taurine to form a stable oxidant taurine chloramine. Taurine prevents accumulation of HOCl that could deactivate MPO and does not react with the MPO enzyme intermediate to interfere with MPO catalysis. After incubation for a specific time, the MPO catalyzed reaction was stopped by adding catalase to eliminate H2O2. Taurine chloramine thus formed was then allowed to react with 5-thio-2-nitrobenzoic acid (TNB). 5-Thio-2-nitrobenzoic acid has a chromophore that has maximal absorbance at 412 nm, while its reaction product with taurine chloramine, 5-5′-dithiobis (2-nitrobenzoic acid) or DTNB is colorless. Myeloperoxidase activity was measured by following the decrease in absorbance at 412 nm.
Detection of iNOS and SOD-3 Protein Levels
Analysis of the effects of DCA on the expression of iNOS and SOD-3 utilized IP/Western blot was previously described and included the following changes. 20 Cells were lysed with lysis buffer and cleared by centrifugation (10 minutes at 1000g, 4°C). Protein concentration was determined with the Pierce BCA Protein Assay kit (Thermofisher Scientific) as described by the manufacturer’s protocol, and the same concentration of protein was utilized for each sample. Precleared cell lysates were incubated with either anti-SOD-3 antibody or anti-iNOS antibody (Santa Cruz Biotechnology, Santa Cruz, California) for 1 hour at 4°C, followed by precipitation with 20 mL of Protein A/G PLUS-Agarose (Santa Cruz Biotechnology) and incubated at 4°C overnight. Adherent proteins were eluted with 1× protein loading buffer for 5 minutes at 80°C and analyzed by a Western blot detection kit (Visualizer, Millipore Corp, Temecula, California). Bands for iNOS and SOD-3 were scanned and analyzed by National Institutes of Health (NIH) image 3.0.
Caspase 3 Activity Assay
Chemicon’s Caspase 3 Colorimetric Activity Assay kit (Chemicon International, Temecula, California) was used and provides a simple and convenient means for assaying the activity of caspases that recognize the sequence DEVD. The assay is based on spectophotometric detection of the chromophore p-nitroaniline (pNA) after cleavage from the labeled substrate DEVD-pNA. The free pNA can be quantified using a spectrophotometer or a microtiter plate reader at 405 nm. Comparison of the absorbance of pNA from an apoptotic sample with an uninduced control allows the determination of the fold increase in caspase 3 activity.
Cells (2 × 10⁶) were harvested and lysed in 300 mL of cell lysis buffer included with the kit, and concentrations were equalized for each sample set. Subsequently, 150 μg of cell lysate was combined with substrate reaction buffer containing 30 μg of caspase 3 substrate, acetyl-DEVD-p-nitroaniline (Ac-DEVD-pNA). This mixture was incubated for 1 hour at 37°C, and then absorbance was measured with a plate reader (Ultramark, Bio-Rad, Hercules, California) by detection of the chromophore pNA after cleavage from the labeled substrate DEVD-pNA. Background reading from cell buffers and substrate was subtracted from the readings of samples before calculating the increase in caspase 3 activity.
Measurement of Apoptosis by TUNEL Assay
Apoptosis of EOC cell lines, MDAH-2774 and SKOV-3, before and after treatment with increasing concentrations of DCA was assessed using the in situ terminal deoxynucleotidyl transferase-mediated dUTP-biotin nick end labeling (TUNEL) technique as described by the DeadEnd Fluorometric TUNEL System (Promega, Madison, Wisconsin). The TUNEL system detects the fragmented DNA of apoptotic cells by incorporating fluorescein-12-dUTP at the 3′-OH ends of the DNA using the enzyme terminal deoxynucleotidyl transferase, which forms a polymeric tail. Briefly, the cells were fixed with 4% paraformaldehyde in phosphate-buffered saline (PBS) for 20 minutes at 4°C and subjected to permeabilization for 5 minutes at room temperature with 0.2% Triton X-100. Positive controls were performed by treating cells with DNase I (1 mg/mL) in Terminal Deoxynucleotidyl Transferase (TdT) buffer for 10 minutes at room temperature before incubation with a biotinylated nucleotide. Cells were labeled with the TUNEL reaction mixture for 60 minutes at 37°C. Apoptotic cells were visualized using an Axiovert 25 inverted microscope (Zeiss, Thornwood, NY, USA) using a fluorescein isothiocyanate ([FITC] green) fluorescent filter with excitation and emission wavelengths of 470 and 525 nm, respectively. Images were taken using the Axiovision software (Zeiss) and a microscope-mounted camera.
Statistical Analysis
Data were analyzed using SPSS 19.0 for windows. Data were analyzed using 1-way analysis of variance (ANOVA) with Student Neuman-Kuels post hoc comparisons. Significant values of P < .05 were considered statistically significant for all analyses.
Results
Treatment With DCA Decreased iNOS Expression in EOC Cells
Treatment with DCA decreased iNOS messenger RNA (mRNA) levels, in SKOV-3 cells, in a dose-dependent manner, from 383.0 μg/μg RNA to 279.6, 211.6, and 153.0 ng/μg RNA at the 20, 40, and 80 μg/mL DCA doses, respectively (P < .05; Figure 1A). In MDAH-2774 cells, there was a reduction in iNOS mRNA levels from 262.2 ng/μg RNA to 245.2, 180.6, and 139.5 ng/μg RNA at the 20, 40, and 80 μg/mL DCA doses, respectively (P < .05; Figure 1A).
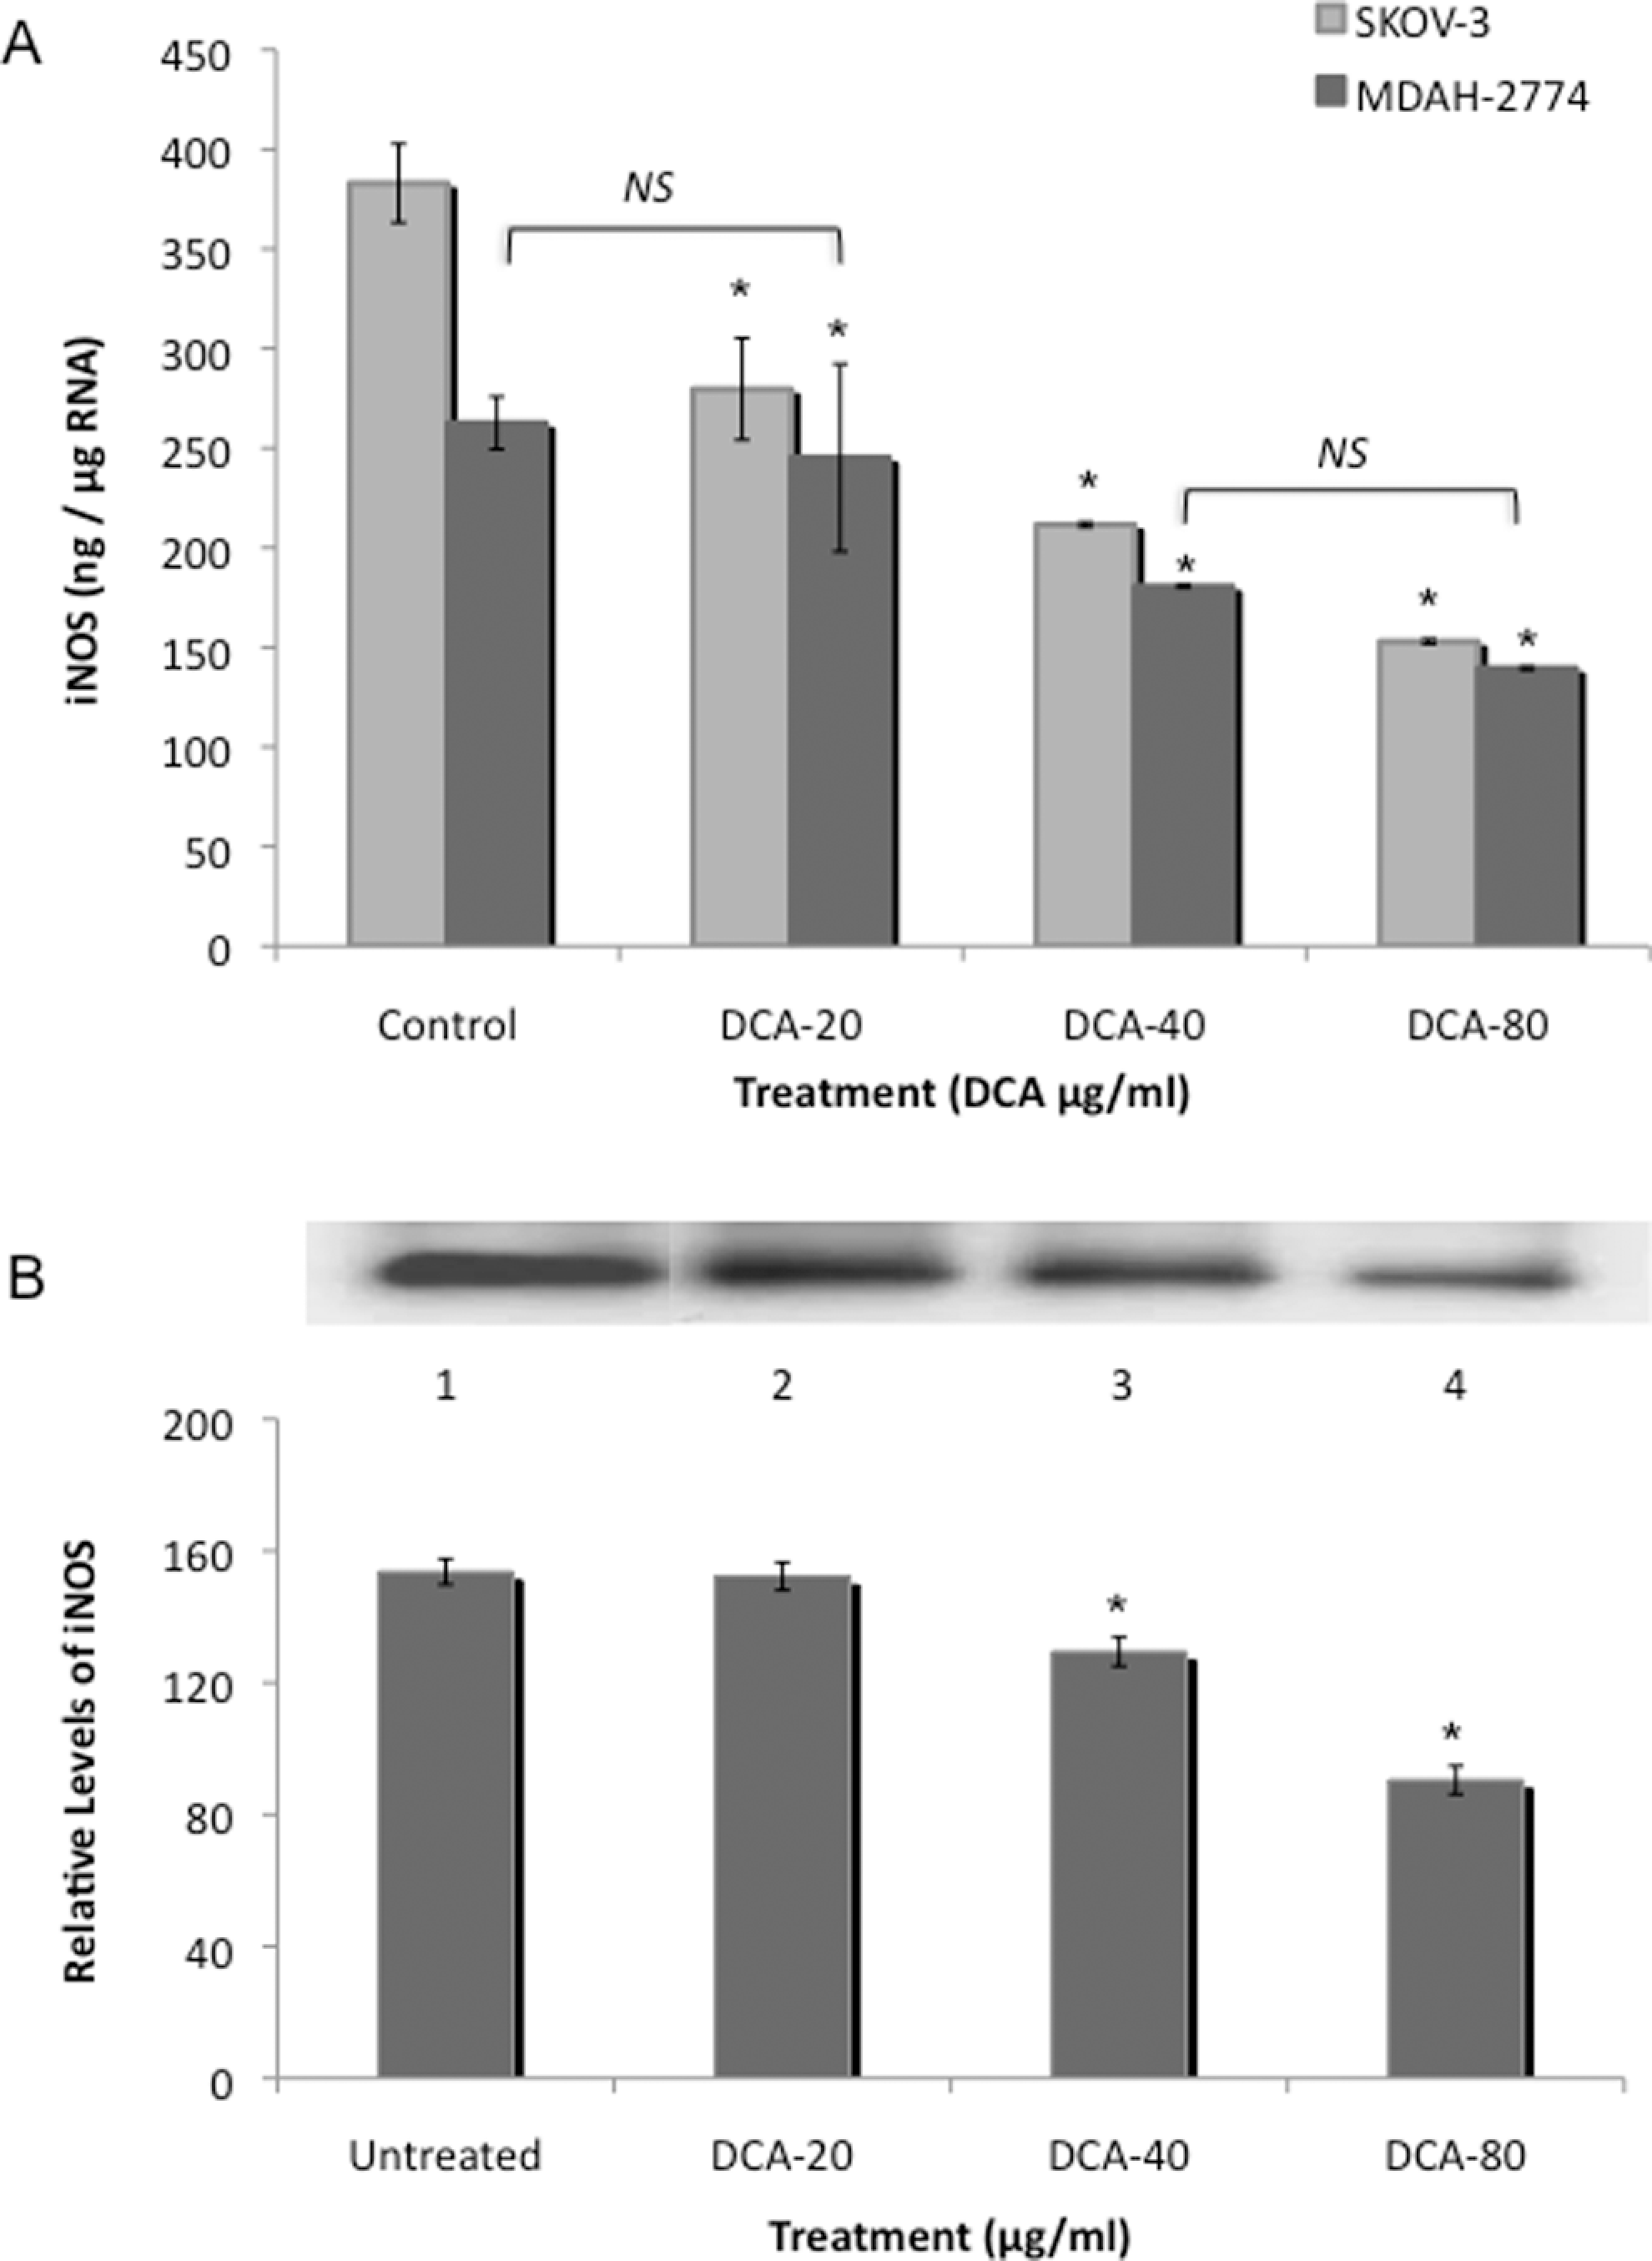
Inducible nitric oxide synthase (iNOS) expression in EOC cells. Two human EOC cell lines, SKOV-3 and MDAH-2774, were treated with increasing doses of DCA (0, 20, 40, and 80 μg/mL) for 24 hours. A, Real-time RT-PCR for iNOS was utilized using RNA from SKOV-3 and MDAH-2774. B, Immunoprecipitation/Western blot was utilized for the detection of iNOS in cell lysates from MDAH-2774 and were precipitated with anti-iNOS antibody and fractionated with SDS-PAGE. Membrane was probed with anti-iNOS antibody. Immunoprecipitation of iNOS, exposed to iNOS antibody, is as follows, Lane 1, control; Lane 2, 20 μg/mL DCA; Lane 3, 40 μg/mL DCA; and Lane 4, 80 μg/mL DCA. Immunoprecipitation/Western blot results were scanned and analyzed by NIH image J 3.0. All experiments were performed in triplicate. Asterisk indicates P < .05; NS, no significance; EOC, epithelial ovarian cancer; DCA, dichloroacetate; RT-PCR, reverse transcriptase-polymerase chain reaction; SDS-PAGE, sodium dodecyl sulfate polyacrylamide gel electrophoresis.
Immunoprecipitation/Western blot was utilized to confirm iNOS protein levels in DCA-treated MDAH-2774 EOC cells. Results are expressed as relative levels as compared to their control. Treatment with DCA resulted in a significant reduction in iNOS protein levels from 153.7 to 129.4 and 90.50 in the 40 and 80 μg/mL DCA doses, respectively, in MDAH-2774 EOC cells (P < .05; Figure 1B). There was no significant difference in iNOS observed at the 20 μg/mL DCA dose. Similar results were obtained for SKOV-3 cells (data not shown).
Treatment With DCA Decreased NO Levels in EOC Cells
Baseline levels of nitrate/nitrite were significantly higher in untreated EOC cells. Treatment with DCA decreased the levels of nitrate/nitrite, in SKOV-3 cells from 1.45 to 0.560 μmol/L and 0.304 μmol/L at the 40 and 80 μg/mL DCA doses, respectively (P < .05; Figure 2). There was no statistical difference in iNOS observed at the 20 μg/mL DCA dose. Treatment with DCA also decreased levels of nitrate/nitrite, in MDAH-2774 cells, from 1.02 to 0.634 μmol/L and 0.311 μmol/L at the 40 and 80 μg/mL DCA doses, respectively (P < .05; Figure 2). There was also no statistical difference in iNOS observed in the 20 μg/mL DCA dose.
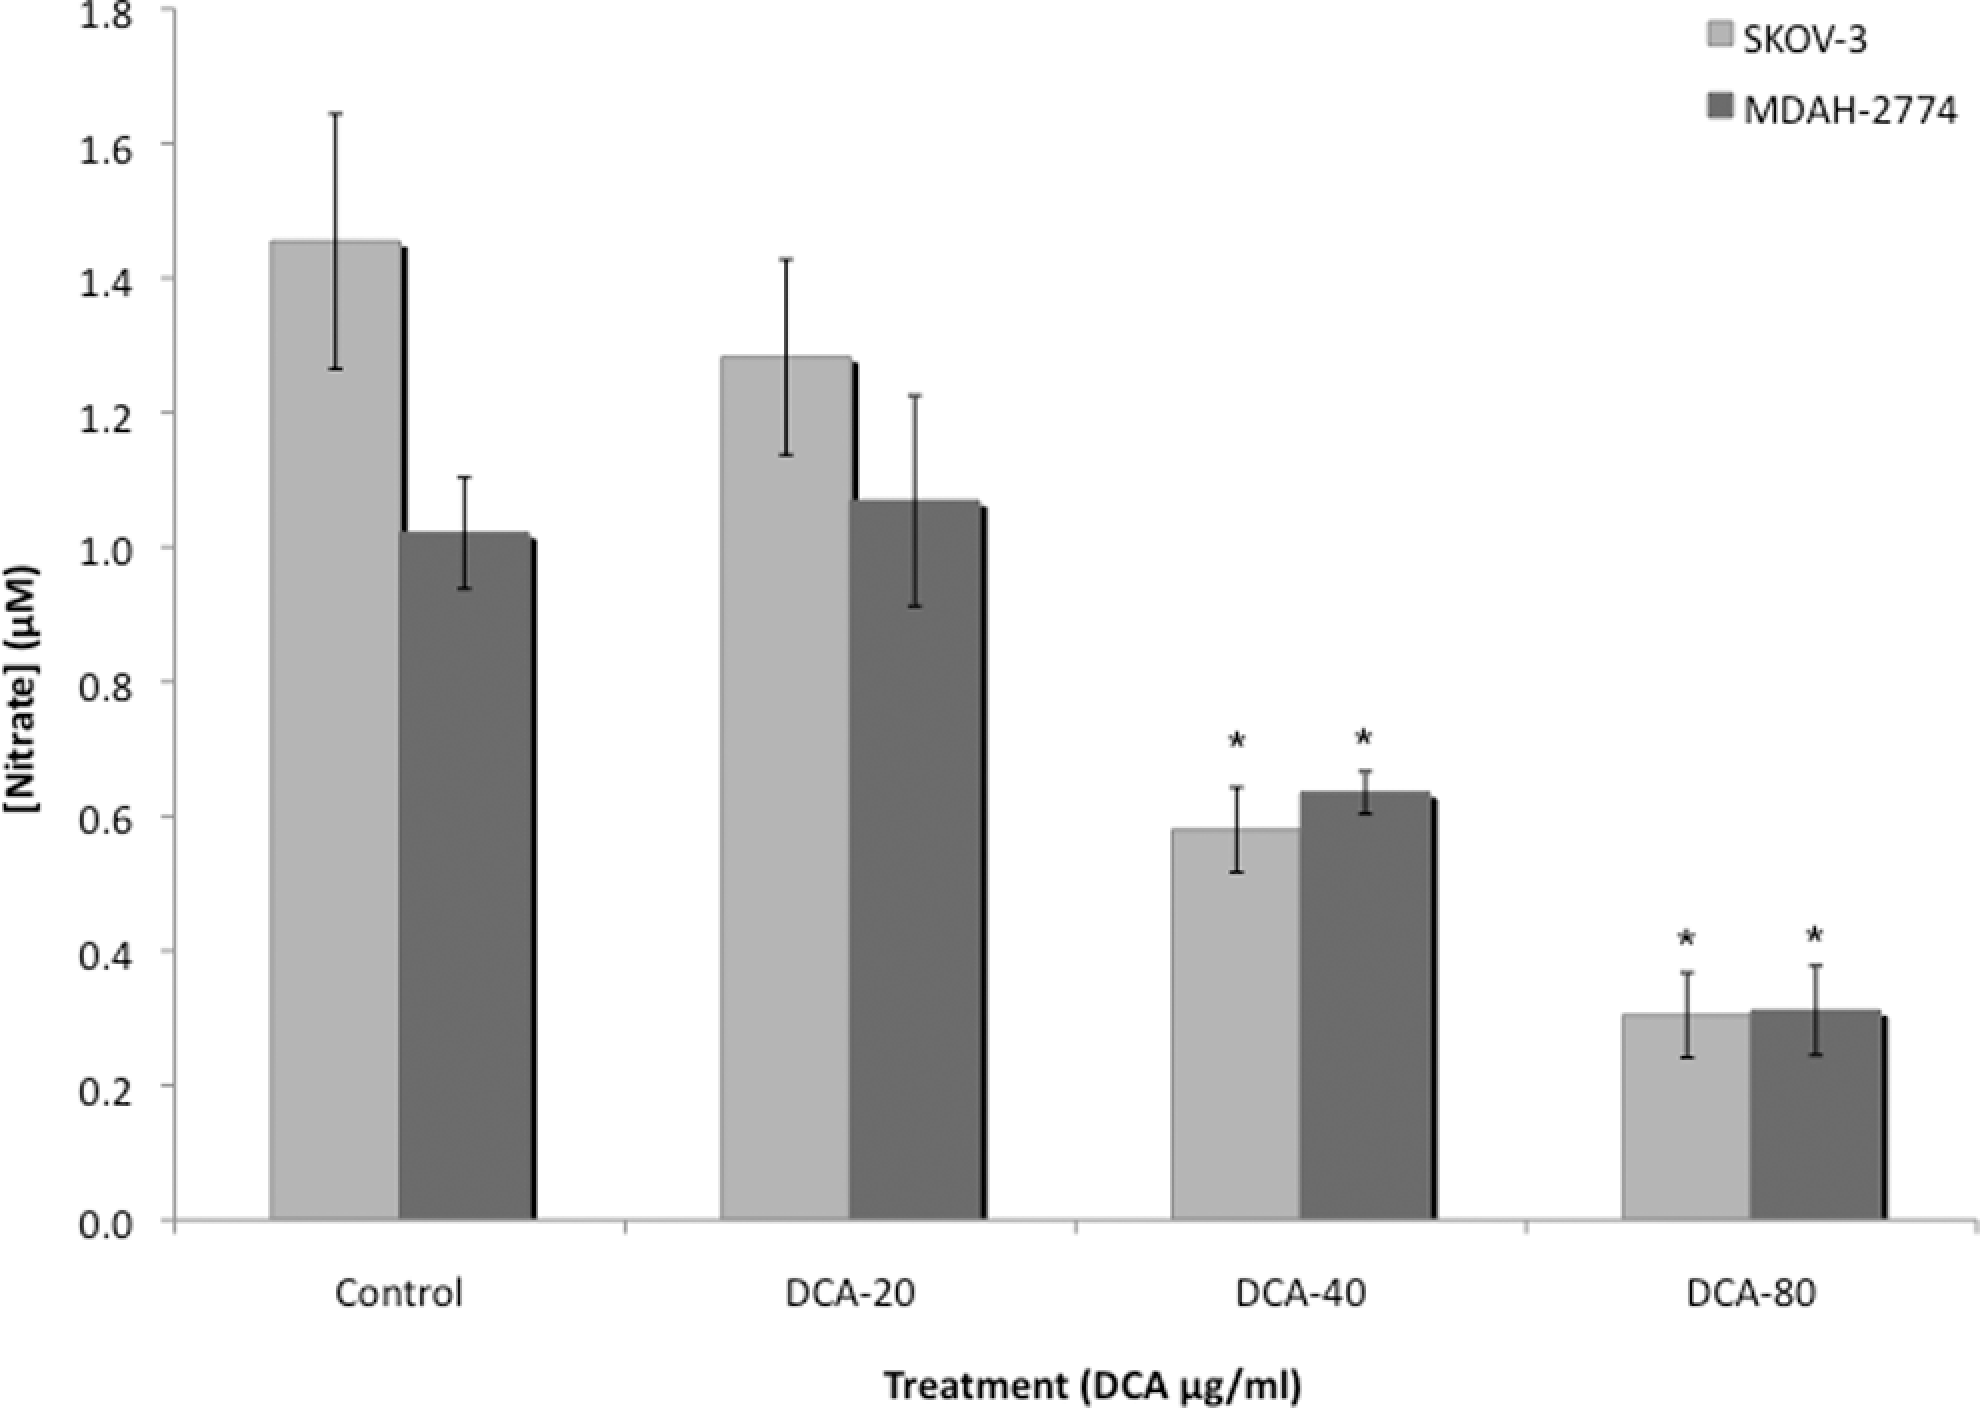
Nitric oxide levels in EOC cells. Nitric oxide levels were detected utilizing the Greiss assay in culture media from 2 human EOC cell lines, SKOV-3 and MDAH-2774, treated with increasing doses of DCA (0, 20, 40, and 80 μg/mL) for 24 hours. All experiments were performed in triplicate. Asterisk indicates P < .05; NS, no significance; EOC, epithelial ovarian cancer; DCA, dichloroacetate.
Treatment With DCA Decreased MPO Expression in EOC Cells
Treatment with DCA decreased MPO mRNA levels, in SKOV-3 cells, in a dose-dependent manner from 6.3 pg/μg RNA to 3.2, 2.4, and 1.0 pg/μg RNA at the 20, 40, and 80 μg/mL DCA doses, respectively (P < .05; Figure 3A). Similar results were obtained for MDAH-2774 cells with a reduction in MPO mRNA levels from 4.8 pg/μg RNA to 2.8, 1.4, and 0.66 pg/μg RNA at the 20, 40, and 80 mg/μL DCA doses, respectively (P < .05; Figure 3A).
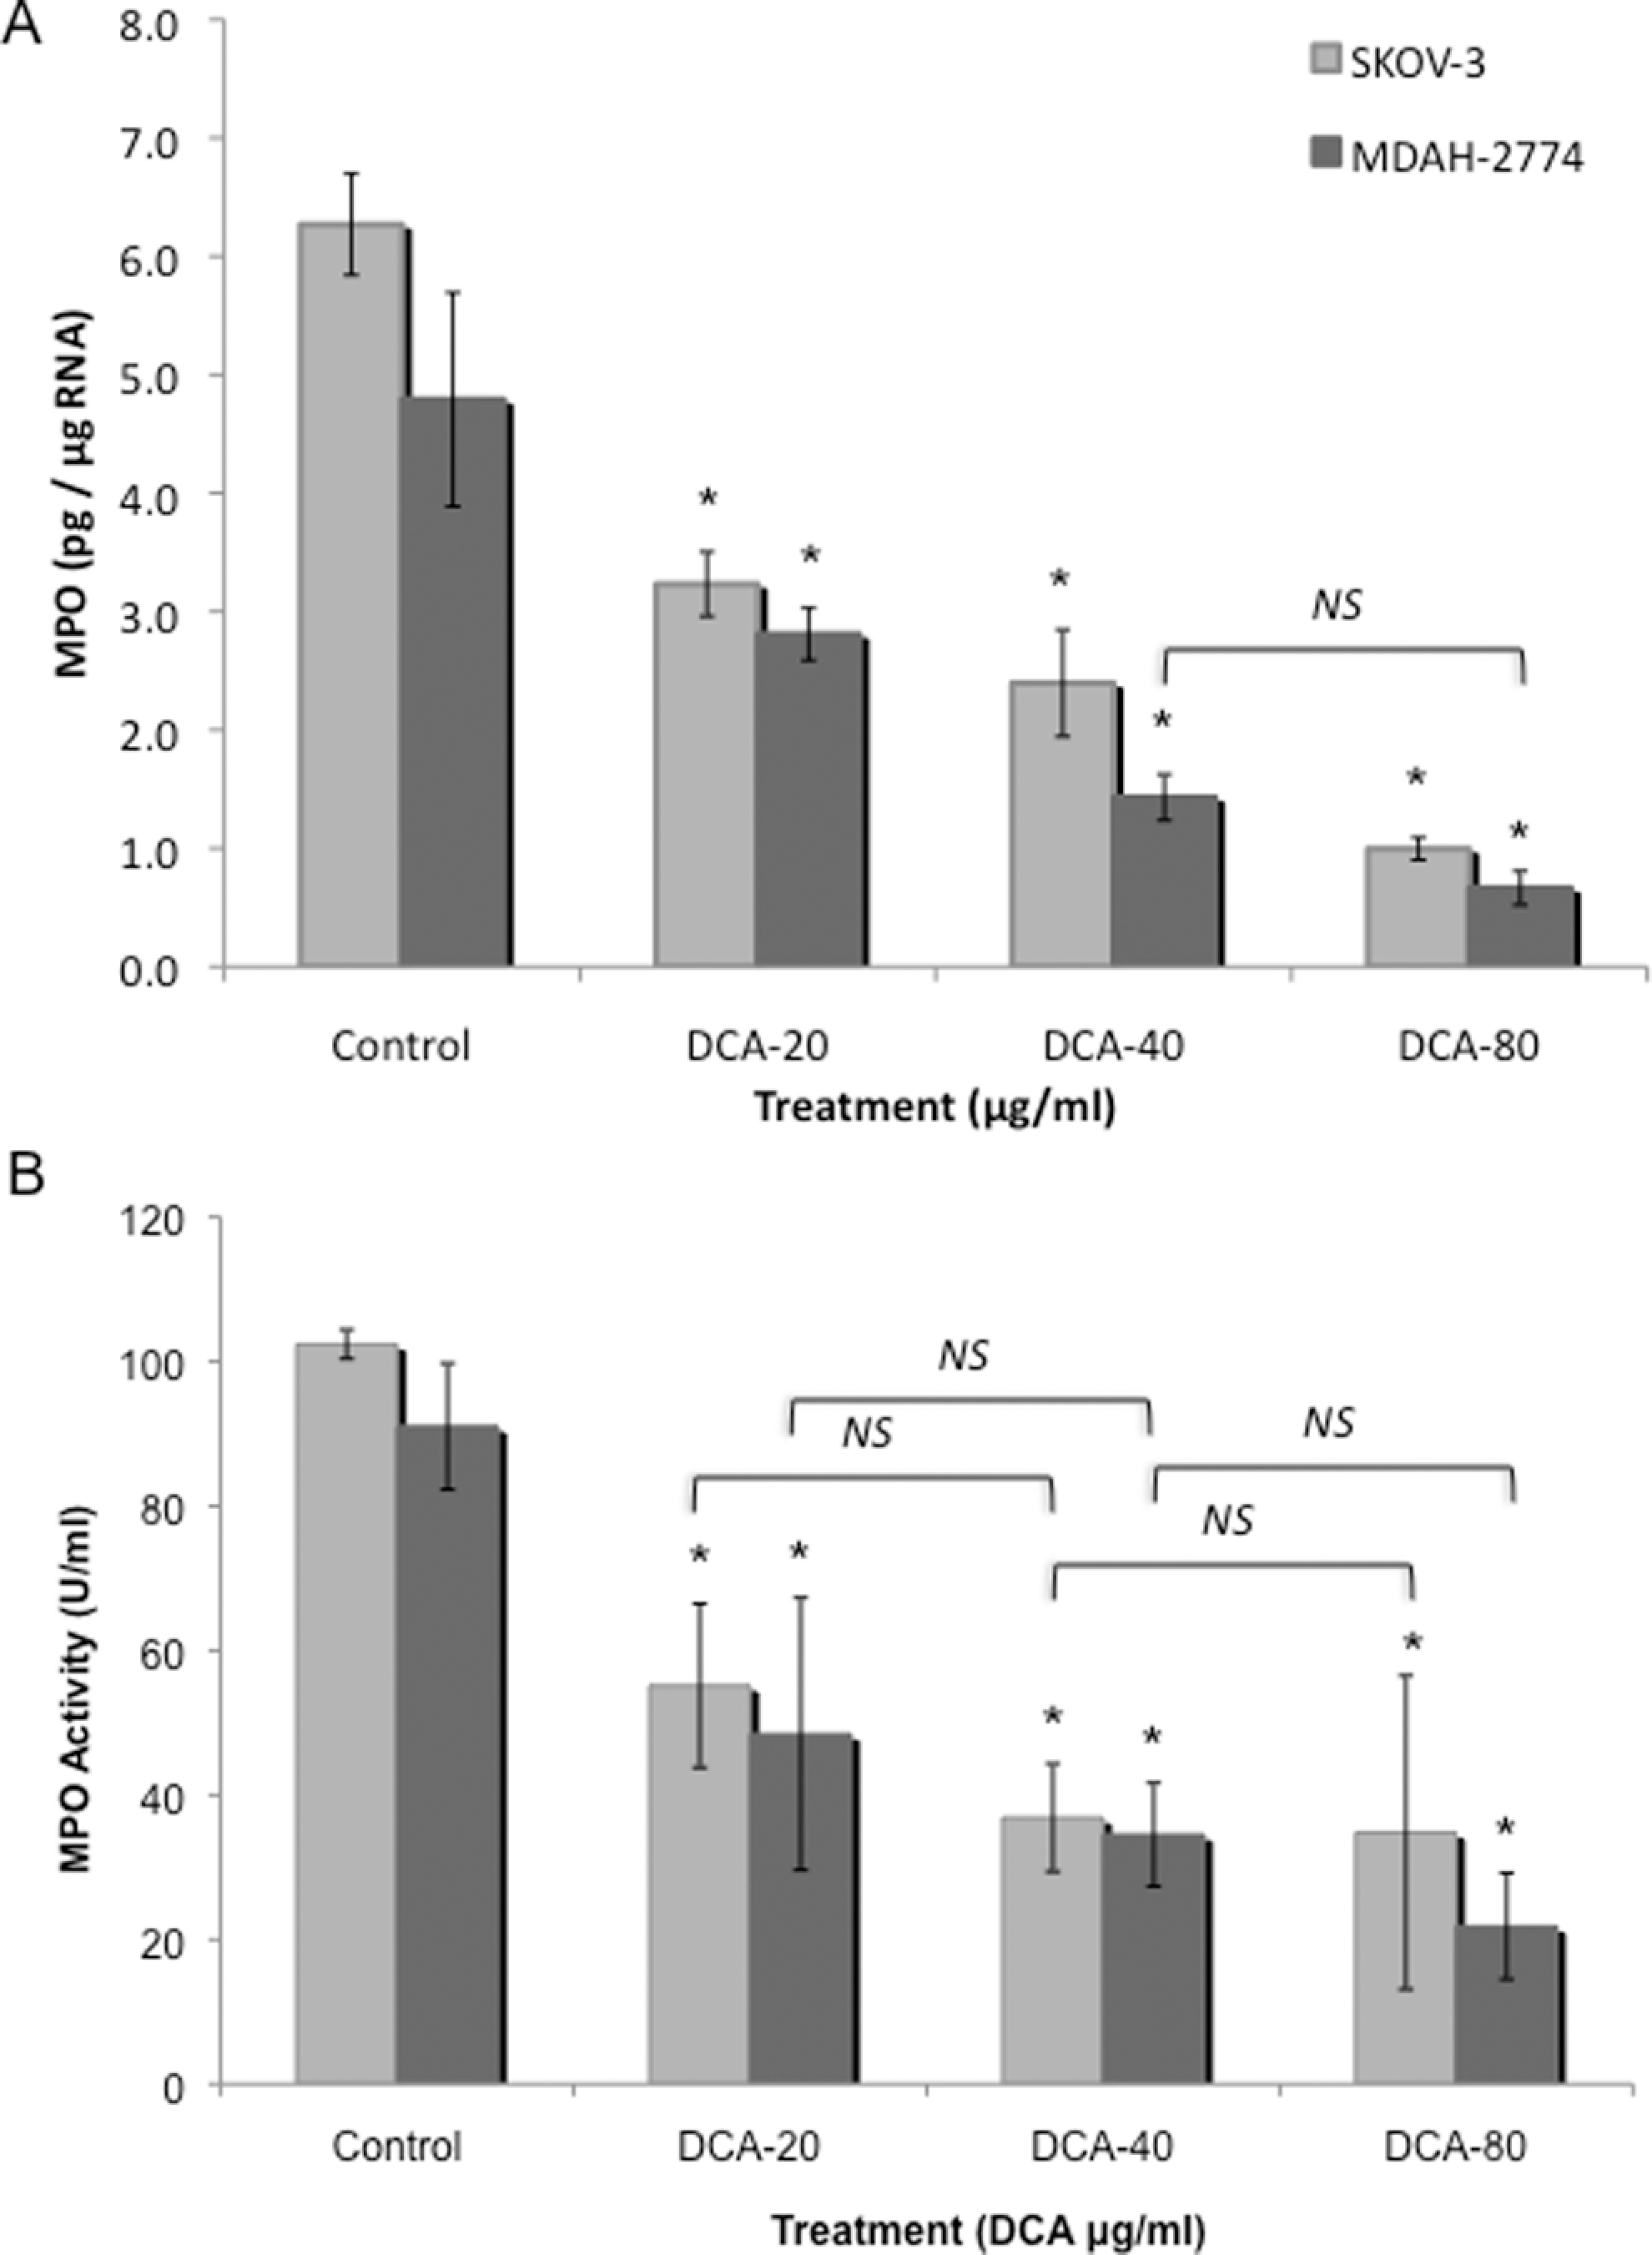
Myeloperoxidase (MPO) expression in EOC cells. Two human EOC cell lines, SKOV-3 and MDAH-2774, were treated with increasing doses of DCA (0, 20, 40, and 80 μg/mL) for 24 hours. A, Real-time RT-PCR was utilized using RNA from SKOV-3 and MDAH-2774 cells. B, MPO activity was measured in cell homogenate isolated from SKOV-3 and MDAH-2774 cells. All experiments were performed in triplicate. Asterisk indicates P < .05; NS, no significance; EOC, epithelial ovarian cancer; DCA, dichloroacetate; RT-PCR, reverse transcriptase-polymerase chain reaction.
In agreement with our real-time RT-PCR results above, a decrease in the activity of MPO was observed in both EOC cell lines in response to DCA treatment. Treatment with DCA decreased the levels of MPO activity, in SKOV-3 cells from 102.4 to 55.16, 34.83, and 57.32 U/mL at the 20, 40, and 80 mg/mL DCA doses, respectively (P < .05; Figure 3B). Treatment with DCA also decreased MPO activity in MDAH-2774 cells from 91.03 to 48.46, 34.54, and 21.84 U/mL at the 20, 40, and 80 μg/mL DCA doses, respectively (P < .05; Figure 3B). There was no significant difference in MPO activity between the different DCA dose treatments.
Treatment With DCA Increased SOD-3 Expression in EOC Cells
Treatment with DCA significantly increased SOD-3 mRNA levels, in SKOV-3 cells, in a dose-dependent manner, from 6.91 fg/μg RNA to 14.0, 21.3, and 29.1 fg/μg RNA at the 20, 40, and 80 μg/mL DCA doses, respectively (P < .05; Figure 4A). Similar results were obtained for MDAH-2774 cells, with a dose-dependent increase in SOD-3 mRNA levels from 4.89 fg/mg RNA to 9.26, 14.7, and 23.0 fg/μg RNA at the 20, 40, and 80 mg/mL DCA doses, respectively (P < .05; Figure 4A).
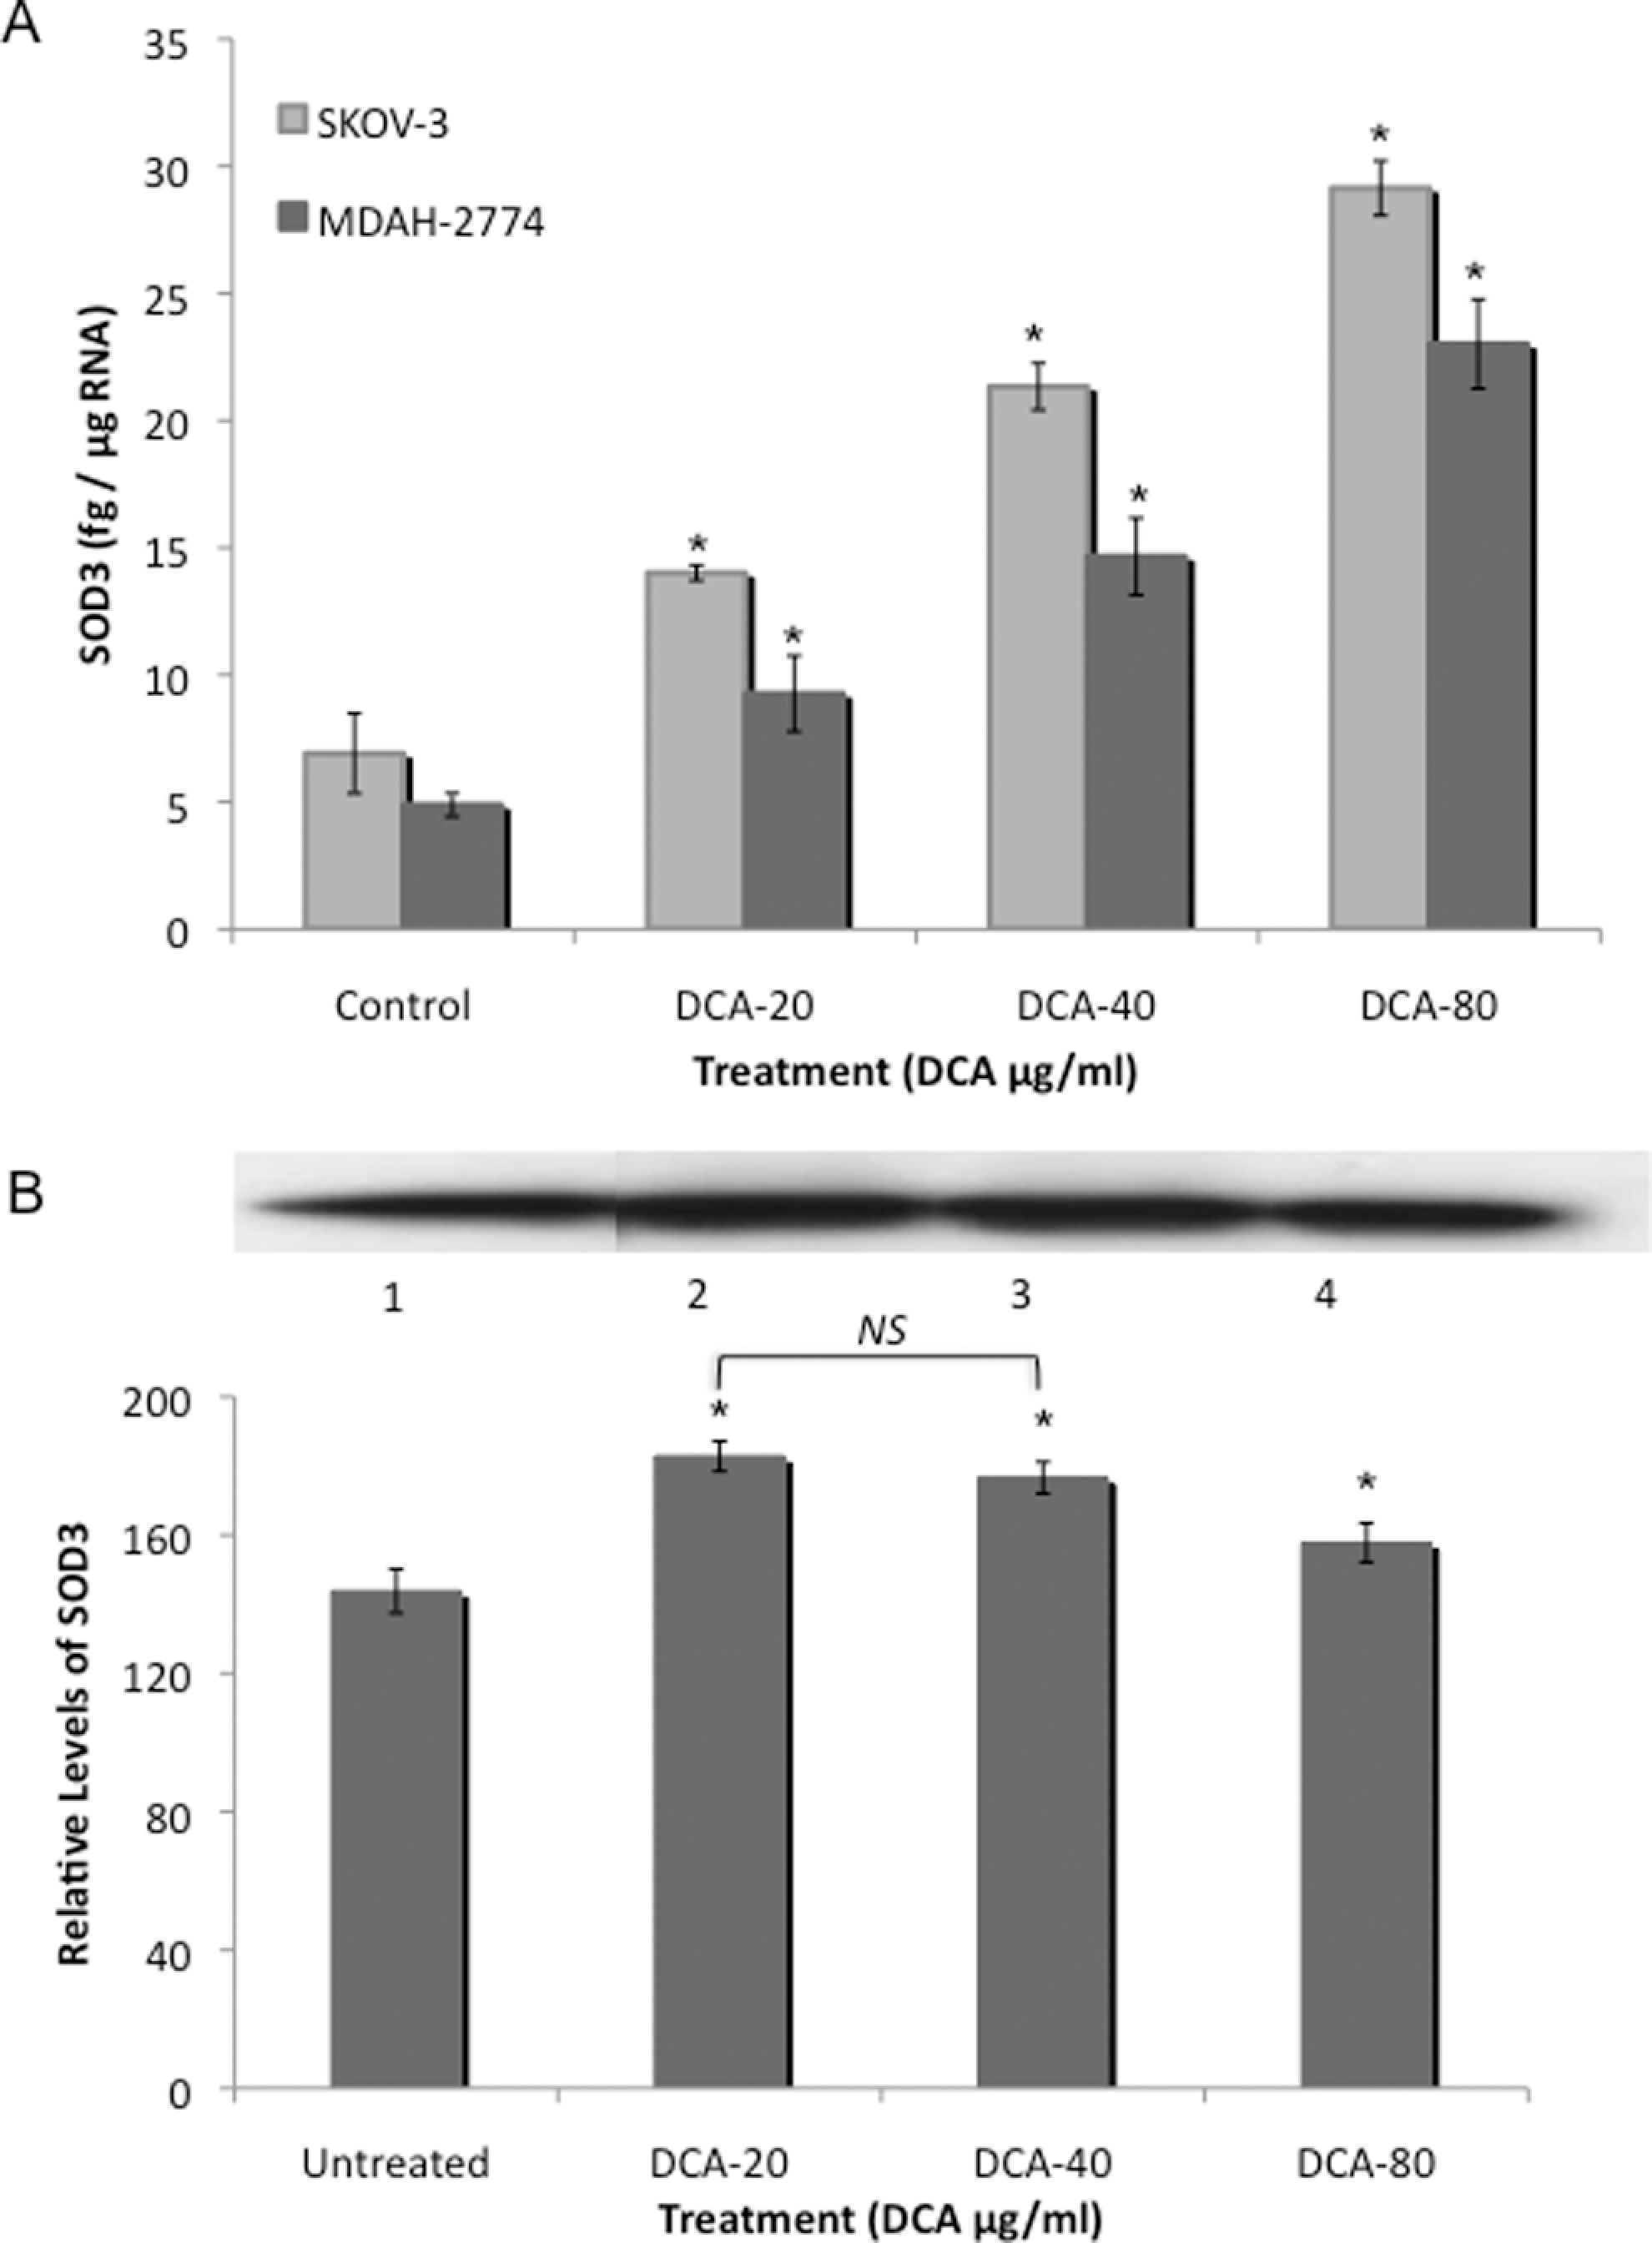
A, Superoxide dismutase 3 (SOD-3) levels in EOC cells. Two human EOC cell lines, SKOV-3 and MDAH-2774, were treated with increasing doses of DCA (0, 20, 40, and 80 μg/mL) for 24 hours. Real-time RT-PCR for SOD-3 was utilized using RNA isolated from SKOV-3 and MDAH-2774 cells. B, Immunoprecipitation/Western blot was utilized for the detection of SOD-3 in cell lysates from MDAH-2774 cells and were precipitated with anti-SOD-3 antibody and fractionated with SDS-PAGE. Membrane was probed with anti-SOD-3 antibody. Immunoprecipitation of SOD-3, exposed to SOD-3 antibody, is as follows: lane 1, control; lane 2, 20 μg/mL DCA; lane 3, 40 μg/mL DCA; and lane 4, 80 μg/mL DCA. Immunoprecipitation/Western blot results were scanned and analyzed by NIH image J 3.0. All experiments were performed in triplicate. Asterisk indicates P < .05; NS, no significance; EOC, epithelial ovarian cancer; DCA, dichloroacetate; RT-PCR, reverse transcriptase-polymerase chain reaction.
Immunoprecipitation/Western blot was utilized to confirm SOD-3 protein levels in DCA-treated MDAH-2774 EOC cells. Results are expressed as relative levels as compared to the control. In agreement with our real-time RT-PCR results above, an increase in the expression of SOD-3 was observed in EOC cells in response to DCA treatment. Superoxide dismutase3 protein levels increased from 143.8 to 182.8, 176.6, and 157.8 at the 20, 40, and 80 mg/mL DCA doses, respectively, in MDAH-2774 cells (P < .05; Figure 4B). Results are expressed as relative levels as compared to the control. Similar results were obtained for SKOV-3 cells (data not shown).
Treatment With DCA-Decreased HIF-1a mRNA Levels in EOC Cells
Treatment with DCA-decreased HIF-1a mRNA levels, in SKOV-3 cells, in a dose-dependent manner from 1193 ng/mg RNA to 605.1, 515.3, and 227.7 ng/mg RNA at the 20, 40, and 80 mg/mL DCA doses, respectively (P < .05; Figure 5). Similar results were obtained for MDAH-2774 cells, with a dose-dependent reduction in HIF-1a mRNA levels from 950.7 ng/mg RNA to 677.3, 456.7, and 211.5 ng/mg RNA at the 20, 40, and 80 mg/mL DCA doses, respectively (P < .05; Figure 5).
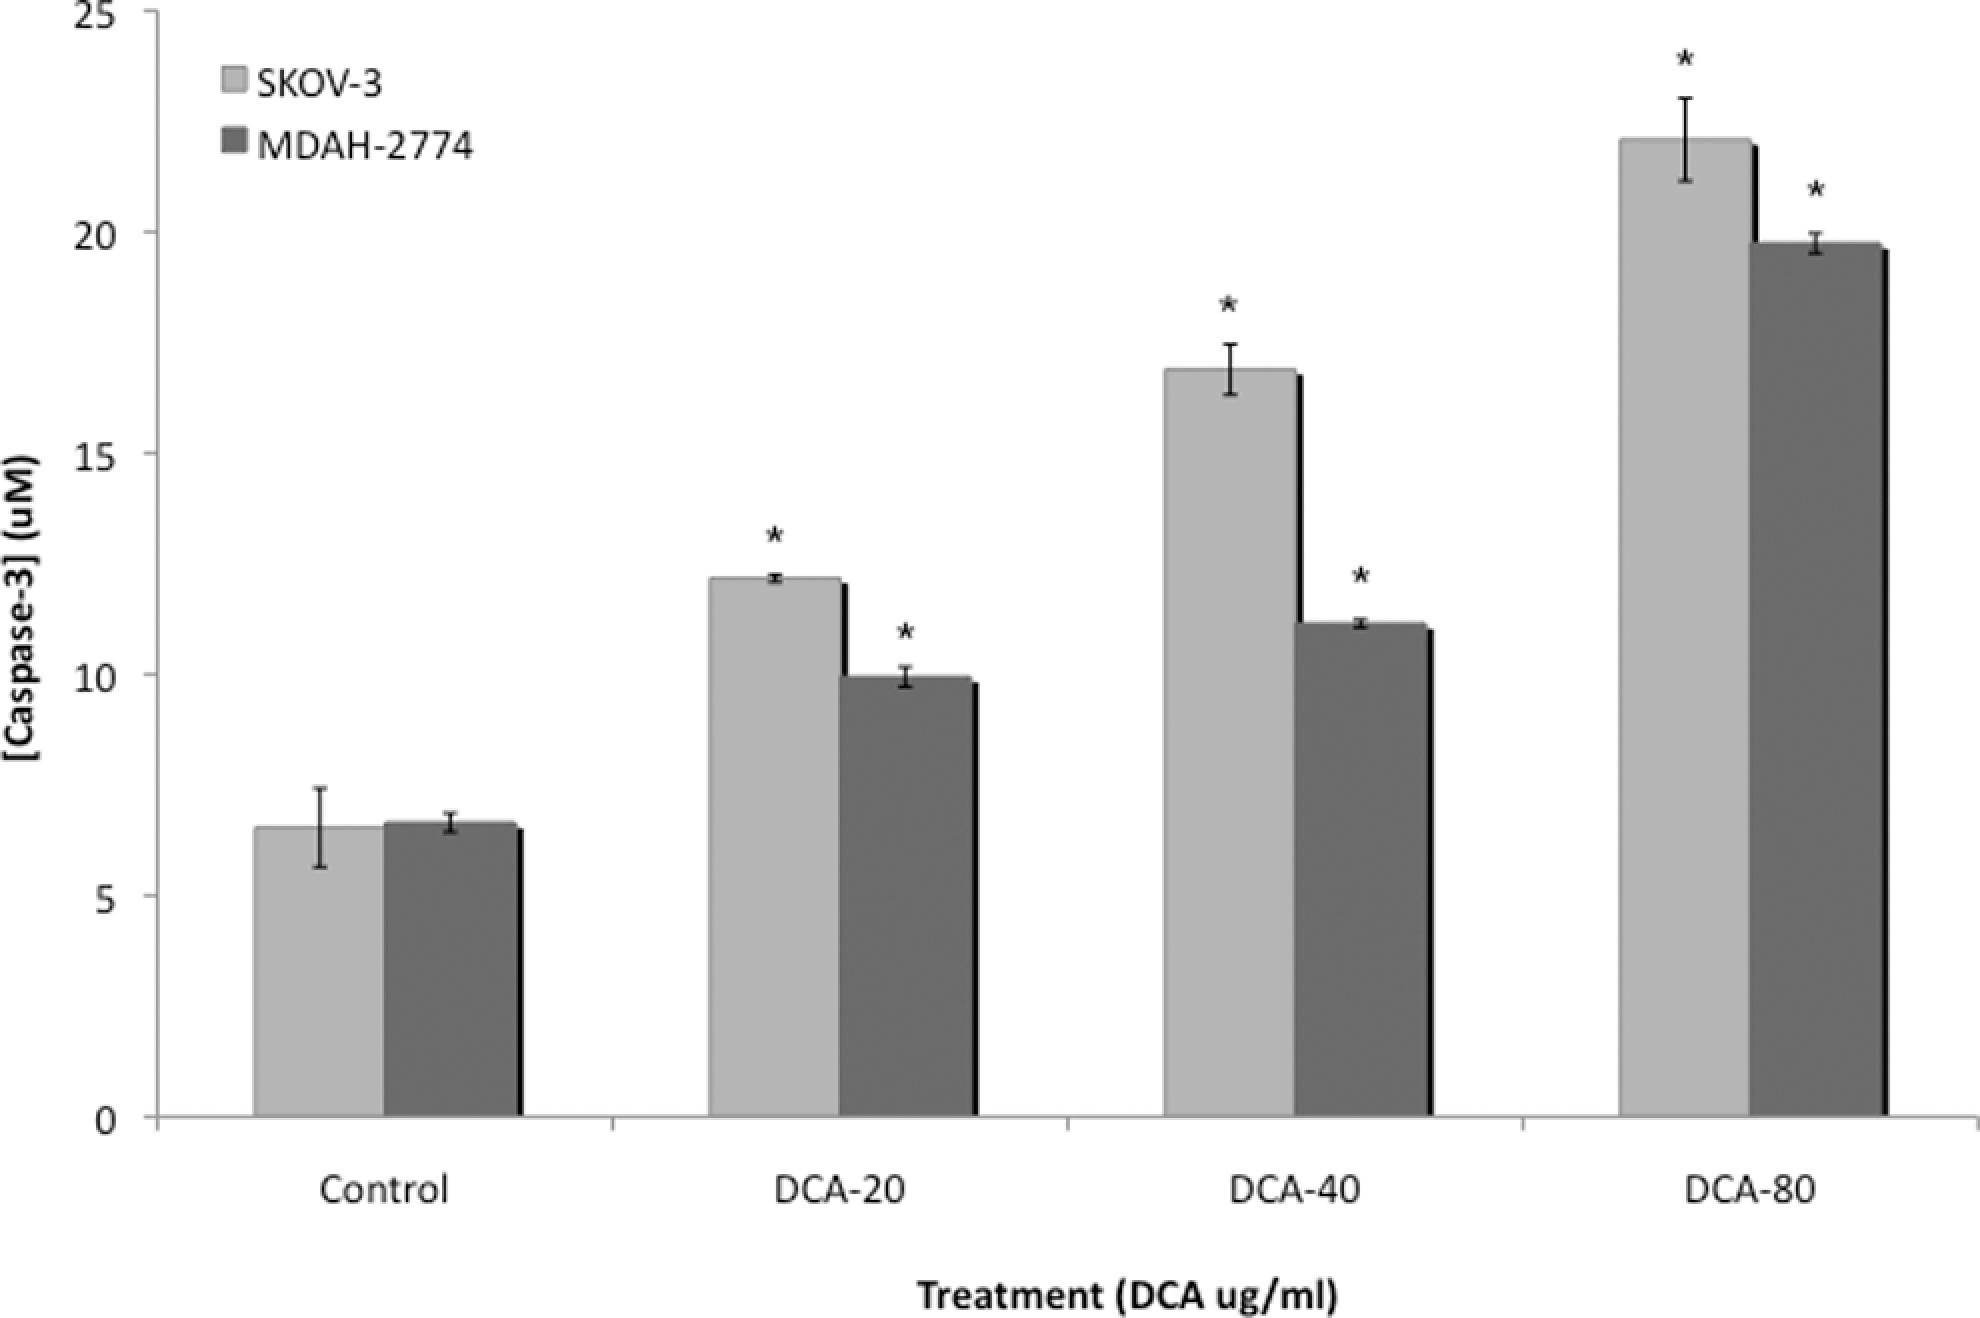
Caspase 3 activity in human EOC cells. Caspase 3 activity was measured in cell lysates from 2 human EOC cell lines, SKOV-3 and MDAH-2774, treated with increasing doses of DCA (0, 20, 40, and 80 mg/mL) for 24 hours. All experiments were performed in triplicate. Asterisk indicates P < .05; NS, no significance; EOC, epithelial ovarian cancer; DCA, dichloroacetate.
Treatment With DCA Increased Caspase 3 Activity and Apoptosis in EOC Cells
Baseline levels of caspase 3 activity were significantly lower in untreated EOC cells. Treatment with DCA significantly increased caspase 3 activity in SKOV-3 cells, in a dose-dependent manner, from 6.53 to 12.2, 16.9, and 22.1 mmol/L in the 20, 40, and 80 mg/mL doses, respectively (P < .05; Figure 6). Similarly, this increase was observed in MDAH-2774 cells, in a dose-dependent manner, from 6.64 to 9.94, 11.0, and 19.7 mmol/L in the 20, 40, and 80 mg/mL doses, respectively (P < .05; Figure 6).
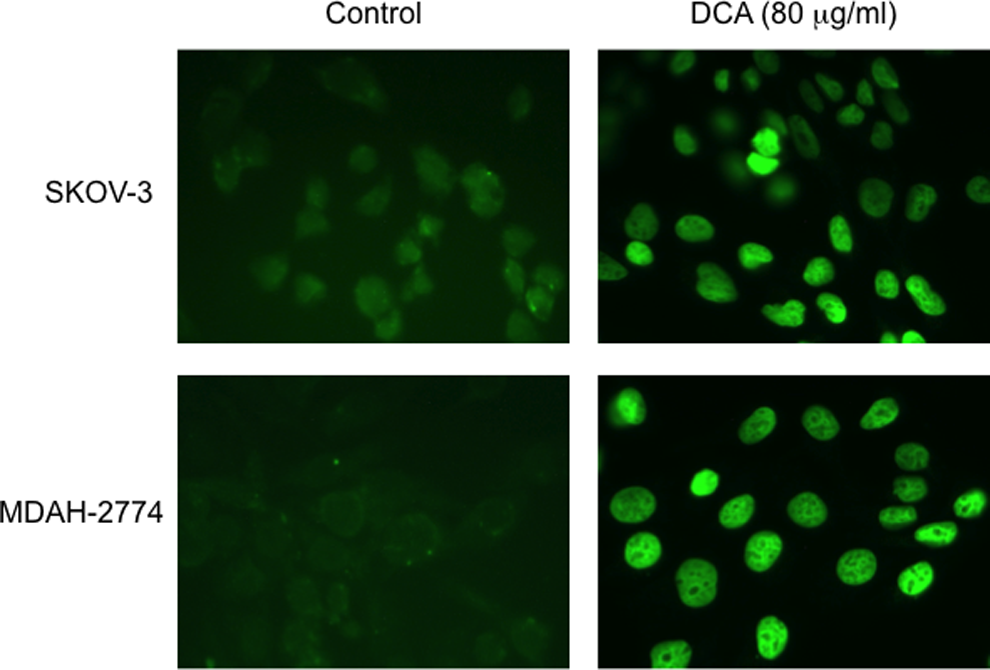
Detection of apoptosis in human EOC cells. The amount of DNA fragmentation (apoptosis) was assessed by TUNEL assay for EOC cells, MDAH-2774 and SKOV-3, following DCA treatment (80 mg/mL, 24 hours) as compared to control cells. Apoptotic cells were visualized (×60) with fluorescein-12-dUTP (green). Experiments were performed in triplicate. EOC indicates epithelial ovarian cancer; DCA, dichloroacetate; TUNEL, terminal deoxynucleotidyl transferase-mediated dUTP nick end labeling.
These results were confirmed by TUNEL staining, an indicator of the degree of DNA fragmentation, which is representative of apoptosis. Apoptotic cells were visualized (×60) with fluorescein-12-dUTP (green). Treatment with DCA resulted in a significant increase in TUNEL staining (green) as compared to controls, in both SKOV-3 and MDAH-2774 cells (Figure 6).
Discussion
Early carcinogenesis often occurs in a hypoxic microenvironment and therefore the tumor cells have to rely on anaerobic metabolism for energy production.12,21 Mitochondrial dysfunction, driven by anaerobic metabolism, is also a continuous source of ROS and RNS in tumor cells. The role of ROS and RNS is indispensable to both physiological and pathophysiological conditions such as growth, differentiation, apoptosis, and senescence.20,22–24 It therefore seems that some levels of ROS are beneficial to the cells.25,26 As a result of high levels of ROS and RNS, cancer cells are known to express high levels of SOD, which converts 2 O2•- into H2O2 and O2. 27 Superoxide dismutase is a critical enzyme responsible for the elimination of O2•- and is considered a key antioxidant in aerobic cells, while deficiency in SOD or inhibition of the enzyme activity may cause accumulation of O2•- in the cells, which results in the persistence of the oncogenic phenotype. 28 Consistent with this role of SOD, our results showed that DCA significantly induces the expression of SOD-3 in EOC cells (Figure 4). However, in other studies using different cancer cell lines, it was reported that decreased levels of SOD are effective in the induction of apoptosis.29–31 Decreased levels of SOD would result in toxic high levels of free radicals, which ultimately leads to necrosis. On the other hand, ROS can also induce cellular senescence and cell death and can therefore function as antitumorigenic agents. 32 Whether ROS promote tumor cell survival or act as antitumorigenic agents depends on the cell and tissues, the location of ROS production, and the concentration of individual ROS. 10
Oxidative stress plays a significant role in the creation and development of the oncogenic phenotype, whereas suppressing the state of oxidative stress, through the utilization of different antioxidants, has been associated with a reduced risk of cancers.3,28,33–35 Oxidative stress triggers cancer cells to favor anaerobic metabolism, despite the fact that oxygen is present. 13 This altered metabolism consists of an increase in glycolysis that is maintained in conditions of high oxygen tension (“aerobic glycolysis”) and gives rise to enhanced lactate production (The Warburg Effect).12,13 To compensate for the reduction in cellular ATP production, glucose oxidation generates more ATP per glucose molecule (36 ATP) compared to glycolysis (2 ATP), and cancer cells upregulate glucose receptors and significantly increase glucose uptake.8,12,13 Aerobic glycolysis, in tumor cells, results in significant lactic acidosis, which additionally induces substantial toxicity to the surrounding tissues and cancer cells themselves, although it has been shown that lactic acidosis facilitates tumor growth through breakdown of extracellular matrix, increased cell mobility/metastatic potential, and activation of angiogenesis. 13
One of the foremost, nearly ubiquitous, mechanisms of aerobic glycolysis resides in the activation of HIF, an oxygen-sensitive transcription factor that is activated by hypoxic stress as well as oncogenic, inflammatory, metabolic, and oxidative stress. 13 The link between oxidative stress and aerobic glycolysis is supported by the fact that HIF is activated under hypoxic conditions and is known to induce the expression of several glucose transporters as well as most of the enzymes required for glycolysis. 36 Hypoxia-inducible factor also induces the expression of PDK, an enzyme that regulates the entry of pyruvate into the mitochondria.12,13,37 In the presence of activated PDK, PDH is inhibited, limiting the entry of pyruvate into the mitochondria, where glucose oxidation can occur. Consistent with these findings, DCA treatment significantly decreased HIF-1aα expression (Figure 6).
Dichloroacetate is a metabolic modulator that has been clinically utilized in the treatment of hereditary mitochondrial diseases as well as lactic acidosis.6,12,38–40 Dichloroacetate inhibits PDK and thus shifts glucose metabolism in cancer cells from glycolysis to glucose oxidation, reversing the unique aerobic glycolysis found in solid tumors. 41 In this study, we hypothesized that DCA shifts the oxidative balance in the intracellular redox state, leading to the activation of specific endonucleases, which induce apoptosis in EOC cells. The rationale behind our hypothesis was based on a longstanding observation that cancer cells rely on a specific method of obtaining energy that is essentially unique to cancer. 12 Our results clearly demonstrate that DCA can significantly induce apoptosis by stimulating the activity of caspase 3 in EOC cells in a dose-dependent manner, as well as evident from the TUNEL assay (Figures 5 and 6). Indeed, DCA has been shown to induce apoptosis in cancer cells as evident by the efflux of cytochrome c and apoptosis-inducing factor from the mitochondria.42,43 It has been shown that aerobic glycolysis, as a result of oxidative stress, results in resistance to apoptosis.12,44–46 Several enzymes involved in glycolysis are also known to regulate apoptosis and gene transcription, suggesting that links between metabolic sensors, cell death, and gene transcription are established directly through the enzymes that control metabolism.12,45 Additionally, DCA induces apoptosis in glioblastoma, endometrial, prostate, and nonsmall cell lung cancers, supporting the findings from this study, which aimed to establish a link between DCA, oxidative stress, and apoptosis in EOC cell lines, possibly through similar mechanisms. 12
Since DCA acts by activating PDH, through the inhibition of PDK, bringing pyruvate into the mitochondria and enhancing glucose oxidation, it is therefore an ideal approach to shift aerobic glycolysis to glucose oxidation coupling rather than just inhibiting aerobic glycolysis. Inhibiting aerobic glycolysis results in ATP depletion and necrosis, not apoptosis, because apoptosis is an energy-consuming process, requiring active mitochondria.12,47 Dichloroacetate activates PDH through the inhibition of PDK at a concentration of 10 to 250 mmol/L or 0.15 to 37.5 mg/mL, in a dose-dependent fashion.12,48 Four different isoforms of PDK have been identified that have variable expression and sensitivity to the inhibition by DCA.12,49 Moreover, DCA administered at 35 to 50 mg/kg decreases lactate levels by more than 60% and directly activates PDH by 3- to 6-fold.12,50,51 These clinically used doses result in a serum concentration of 100 mg/mL and thus the dose we utilized in vitro was clinically relevant. 12
The persistent generation of cellular ROS is stimulated by carcinogens, infection, inflammation, environmental toxicants, nutrients, and mitochondrial respiration and is an inevitable consequence of aging in aerobic organisms.52–55 We have previously characterized the 2 EOC cell lines, SKOV-3 and MDAH-2774, and found them to express high levels of oxidative stress modulators such as MPO, iNOS, and NO while having low apoptosis. 5 Interestingly, MPO and iNOS are expressed and are colocalized in EOC cells and tissues in contrast to limited or no expression in normal ovarian tissues. 5 The ability of MPO to generate the nitrosonium ion (NO+) led us to believe that MPO may play a role in S-nitrosylation of caspase 3 in EOC cells. 56 Indeed, the studies from our laboratory clearly indicated that MPO is responsible for the S-nitrosylation of caspase 3, which inhibited its activity. 5 Furthermore, silencing MPO gene expression by the utilization of MPO-specific small interfering RNA (siRNA) induced apoptosis in EOC cells through a mechanism that decreases S-nitrosylation of caspase 3 by MPO. 5 Consistent with these findings, DCA treatment was able to effectively reduce MPO, iNOS, and NO levels and thus may act by a similar mechanisms including limiting the production of ROS, and/or decreased S-nitrosylation of caspase 3 (Figures 1-3).
In conclusion, shifting anaerobic to aerobic metabolism by DCA induces apoptosis of EOC cells. This effect potentially involves the modulation of key enzymes that control the cellular redox balance. The utilization of DCA to induce apoptosis of EOC cells may provide a therapeutic option in the treatment of EOC. Explicably, the potential therapeutic value of DCA for ovarian cancer will require future analysis utilizing more cell lines, including ovarian surface epithelial cells, as well as patients.
Footnotes
The authors declared no potential conflicts of interest with respect to the research, authorship, and/or publication of this article.