
Abstract
Mesenchymal stromal cells (MSCs) from gestational tissues represent promising cell populations with stem cell-like properties for use in regenerative medicine. Previously, we reported that MSCs in the chorionic villi of the human placenta reside in a vascular niche. However, the niche(s) in which MSCs reside in the fetal membranes, another rich source of MSCs, remains to be determined. The cell surface markers STRO-1 and 3G5 were previously employed to identify niches in a variety of tissues and here we use these markers to report the location of the MSC niche in the human decidua parietalis. The cultured decidua parietalis MSCs (DPMSCs) isolated from the choriodecidua component of the fetal membranes possessed stem cell-like properties such as adherence to plastic, colony forming ability, and multipotent differentiation potential. Fluorescence in situ hybridization analysis showed cultured DPMSCs were of maternal origin. Immunocytochemistry demonstrated that cultured DPMSCs stained positively with stem cell surface markers 3G5, CD105, CD106, STRO-1, CD146, CD49a, and α-SMA but were negative for hematopoietic markers (CD117, CD34) and vascular markers (CD34, von Willebrand factor [vWF]). Immunohistochemistry with antibodies to stem cell surface markers and the endothelial markers on term fetal membranes revealed a vascular niche for DPMSCs, which was confirmed by immunofluorescence analysis. Both STRO-1 and vWF fluorescence signals showed substantial overlap, while CD146 and vWF signals showed partial overlap. These observations were consistent with a vascular niche.
Introduction
Gestational tissue and amniotic fluid are rich sources of mesenchymal stromal cells (MSCs). 1–8 Currently, there is intense research on the potential utility of cultured MSCs for regenerative and reparative medicine and clinical trials are underway. Despite this, we know relatively little about the biology of MSCs.
The human fetal membranes envelop the fetus and its surrounding amniotic fluid, forming a highly specialized interface between mother and fetus that carries out important functions during pregnancy. 9 The fetal membranes have 2 components; the amnion and the chorion. 10 The amnion, which is avascular and fetal in origin, comprises a single layer of epithelial cells with an underlying mesenchymal stromal layer. 11 These 2 cell layers are the sources of human amniotic multipotent epithelial cells (hAECs) and amniotic MSCs (AMSCs), respectively, both of which have stem cell-like properties. 4 ,6,7,12 –15
The chorion of term fetal membranes consists of the chorionic mesenchymal stromal layer covering the chorionic trophoblast cell layer, which are both of fetal origin. As the fetus grows, the fetal membranes enlarge such that the chorion pushes into, and subsequently adheres to, the overlying decidua parietalis, which is of maternal origin. The chorion with attached decidua parietalis is called the choriodecidua. Following delivery, the amnion and choriodecidua can be easily separated mechanically. The choriodecidua is, like the amnion, a rich source of stem cells. The chorionic mesenchymal stromal layer is the source of chorionic MSCs (CMSCs). 16 –18 The chorionic trophoblast (CT) layer of first trimester fetal membranes is a source of multipotent trophoblast stem cells. 19 The adherent decidua parietalis of the choriodecidua is also a source of MSCs. 4 ,20
Unlike decidua basalis MSCs, which have been intensively studied because of their intimate relationship with the attached placenta, 21 little is known about decidua parietalis MSCs (DPMSCs). Collectively, these data suggest that the fetal membranes from term placentae are rich sources of MSCs (AMSCs, CMSCs, and DPMSCs) and the presence of multiple MSC populations of different origins necessitates that the purity and origin of MSCs be determined. Others have noted that MSC populations from the choriodecidua can contain mixtures of MSCs of both fetal and maternal origin. 4
Immunophenotyping studies of AMSCs, CMSCs, and DPMSCs employing flow cytometry reveal an expression profile characteristic of mesenchymal stem cells including expression of the stem cell markers CD73, CD90, and CD105, while being negative for CD14, CD34, CD45, and HLA-DR. 4 ,20,22 Although as stated above, there are similarities in the immunophenotype of AMSCs, CMSCs, and DPMSCs, there are also differences between them with respect to expression of specific stem cell markers, differences in gene expression profiles, growth rates, and differentiation potential. 4 ,18
The stem cell niche is a highly balanced environment, which comprises the milieu of factors to which naive stem cells are exposed to, and non-stem cell populations that they contact. 23 Each stem cell niche is, therefore, expected to have unique properties that reflect the tissue or organ of origin, or in this case, that reflect the different microenvironments of the various cell layers of the fetal membranes.
With respect to human fetal membranes, immunofluorescence studies have been carried out to identify stem cell marker-positive cells and thereby identify the likely niche(s). For hAECs, Oct-4, Sox-2, and Nanog-positive cells were scattered in the epithelial layer of the amnion 24 (U Manuelpillai, personal communication). The niche for hAMSCs has not been reported but scattered stem cell marker-positive cells have been identified in the amniotic mesenchyme (U. Manuelpillai, personal communication). The niche for CMSCs, and DPMSCs in the choriodecidua has not yet been reported. Here, we focus on identifying the DPMSC niche in the decidua parietalis component of the choriodecidua. Our strategy was to exploit multiple cell surface markers that have been used to identify mesenchymal stem cell niches in a variety of human tissues.
STRO-1, 3G5, and CD146 cell surface markers have been used to characterize cells with MSC properties derived from bone marrow, periodontal ligament, dental pulp, and human adipose tissue.25–28 Importantly, these cell surface markers can enrich the subpopulations of MSCs that have a high capacity to form fibroblastoid colonies in vitro (called the colony-forming unit-fibroblast [CFU-F] population), which is an important property of stem cells. 25 ,28 –33 The CFU-F colonies derive from a single stem cell and have the ability to differentiate into many of the cell types that are characteristically derived from the niche. 34 The CD49a (VLA-1/ITGA1) cell surface marker has also been used to enrich the CFU-F population and used to identify both human bone marrow and placental chorionic mesenchymal stem cells. 2, 35
The niches for MSCs in human adipose tissue and dental pulp have been identified using the STRO-1, 3G5, and CD146 cell surface markers. 25 ,28 In a recent study, we used STRO-1 and 3G5, CD146, and CD49a to characterize cultured placental MSCs (PMSCs) and used STRO-1 and 3G5 to identity the PMSC niche in the chorionic villi of the human term placenta. 36 In the present study, we prepared DPMSCs from the decidua parietalis, confirmed their colony forming unit potential, their capacity for multilineage differentiation, and determined their fetal/maternal origin. Using immunocytochemistry, we determined that cultured DPMSCs were positive for a range of cell surface markers used to identify the MSC niche and compared DPMSC staining to that of PMSCs from the human term placenta. Finally, we used stem cell surface markers with immunohistochemistry and immunofluorescence detection to identify a vascular niche for DPMSCs in the decidua parietalis in the choriodecidua.
Materials and Methods
Patient Samples and Tissue Collection
Fetal membranes (defined as amnion and choriodecidua) from uncomplicated term pregnancies were obtained with informed patient consent and with approval from the Research and Ethics Committees of the Royal Women’s Hospital, Melbourne. Patient characteristics for the samples used in this study were as follows: gestation age of 38.7 ± 1.2 (mean ± standard deviation [SD]) weeks, maternal age 32.8 ± 5.9 years, newborn birth weight 3425.9 ± 397.0 g, and placental weight 646.8 ± 80.1 g. The samples were from caesarean sections without labor. Exclusion criteria were maternal tobacco or other substance abuse, obvious signs of fetal infection, preeclampsia, fetal growth restriction, or preterm rupture of the membranes. All samples were collected from uncomplicated singleton pregnancies.
Rolled fetal membranes were either snap frozen Cryomatrix (TissueTek, Crown Scientific) or 10% formalin fixed and embedded in paraffin wax before use for immunohistochemistry and immunofluorescence techniques.
Preparation of Fetal Membrane Samples for Stem Cell Isolation
Fetal membranes were collected within 20 minutes of delivery. The amnion was manually separated from the choriodecidua. Samples (∼10 g) were rinsed in saline, extensively minced using dissecting scissors and a scalpel blade, and placed in prewarmed Hanks balanced salt solution (HBSS, Life Technologies, Mulgrave, Australia) at 37°C for immediate stem cell isolation.
The MSCs were isolated as described previously 2 with the following modifications. Tissue suspensions were centrifuged at 1000g for 5 minutes at room temperature and the supernatant was discarded. Red blood cells were hemolysed and the remaining cells were centrifuged as mentioned above. The pellet was incubated in 0.05% trypsin-EDTA for 10 minutes at 37°C, then washed twice in 50% fetal bovine serum (FBS)/α-minimum essential medium (MEM) for 10 minutes, and centrifuged at 1000g at room temperature after each wash. The resulting pellet was resuspended in 20% fetal calf serum (FCS)/α-MEM medium (complete medium), seeded into 75 cm2 culture flasks and maintained at 37°C in a humidified 5% CO2 incubator (passage P0). At the next passage (P1), the growth medium was 10% FCS/α-MEM and it was changed every 48 hours.
Trypan Blue exclusion assays were used to determine viable cell counts (Invitrogen, Australia) as previously described. 36
Colony Forming Unit Assays
Colony forming efficiency was assessed as described previously 37 with modifications described by us elsewhere. 36 Cell suspensions were seeded into 6-well plates at decreasing cell concentrations of 1000, 100, and 10 cells per well in 20% FBS/α-MEM and incubated for 2 weeks. Cells were fixed with 10% formalin, stained with Giemsa, and colonies of >50 cells were scored using a microscope.
Flow Cytometry Analysis of DPMSCs
For flow cytometry, P2 to P4 passage DPMSCs were detached with TrypLE Express (Invitrogen, Denmark) and resuspended in HBSS (Invitrogen) with 2% FBS. Approximately 10 5 cells per sample were stained with CD105-APC (Caltag Laboratories, Carlsbad, CA, USA), CD73-PE (BD Pharmingen, San Diego, CA, USA), and CD45APC-Cy7 (BD Pharmingen) for 30 minutes each at 4°C. The murine IgGκPE (BD Pharmingen) isotype control was used to determine nonspecific fluorescence. The DPMSCs were assayed on an LSRII flow cytometer (BD Biosciences, Franklin Lakes, NJ, USA) and analyzed using FACSDiva software (BD Biosciences).
Stem Cell Differentiation
Adipogenic, chondrogenic, and osteogenic differentiation was carried out as described previously. 36 Chondrogenic differentiation was carried out on cell monolayers as previously described. 38 To visualize adipocytes, cells were stained with Oil Red O for 15 minutes and counterstained with hematoxylin for 5 minutes, as outlined in the manufacturer’s protocol. Adipogenic differentiation was evident by the presence of stained lipid vacuoles in the cells. Chondrocyte differentiation was detected by staining the cells with Alcian Blue for 30 minutes, as described byYoshimura et al 39 and Ogawa et al 40 and then counterstained with Nuclear Fast Red for 5 minutes. Finally, osteogenic differentiation was assessed by Alizarin red staining of cultures for 5 minutes. 41 The undifferentiated controls, which contained all components of the media with the exception of the differentiation supplements, were also stained as described above.
Antibodies
The antibodies 3G5, STRO-1, and 1A6.12 were obtained from the American Type Culture Collection ([ATCC] Nayak et al 59 ), IMVS, Adelaide, Australia, 25,32 and Prof L. K. Ashman, University of Newcastle, Australia, respectively. The antibodies 3G5, STRO-1, and 1A6.12 were used as undiluted tissue culture supernatants with total protein concentrations of 3.5, 4.7, and 10 mg/mL, respectively. The CD146 was obtained from IMVS, Adelaide, Australia 25,32 and used at 4 μg/mL. CD49a, CD105, CD106, and CD117 were obtained from Millipore/Chemicon, Massachusetts, and used at 8, 1, 5, and 5 μg/mL concentrations, respectively. CD34 and von Willebrand factor [vWF] were obtained from Lab vision/Neomarkers, California, and both were used at 1 μg/mL concentration. The α-SMA was obtained from Sigma-Aldrich, St Louis, and used at 4 μg/mL concentration. Both X63 and FDO66Q were obtained from Flinders Technologies, Adelaide, Australia and used at 5 μg/mL concentration. All antibodies were mouse monoclonals except CD49a and vWF, which were rabbit polyclonals. Nonimmune rabbit serum (NIRS) was from Flinders Technologies, Adelaide, Australia and was used at the concentration of 5 μg/mL.
Immunocytochemistry
Immunocytochemical analysis was carried out on cultured DPMSCs and PMSCs. Immunostaining was performed using the antibodies described above using a Histostain-Plus Broad Spectrum Kit (Zymed Laboratories Inc, Invitrogen, Mulgrave, Australia) and chromogen 3-amino-9-ethyl-carbazole (AEC) or 3,3′-diaminobenzidine (DAB) chromogen as previously described. 36 ,42 The trophoblast cell marker FDO66Q, which specifically recognizes human trophoblast cells 43 and negative control markers NIRS, 1A6.12 (an immunoglobulin M [IgM] negative control undiluted tissue culture supernatant), and X63 (IgG1 negative control antibody from cell line P3X63.Ag8 with no known cross-reactivity with human tissue 44 ) were included.
Tyramide signal amplification (TSA) kit (Perkin Elmer, Waltham, MA, USA) was used to amplify the signal from antibodies 3G5 and STRO-1 and was added to these and control wells and kept for 10 minutes at room temperature, followed by 3 × 3 minutes phosphate-buffered saline (PBS) washes and a further incubation for 30 minutes of these wells with the Zymed kit broad spectrum streptavidin-conjugated enzyme (Kit Solution C) at room temperature. Cells were then subjected to a final 3 × 3 minutes washing period in PBS at room temperature. Color detection was performed using either AEC or DAB chromogen, after which the cells were stained and visualized with a Zeiss Axioscope microscope, and then photographed and analyzed with Axiovision software (Carl Zeiss Inc, New York).
Fluorescence In Situ Hybridization (FISH)
Fluorescence in situ hybridization was carried out on isolated DPMSCs using the methods described previously. 45 X, Y, and chromosome 4 probes were used to determine the fetal/maternal origin of the cells. Fish probes used were CEP 4 Alpha Satellite DNA (Spectrum Green), chromosome region 4p11-q11; CEP X (DXZ1), Alpha Satellite DNA (Spectrum Orange), Chromosome region Xp11.1-q11.1; and CEP Y (DYZ1) Satellite III DNA Yq12 (Spectrum Aqua). All probes used were obtained from Abbott Molecular (Illinois).
Briefly, DPMSCs at passage 2 were grouped according to the newborn sex. The DPMSCs were dissociated from the culture flasks by trypsinisation, centrifuged, and then fixed by suspension in Carnoy fixative. Fixed cell samples were dropped onto slides, dried at room temperature, dehydrated in graded ethanol, and air dried before use. Slides were incubated in 100 μg/mL pepsin in 0.1 mol/L HCl for 20 minutes at 37°C, washed in PBS, and then dehydrated in graded ethanol as mentioned above. Slides were denatured at 75°C for 2 minutes before hybridization with probes for 1 hour at 42°C in 10 μL of probe mix as per the manufacturer’s recommendation. After the hybridization, slides were washed in 0.4 SSC/0.3% Octylphenoxypolyethoxyethanol (IGEPAL) for 2 minutes at 73°C, 2× SSC/0.1% IGEPAL for 1 minute at room temperature, and dehydrated in an ethanol series. Cells were counterstained with 4′,6-diamidino-2-phenylindole and visualized using an Olympus BX-60 and the appropriate fluorescence filters and captured using Quips image analysis software (Vysis Inc/Abbott Molecular). For each sample, 25 cells were viewed and scored according to number of X, Y, and 4 chromosomes present. Human male lymphocytes, prepared from blood, were used as controls.
Immunohistochemistry
Immunohistochemical analysis was carried out on fetal membrane sections in order to investigate the localization of MSC populations. Immunostaining was performed using the antibodies described in Table 1, a Histostain-Plus Broad Spectrum Kit and either chromogen AEC or chromogenic substrate DAB. Methodology was as described by Murthi et al 46 with the modifications described by Castrechini et al. 36
Summary of Antibody Marker Staining on Cultured DPMSCs
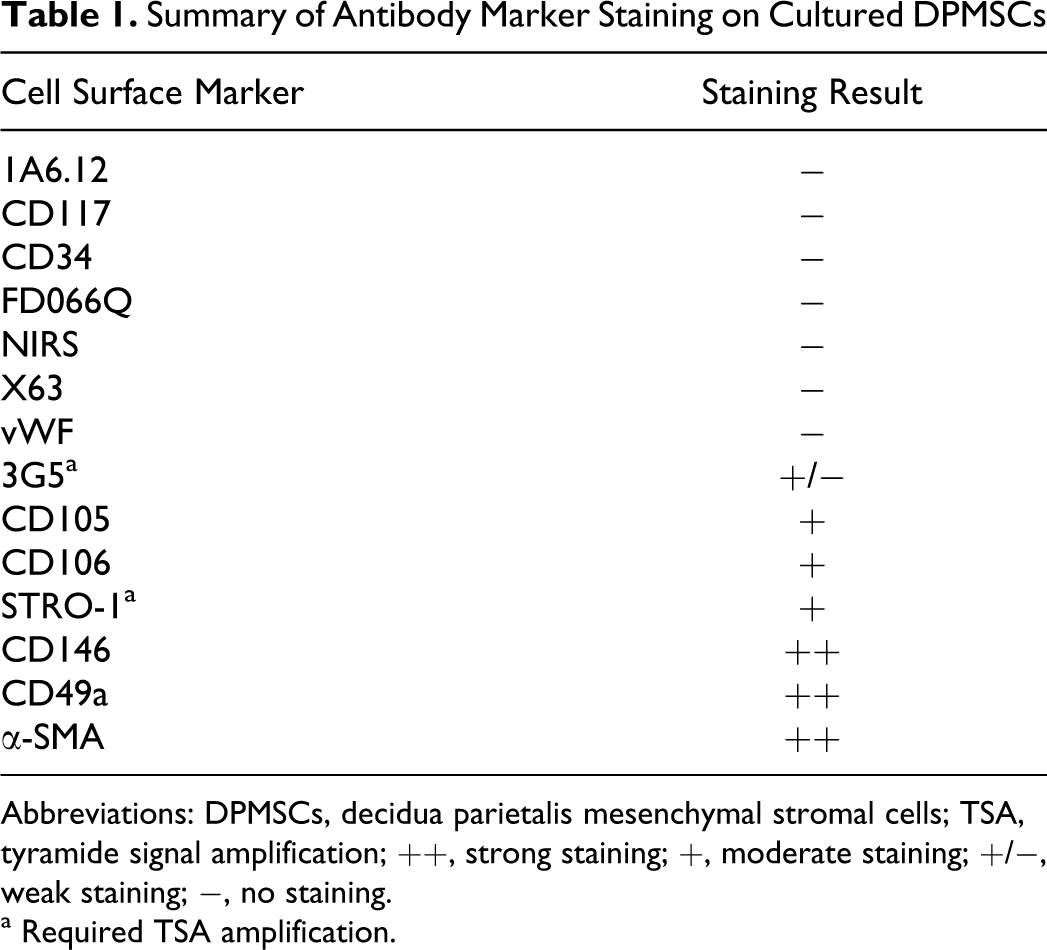
Abbreviations: DPMSCs, decidua parietalis mesenchymal stromal cells; TSA, tyramide signal amplification; ++, strong staining; +, moderate staining; +/−, weak staining; −, no staining.
a Required TSA amplification.
Immunofluorescence
Frozen fetal membrane sections (5 μm thick) were cut and transferred onto Superfrost Plus slides (Menzel-Glaser, Lomb Scientific, Thermo Fisher, Scoresby, Victoria, Australia). Rabbit polyclonal anti-human vWF was added together with the following murine primary antibodies: 3G5, STRO1, and CD146. This was followed by addition of secondary antibodies, goat anti-rabbit Cy3 (Invitrogen, Mulgrave, Victoria, Australia, 0.67 mg/mL) and biotinylated anti-mouse (DakoCytomation, Campbellfield, Victoria, Australia, 5.6 mg/mL). A TSA kit (Perkin Elmer) was utilized to amplify 3G5 and STRO-1 antibodies according to the manufacturers’ instructions. Nuclei were counterstained with Hoechst 33342 (Invitrogen). Sections were mounted using fluorescent mounting medium (Dako) and visualized using a fluorescence microscope (Olympus IX81) with appropriate filters and the resulting multicolor image was produced by Cell R software (Olympus, Australia).
Results
Isolation of DPMSCs and CFU-F
The DPMSCs were able to form colonies when seeded at low densities in appropriate media. In this study, a range of media including 20% FBS/α-MEM, 10% FBS/α-MEM + gelatin coating, 10% FBS/α-MEM + fibronectin coating, 10% FBS/α-MEM, 10% human serum/α-MEM, 10% FBS/α-MEM–
Immunocytochemistry With Cell Surface Markers
Immunocytochemistry on isolated DPMSCs (P1-P2) was used to assess expression of cell surface markers and to compare with PMSCs (n = 6 preparations of each). The panel of cell surface markers is described in the Materials and Methods section and the staining intensities are shown in Table 1. Representative images of cell staining are shown in Figure 1. The DPMSCs stained positively with stem cell surface markers 3G5, CD105, CD106, STRO-1, CD146, CD49a, and α-SMA. The DPMSCs were negative for 1A6.12, CD117, CD34, FDOQ66, NIRS, X63, and vWF. The cell surface marker expression profile for DPMSCs (Figure 1) was found to be qualitatively similar to PMSCs. Notably, at P0, DPMSCs were negative for vWF antibody staining (Figure 1N) but, PMSC cultures contained contaminating endothelial cells as detected by vWF staining (Figure 1M). However, by P1, all PMSCs were negative for vWF (data not shown). All subsequent experiments were performed with cells from passages P1-P2.
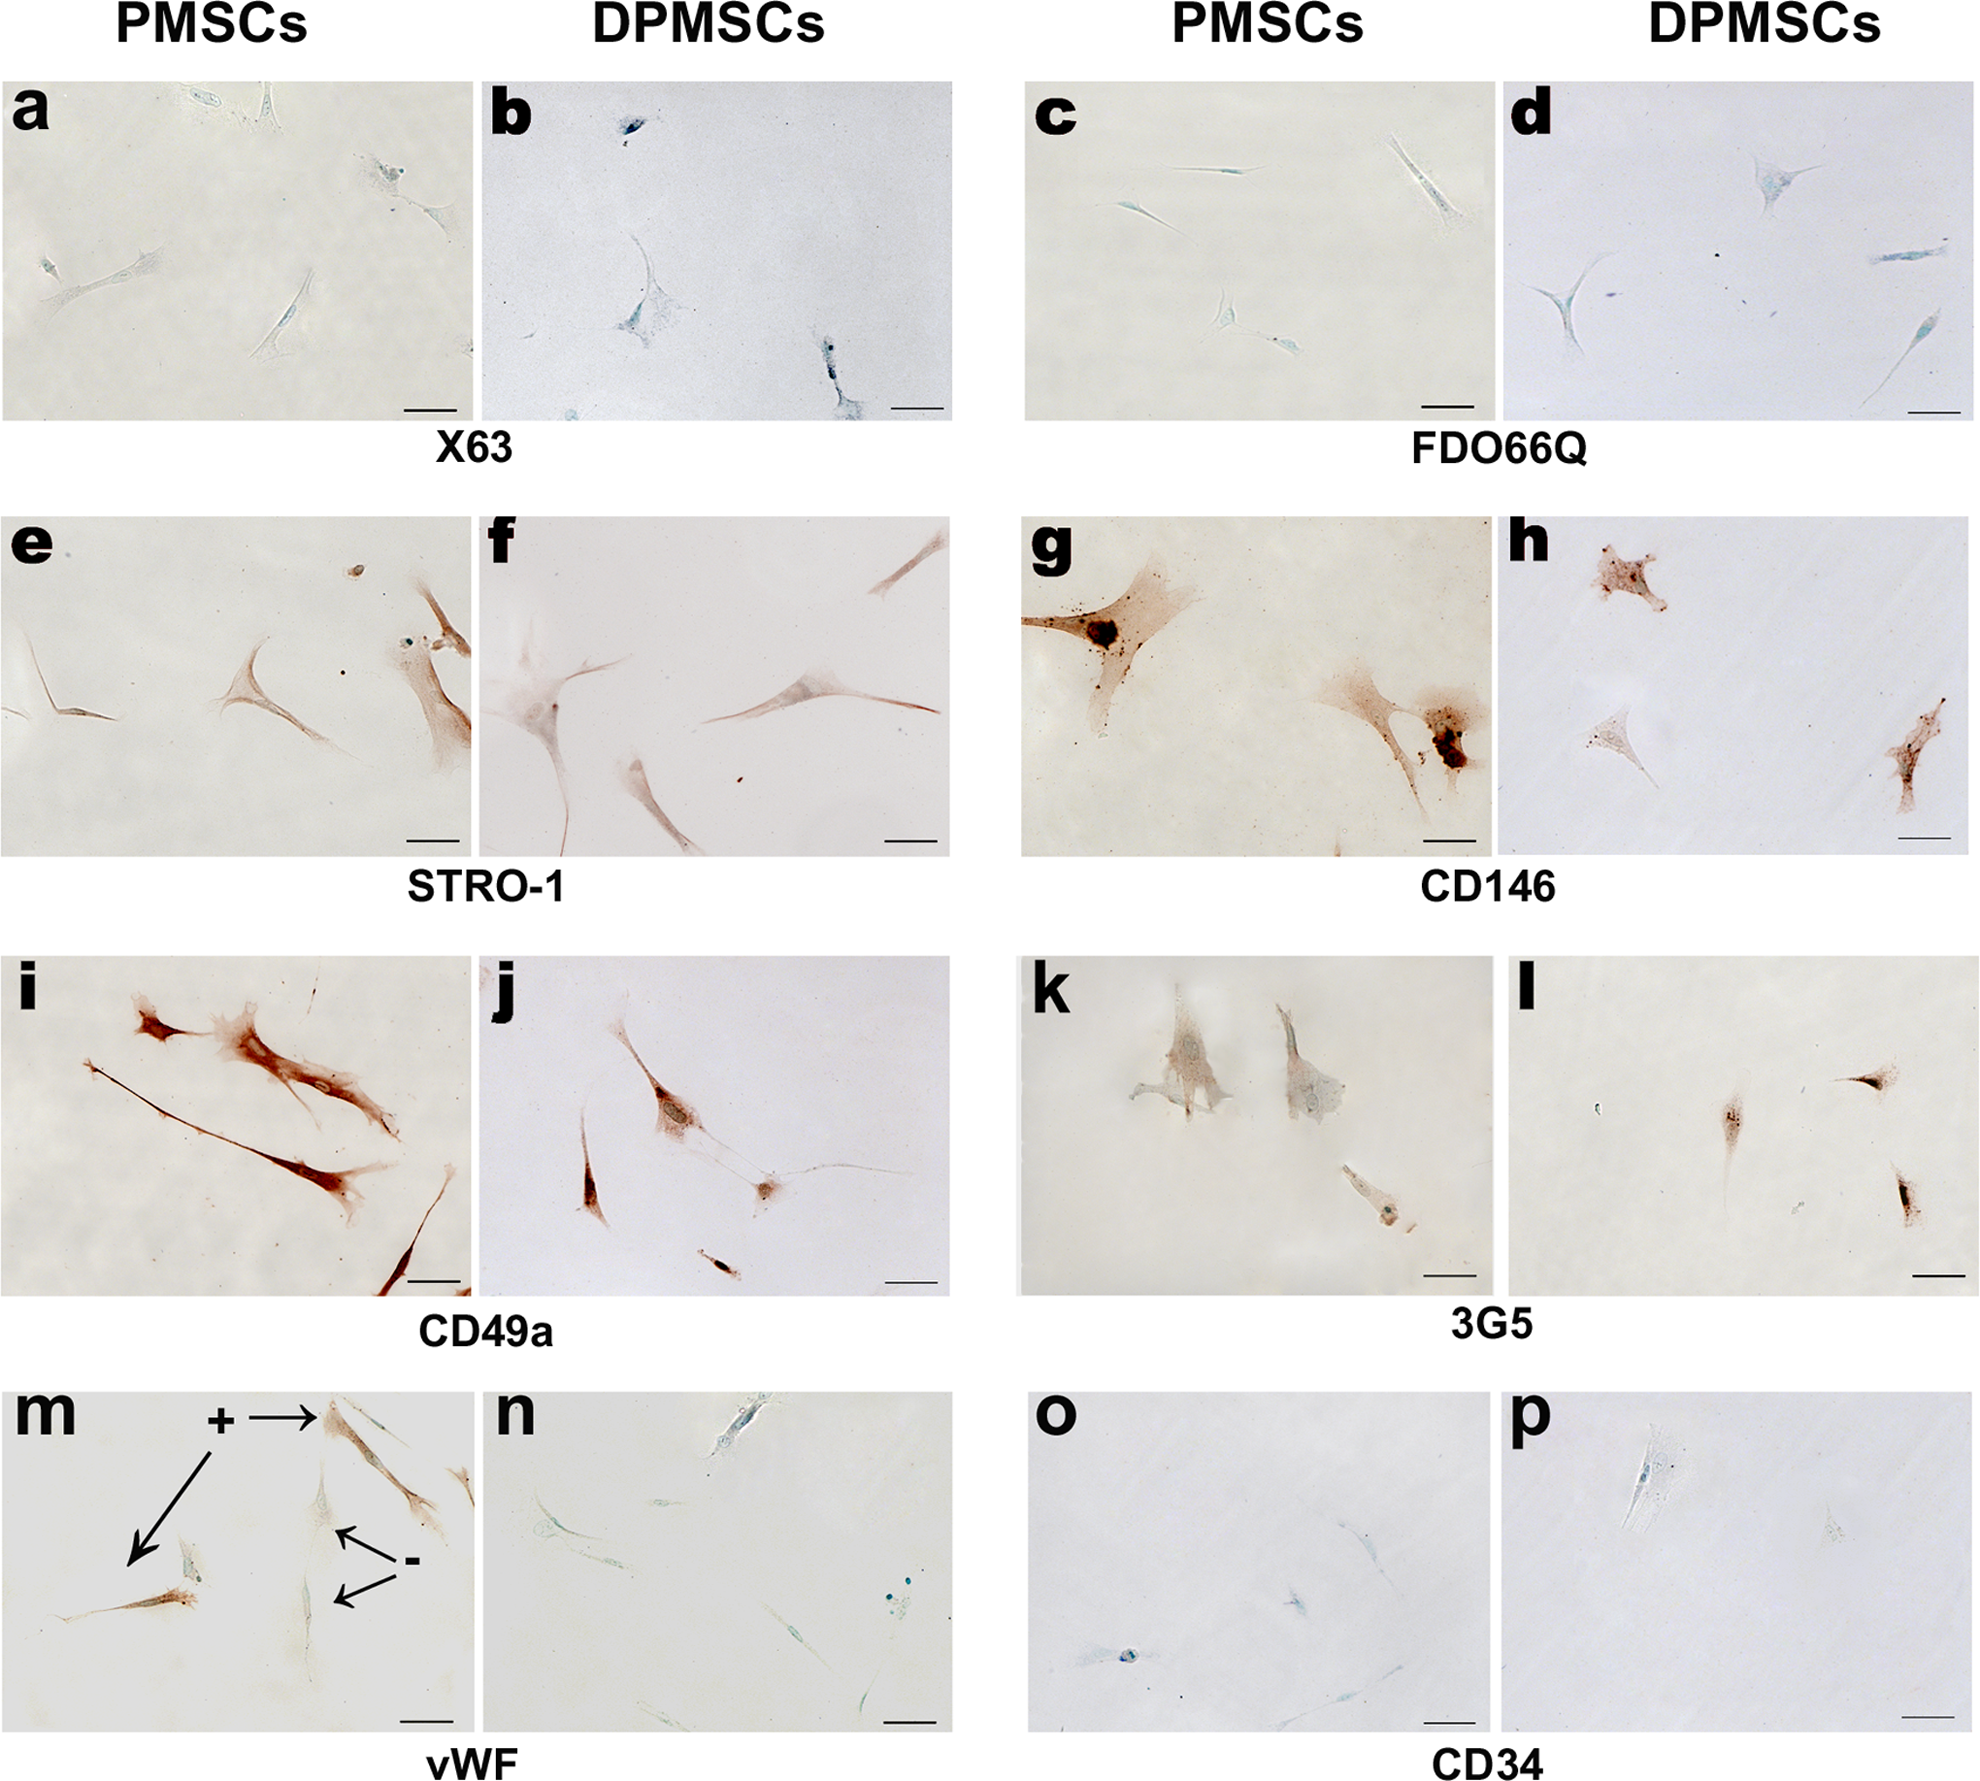
Imunocytochemical staining of adherent PMSCs (A, C, E, G, I, K, M, and O) and DPMSCs (B, D, F, H, J, L, N, and P) at P0 is shown. Cells were negative for control cell surface markers X63 (A and B), trophoblast cell marker FDO66Q (C and D), and endothelial cell marker CD34 (O and P). A proportion (<10%) of freshly isolated PMSCs at P0 were positive for vWF (M), but DPMSCs at P0 were negative (N). Both PMSCs and DPMSCs were immunoreactive to cell surface markers STRO-1 (E and F), CD146 (G and H), CD49a (I and J), and 3G5 (K and L). Staining patterns and cell morphology were similar for both PMSCs and DPMSCs. Color detection was performed using either AEC with methyl green counterstain. Magnification was ×200 and scale bar represents 50 μm. Staining was carried out on 6 independent preparations of PMSCs and DPMSCs. AEC indicates 3-amino-9-ethyl-carbazole; DPMSCs, decidua parietalis mesenchymal stromal cells; PMSCs, parietalis MSCs, vWF, von Willebrand factor.
Flow Cytometry Analysis of DPMSCs
Flow cytometry analysis of DPMSCs showed uniform expression of MSC cell surface markers with 94.88% ± 1.51% of the DPMSCs being positive for CD105 and CD73, and negative for the leukocyte common antigen CD45 as determined by 3 color flow cytometry (Figure 2).
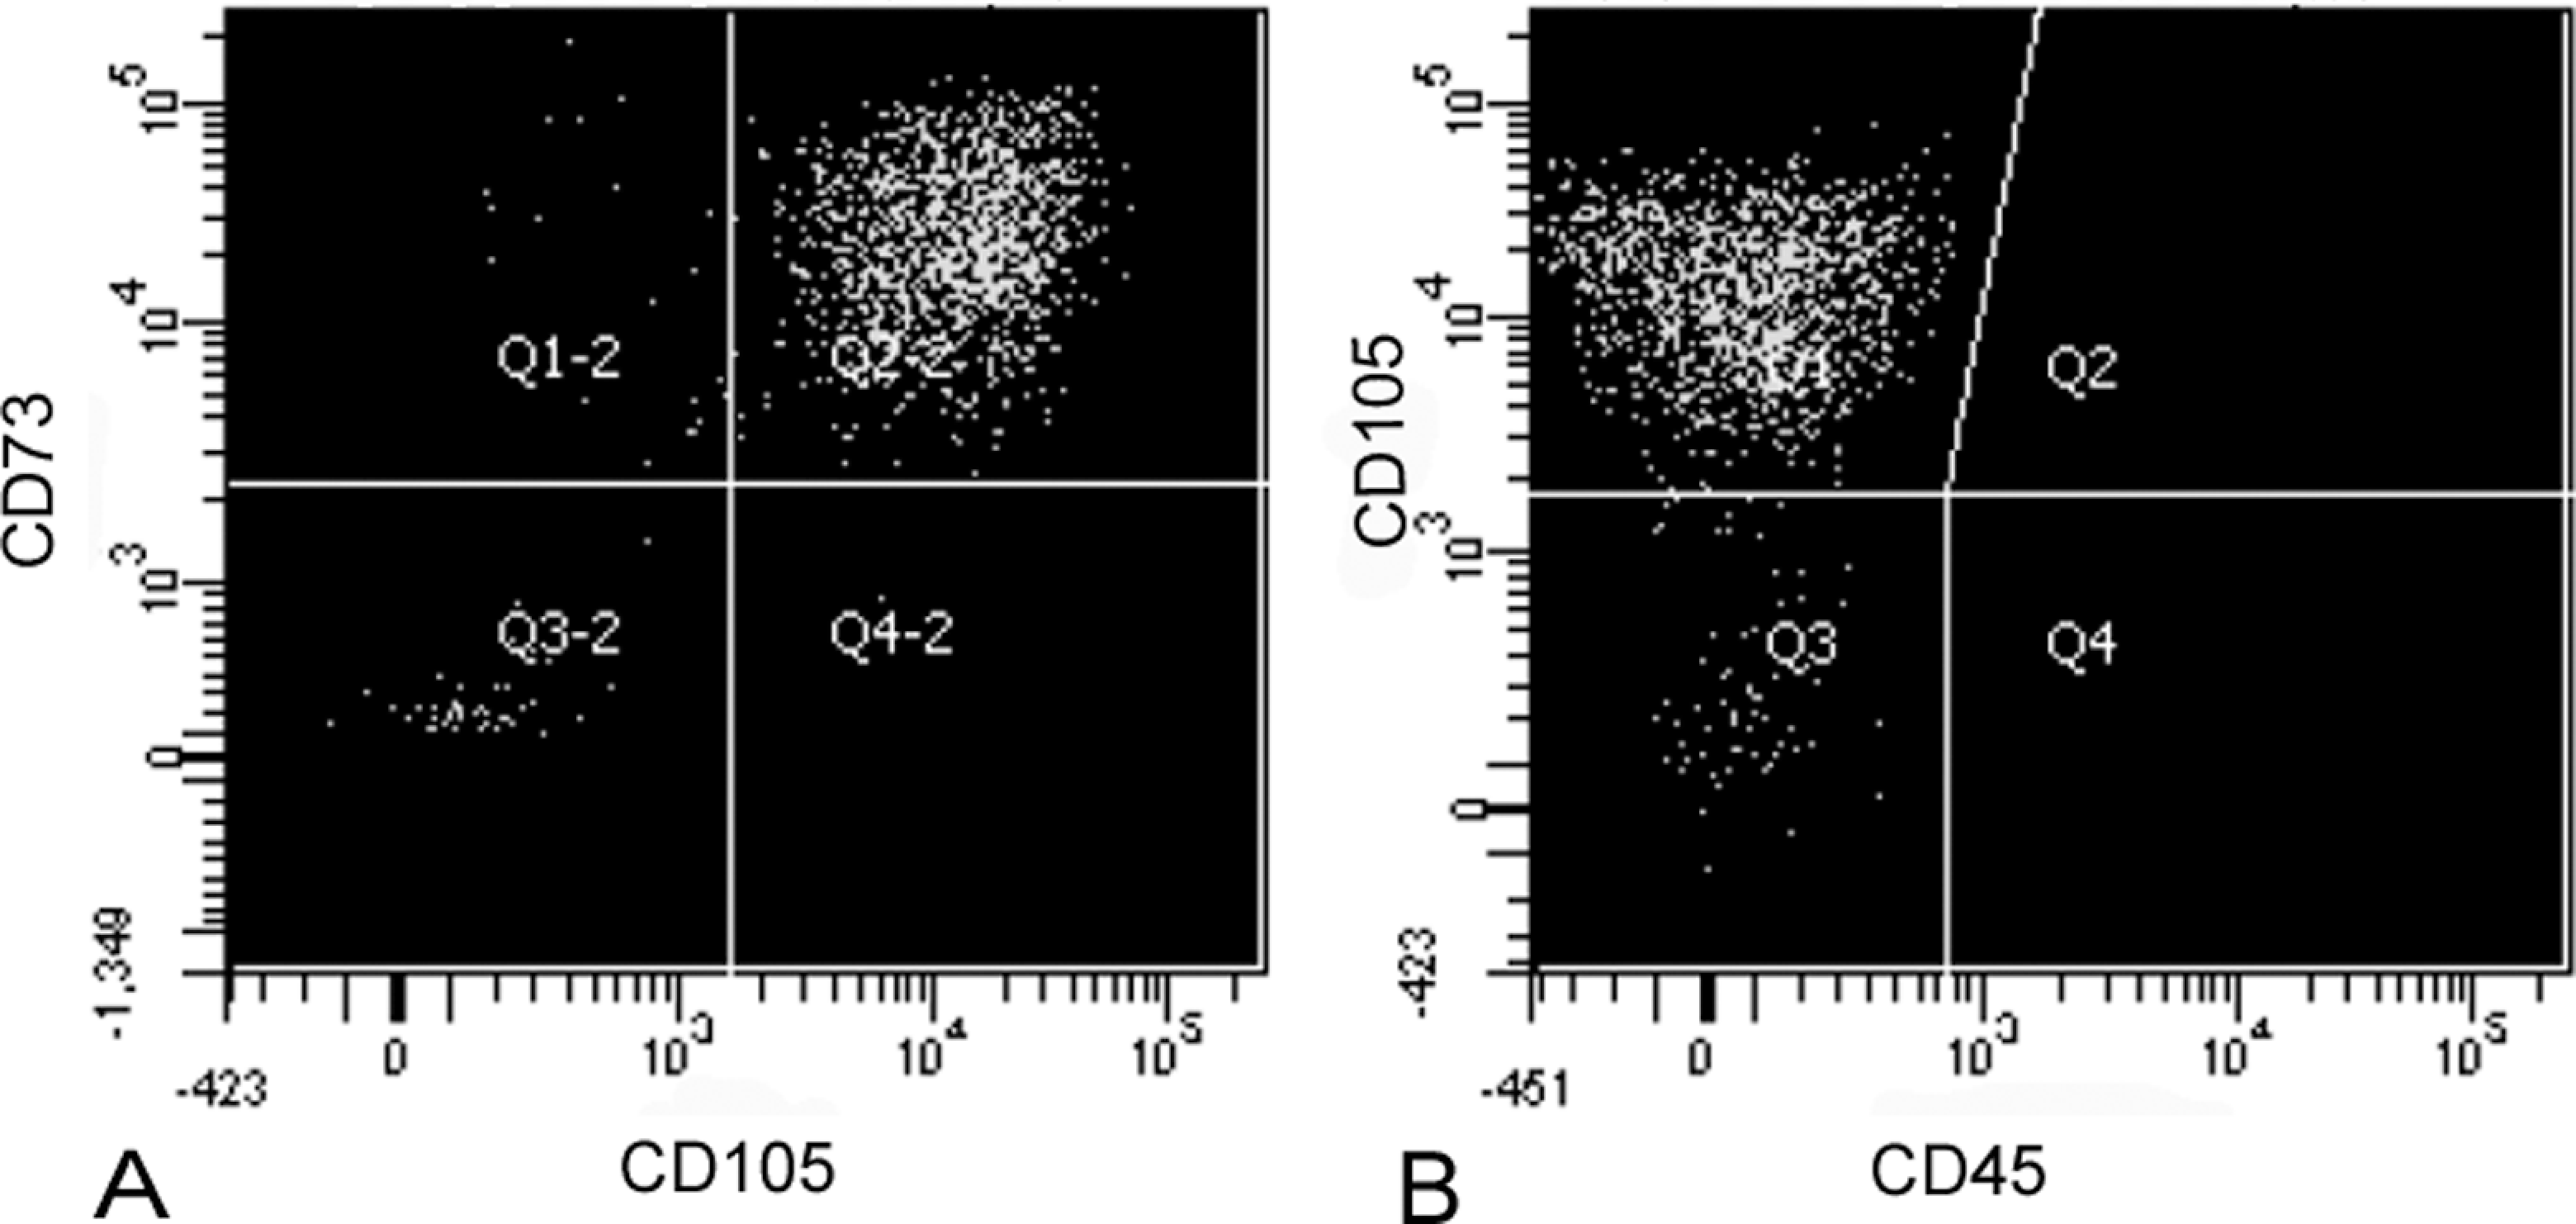
Flow cytometry analysis of DPMSCs. The DPMSCs were stained with CD105APC, CD73PE, and CD45 APC-Cy7. The DPMSCs show expression of CD105 and CD73 (A), but lack expression of CD45 (B). Plots are representative of 4 individual experiments. DPMSCs indicates decidua parietalis mesenchymal stromal cells.
Differentiation of DPMSCs into Osteocytes, Adipocytes, and Chondrocytes
The DPMSCs were assessed for multilineage differentiation potential and mesenchymal lineage characteristics by assessing their ability to differentiate into osteoblasts, adipocytes, and chondrocytes following incubation with the appropriate differentiation media. Cells stained positively for Alizarin Red, Oil red O, and Alcian Blue when compared with controls, indicating differentiation into osteocytes, adipocytes, and chondrocytes, respectively (Figure 3). Cells could be passaged 5 times (about 30 generations) without the loss of multipotency (data not shown).
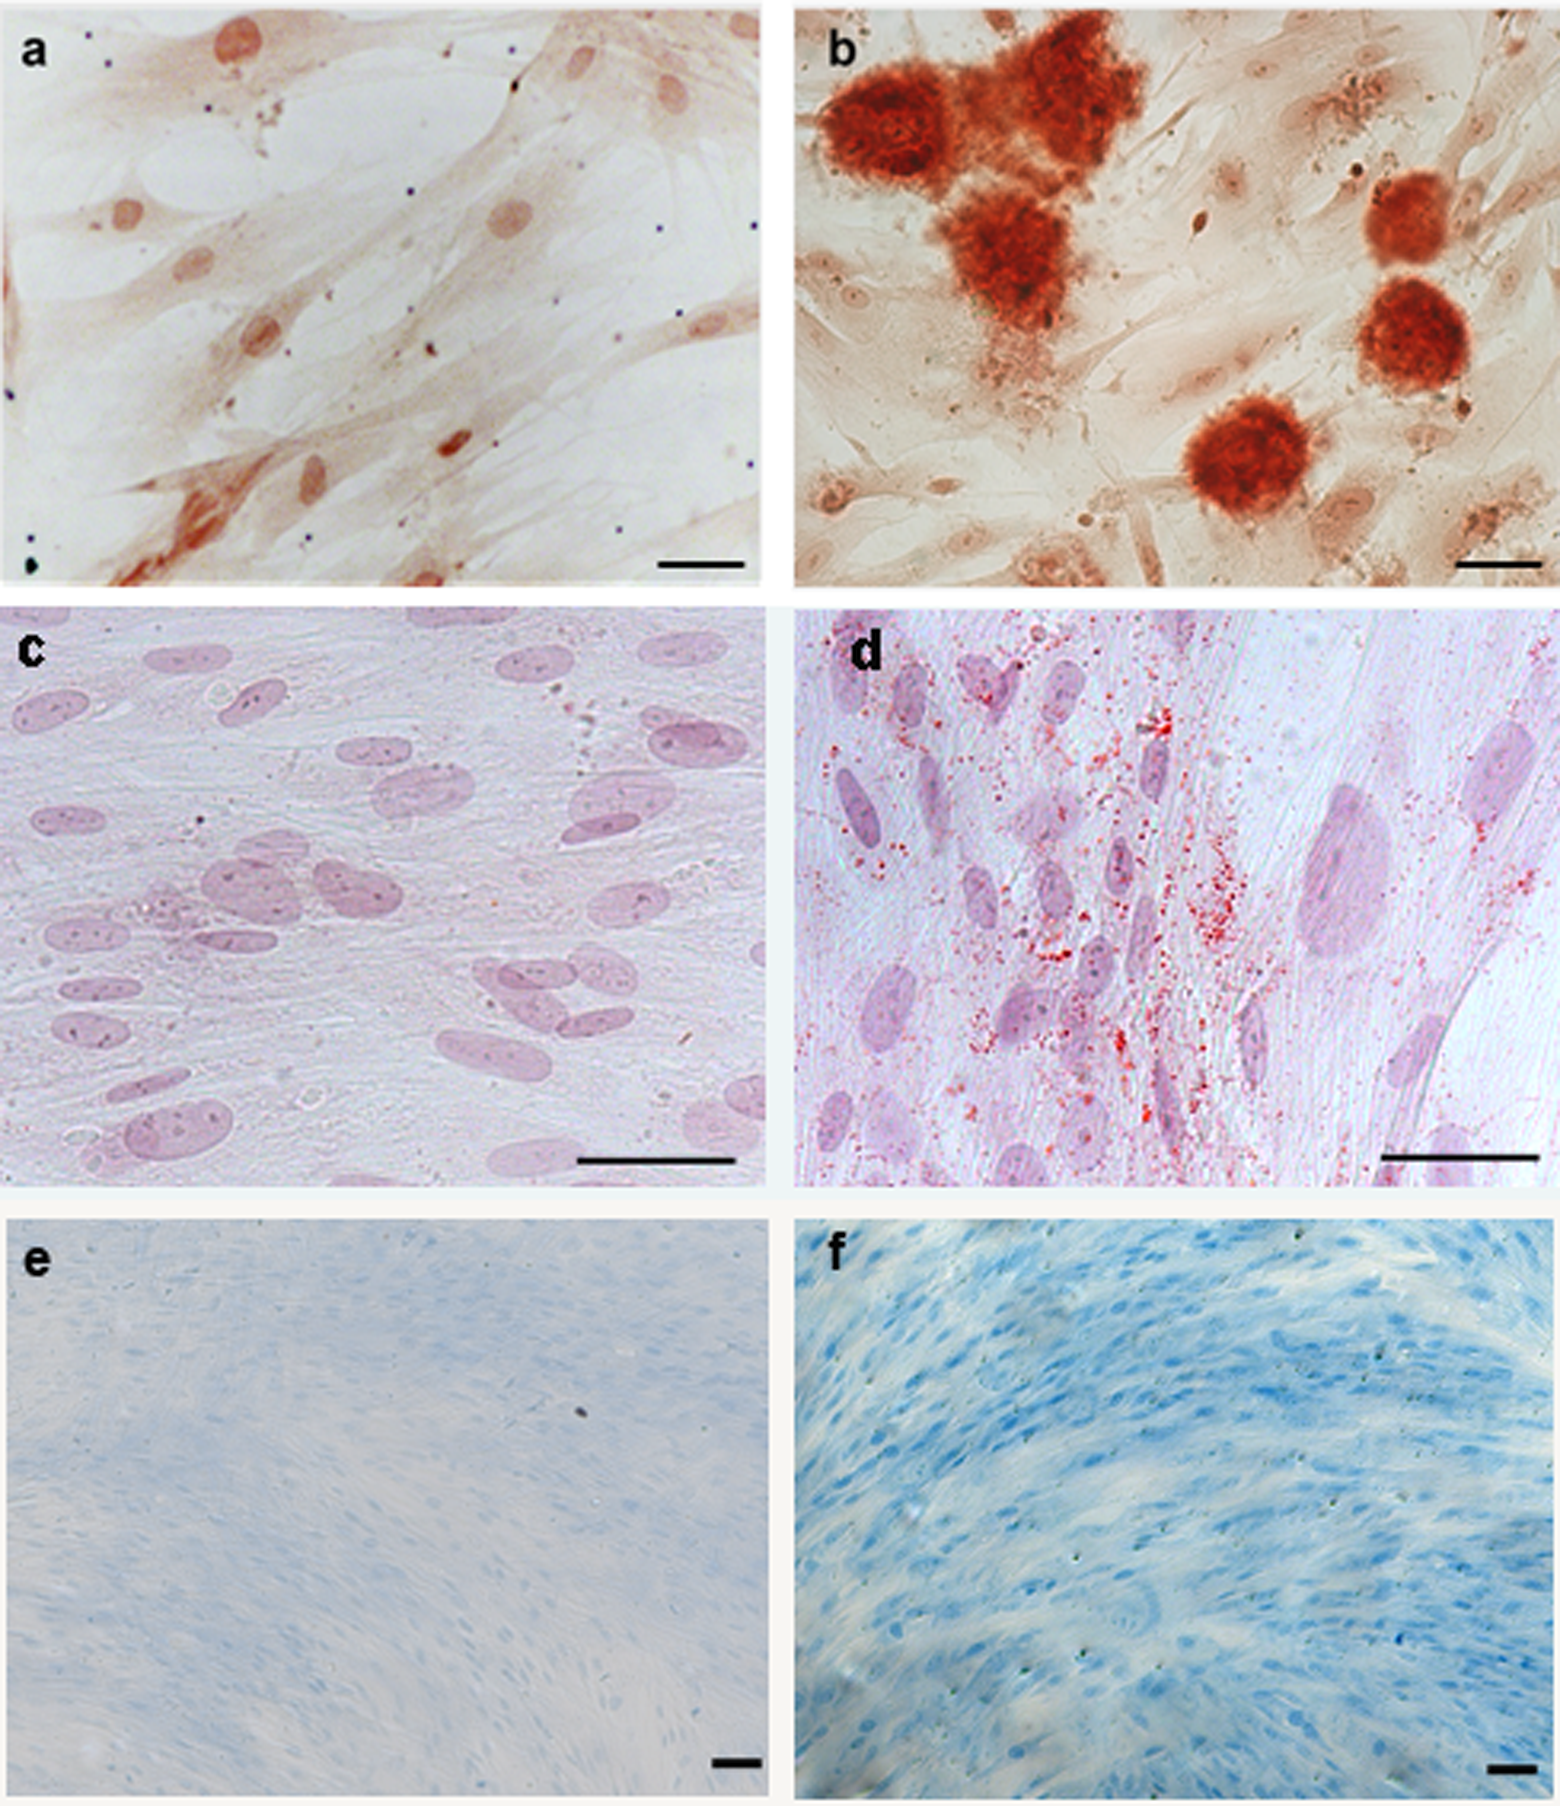
The DPMSCs were differentiated into osteoblast-like cells (B), adipocytes (D), and chondrocytes (F) with incubation in either osteogenic, adipogenic, or chondrogenic differentiation media, as indicated by positive Alizarin Red, Oil red O, and Alcian Blue staining, respectively. Arrows highlight lipid droplets. Cells were also incubated with α-MEM media (complete) in each plate as a control but did not stain positively with Alizarin Red (A), Oil red O (C), or Alcian Blue (E). Panels A, C, and E show typical fibroblast morphology. Panels B, D, and F show cells with altered morphology. Images are of ×200 magnification (A, B, C, and D) and ×100 magnification (E and F), scale bar represents 50 μm. DPMSCs indicates decidua parietalis mesenchymal stromal cells; MEM, minimum essential medium.
Determination of the Fetal/Maternal Origin of Isolated DPMSCs Using FISH
Fetal membranes from placentae of 4 male and 4 female newborns were used to prepare DPMSCs and determine their fetal/maternal origin. Fluorescence in situ hybridization of interphase nuclei was carried out on DPMSCs using probes for X (Spectrum Orange), Y (Spectrum Aqua), and chromosome 4, which was included as an autosomal control to identify haploidy or polyploidy (Spectrum Green; Figure 4). The DPMSCs from fetal membranes of female newborn were used as controls for XX chromosome staining since all cells must be female (Figure 4A). Male lymphocyte cells were used as XY positive controls (Figure 4B). The results of the test for fetal/maternal origin are represented in Figure 4. As expected, DPMSCs from fetal membranes of female newborn (Figure 4A) showed 2 X chromosomes and 2 chromosome 4 signals. Male lymphocyte control cells (Figure 4B) showed the expected 1 X, 1 Y, and 2 chromosome 4 signals. The DPMSCs from fetal membranes of placentae from male newborns (Figure 4C) showed 2 X chromosomes and 2 chromosome 4 signals. Thus, DPMSCs were of maternal origin and derived from the decidua parietalis component of the choriodecidua.
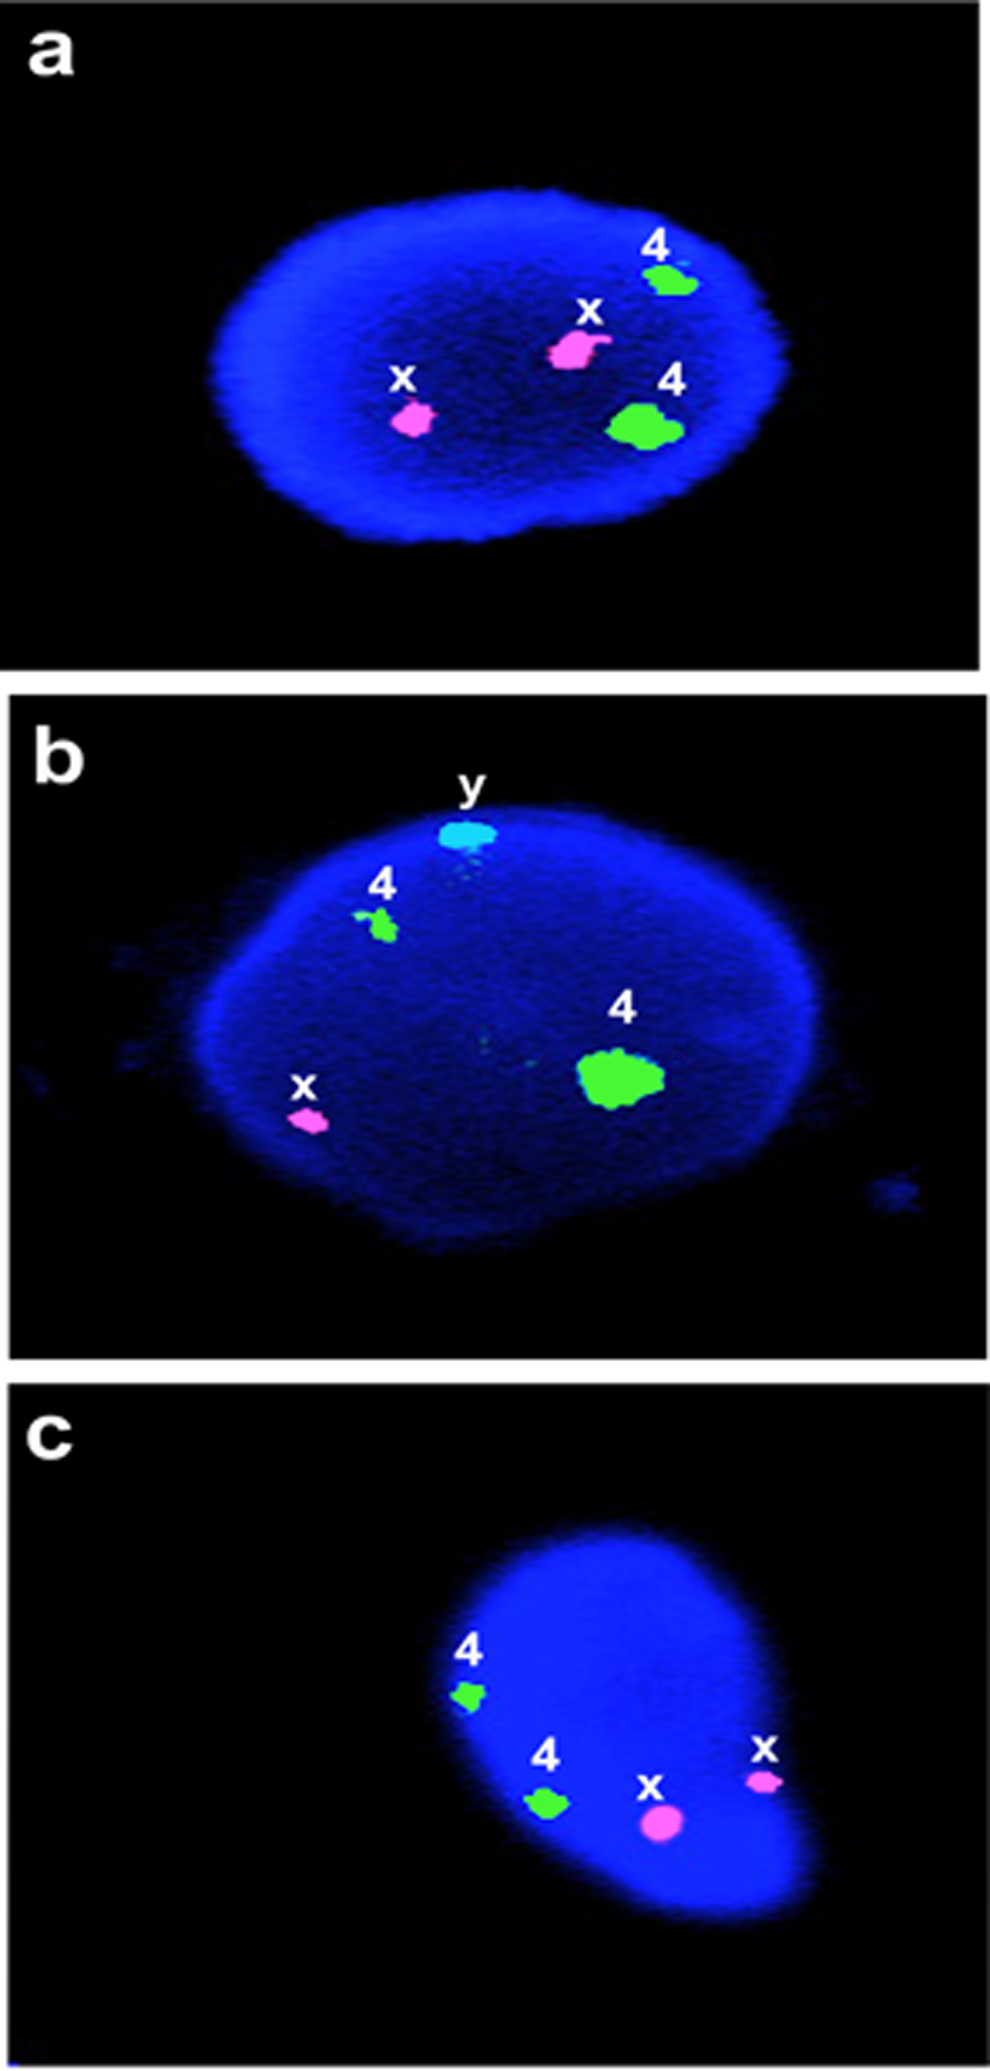
Determination of fetal/maternal origin of isolated DPMSCs using interphase FISH on cell nuclei. Female newborn DPMSCs (A) showed 2 X chromosomes and 2 chromosome 4 signals when isolated from the placentae of male newborns. Male lymphocyte control cells (B) showed 1 X, 1 Y, and 2 chromosome 4 signals. Male newborn DPMSCs (C) showed 2 X chromosomes and 2 chromosome 4 signals. Cell nucleus and signal representation shown for each group. X probe signal is Spectrum Orange, Y probe signal is Spectrum Aqua and chromosome 4 probe signal is Spectrum Green. Magnification is ×1000. DPMSCs indicates decidua parietalis mesenchymal stromal cells; FISH, fluorescence in situ hybridization.
Localization of the Fetal Membrane MSC Niche Using Immunohistochemistry
Six randomly selected, term fetal membrane samples were used for these experiments. Immunohistochemical staining of fetal membranes are shown in Figure 5. The DPMSC cell surface markers STRO-1, 3G5, CD146, and CD49a and controls X63, NIRS, FDOQ66, CD34, and vWF were used. Tissues incubated with control X63 (Figure 5A) and NIRS (data not shown) showed no immunoreactivity in term fetal membrane sections. In term fetal membrane samples, the trophoblast-specific antibody FD066Q showed specific immunoreactivity in the chorionic-trophoblast region (Figure 5B). As expected, endothelial cell markers CD34 and vWF showed positive staining in the endothelial cells of the decidua parietalis vessels (Figure 5G and H, respectively). Antibodies to the stem cell surface markers STRO-1, CD146, CD49a, and 3G5 showed immunoreactivity associated with the decidua parietalis vasculature (Figure 5C, D, E and F, respectively), while an antibody to CD146 showed reactivity with the chorionic trophoblast layer (compare Figure 5B and D). CD49a showed immunoreactivity in scattered cells within the chorionic mesoderm (Figure 5E) but no strong immunoreactivity was detected in the amniotic epithelium or amniotic/chorionic mesenchymal layers for the other cell surface markers. The 3G5 immunoreactivity was detected around the decidua parietalis vasculature (arrows in Figure 4F) and in scattered cells in the decidua parietalis stroma.
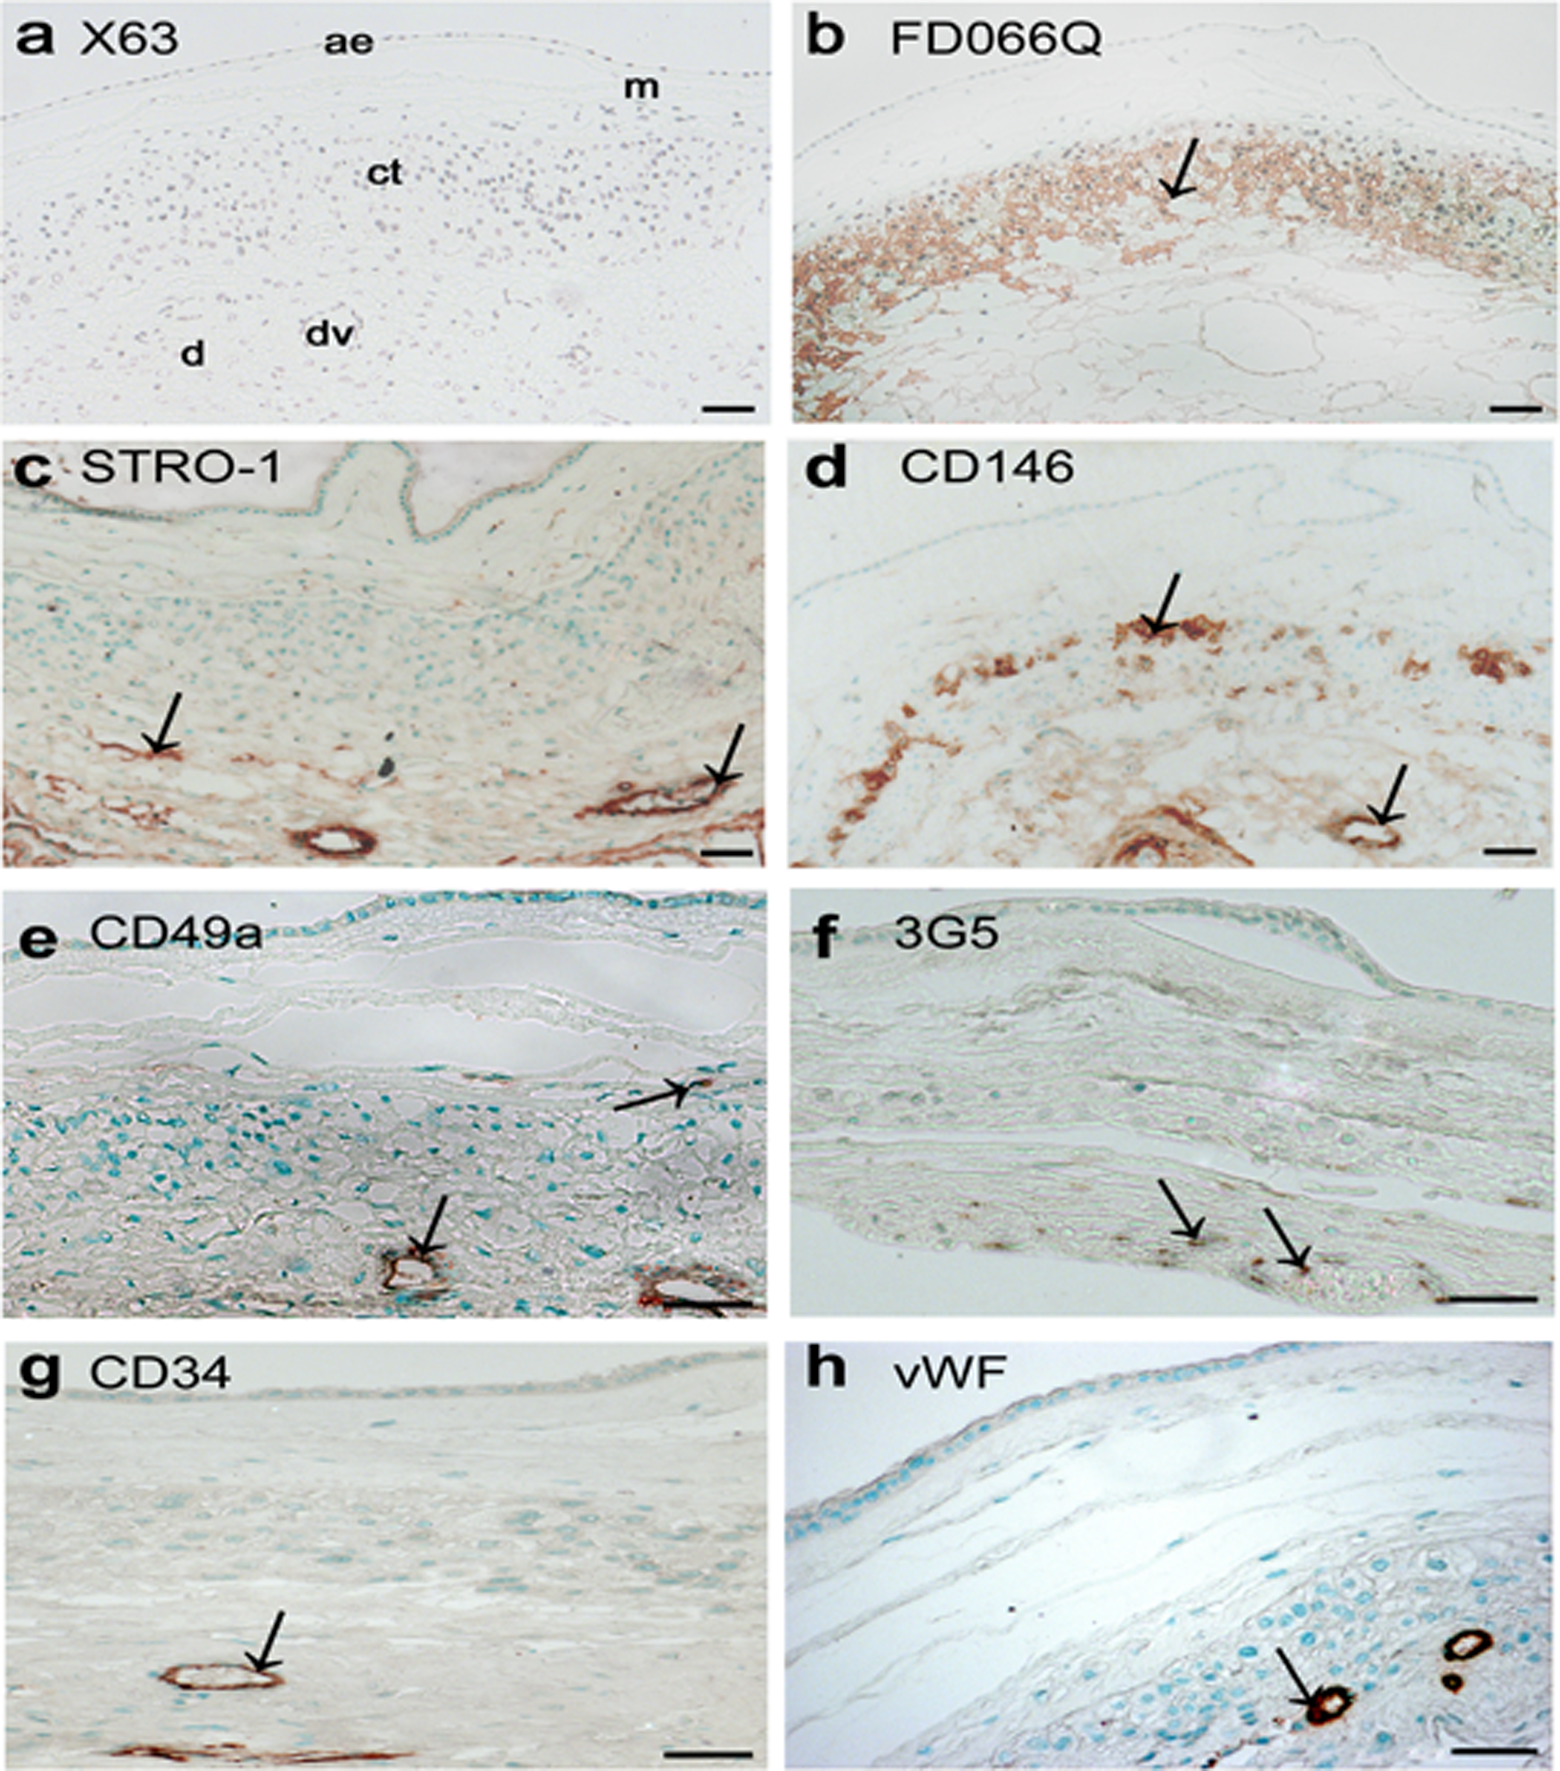
Localization of the DPMSC niche in term fetal membranes using immunohistochemistry. X63 negative control (A) and FDO66Q, a control antibody staining the chorionic-trophoblast layer (B). STRO-1 (C), CD146 (D), CD49a (E), and 3G5 (F) showed antibody staining in the perivascular region of the decidual vessels, and in a subpopulation of chorionic trophoblast cells. Both CD34 (G) and vWF (H) control antibodies detected endothelial cells of the decidual vasculature. Antibodies were used on either paraffin (A, C, D, F, G, and H) or frozen (B and E) sections. Images were ×100 (A, B, C, and D) and ×200 (E, F, G, and H) magnification and the scale bar represents 50 μm. ae indicates amniotic epithelium; a, mesenchyme; ct, chorionic trophoblasts; dv, decidual vessel; d, decidua parietalis. Color detection was performed using either DAB with hematoxylin counterstain (A and B) or AEC with methyl green counterstain (C, D, E, F, G, and H). Staining is represented by arrows. Reactions were carried out on at least 3 different fetal membranes. AEC indicates 3-amino-9-ethyl-carbazole; DAB, 3,3′-diaminobenzidine; DPMSCs, decidua parietalis mesenchymal stromal cells; FISH, fluorescence in situ hybridization; vWF, von Willebrand factor.
Localization of the Fetal Membrane MSC Niche Using Immunofluorescence
Multilabel immunofluorescence was used to investigate the immunoreactivity of STRO-1 and 3G5 with reference to the endothelial-specific marker vWF in vessels of the decidua parietalis. Figure 6A shows the staining of decidua parietalis vessels with vWF antibody alone (Cy3). As seen in Figure 6B, staining with the 3G5 (fluorescein) and vWF (Cy3) antibodies revealed that 3G5 positive cells were located in areas around the blood vessels. Figure 6C shows positive α-SMA staining (fluorescein) in cells around the vessel wall but, as was the case for 3G5, there was no overlap in expression with vWF (Cy3), which is evident from the lack of yellow signal. Figure 6F is a composite image of vWF and STRO-1 immunoreactivity, which shows substantial overlap of the two signals on a large vessel (∼150 µm). Some perivascular cells were detected that expressed only STRO-1. Similar overlap in STRO-1 and vWF expression was detected in smaller vessels (∼50 μm; Figure 6I). The CD146 immunoreactivity (Figure 6l) was primarily perivascular, with some overlap with the vWF signal.
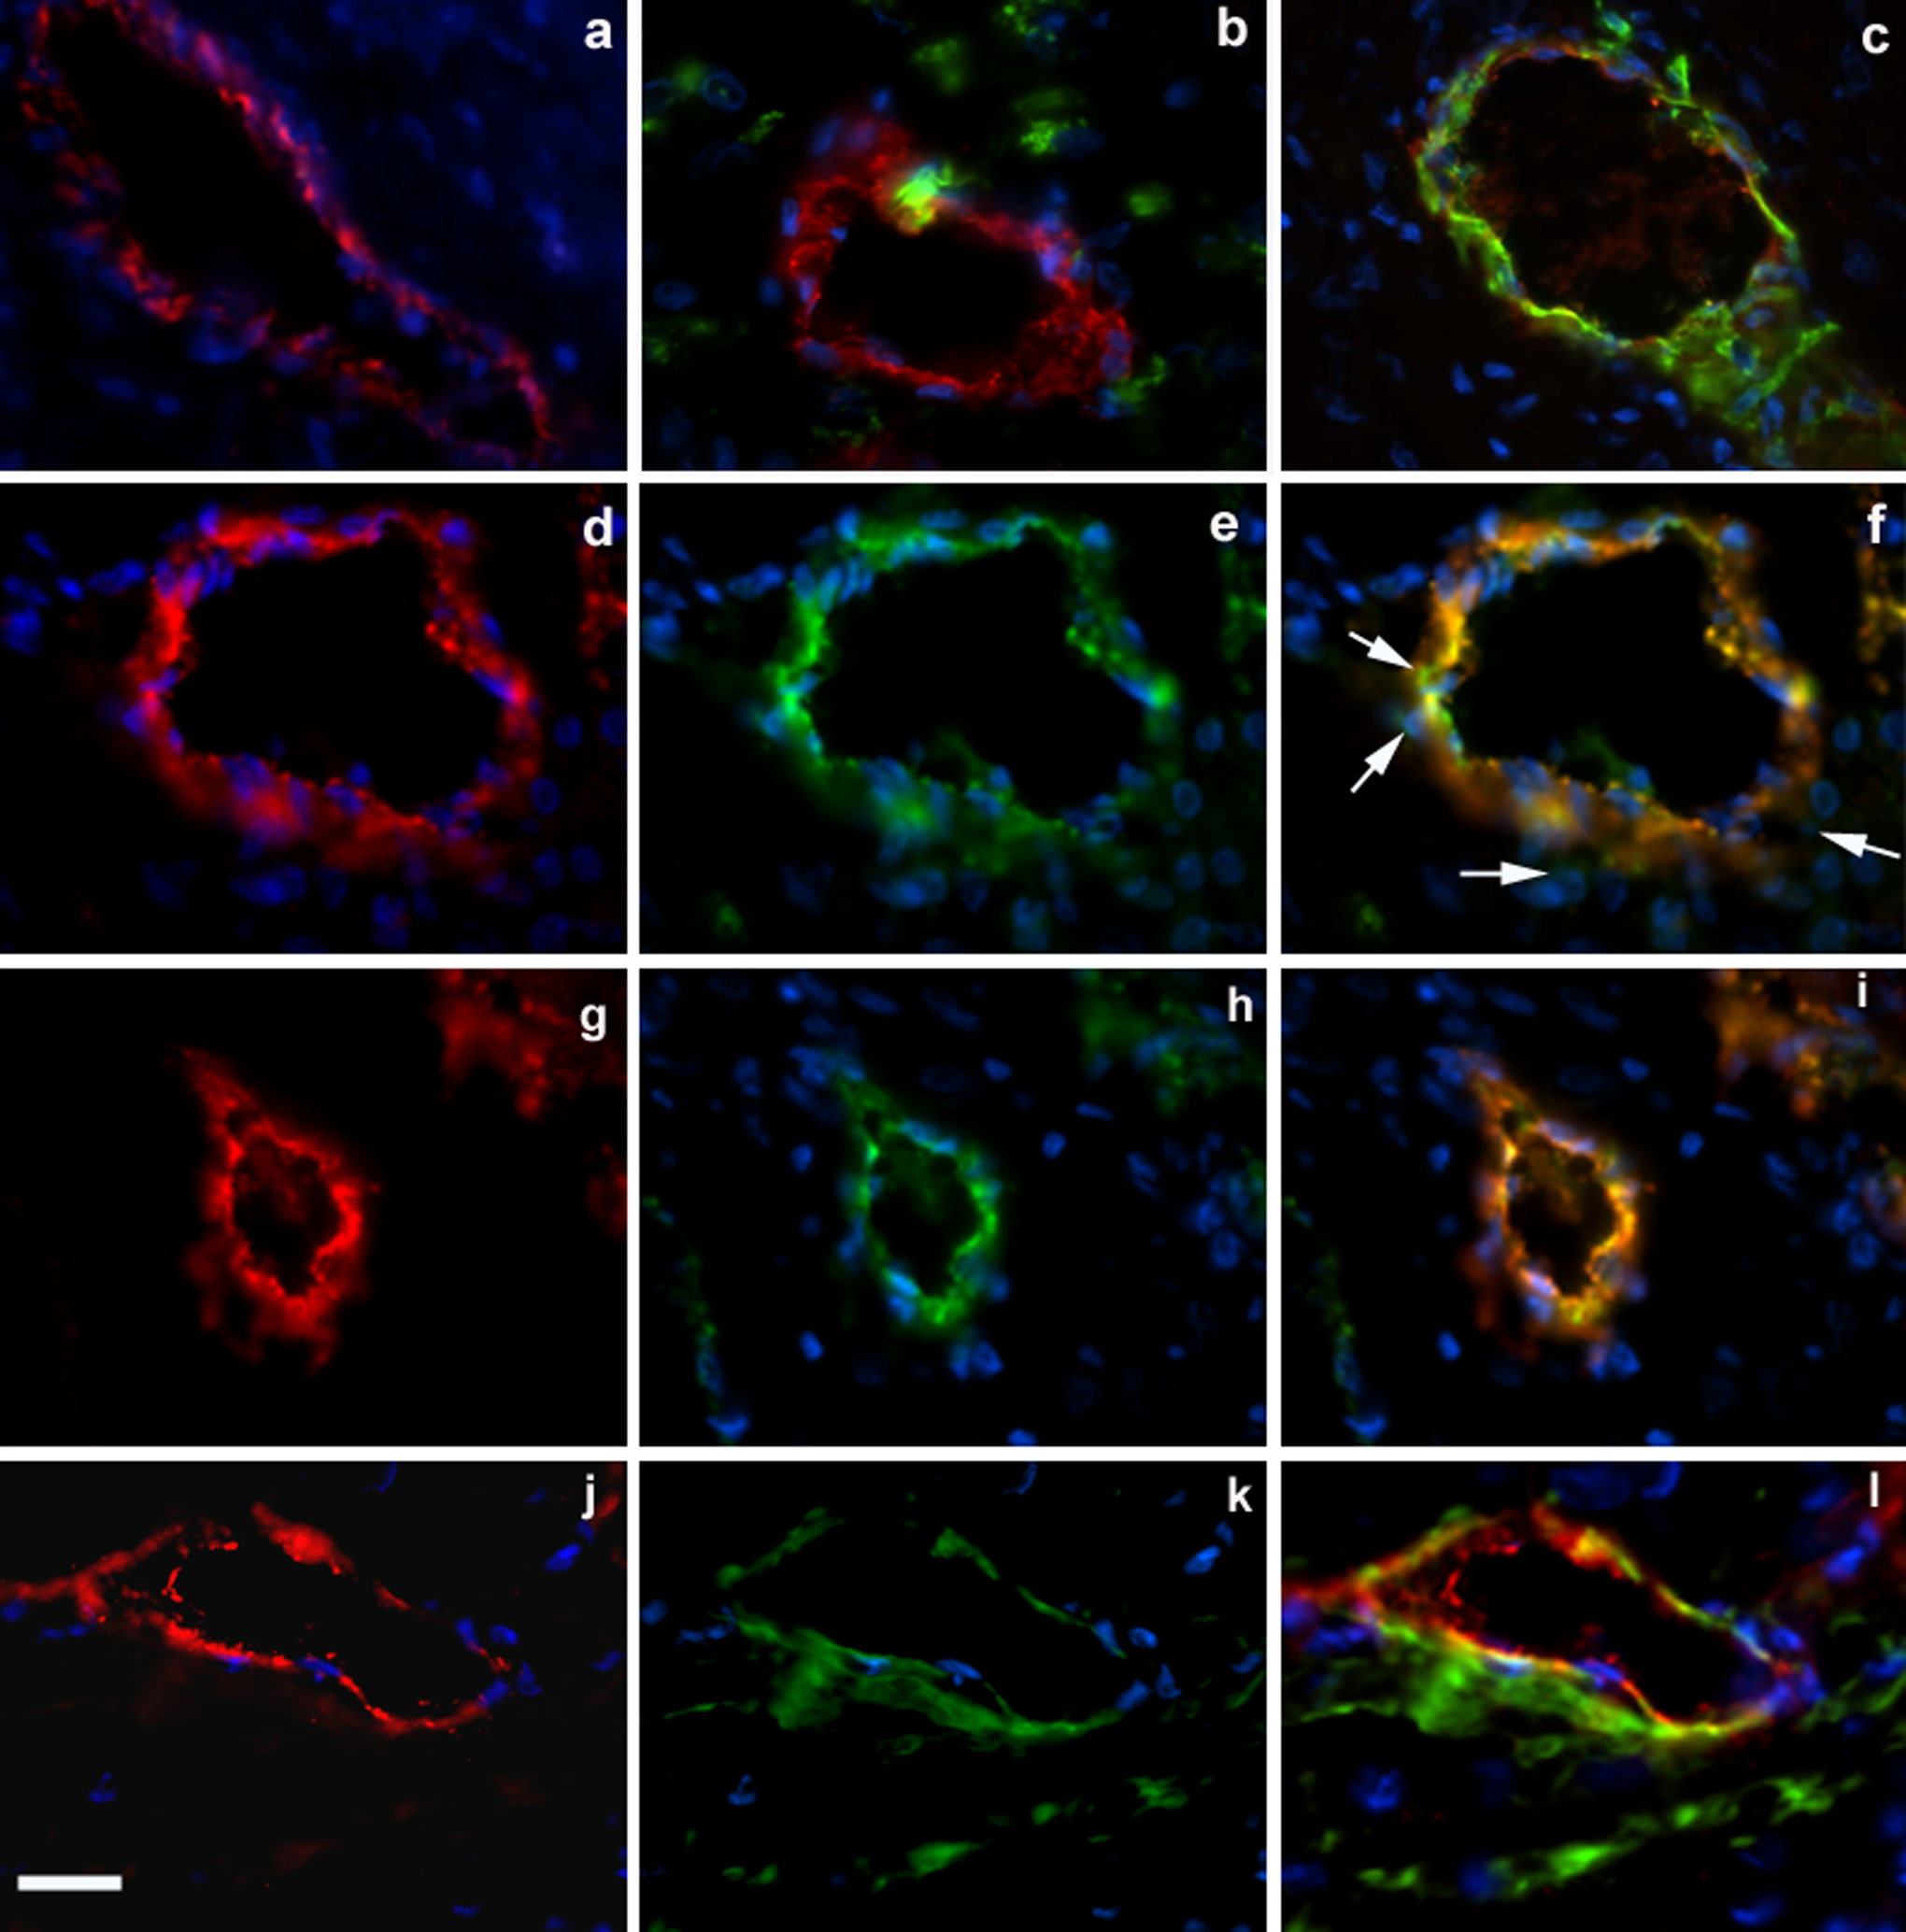
Immunofluorescence detection of cell surface markers for DPMSCs on frozen, term fetal membranes sections is shown. Staining around decidual vessels at ×600 magnification is shown. Nuclear DNA within cells in all sections was detected by staining with Hoechst (A-L). Control with vWF antibody detection with Cy3 fluorescence (A), 3G5 and vWF antibody detection with fluorescein and Cy3 fluorescence, respectively (B), α-SMA staining and vWF antibody detection with fluorescein and Cy3 fluorescence, respectively (C). Panel (D) shows a large vessel (∼150 μm) and vWF antibody detection with Cy3. Panel (E) shows the same vessel with STRO-1 antibody detection using fluorescein. Panel (F) shows the composite staining pattern for vWF (Cy3) and STRO-1 (fluorescein). White arrows show STRO-1 fluorescein signal which does not overlap with vWF Cy3 signal. Panel (G) shows a smaller vessel (∼50 μm) and vWF antibody detection with Cy3. Panel (H) shows the same vessel with STRO-1 antibody detection using fluorescein. Panel (I) shows the composite staining pattern for vWF (Cy3) and STRO-1 (fluorescein). Panel (J) shows a large vessel (∼100 μm) and vWF antibody detection with Cy3. Panel (K) shows the same vessel with CD146 antibody detection using fluorescein (L) CD146 and vWF antibody detection with fluorescein and Cy3, respectively. Reactions were carried out on at least 3 different fetal membranes. Magnification is ×600, scale bar is 50 μm. DPMSCs indicates decidua parietalis mesenchymal stromal cells; vWF, von Willebrand factor.
Discussion
Isolation of DPMSCs, CFU-F Assays, and Differentiation
The DPMSCs were successfully cultured from term fetal membranes following collagenase IV and dispase enzymatic disaggregation of the tissue. 2,4,17,20 We have previously used a similar approach to isolate PMSCs from human placental tissue. 36 The DPMSCs were isolated with a >90% success rate, with DPMSCs able to form colonies when seeded at low densities. As demonstrated for other MSC populations derived from fetal membranes 18 and from placental chorionic villi, 36 we found that culture of DPMSC in 20% FBS/α-MEM resulted in the highest clonogenic efficiency, and the clonogenic efficiency was higher than that of PMSCs.
Cell Surface Marker Expression of DPMSCs
Isolated DPMSCs were characterized using a variety of different cell surface markers. Consistent with other studies, DPMSCs stained positively with stem cell markers CD105, STRO-1, and α-SMA 4 ,17,20,29 and negatively for endothelial/hematopoietic stem cell marker CD34. 17 The marker expression profile for DPMSCs was similar to that of PMSCs. 36 Cells were negative for the trophoblastic marker FD066Q, endothelial marker vWF, and hematopoietic stem cell marker CD117. The DPMSCs expressed the pericyte-associated antigens 3G5, STRO-1, α-SMA, and CD146 and expression of pericyte-associated antigens by cultured DPMSCs was consistent with the notion that DPMSCs may be derived from pericyte cells. 47 ,48 Most important was that DPMSCs were immunoreactive for the CFU-F enriching markers 3G5, STRO-1, CD146, and CD49a. Thus cultured DPMSCs express cell surface markers characteristically associated with mesenchymal stem cells, pericytes, and cell surface markers used to enrich the CFU-F population.
Flow Cytometry, Differentiation, and Fetal/Maternal Origin of DPMSCs
Flow cytometry analysis showed that DPMSCs were enriched for cells positive for CD105 and CD73 negative for CD45. These cell surface markers are used to identify MSCs. 49 Like other MSC populations, DPMSCs exhibited multilineage differentiation potential and were successfully differentiated into adipocytes, osteocytes, and chondrocytes with specific stimulatory media supplements.
The MSCs of mixed fetal/maternal origin have been reported from second trimester decidua and third trimester decidua basalis. 4 As described above, fetal membranes are reported to contain MSCs of both fetal (AMSCs and CMSCs) 14,16 and maternal origin (DPMSCs). 4 ,20 As such, establishing the fetal/maternal origin of the DPMSCs was highly important. Our studies suggest that DPMSCs from fetal membranes of male newborns contained 2 X chromosomes (Figure 4C), indicating that they were of maternal origin and derived from the decidua parietalis component of the fetal membranes.
The DPMSC Niche
Immunocytochemical analysis revealed DPMSCs express cell surface markers characteristically associated with MSCs and pericytes, as well as cell surface markers used to enrich CFU-F populations. Cell surface markers 3G5, STRO-1, and CD146 have been used successfully to identify the MSC niche in a variety of human tissues including dental pulp and adipose tissue. 25 ,28 Immunohistochemistry on term fetal membranes showed staining for STRO-1, 3G5, and CD146 around the vessels of the decidua parietalis, which ranged from 50 to 150 μm in diameter.
In the chorionic trophoblast, CD146 showed immunoreactivity but other antibodies were negative. Scattered cells in the chorionic mesoderm were immunoreactive for CD49a. The cell surface markers used in this study were not sufficient to identify the MSC niche in the avascular amniotic or chorionic mesoderm.
More detailed analysis of the staining pattern around the vessels necessitated the use of immunofluorescence on frozen sections. The 3G5 gave the most discrete staining in scattered perivascular cells as well as cells within the tunica media. The CD146 showed perivascular expression as well as expression in the tunica media, but there was some overlap in expression with vWF-positive endothelial cells. The STRO-1 expression overlapped substantially with vWF expression and only a few individual perivascular cells were detected.
The overlapping staining of STRO-1 with vWF-positive cells in the endothelium was unexpected and differed from the immunofluorescence results obtained for STRO-1 and vWF in placental villi, where vWF staining did not overlap with STRO-1. 36
Consistent with our observation, immunofluorescence studies with STRO-1 and endothelial-specific antibodies in other tissues, including human adipose tissue, revealed that STRO-1 expression was highly specific for endothelial cells in adipose tissue arterioles and capillaries, but not in arteries 50 ,51 and only in some veins. 51 In our study, vessels of 50 to 150 μm in diameter were predominant in the decidua parietalis and exhibited STRO-1 and vWF colocalization. Additional evidence of significant overlapping STRO-1 and vWF factor-staining cells in the endothelium of central and pulmonary veins of the liver and lung, respectively, has been recently provided. 52 In this same study, Western blot analysis on a variety of cell types provided evidence that STRO-1 was a 75-kD endothelial antigen. 52 The CD146 is predominantly a marker for endothelium, but like STRO-1, CD146 is also an MSC and pericyte cell surface marker that can be used to enrich the CFU-F. 53 ,54 Moreover, our results suggest that there is an overlap between CD146 and vWF staining in decidua parietalis vessels. Thus, in the decidua parietalis, we can identify a vascular niche for cells that express the stem cell markers STRO-1 and CD146.
The origin of MSCs remains controversial and while the prevailing notion is for a perivascular origin, principally pericytes, for MSCs 55 –57 others have proposed an endothelial origin for MSCs. 58 Our data supports a “vascular stem cell niche” in the decidua parietalis similar to that described for the adipose tissue-derived stem cell niche. 50 Lin et al 50 proposed that vascular stem cells in tissues are at various stages of differentiation toward becoming smooth muscle and endothelial cells. Those cells at early stages of differentiation have the potential to differentiate into tissue-specific cell types in their native tissues. When these cells are cultured in vitro as MSCs, they can be induced to form additional cell types (eg, chondrocytes and osteocytes). Thus, DPMSCs could be derived from vascular stem cells at early stages of differentiation. Clearly, the origin of DPMSCs is of importance and warrants further studies.
Footnotes
Acknowledgments
We acknowledge the patients who consented to provide their samples, the clinicians for their analysis of medical records and research midwives Sue Nisbet and Sue Duggan for sample collection. There are no conflicts of interest with respect to the authors of this work.
Authors’ Note
The authors N. M. Castrechini and P. Murthi contributed equally to this work.
Declaration of Conflicting Interests
The authors declared no potential conflicts of interest with respect to the research, authorship, and/or publication of this article.
Funding
The authors disclosed receipt of the following financial support for the research, authorship, and/or publication of this article: the National Health and Medical Research Council Grant (grant number 509178); the Royal Women’s Hospital Foundation; the Cecilia Kilkeary Foundation; the Eirene Lucas Foundation; the Harold & Cora Brennen Benevolent Trust (Equity Trustees); the Jack Brockhoff Foundation; the J & R McGauran Charitable Trust; the Diana Brown Trust (Perpetual Trustees); the Helen Macpherson Smith Trust; the Thomas R & Rosalinda B Ditchfield Medical Research Endowment Fund and the Wenkart Foundation.