
Abstract
We identified differentially expressed genes comparing peritoneal endometriosis lesions (n = 18), eutopic endometrium (n = 17), and peritoneum (n = 22) from the same patients with complete menstrual cycles using microarrays (54 675 probe sets) and immunohistochemistry. Peritoneal lesions and peritoneum demonstrated 3901 and 4973 significantly differentially expressed genes compared to eutopic endometrium, respectively. Peritoneal lesions significantly revealed no correlation with a specific menstrual cycle phase by gene expression and histopathology, exhibited low expressed proliferation genes, and constant levels of steroid hormone receptor genes. Tissue remodeling genes in cytoskeleton, smooth muscle contraction, cellular adhesion, tight junctions, and O-glycan biosynthesis were the most significant to lesions, including desmin and smooth muscle myosin heavy chain 11. Protein expression and location of desmin, alpha-actin, and h-caldesmon in peritoneal lesions discriminated between smooth muscle hyperplasia and metaplasia. Peritoneal lesions demonstrate no menstrual cycle phasing but constant steroid hormone receptor expression where a slow but steady growth is linked with tissue remodeling. Our study contributes to the molecular pathology of peritoneal endometriosis and will help to identify clinical targets for treatment and management.
Introduction
Endometriosis is one of the most common benign gynecological disorders affecting approximately 10% to 15% of women in the reproductive age, up to 50% of women with fertility problems, and up to 75% of women and adolescents with chronic inflammatory pelvic pain.1,2 Endometriosis correlates with inflammation, impaired follicular growth, aberrant circulating hormone levels, and a reduction in oocyte fertilization and implantation rates. 3 The endometriotic lesion is defined as a steroid hormone-dependent endometrium-like tissue containing many different cell types including stromal and epithelial cells, infiltrating macrophages, and other immune cells, which establishes growth outside the uterine cavity. The most common target locations for lesions are the peritoneum including the fallopian tubes, colon, rectum, vagina, and bladder, but lesions are also found in the ovaries and within the myometrium (also denoted as adenomyosis uteri interna). Several endometriosis classification systems are currently used or being developed, which implement clinical information like disease severity, lesion location, laparoscopy, laparotomy, pregnancy rates, and pain. 4
Even though therapeutic treatment and surgery reduce or eliminate the lesion along with endometriosis associated symptoms, the 5-year recurrence rates have been estimated at 40% to 50%. 5 In the United States, an overall estimate for annual endometriosis patients cost reached $22 billion in 2002 and around 2 billion € for Germany in 2003.6,7
Endometriosis is also associated with an aberrant immunologic response 8 genetic predisposition 9 ,10 an altered peritoneum or eutopic endometrium 11 ,12 altered micro RNA, viral infection, aberrant steroidogenic properties, proliferation, migration, and invasion.13–17 Importantly, there have been several endometriosis animal models developed. 18 Additionally, a multitude of factors in the peritoneal environment have been proposed to regulate endometriosis growth, angiogenesis, cellular remodeling, and inflammation (for review see). 19 For example, macrophages represent the most abundant cell type in the peritoneal fluid and are highly activated and secrete growth factors (eg, platelet derived growth factor [PDGF], macrophage colony-stimulating factor [M-CSF]), prostaglandin types E2 and E2a, and cytokines in response to inflammatory stimuli. 19 Examples of increased cytokines secreted by lymphocytes found in the peritoneal fluid from endometriosis patients include interleukin 1, 8, and 10, whereas the macrophage-inhibiting factor and cytokine interleukin 13 were reported to be present at lower amounts. 19
In the pelvic region beneath the peritoneal serosa (parietal and visceral mesentery), a few muscle-like cells are found as a normal physiological constituent in the subserosal layer. 20 , 21 Interestingly, it has been hypothesized that these muscle-like cells represent a “multipotent” subserosal cell, which can differentiate into normal smooth muscle (SM) cells, myofibroblasts, and mesothelial cells. 21 Furthermore, focal and diffuse patterns of differentiated SM cells have been noted below the peritoneum mesothelium in specific anatomical regions (eg, peritoneum wall, uterosacral ligaments) in normal women with no pathological changes.11,22 However, an overabundance of SM and/or myofibroblasts at endometriosis lesion sites represents a pathological finding. For example, SM hyperplasia is defined as the abnormal proliferation of SM cells into differentiated SM bundles. It was noted that in 14 of 44 endometriosis lesions of the intestinal tract SM hyperplasia and hypertrophy were found histopathologically as marked concentric forms. 23 The observation of differentiated SM bundles occurring concentrically around endometriosis lesions supports a hyperplastic event possibly stemming from the peritoneum.
In contrast, metaplasia is defined as a reversible change in which one cell type is replaced by another cell type. SM metaplasia involves the differentiation of mesenchymal fibroblasts into myofibroblasts and then possibly into SM cells. 20 In the case of abnormal peritonitis due to a variety of stimuli or injuries, including inflammation, neoplasms, surgical mainipulation, and reactive changes related to endometriosis, the submesothelial mesenchymal cells undergo a prominent SM metaplasia and strongly express SM actin (ASMA, also called ACTA2) and variably desmin (DES), indicating myofibroblastic and/or SM differentiation.20,24 It is also possible that a reactive subserosal “multipotent” cell could contribute to SM metaplasia. 21 ,24 Interestingly, SM metaplasia has been associated with endometriosis lesions based upon several histological findings.11, 25–30 For example, a histological analyses of endometriosis lesions showed a positive association with myofibroblasts, differentiated SM cells, fibrosis, and nerve fibers.11,25–30 Odagiri et al 25 and Anaf et al 28 demonstrated in a variety of lesion expression of ASMA a contractile microfilament expressed by SM cells and the neural cell adhesion molecule (NCAM) using immunohistochemistry (IHC). Deep infiltrating endometriosis lesions of the bladder, rectum, or colon were frequently associated with different protein markers for SM cells. 26 Developmental stages of SM cells including fully differentiated cells were also recently shown in peritoneal lesions. 11
So far 10 large-scale microarray-based gene expression analysis comparing endometriosis lesions with eutopic endometrium from women with endometriosis have been performed, including the present study (Table 1).31–39 However, there is no study to date which has performed a large-scale gene expression microarray analyses with greater numbers of whole peritoneal lesions compared with eutopic endometrium and peritoneum in single analyses to examine all cell types and both menstrual cycle phases (Table 1). Additionally, no protein analyses were performed, which confirmed significantly differentially expressed genes in the same patient cohort tissues. For example, 6 of the previous studies analyzed between 1176 and 47 633 genes exclusively from women with ovarian endometriosis in both proliferative and secretory phases.31–34,37,38 In another investigation, Eyster et al 39 analyzed a combined cohort of 6 ovarian and 5 peritoneal endometriosis lesions compared to eutopic endometrium on an array of 53 000 probe sets where all but 1 woman with an ovarian endometriosis were in the proliferative phase. Another microarray study identified 19.3% differentially expressed genes from 4684 genes specifically in epithelial cells microdissected from lesions and eutopic endometrium from women with both ovarian and peritoneal endometriosis. 36 This study showed that the location of ovarian and peritoneal endometriosis lesions was defined by significant differences in gene expression. Another investigation analyzed a total of 1176 genes by microarray using both epithelial and stromal cells by laser dissection isolated from 6 deep infiltrating lesions with growth >5 mm beneath the peritoneum compared to eutopic endometrium. 35
Ten Different Gene Array Studies Including This Present Investigation of Differentially Expressed Genesa
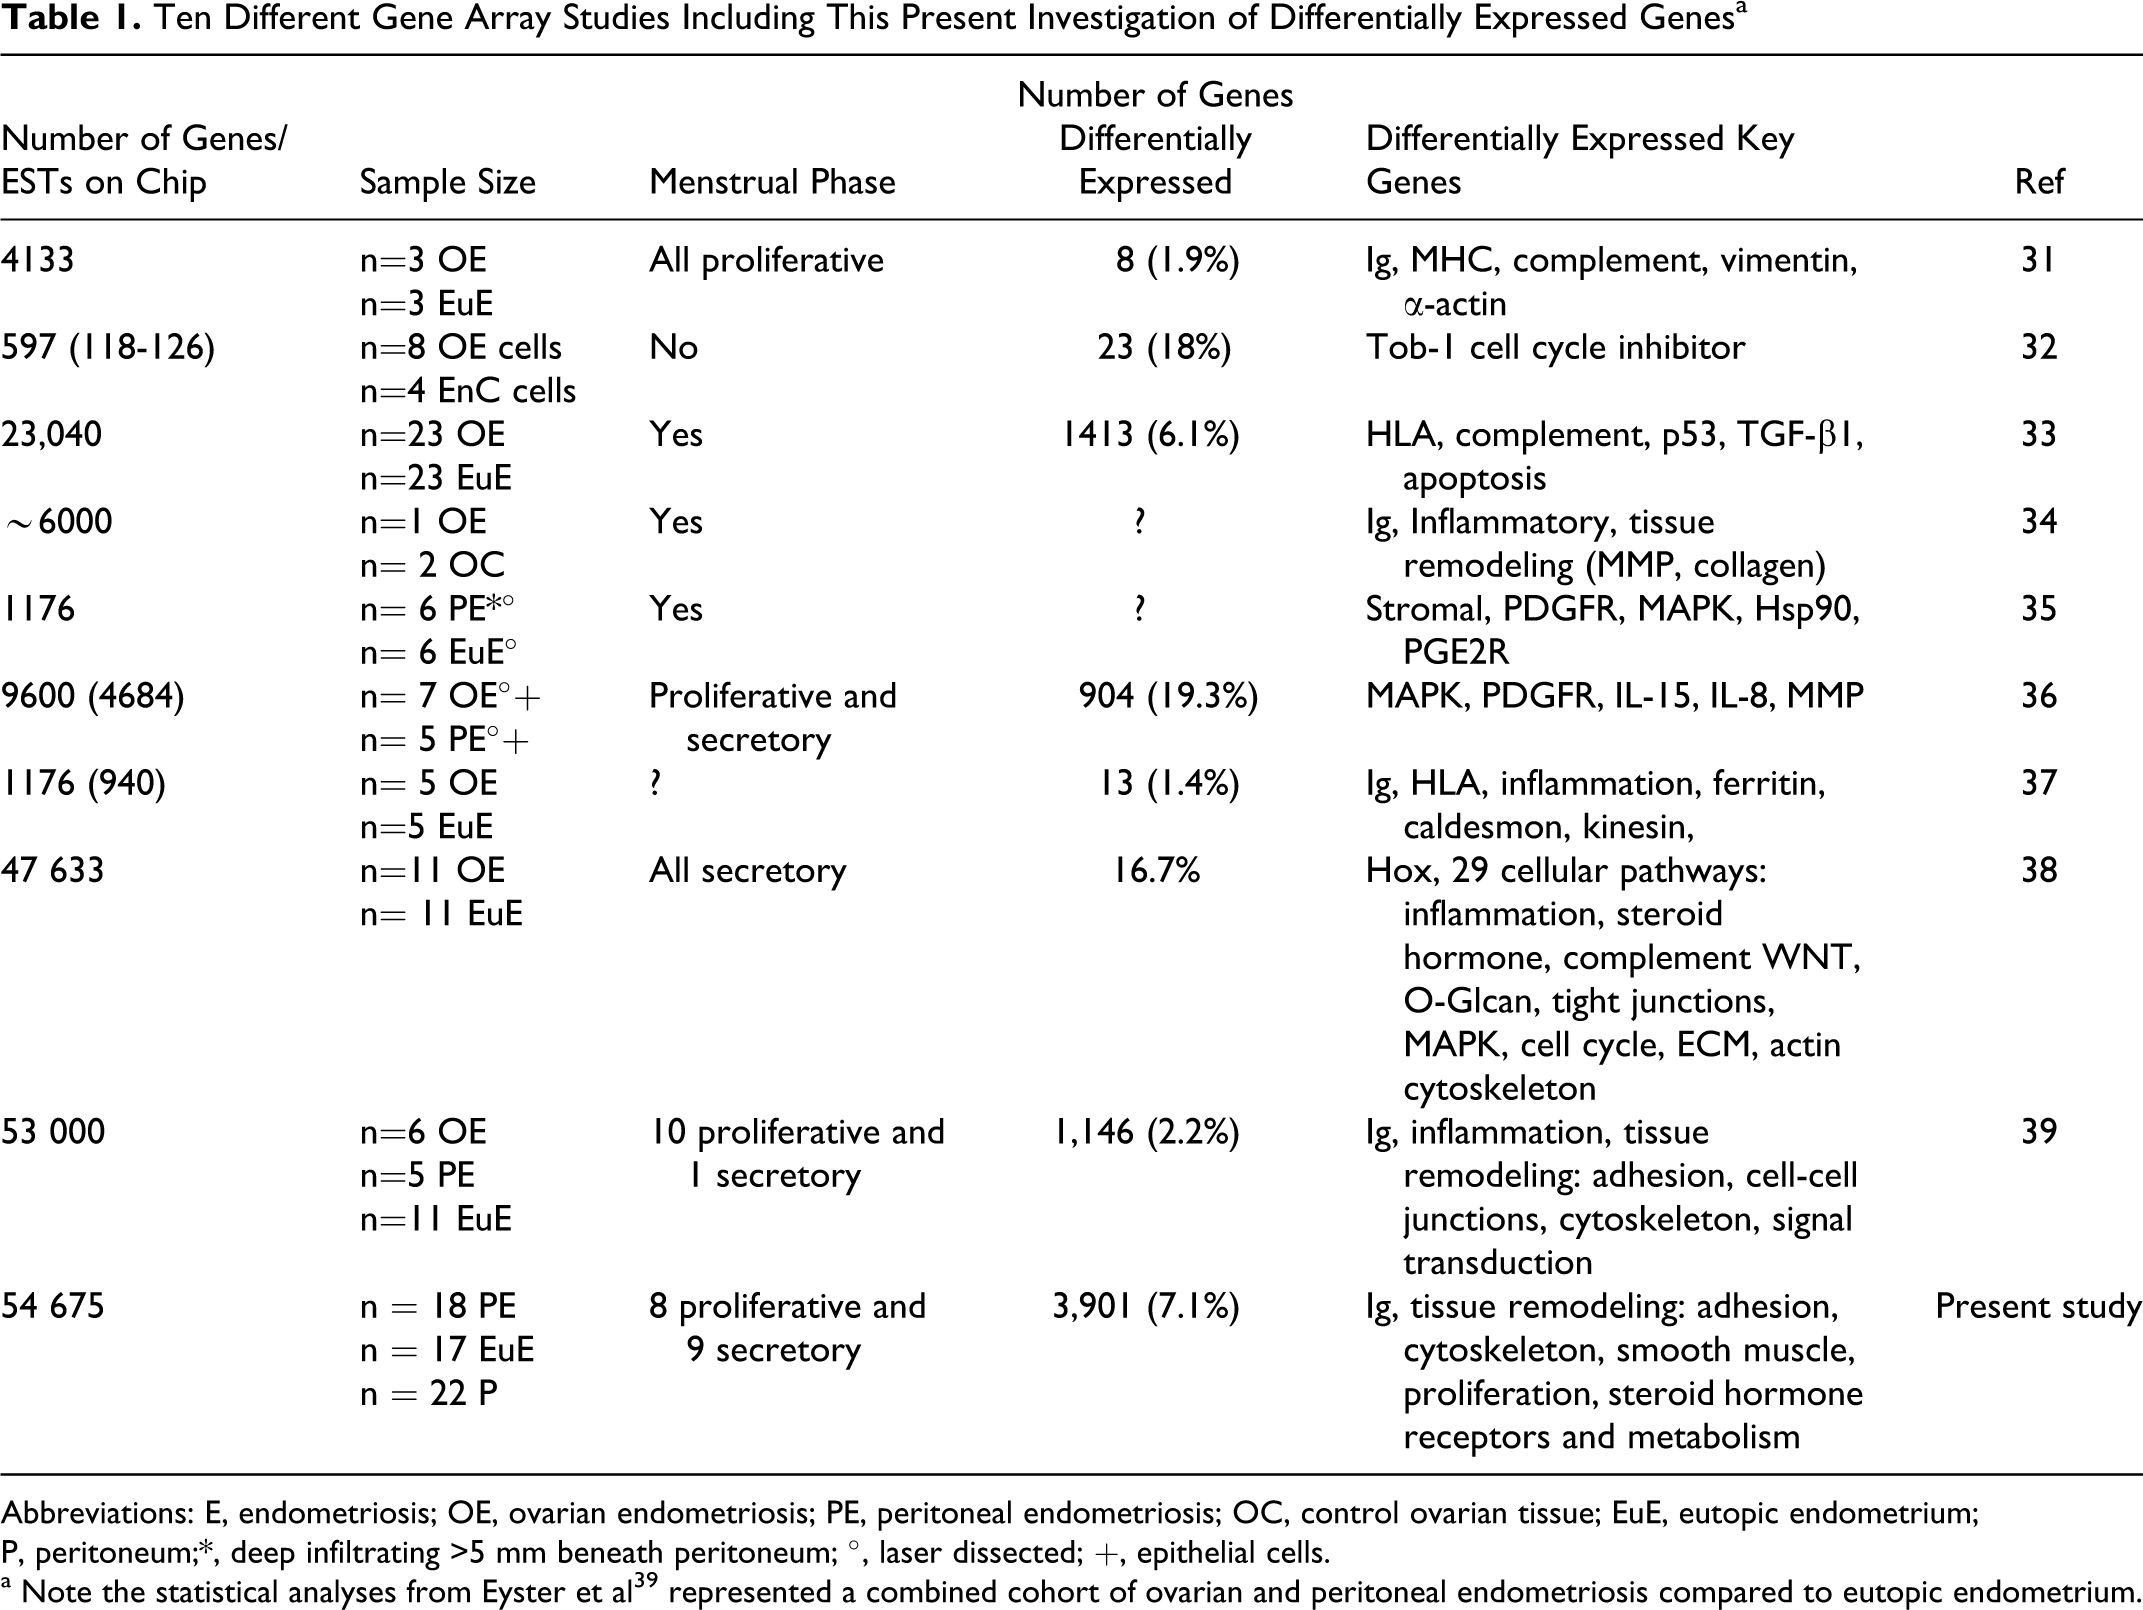
Abbreviations: E, endometriosis; OE, ovarian endometriosis; PE, peritoneal endometriosis; OC, control ovarian tissue; EuE, eutopic endometrium; P, peritoneum;*, deep infiltrating >5 mm beneath peritoneum; °, laser dissected; +, epithelial cells.
a Note the statistical analyses from Eyster et al39 represented a combined cohort of ovarian and peritoneal endometriosis compared to eutopic endometrium.
Therefore, our present study compared larger tissue cohorts of peritoneal endometriosis with eutopic endometrium and peritoneum in single analyses using microarrays of 54 675 probe sets to identify all cell types in lesions. In addition, we analyzed significantly differentially expressed genes by IHC in the same patient cohort. Since our patients demonstrated complete menstrual phases, we also tested whether a specific gene expression pattern could determine whether endometriosis lesions were synchronized with a phase of the menstrual cycle. Our study comprises a noteworthy analysis of gene profiling in peritoneal endometriosis where our results highlight that peritoneal endometriosis lesions are not synchronized with eutopic endometrium menstrual phases and that tissue remodeling is a prominent feature occurring at lesion sites.
Material and Methods
Patient Data and Tissues
Women who participated in this study were of European (German) descent and seen at the Department of Gynecology and Obstetrics, University–Clinic Erlangen. Handling of patients and their tissue samples were in accordance with the Ethics Committee approval at the University of Erlangen–Nuremberg under the Ethics Commission approval vote number #2567. All individuals gave written informed consent. Examination of internal organs was performed either by laparoscopy or by laparotomy. Endometriosis patients had complete menstrual cycle phases including those patients where hormone therapy was stopped at 3 to 6 months before surgery. Supplementary Table 1 provides patient clinical data as well as clarifies the distribution of patient samples regarding lesion sites and classification. Three different tissue types were isolated from women with peritoneal endometriosis including peritoneal lesions, eutopic endometrium, and peritoneum. Patient-matched tissues included 18 lesions, 17 eutopic endometrium, and 14 peritoneum. Nonpatient-matched tissues included 8 peritoneum. Therefore, from a total of 27 endometriosis patients a total of 57 tissues were analyzed on gene chips. Tissues were stored in RNAlater (Qiagen, Hilden, Germany) at −80°C. Every lesion was classified by a pathologist and accordingly patients were assigned to American Fertility Society (AFS) classifications I to IV. Additionally, eutopic endometrium and peritoneum from patients were histologically confirmed by a pathologist.
Patient Cycle Phases
We classified endometriosis patients into proliferative (n = 11), secretory (n = 12), and mid-cycle (n = 1) phases using the following combined criteria (Supplementary Table 1): (1) radioimmunoassay (RIA) to measure serum hormone levels of 17β-estradiol (E2), progesterone (P4), follicle-stimulating hormone (FSH), and luteinizing hormones (LHs) collected from patients at the time of surgery. The hormone criteria for the proliferative phase were E2 levels >200 pmol/L or P4 levels were <3 nmol/L; for the mid-cycle phase LH values were >10 mIU/mL, and the secretory phases P4 >15 nmol/L.; (2) a principal component analyses (PCAs) comparing eutopic endometrium tissues by gene expression and then correlating with the patient’s proliferative or secretory hormone determinations (Figure 1A) 12 ; (3) analyses of 8 known reference genes expressed in a cycle phase-specific manner of eutopic endometrium (ESR1, PGR, CDC6, CCNB1, MMP11, DKK1, CD55, PAEP)40–42 (Figure 2); (4) the knowledge of the patient’s last menstrual cycle; (5) analyses of hematoxylin/eosin (HE) stained tissues by a pathologist based upon specific histological criteria to identify menstrual cycle phases 20 for example multilayered endometrium (proliferative) or a single layer of endometrial cells (secretory), epithelium and stroma changes in mitosis and cellular structure, cytoplasmic staining, dilated and vacuolated glands showing fluid secretions, and stroma predecidualization (secretory) 20 ; and (6) IHC detecting Ki67 to determine the percentage of proliferation (see IHC section below).
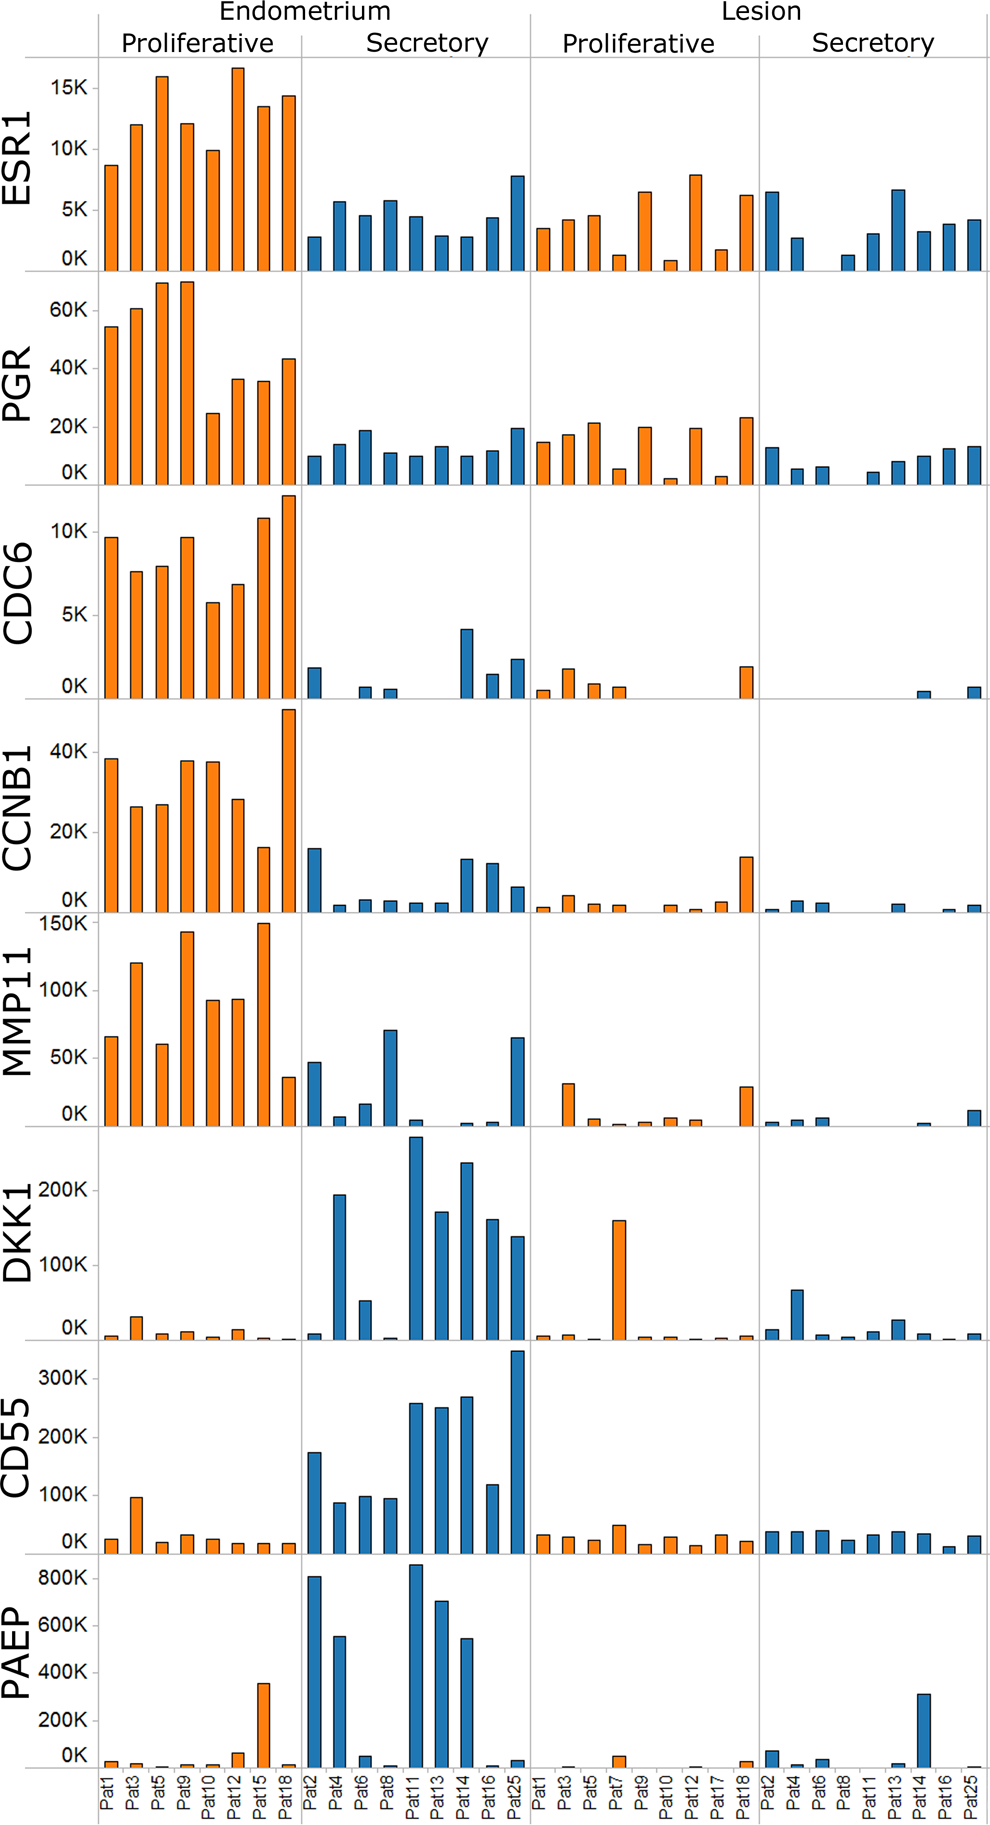
Menstrual cycle phase analyses of eutopic endometrium and lesions using gene expression of reference genes. Expression of 8 reference genes is shown according to cycle phases. Bar height represents gene expression as the measured intensity on the microarray, patient numbers are indicated below and the cycle phase above. Shaded colors for each patient demonstrate the proliferative (orange) or secretory (blue) phases. Comparing eutopic endometrium in proliferative versus secretory phases all 8 genes were significantly differentially expressed: (P value, ratio of means): estrogen receptor 1 (ESR1) 3.17E-06, 2.93; progesterone receptor (PGR), 4.43E-07, 3.67; cell division cycle 6 (CDC6), 1.09E-05, 9.20; cyclin B1 (CCNB1), 3.60E-05, 6.37; matrix metalloprotease 11 (MMP-11), 1.00E-03, 7.68; dickkopf homolog 1(DKK-1), 3.00E-03, 0.09; decay-accelerating factor for complement (DAF or CD55), 4.66E-06, 0.15; progestagen-associated endometrial protein (PAEP), 5.70E-02, 0.182. Comparing lesions according to the patient’s proliferative and secretory phases all 8 genes were not found significantly differentially expressed. However, all 8 genes were significantly decreased in lesions when compared to the eutopic endometrium (P value from t test, ratio of means): ESR1 5.84E-03, 0.51; PGR, 3.06E-04, 0.39; CDC6, 4.70E-05, 0.20; CCNB1, 1.89E-05, 0.20; MMP-11, 2.35E-04, 0.10; DKK-1, 3.27E-03, 0.23; DAF or CD55, 5.2E-04, 0.35; PAEP, 5.02E-05, 0.04.
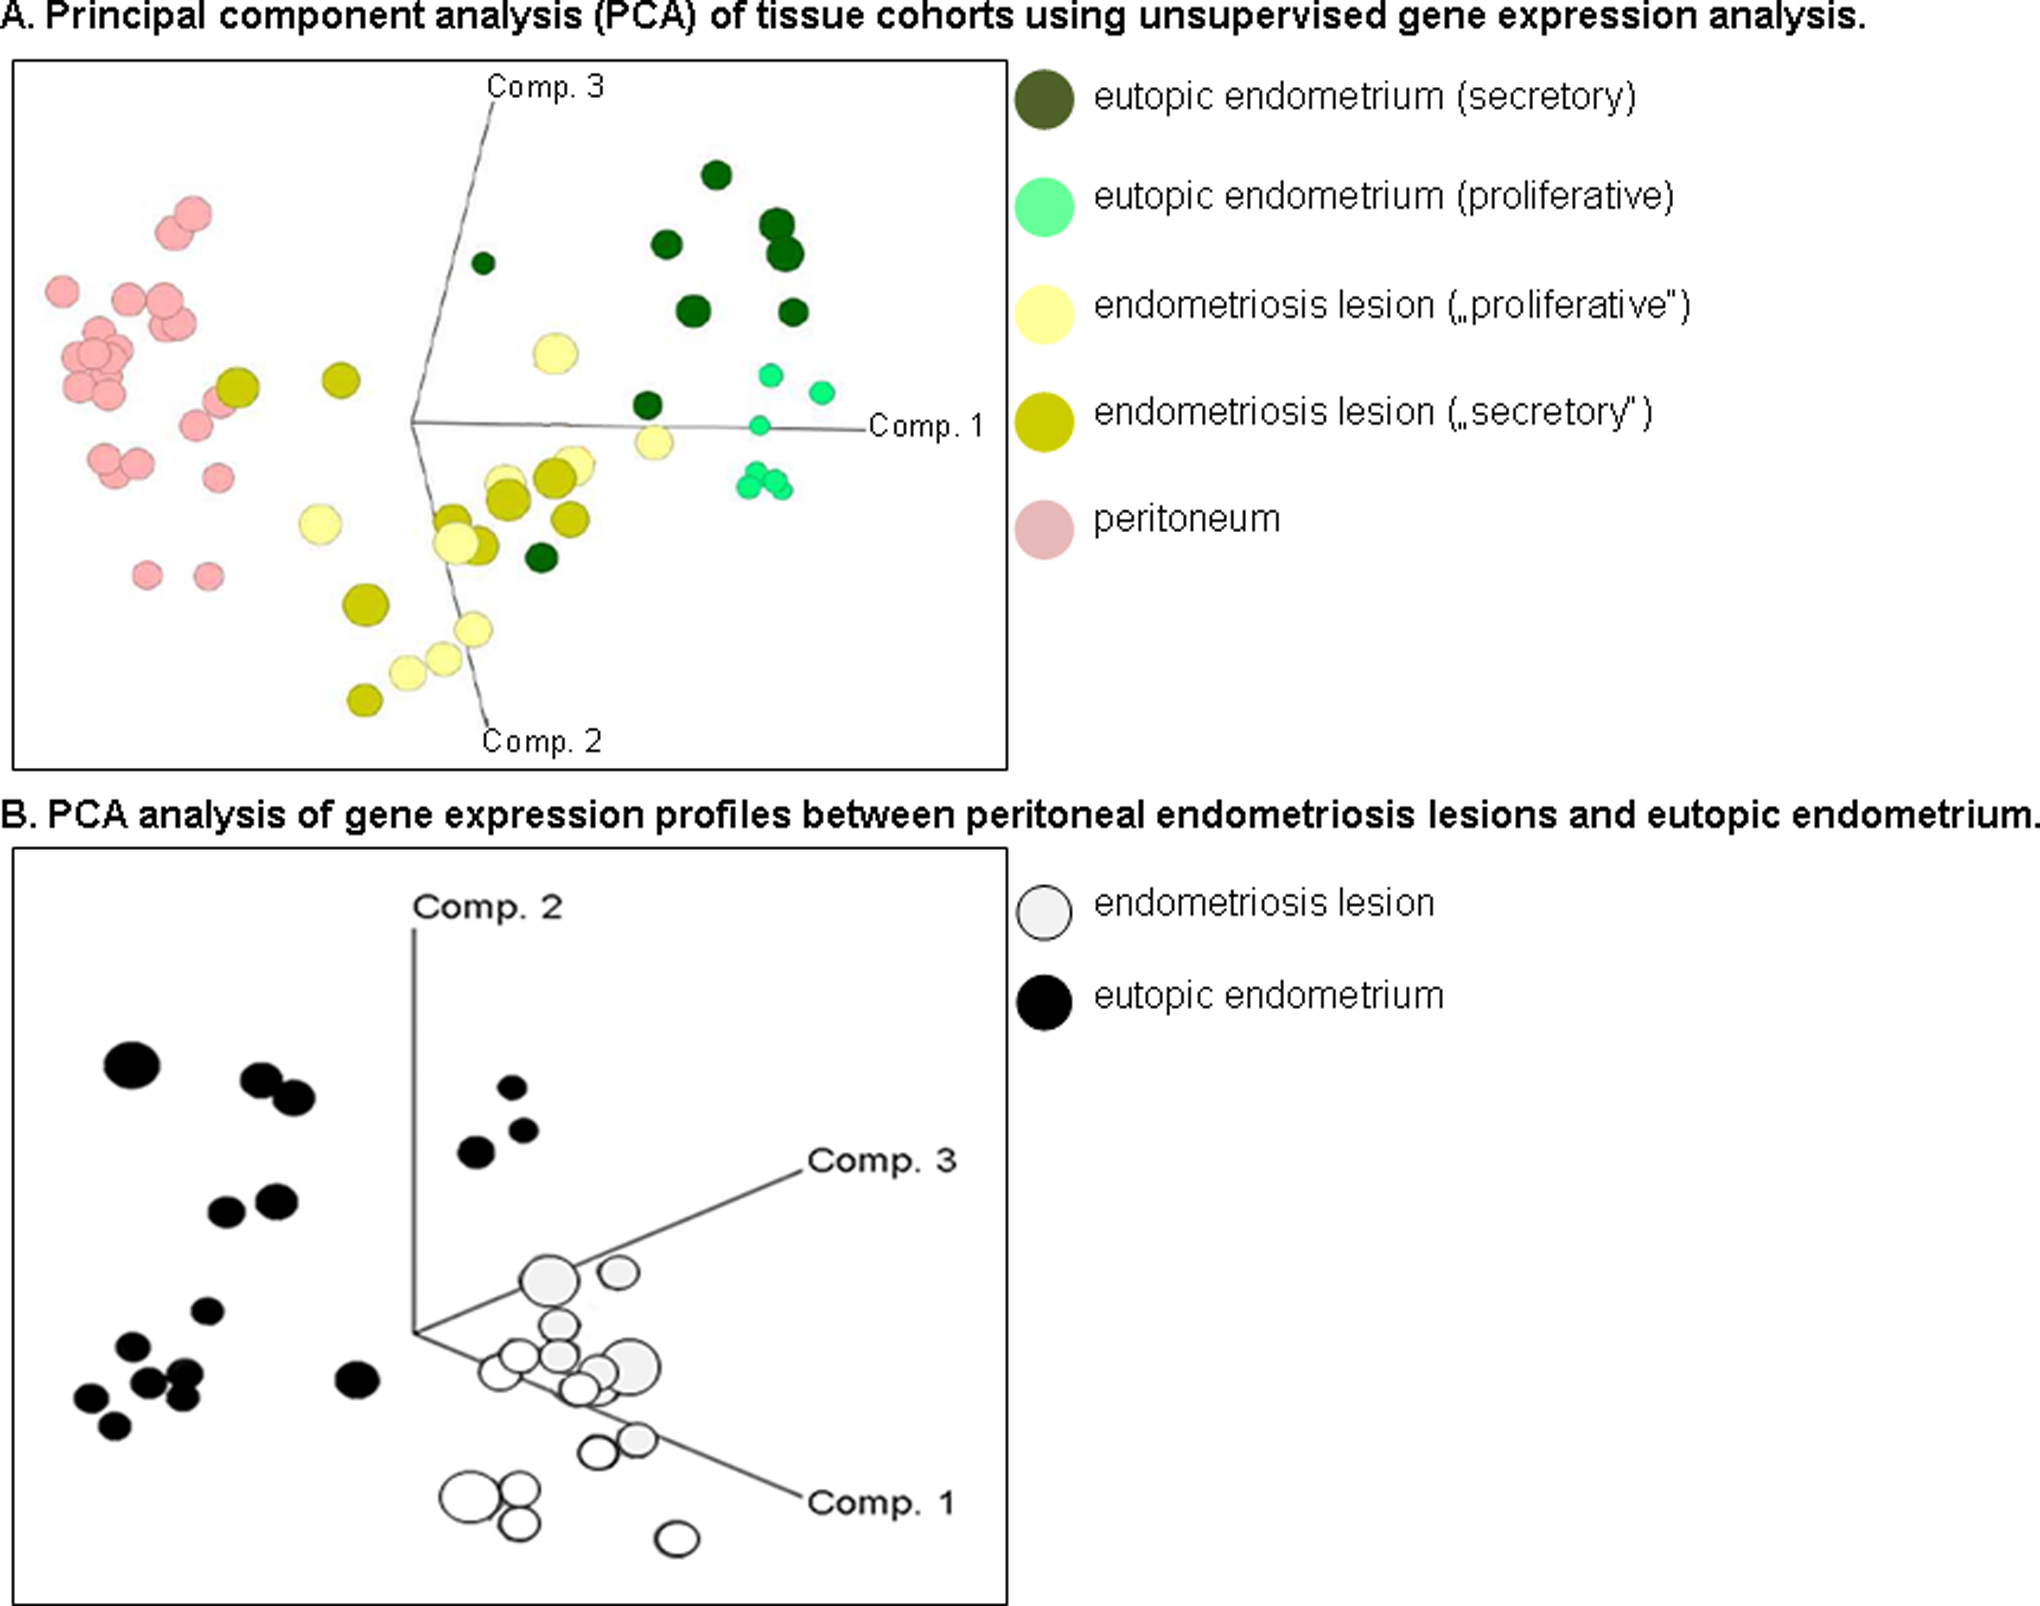
Principal component analysis (PCA) of tissue cohorts using unsupervised gene expression analysis. A, Three-dimensional axes (component [comp] 1-3) spatial figure demonstrates a PCA analysis of gene expression profiles between peritoneal endometriosis lesions, endometrium, and peritoneum. The colored circles represent the tissue type and menstrual cycle phases determined by serum hormones. B, Spatial figure as a 3-dimensional axes (comp 1-3) demonstrates a PCA analysis of gene expression profiles between peritoneal endometriosis lesions (n = 18; light gray) and eutopic endometrium (n = 17; black).
RNA extraction from tissue
Total RNA was extracted from each tissue sample (50-100 mg) using the RNeasy Mini kit (Qiagen, Hilden, Germany), according to the manufacturer’s recommendations with an additional DNase I (Qiagen) digestion step. The quality of the total RNA was analyzed on RNA LabChips on the Agilent Bioanalyzer 2100 (Agilent Technologies Inc, Palo Alto, California) and the concentration was determined on a Nanodrop spectrophotometer (Peqlab, Erlangen, Germany).
Affymetrix GeneChip hybridization
The One-Cycle Eukaryotic Target Labeling Kit (Affymetrix Inc, Santa Clara, California) was used according to the manufacturer’s instructions. Briefly, 2 µg of high-quality total RNA was reverse transcribed using a T7 tagged oligo-dT primer for the first-strand complementary DNA (cDNA) synthesis reaction. After RNase H-mediated second-strand cDNA synthesis, the double-stranded cDNA was purified and served as a template for the subsequent in vitro transcription reaction, which generated biotin-labeled complementary RNA (cRNA). The biotinylated cRNA was then purified, fragmented, and hybridized to GeneChip HGU133Plus2.0 arrays (Affymetrix, Inc), which contain 54 675 probe sets. The GeneChips were then washed and stained with streptavidin–phycoerythrin using a GeneChip Fluidics Station 450 (Affymetrix, Inc). After washing, the arrays were scanned on a GeneChip 3000 scanner (Affymetrix, Inc) with autoloader and barcode reader. A total of 57 HGU133Plus2.0 arrays were processed.
The quality of each hybridized array was analyzed with the Expressionist Pro 5.1 Refiner software (GeneData, Basel, Switzerland). Based on raw intensities of individual oligonucleotide features (probes), experiments were grouped according to similarities with potential outliers removed (or selected for rehybridization and/or refragmentation). The quality of a particular experiment was also compared with a virtual reference, which was computed as the average of all array intensities within that group. Moreover, defects on the arrays were masked. In these cases for each array, the spatial signal distribution was compared with an internal reference within its group. Regions with sharp boundaries which had consistently higher or lower feature intensities compared to the reference were flagged as defects and excluded from further analysis. In addition, a signal correction (distortion and gradient) was performed, where control gene statistics were calculated, and an overall classification of experiment quality was provided. Finally, probe intensities on each array were summarized with the MAS5.0 summarization algorithm and the refined and summarized data were loaded into the CoBi database (Genedata). Each analysis representing the probe set-specific signal intensities was performed with the Expressionist Pro 5.1 Analyst software (GeneData), the data set was LOWESS normalized and gene expression pathway analyses were performed with database and software tools from GeneGo Metacore (www.genego.com). All data sets were previously deposited at “ArrayExpress” located at the Web site http://www.ebi.ac.uk/arrayexpress/ with the accession number: E-MTAB-694.
Quantitative real-time polymerase chain reaction
RNA from all 3 tissue cohorts (endometriosis lesions, patient matched eutopic endometrium, and peritoneum) from the microarray analysis were used to generate cDNA (High-Capacity cDNA kit, Applied Biosystems, ABI, Germany) for semiquantitative real-time polymerase chain reaction (RT-PCR), according to Strissel et al. 43 Three significantly differentially expressed genes were chosen from our microarray analysis, primers purchased from Applied Biosystems (Applera, Darmstadt, Germany), and amplifications performed and analyzed with an ABI 7300. The following genes were analyzed: DES (Hs00157258), Purkinje cell protein 4 (PCP4; Hs01113638), and potassium large conductance calcium-activated channel subfamily M, alpha number 1 (KCNMA1; Hs00266938). Co-amplification of 18S rRNA (Applied Biosystems) and 1 independent control cDNA as internal control were used for a standard curve. All 2−ΔΔCt values were calculated following normalization to 18S rRNA Ct values.
Hematoxylin/eosin staining and IHC of paraffin-embedded tissues
Tissue samples were fixed in 10% formalin for 1 hour, washed several times with ethanol (70%-100%) for 5.5 hours and xylol (2.5 hours), and embedded into paraffin (2 hours). Hematoxylin/eosin staining of 5 μm tissue sections was performed by automation (Gemini, Shandon Veristain, GMI, Inc. Minnnesota, USA) following deparaffinization with xylol for 10 minutes, washed with ethanol and water and then stained with hematoxylin gill #3 (3 minutes) and eosin (20 seconds). To determine fibrosis occurring in peritoneal endometriosis lesions, HE stained tissue sections were evaluated for an absence, weak, or prominent levels of collagen fibers located adjacent to endometriosis lesions. Protein expression of both ASMA and the intermediate filament DES proteins are considered main markers for both vascular SM cells and the myofibroblastic phenotype. 20 In addition, h-caldesmon is also useful as a specific marker to distinguish the fully differentiated SM cells. All of these markers have been helpful in identifying SM hyperplasia or SM metaplasia in a variety of pathological diseases. 20 ,44,45 The IHC stains using specific mouse monoclonal antibodies included anti-DES (clone D33) 1:50, anti-ASMA (clone 1A4) 1:300, anti-caldesmon (clone h-CD)1:100, Ki67, 1:100 (clone Mib1; all DAKO, Denmark), and anti-CD10, 1:50 (Novocastra, Germany) were performed on tissue sections using the ZytoChem-Plus AP Polymer kit containing secondary antibodies from Zytomed Systems Ltd, Berlin, Germany, according to the manufacturer’s instructions.
Statistical Analyses
Unsupervised analyses: hierarchical clustering and PCA. In order to gain a general overview of the gene expression data and to identify outliers, the 57 microarray data sets were subjected to hierarchical clustering and a PCA. The hierarchical clustering was based on average linkage with dissimilarity as distance function. The dissimilarity was defined as 1 − CP, where CP is the Pearson correlation. A hierarchical clustering with the same distance function was also performed for sets of differentially expressed genes, in order to find the substructure within these sets.
Supervised statistical analyses: analysis of variance and t tests. Three factors were considered in our statistical models: the cycle phase (proliferative or secretory), the tissue type (endometriosis lesion, eutopic endometrium, and peritoneum), and the patient. Paired or unpaired t tests and 2-way analysis of variance (ANOVA) were applied to determine differentially expressed probe sets. Only the probe sets that were found in at least 80% of tissue samples in one or more of the tested groups were included in all analyses. In order to select differentially expressed probe sets from a t test, P values were plotted against the fold change values in a volcano plot. All probe sets outside an ellipse defined by the P value and the fold change value where the ellipse intersects the axes were selected as differentially expressed. That way, the magnitude of the biological effect, that is the expression ratio, is weighted more than in the t test alone.
Results
Peritoneal endometriosis lesions and peritoneum showed no evidence of proliferative and secretory cycle phases with eutopic endometrium
Seventeen eutopic endometrium tissues were classified into proliferative (n = 8) and secretory (n = 9) cycle phases according to serum hormones, gene expression, and knowledge of the patients last menstrual cycle ( Supplementary Table 1, Figure 1A). Eight reference genes known to be expressed in proliferative and secretory phases of normal endometrium from disease-free women including those without endometriosis 40 – 42 were comparable with our patient eutopic proliferative and secretory endometrium tissues (Figure 2). All 8 genes were statistically significantly different between cycle phases. For example, estrogen (ESR1) and progesterone (PGR) receptors were expressed higher in the proliferative phase of endometrium. Increased expression of the cell division cycle 6 (CDC6) and cyclin B1 (CCNB1) gene markers for cell proliferation was also very predominant in proliferative phase endometrium. In contrast, the decay-accelerating factor for complement (DAF or CD55) was upregulated in endometrium from patients in the secretory phase. Interestingly, patients 2, 4, and 8 could be interpreted in early secretory phase as supported by higher messenger RNA (mRNA) levels of matrixmetalloprotease 11 (MMP-11), dickkopf homolog 1 (DKK1), and progestagen-associated endometrial protein (PAEP), markers of early- and mid-secretory phase. 40
A t test identified additional differentially regulated genes in a cycle-dependent manner. Specifically, for eutopic endometrium 1,137 probe sets were significantly differentially expressed between the proliferative and secretory phases (Table 2; volcano plot selection, P ≤ 10−5, ratio of means = 5). For example, several genes which were overexpressed in proliferative endometrium, associated with cell division, for example CDC6, CDC25 homolog C (CDC25C), spindle pole body component 25 homolog (SPBC25), and the non-SMC condensin I complex, subunit H (NCAPH).
Twenty Most Significant Over- and Underexpressed Genes Comparing Proliferative and Secretory Eutopic Endometriuma
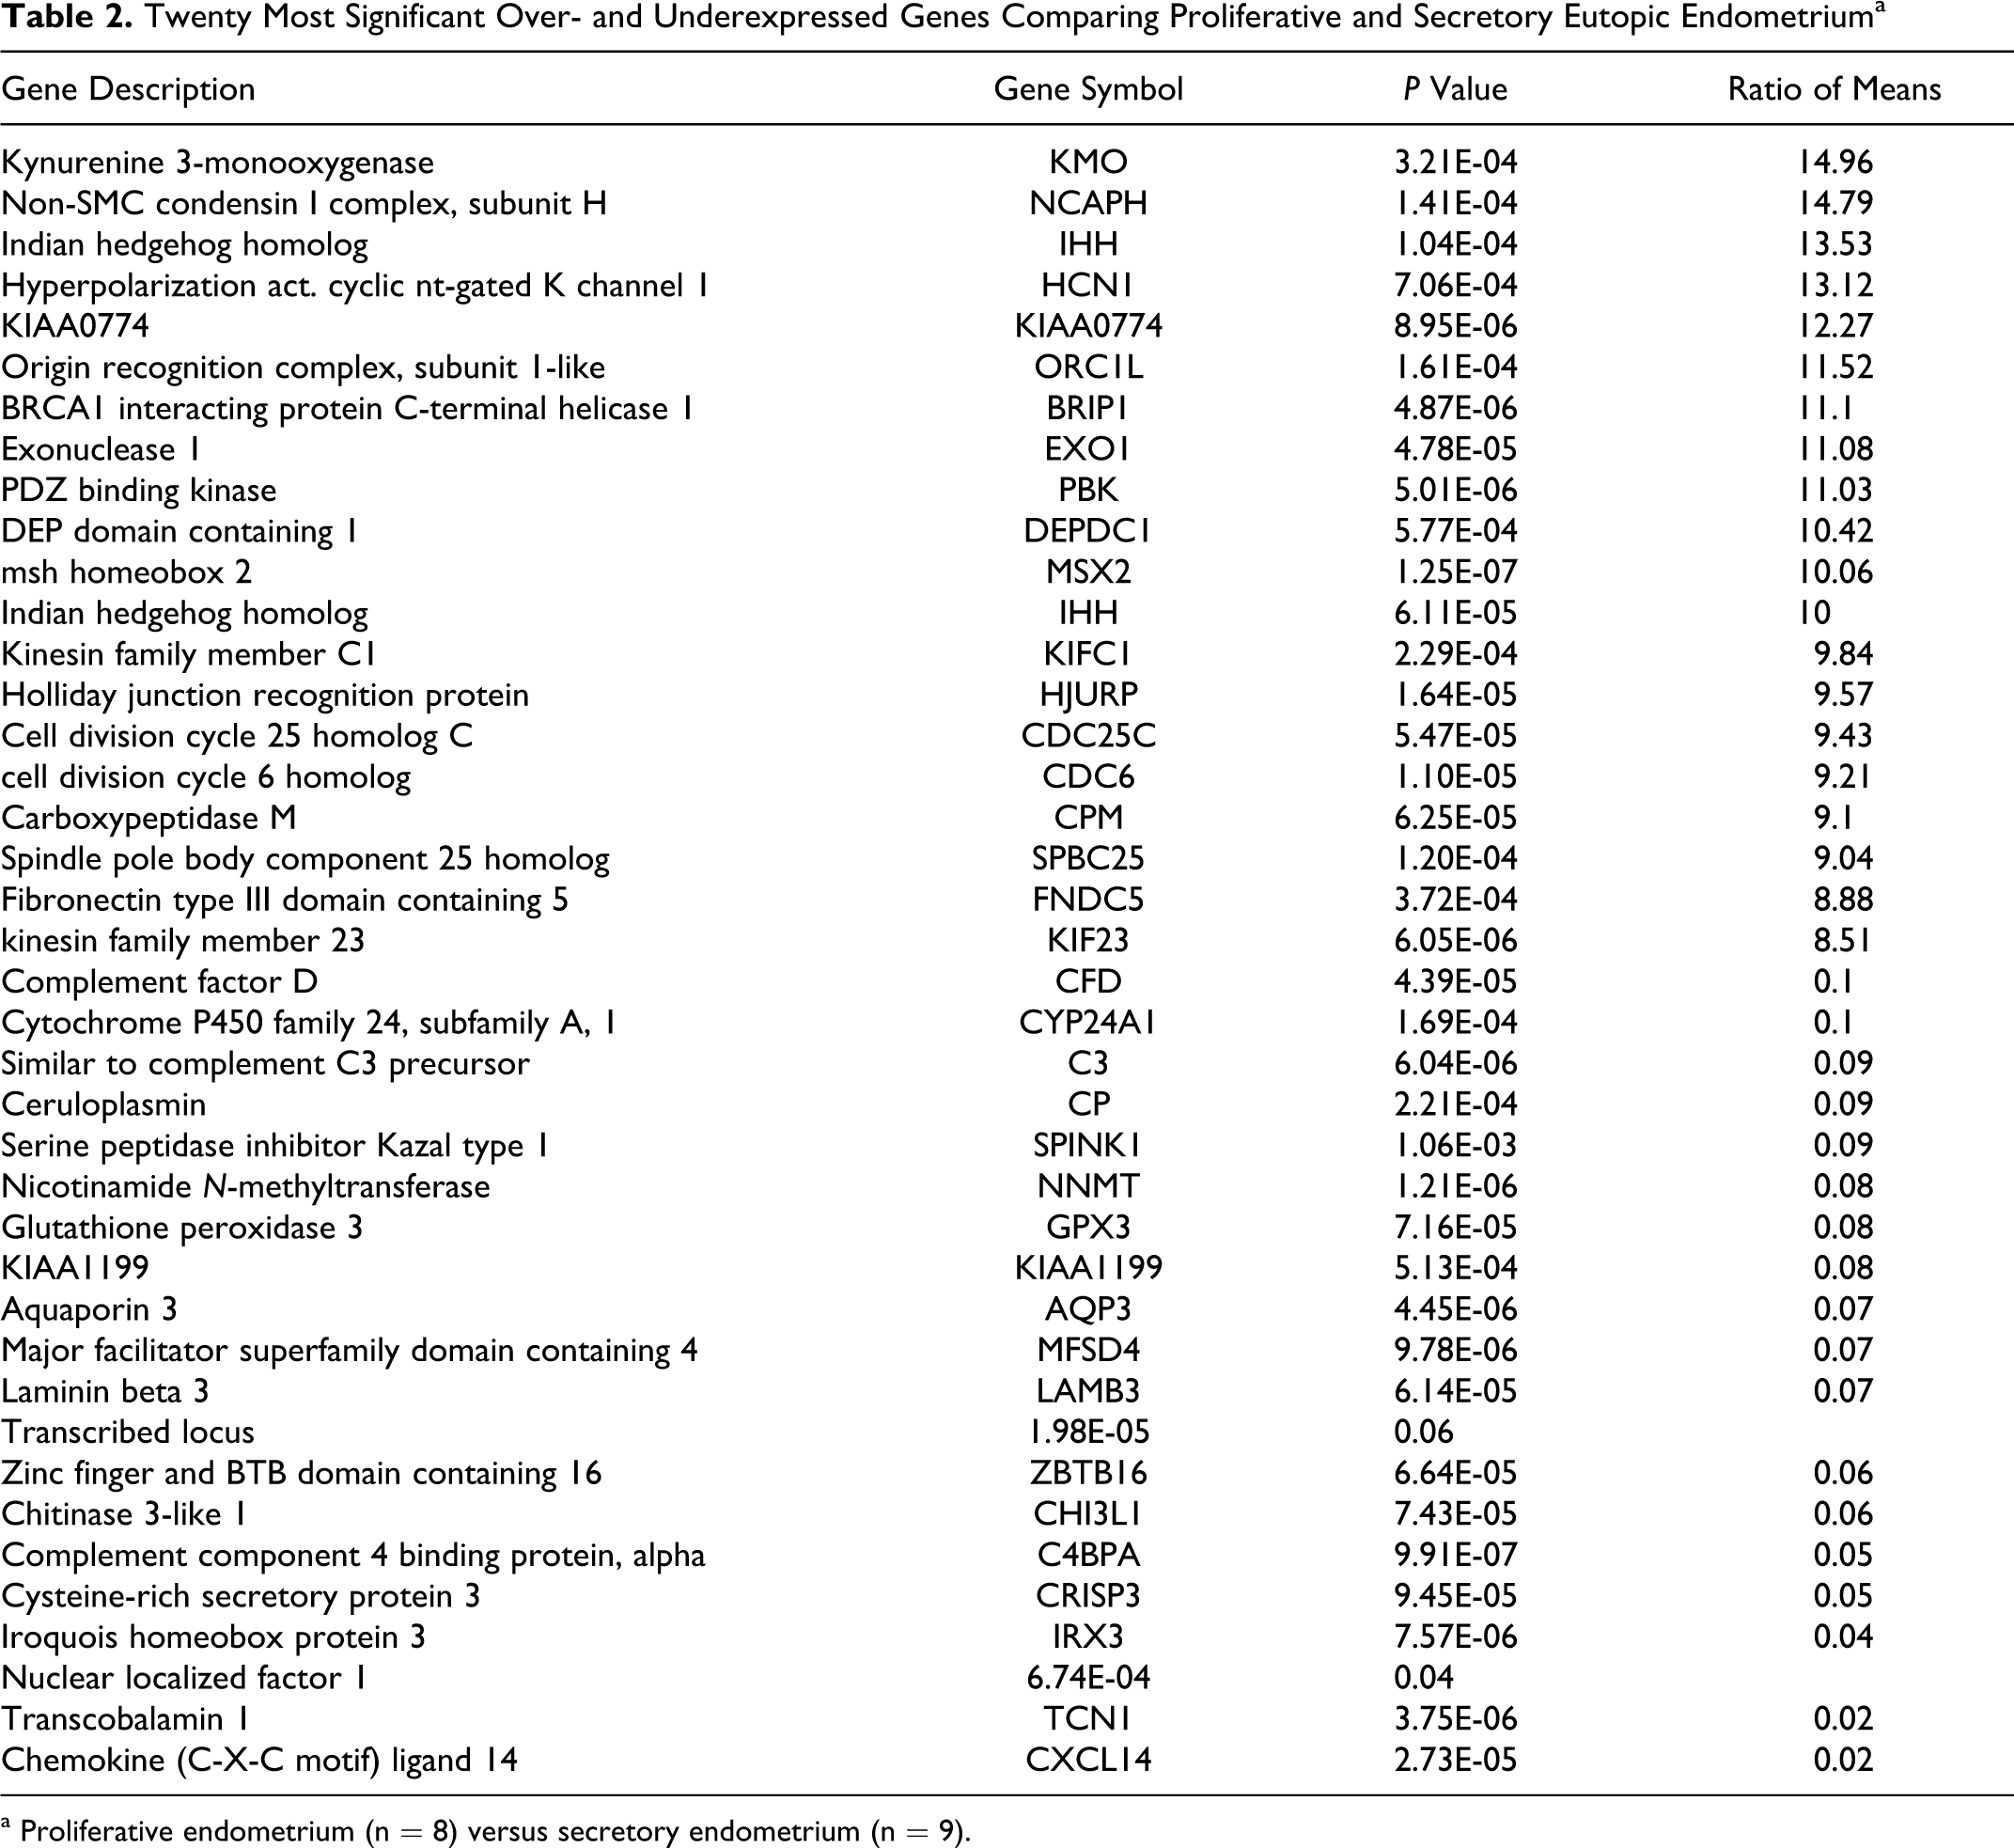
a Proliferative endometrium (n = 8) versus secretory endometrium (n = 9).
In contrast to eutopic endometrium, a PCAs of lesions or peritoneum did not demonstrate separate gene clusters according to the patient’s proliferative or secretory menstrual phases (Figure 1A and data not shown). Furthermore, a t test identified no statistically significantly regulated genes when lesions or peritoneum were compared according to the patient’s proliferative and secretory phases. Therefore, all expressed genes in lesions were not significantly changing throughout the menstrual cycle supporting that lesions do not cycle. For example, lesions showed no significant differences between both menstrual cycle phases for all 8 cycle phase-specific reference genes (Figure 2). Although both steroid hormone receptors were significantly decreased (ESR1 1.96-fold; PGR 2.56-fold) in lesions compared to eutopic endometrium, receptor expression generally remained at constant levels throughout both the proliferative and secretory phases, thus, demonstrating no significant fluctuation (Figure 2). Interestingly, both cell division genes, CDC6 and CCNB1, showed lower expression in lesions during both menstrual cycle phases, suggesting slow growth.
To further confirm a lack of menstrual cycle phasing in peritoneal lesions, we compared lesions with eutopic endometrium histologically along with Ki67 gene and protein expression. A total of 12 lesions and 10 eutopic endometrium were examined, where 8 tissues were patient matched (Supplementary Table 2). Six patients were in proliferative phase and 8 patients in secretory phase (Supplementary Tables 1, 2). Results confirmed that proliferative and secretory eutopic endometrium demonstrated clear cycle phases according to histology and IHC where, for example, high levels of Ki67 (30%-50%) protein expression distinguished proliferative endometrium (Figure 3, Supplementary Table 2). On the other hand, except for 1 lesion which positively correlated with the cycle phase (patient #7), 9 other endometriotic lesions (75%) were cystic and showed epithelia, which was 1-layered and attenuated, thus, a distinctive menstrual cycle phase was not identifiable (Figure 3, Supplementary Table 2). Interestingly, the remaining 2 lesions (patient #s 3 and 5) demonstrated a more predecidualized appearance or larger stromal cells, supporting some “secretory-like” characteristics. According to Ki67 gene microarray expression, lesions were statistically significantly lower than eutopic endometrium (P value = 8.17E-06, ratio of means = 0.30). Except for the 5 lesions that showed intermediate levels of Ki67 protein expression in the glands or stroma, 7 lesions demonstrated overall less than 1% Ki67 protein expression in all cellular types (Figure 3, Supplementary Table 2).
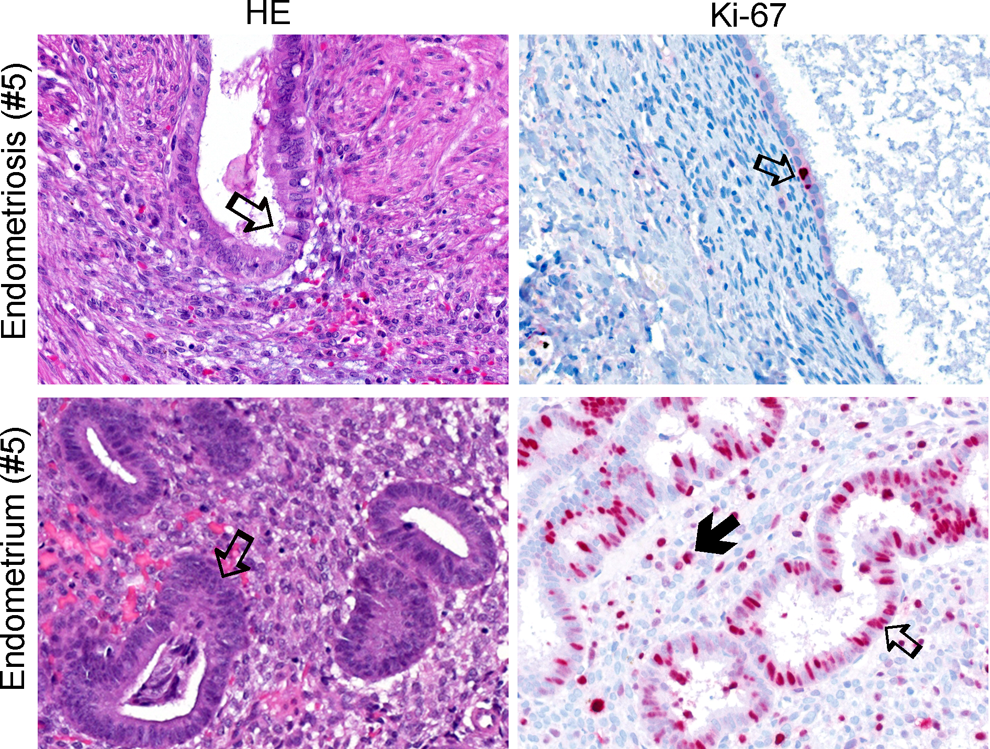
Menstrual cycle phasing according to histology and Ki67 immunohistochemistry (IHC). Left panel shows hematoxylin/eosin (HE) staining of an endometriosis lesion with “secretory-like” characteristics from patient #5 compared to matched eutopic endometrium below in the proliferative phase (Table 4). Arrows point to gland structures. In the above lesion HE photo, the arrow points to a gland with large epithelial columnar cells showing apical snouts that appear to be secreting fluid thus, demonstrating secretory-like characteristics. The right panel demonstrates IHC of Ki67 (red dots). Note that the lesion shows less overall expression of Ki67 compared to the highly proliferative eutopic endometrial gland below. Open arrows point to positive Ki67 expression in gland structures and closed arrow in adjacent stroma. All tissue pictures represent a ×400 magnification.
Gene expression analysis between lesions and eutopic endometrium demonstrated prominent tissue remodeling and decreased cell division
Since a PCA of lesions and eutopic endometrium demonstrated separate gene clusters, we further identified all significant expression differences (Figure 1B). Differentially expressed genes were selected in a volcano plot using a t test according to cycle phases. From 54 675 probe sets, a total of 3901 (7.1%) probe sets were differentially expressed in lesions compared to eutopic endometrium irrespective of the cycle phase (P < 10E-5, ratio of means = 5). Of these 3901 probe sets, 48% were significantly increased and 52% were decreased in the lesions. Regarding menstrual cycle phases, 3465 probe sets were overexpressed in the proliferative phase and 1366 probe sets underexpressed in the secretory phase with an overlap of 930 between both phases. A total of 3270 or 6.0% of the 54 675 total probe sets were significantly expressed more than 2-fold for both cycle phases. Examples of genes strongly overexpressed in lesions versus eutopic endometrium were the complement component 7 (C7; 132.7-fold), early B-cell factors 2 and 3 (EBF2 and EBF3; 37.9- and 43.4-fold), myosin heavy chain 11 (MYH11; 80.6-fold), and DES (36.8-fold), an intermediate filament type III gene important for SM function (Table 3). Examples of genes decreased in lesions versus eutopic endometrium were the transcription factor forkhead box A2 (FOXA2; 37.5-fold) and hydroxysteroid 17-β dehydrogenase 2 (HSD17B2; 26.6-fold) which codes for an enzyme crucial to the regulation of biologically active steroid hormones (Table 3).
Gene List of Top 20 Significantly Differentially Over- and Underexpressed Genes in Peritoneal Endometriosis Lesions Compared With Eutopic Endometriuma
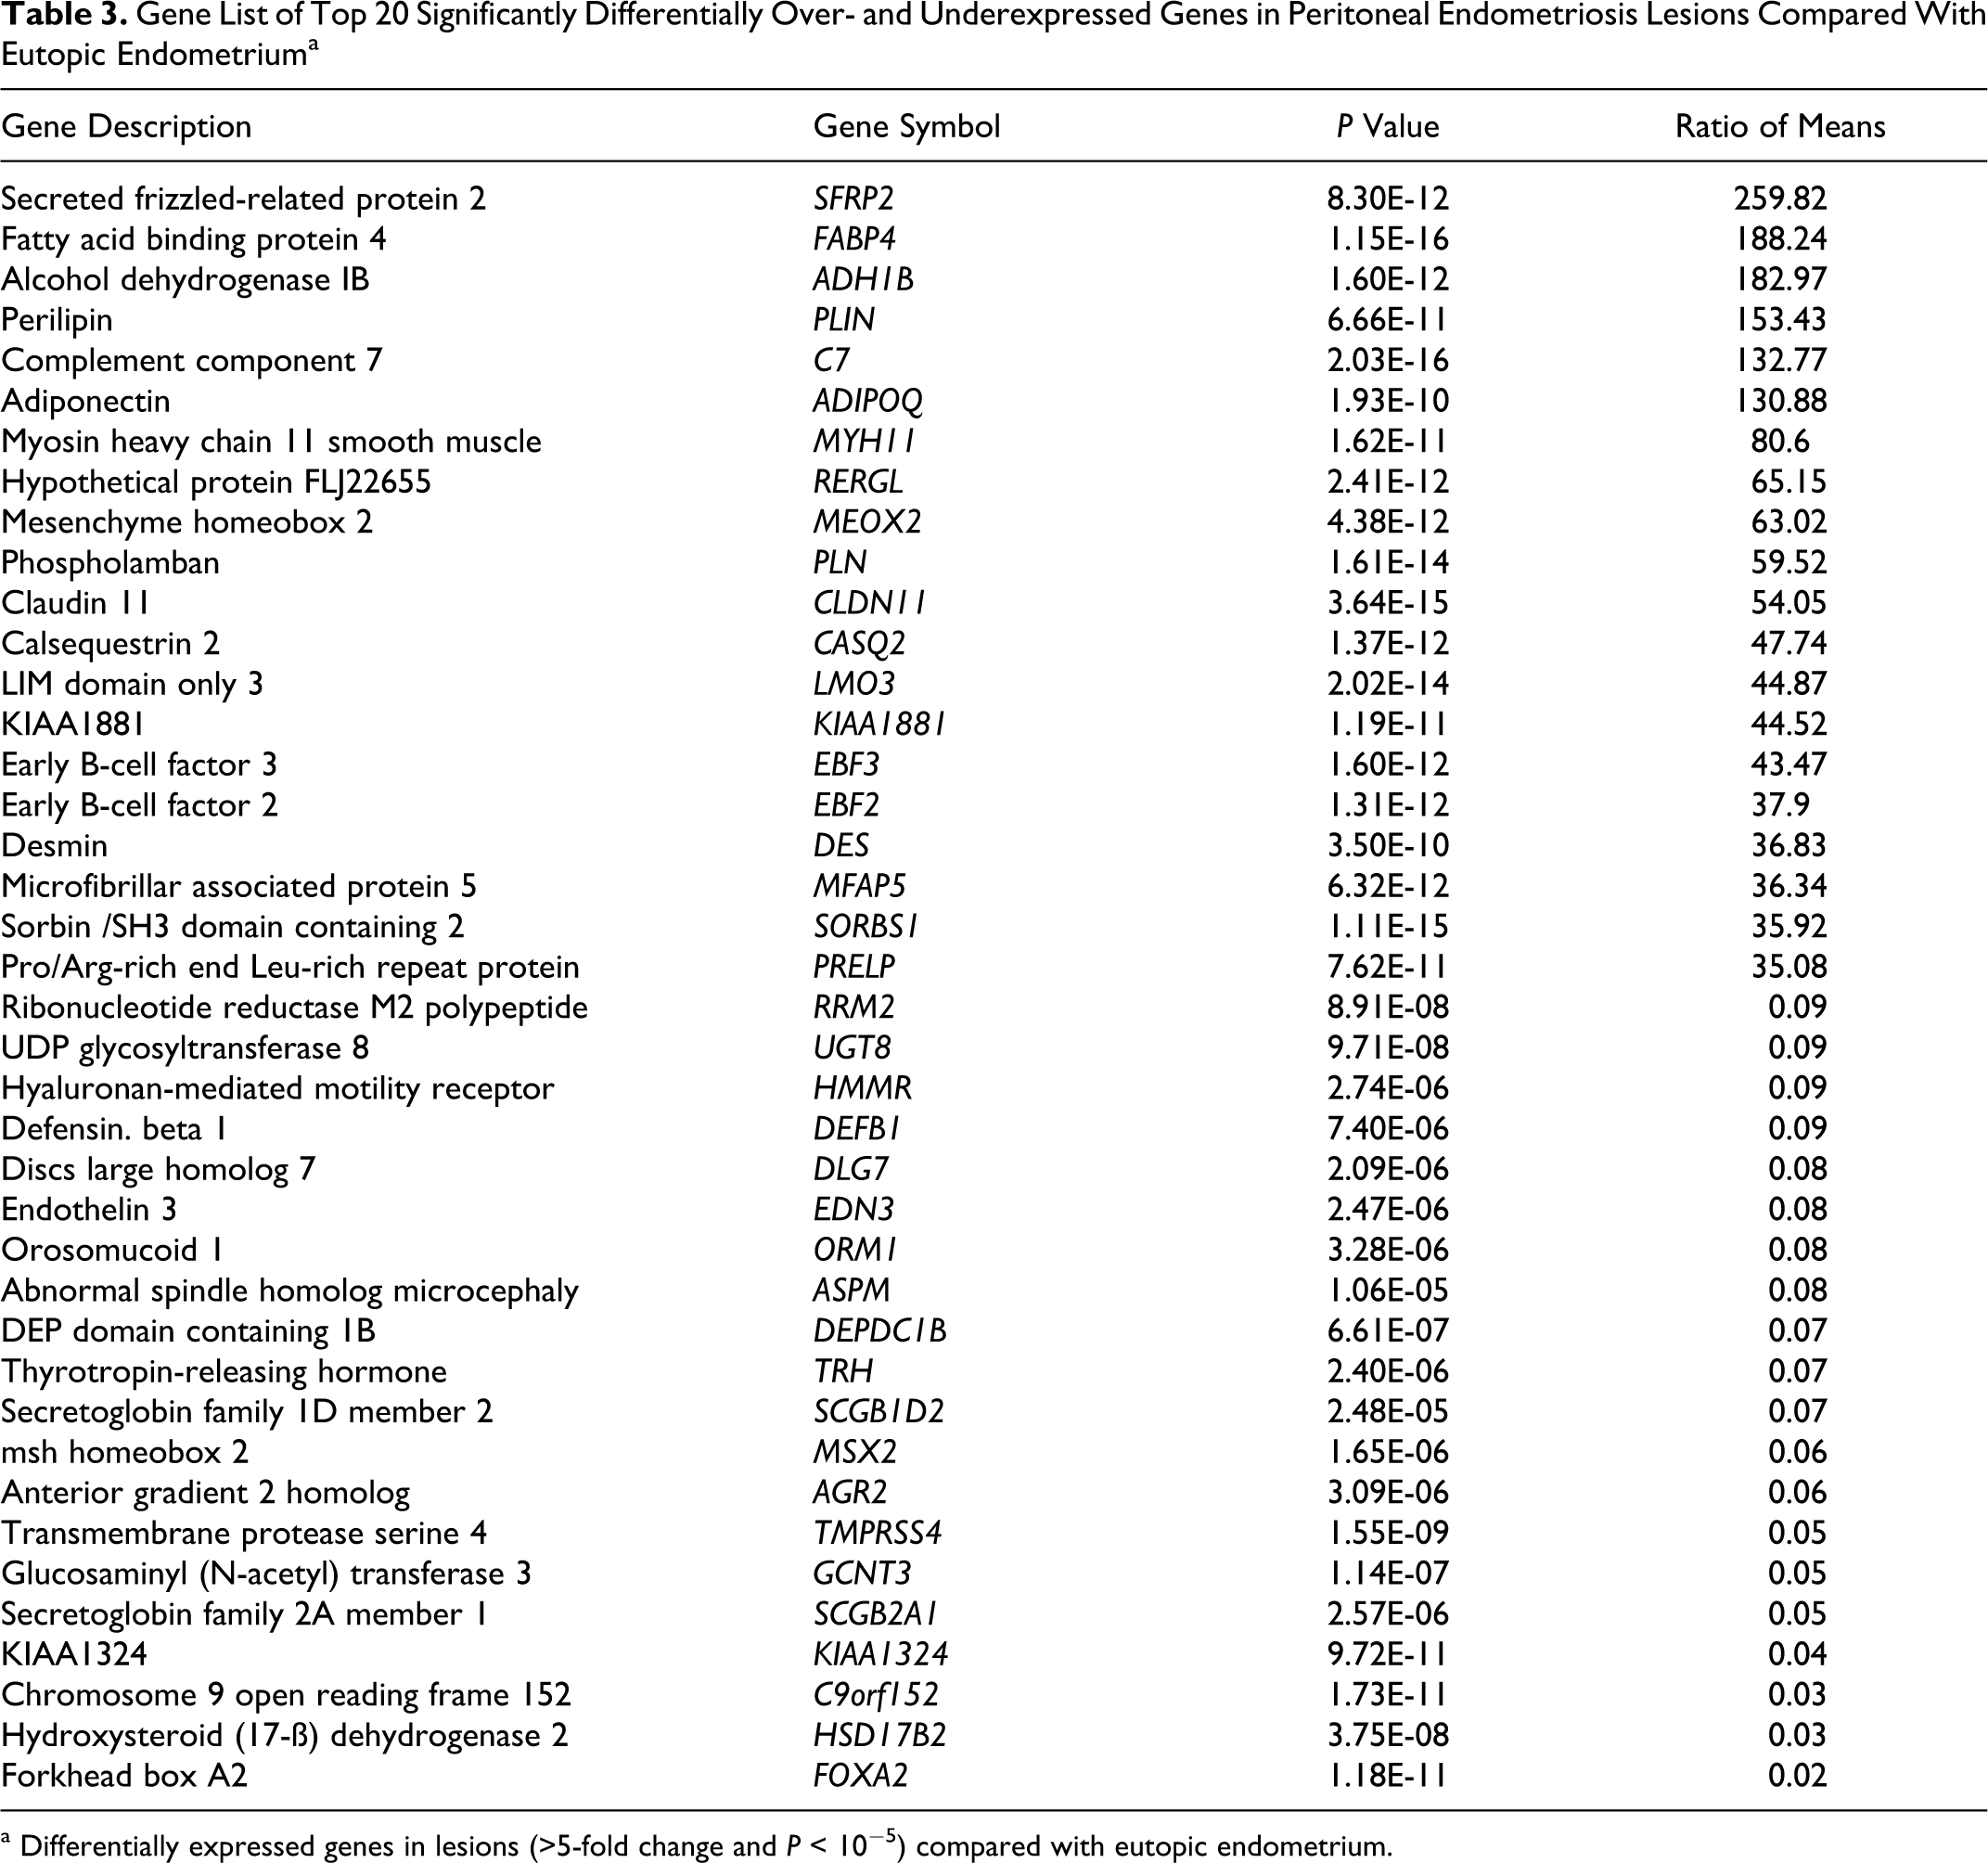
a Differentially expressed genes in lesions (>5-fold change and P < 10−5) compared with eutopic endometrium.
To further categorize the 3901 significantly over- or underexpressed probe sets in lesions, we performed a pathway analysis using the GeneGo MetaCore software. The most highly significant pathways which were overrepresented within the list of overexpressed genes involved specific cell processes related to cytoskeleton remodeling, muscle contraction, immune response, and blood clotting (Table 4). Examples of significantly overexpressed genes relating to both cytoskeleton remodeling and SM attributes were the aortic SM actin gene (ACTA2 or also called ASMA), MYH11, and the Rho-protein kinases 1 and 2 (ROCK-1 and -2). Underexpressed genes in lesions mainly related to cellular adhesion, tight junctions (eg, 3 of 6 claudin family members) and 11 of 13 O-glycan biosynthesis genes (Table 4).
Significantly Over- and Underexpressed Genes in Different Cellular Pathwaysa
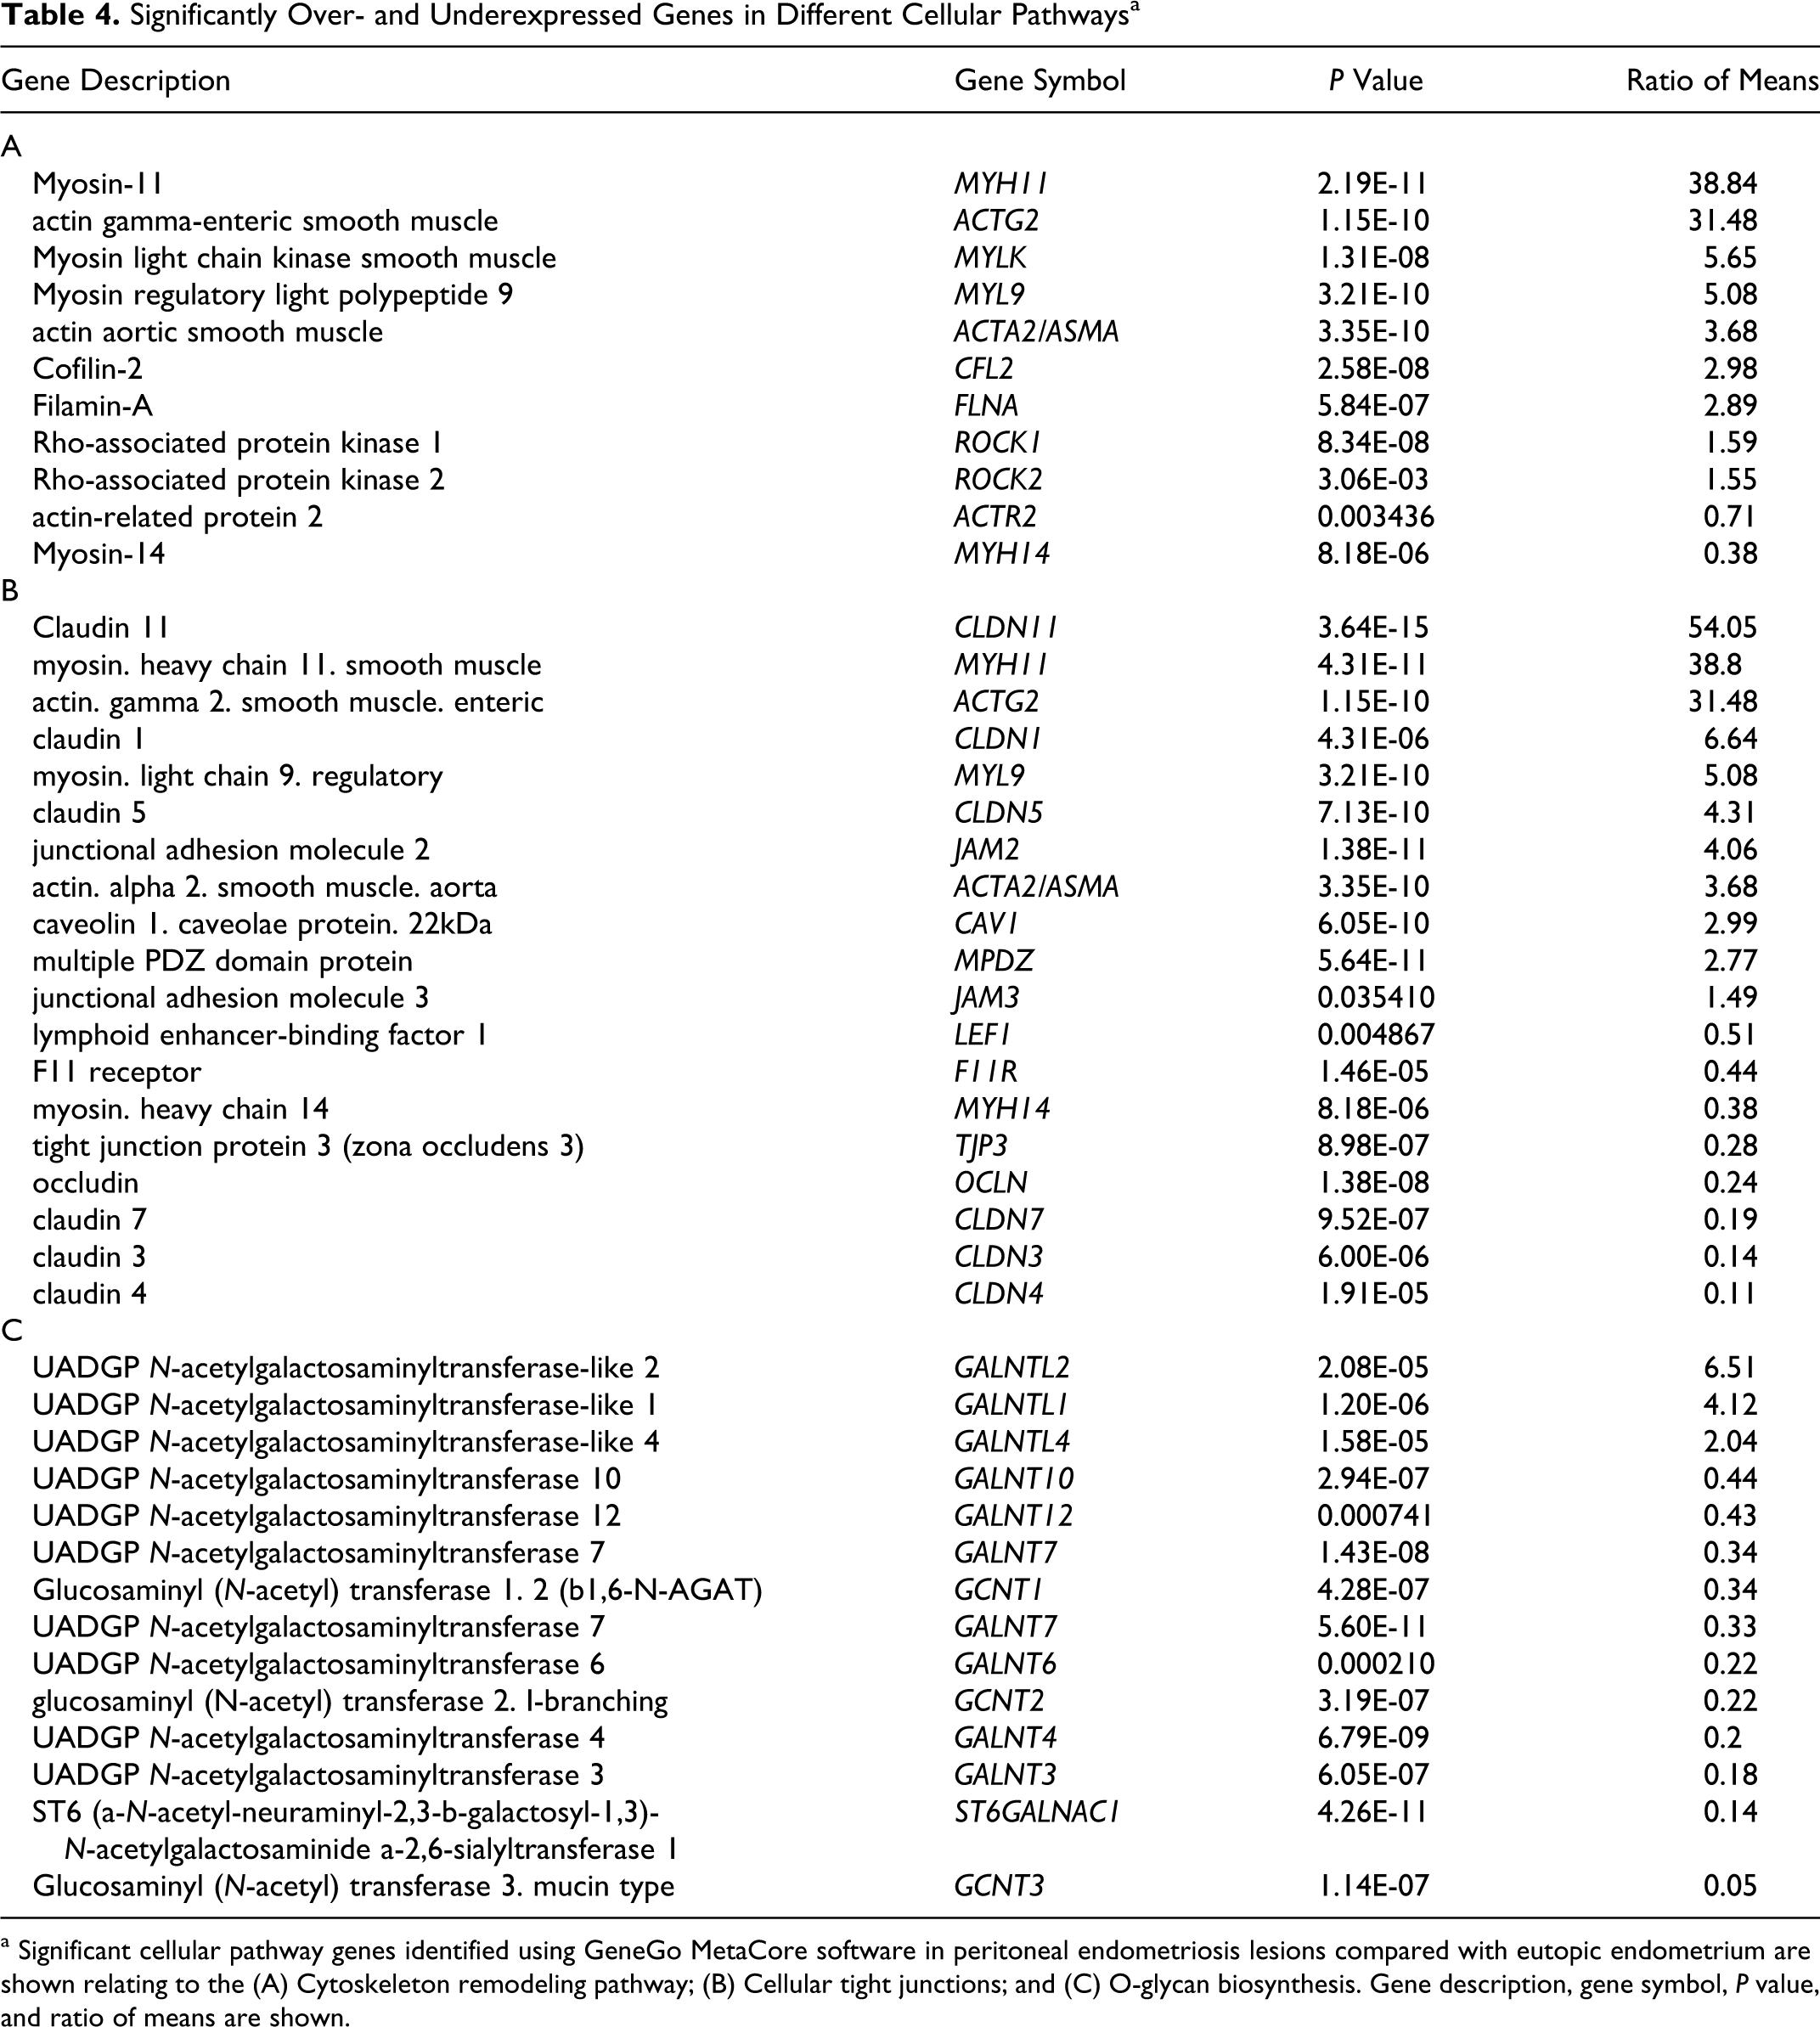
a Significant cellular pathway genes identified using GeneGo MetaCore software in peritoneal endometriosis lesions compared with eutopic endometrium are shown relating to the (A) Cytoskeleton remodeling pathway; (B) Cellular tight junctions; and (C) O-glycan biosynthesis. Gene description, gene symbol, P value, and ratio of means are shown.
Furthermore, infiltration of immune B-cells in lesions compared to eutopic endometrium also showed overexpression of genes from the immunoglobulin heavy chain gene (IGH) locus containing the IGHα1, 2; IGHγ1-3; IGHM and IGHV4-31 genes (P = 5.8E-03, ratio of means = 5.61), immunoglobulin light chain locus (IGL; P = 7.49E-04, ratio of means = 9.04), immunoglobulin kappa constant chain genes (IGKCV3-20;V3D-15;3D-11; P = 3.78E-03, ratio of means = 10.01), and the immunoglobulin kappa variable group genes (IGKV1-5; P = 7.59E-03, ratio of means = 8.01). The presence of monocytes and macrophages within the lesions was supported by overexpression of the cluster of differentiation antigen 68 (CD68; P = 2.30E-02, ratio of means = 1.86) and the colony-stimulating factor 1 (CSF-1; P = 3.47E-02, ratio of means =1.61). In contrast, the macrophage inhibitory factor (MIF) and endothelial growth factor (EGF) module containing mucin hormone receptor–like 1 (EMR1) were not statistically significantly differentially expressed in lesions compared with eutopic endometrium. Additionally, a 1.89-fold overexpression of the vascular EGF gene involved in angiogenesis (VEGFB, P = 2.72E-11) was found but not for VEGFA or VEGFC.
In line with tissue remodeling, differences supporting changes in cell types between lesions and eutopic endometrium were also observed. In general, lesions showed a reduction in epithelial cell characteristics and a gain of stromal cell characteristics in contrast to eutopic endometrium. Examples of underexpressed epithelial cell markers include the epithelial cell adhesion molecule (EPCAM, P = 4.88E-04, ratio of means = 0.15), cadherin 1 (CDH1 or E-cadherin, P = 9.93E–7, ratio of means =0.11), cytokeratin 18 (KRT18, P = 1.20E-5, ratio of means =0.13), and anterior gradient genes 2 and 3 (AGR2, P = 6.65E-7, ratio of means = 0.11; AGR3, P = 5.31E-02, ratio of means = 0.33) all commonly associated with glandular epithelium. On the other hand, stromal or mesenchymal cell markers like vimentin (VIM, P = 1.42E-02, ratio of means = 1.06) and the stromal cell-derived factor 1 (also called CXCL12, P = 2.86E-11, ratio of means = 3.84) were overexpressed in lesions.
Although the most prominent gene pathways pointed to tissue remodeling in lesions, we further examined the question of cellular growth. Our initial findings that during both menstrual cycle phases the cell division genes, CDC6, CCNB1, and Ki67 showed a low expression in lesions (Figures 2 and 3) prompted us to screen 30 key genes involved in cell cycling. For example, regulators of cell division like the cyclins and the genes involved in DNA synthesis were examined. Fifteen significantly differentially expressed genes were identified where 13 cell cycle genes were significantly underexpressed and 2 genes, the CDC14 yeast homolog and cyclin D3 were overexpressed (Supplementary Table 3).
The above results support that throughout the menstrual cycle, the overall gene expression of peritoneal lesions was not significantly fluctuating, in contrast to eutopic endometrium. Additionally, lesions demonstrated that prominent tissue remodeling and constant steroid-hormone receptor expression was linked to a slow but steady growth.
Gene expression analysis between lesions and peritoneum
Since lesions either initiate growth on peritoneum or are derived from peritoneum and because both tissues are exposed to similar environmental conditions, a statistical analysis was performed to determine the differences in gene expression between lesions and peritoneum. t-Test results with a volcano plot identified 4973 or 9% differentially expressed probe sets from a total of 54 675. Results showed that 3266 probe sets or 66% were increased and 1707 probe sets or 34% decreased in lesions compared to peritoneum. Among 2862 probe sets, 2416 were more than 2-fold overexpressed, and 446 were more than 2-fold underexpressed. Some examples of significantly overexpressed genes in lesions related to the epithelial phenotype like the ets homologous factor, the tumor-associated calcium signal transducer 1, also called EPCAM and AGR2 and AGR3 (Supplementary Table 4). Interestingly, the tight junction genes claudin 3 and the MMP-7, which are involved in the breakdown of extracellular matrix, during tissue remodeling processes, were also overexpressed in lesions compared to peritoneum. Although EPCAM, AGR2/3, and claudin 3 were downregulated in lesions when compared to eutopic endometrium, they were overexpressed in lesions versus peritoneum, thus supporting a hierarchy of gene expression when comparing these tissues (eutopic endometrium > lesions > peritoneum).
Identification of lesion-specific gene expression patterns
In order to identify genes that were highly specific for lesions, we performed 3 two-way comparisons using t tests from volcano plot analyses between lesions, eutopic endometrium, and peritoneum (Supplementary Table 5). A total of 13 significantly overexpressed probe sets (12 known genes) were found specific to lesions. Interestingly, among those 13 probe sets, DES, purkinje cell protein (PCP4), the potassium large conductance calcium-activated channel (KCNMA1), MYH11, and collagen type X alpha (COL10A1) were prominently overexpressed in lesions, demonstrating their specificity and further supporting a very prominent role in tissue remodeling (Supplementary Table 5).
Immunohistochemistry Comparing Peritoneal Endometriosis Lesions With Eutopic Endometriuma
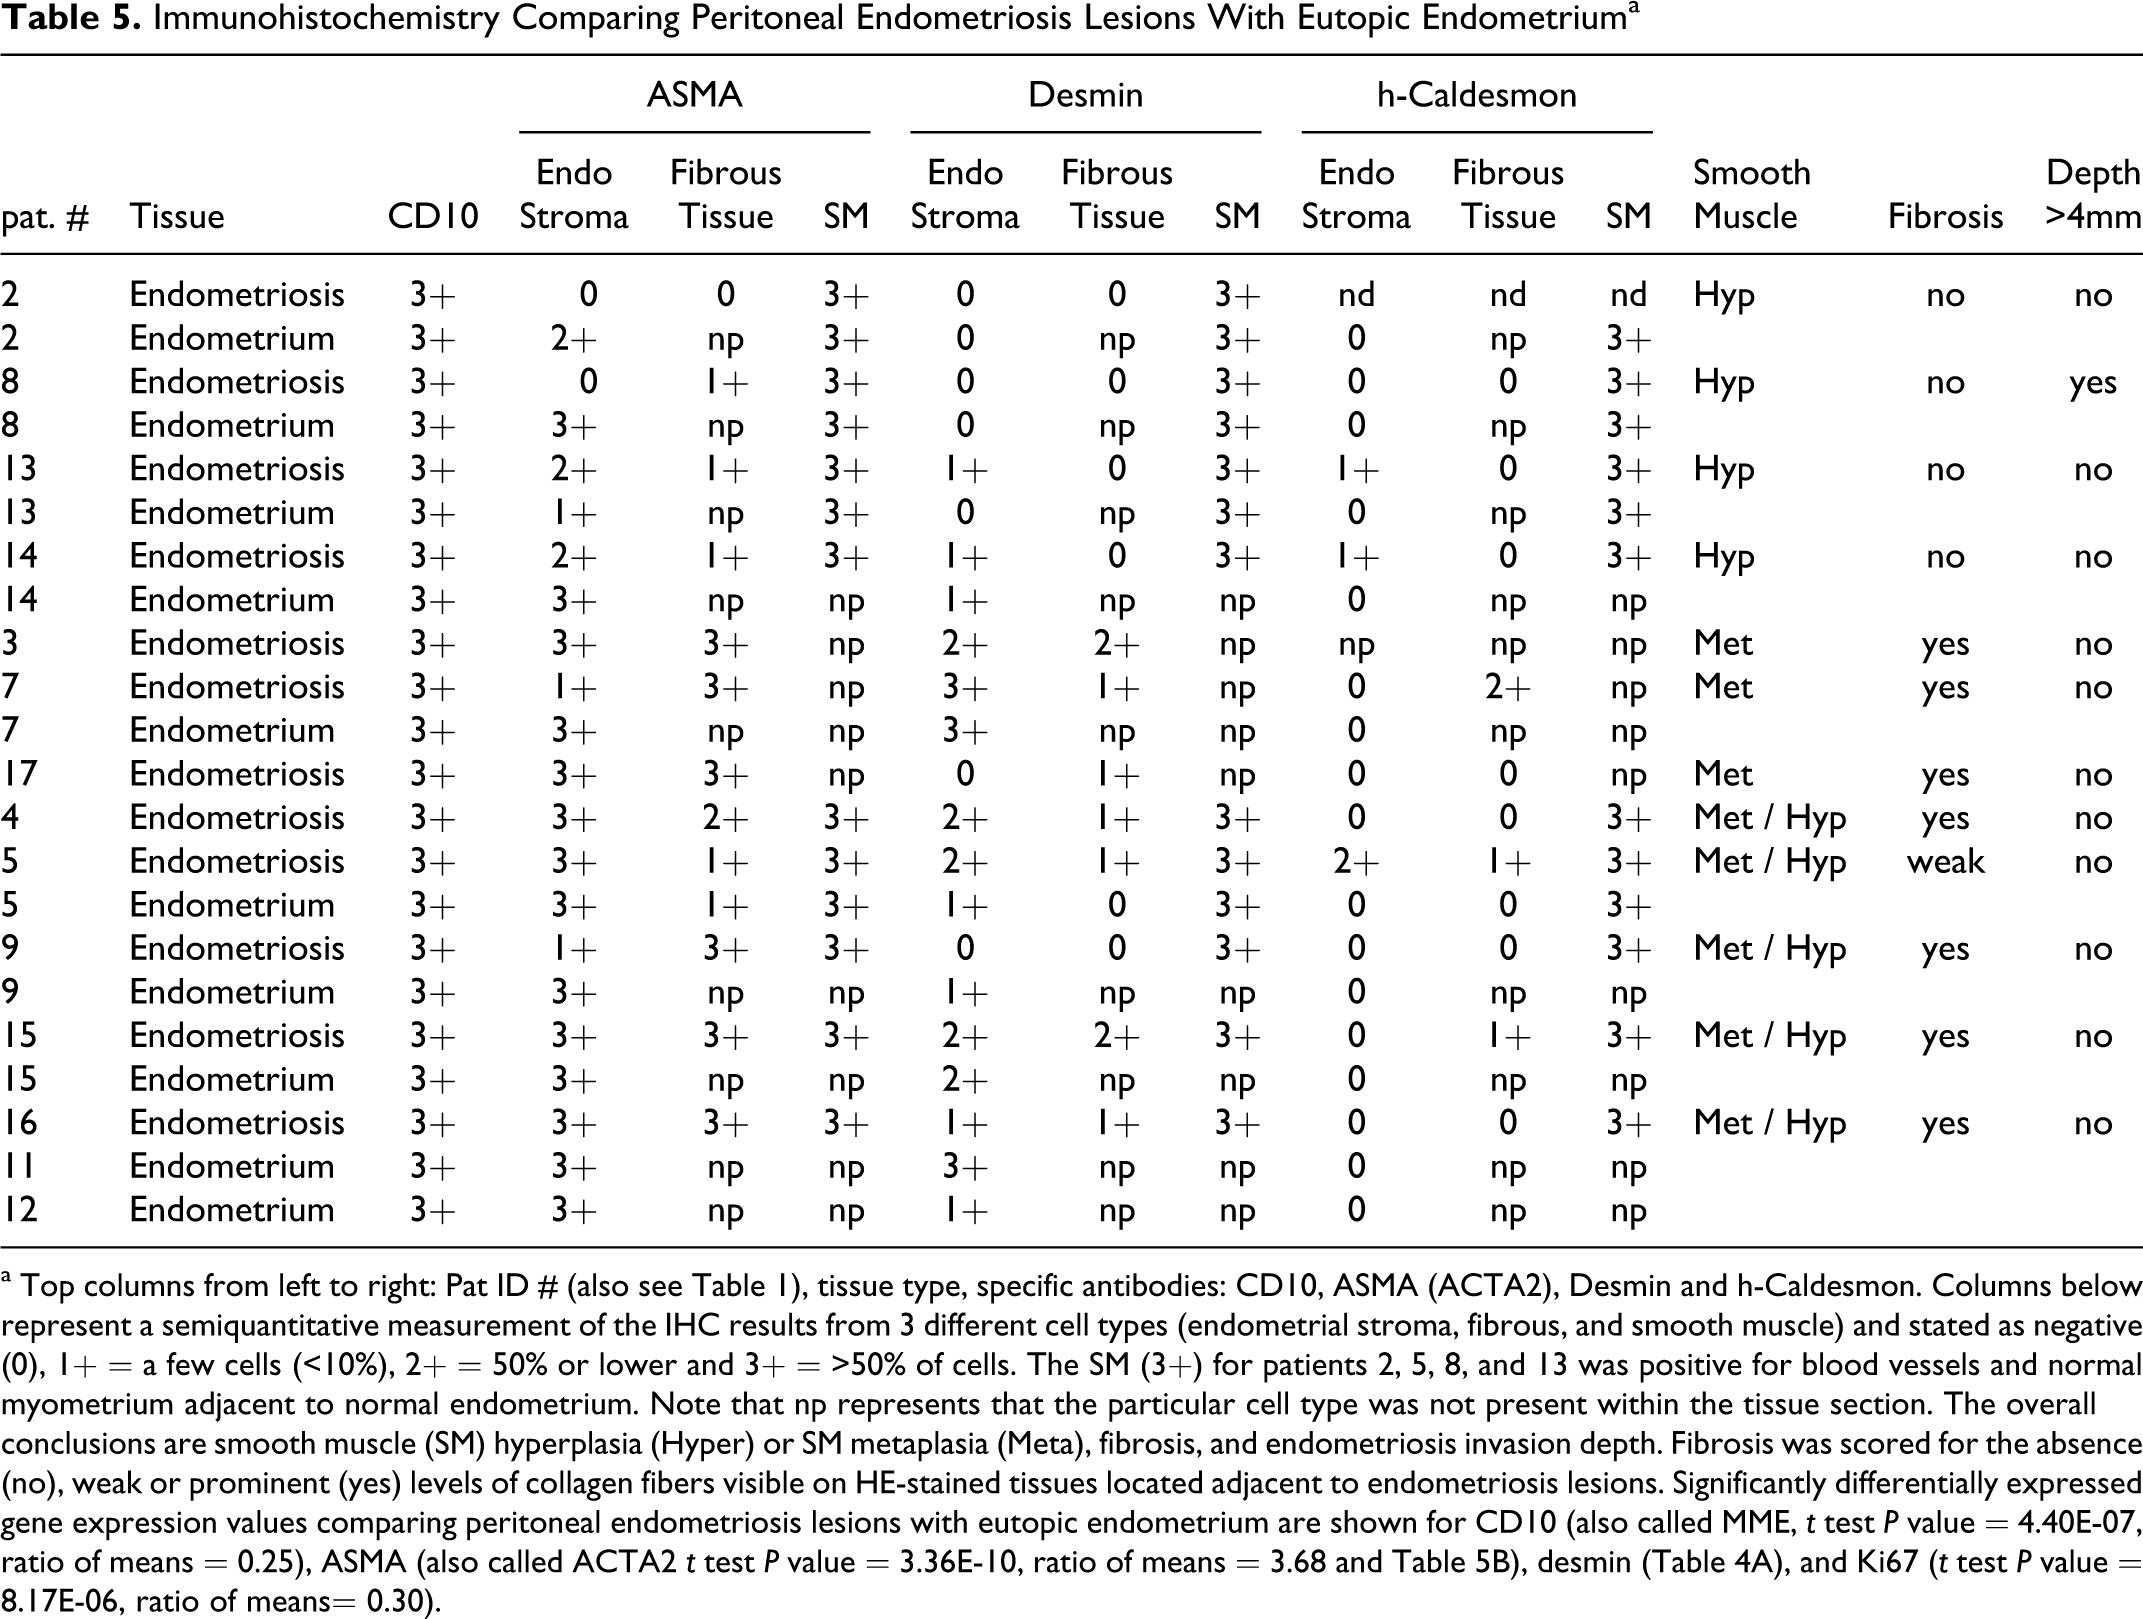
a Top columns from left to right: Pat ID # (also see Table 1), tissue type, specific antibodies: CD10, ASMA (ACTA2), Desmin and h-Caldesmon. Columns below represent a semiquantitative measurement of the IHC results from 3 different cell types (endometrial stroma, fibrous, and smooth muscle) and stated as negative (0), 1+ = a few cells (<10%), 2+ = 50% or lower and 3+ = >50% of cells. The SM (3+) for patients 2, 5, 8, and 13 was positive for blood vessels and normal myometrium adjacent to normal endometrium. Note that np represents that the particular cell type was not present within the tissue section. The overall conclusions are smooth muscle (SM) hyperplasia (Hyper) or SM metaplasia (Meta), fibrosis, and endometriosis invasion depth. Fibrosis was scored for the absence (no), weak or prominent (yes) levels of collagen fibers visible on HE-stained tissues located adjacent to endometriosis lesions. Significantly differentially expressed gene expression values comparing peritoneal endometriosis lesions with eutopic endometrium are shown for CD10 (also called MME, t test P value = 4.40E-07, ratio of means = 0.25), ASMA (also called ACTA2 t test P value = 3.36E-10, ratio of means = 3.68 and Table 5B), desmin (Table 4A), and Ki67 (t test P value = 8.17E-06, ratio of means= 0.30).
Confirmation of gene expression analysis using semiquantitative RT-PCR
In order to confirm the expression of specific genes that were overexpressed in our previous analyses, we performed RT-PCR to determine the expression on the single-gene level. We chose 3 genes for confirmation of our array data, DES, PCP4, and KCNMA1 (Supplementary Figure 1). For all 3 genes, the overall gene expression measured by RT-PCR showed statistically significantly higher levels among lesions compared to eutopic endometrium. For example, DES was significantly increased in 5 of the 8 patients, and both PCP4 and KCMN1 significantly increased in 7 of the 8 patients. In summary, comparing the results from the semiquantitative RT-PCR with the microarray data provided consistent results.
Histological and IHC of lesions and eutopic endometrium
In order to identify proteins specific to lesions that were significantly differentially expressed, we performed IHC on tissue sections from 12 lesions and 10 eutopic endometrium. First we immunolocalized the common acute lymphoblastic leukemia antigen (CALLA or CD10), which is a definitive diagnostic marker for identifying endometrial stromal cells. In addition, we analyzed expression of the SM protein markers ASMA, DES, and h-caldesmon a specific marker for differentiated SM cells. Furthermore, we assessed the protein expression of these markers in 3 different cell types (endometrial stroma, fibrotic, and SM cells) along with the histology of the lesion to test whether we could discern between SM hyperplasia, SM metaplasia, and fibrosis.
From all the 12 lesions examined, we detected strong CD10 expression within the endometriotic stromal cells, confirming the diagnosis of endometriosis (Table 5, Figure 4). From our IHC analyses, we classified lesions into SM hyperplasia or SM metaplasia, and fibrosis. Lesions from 4 patients (#2, 8, 13, and 14) were defined as SM hyperplasia (Table 5, Figure 4). Our IHC criteria for classifying SM hyperplasia included very weak expression of DES and h-caldesmon in the endometriotic stroma and high expression of ASMA, DES, and h-caldesmon in differentiated SM cells as well no significant fibrosis. Although these lesions showed ASMA expression within the endometriotic stroma, high expression was also detected in the stroma of eutopic endometrium. Since ASMA protein expression has been noted as a common finding in normal endometrium as well as decidualized cells, 46 ,47 we did not consider ASMA as a specific marker to interpret metaplastic changes occurring in the stroma.
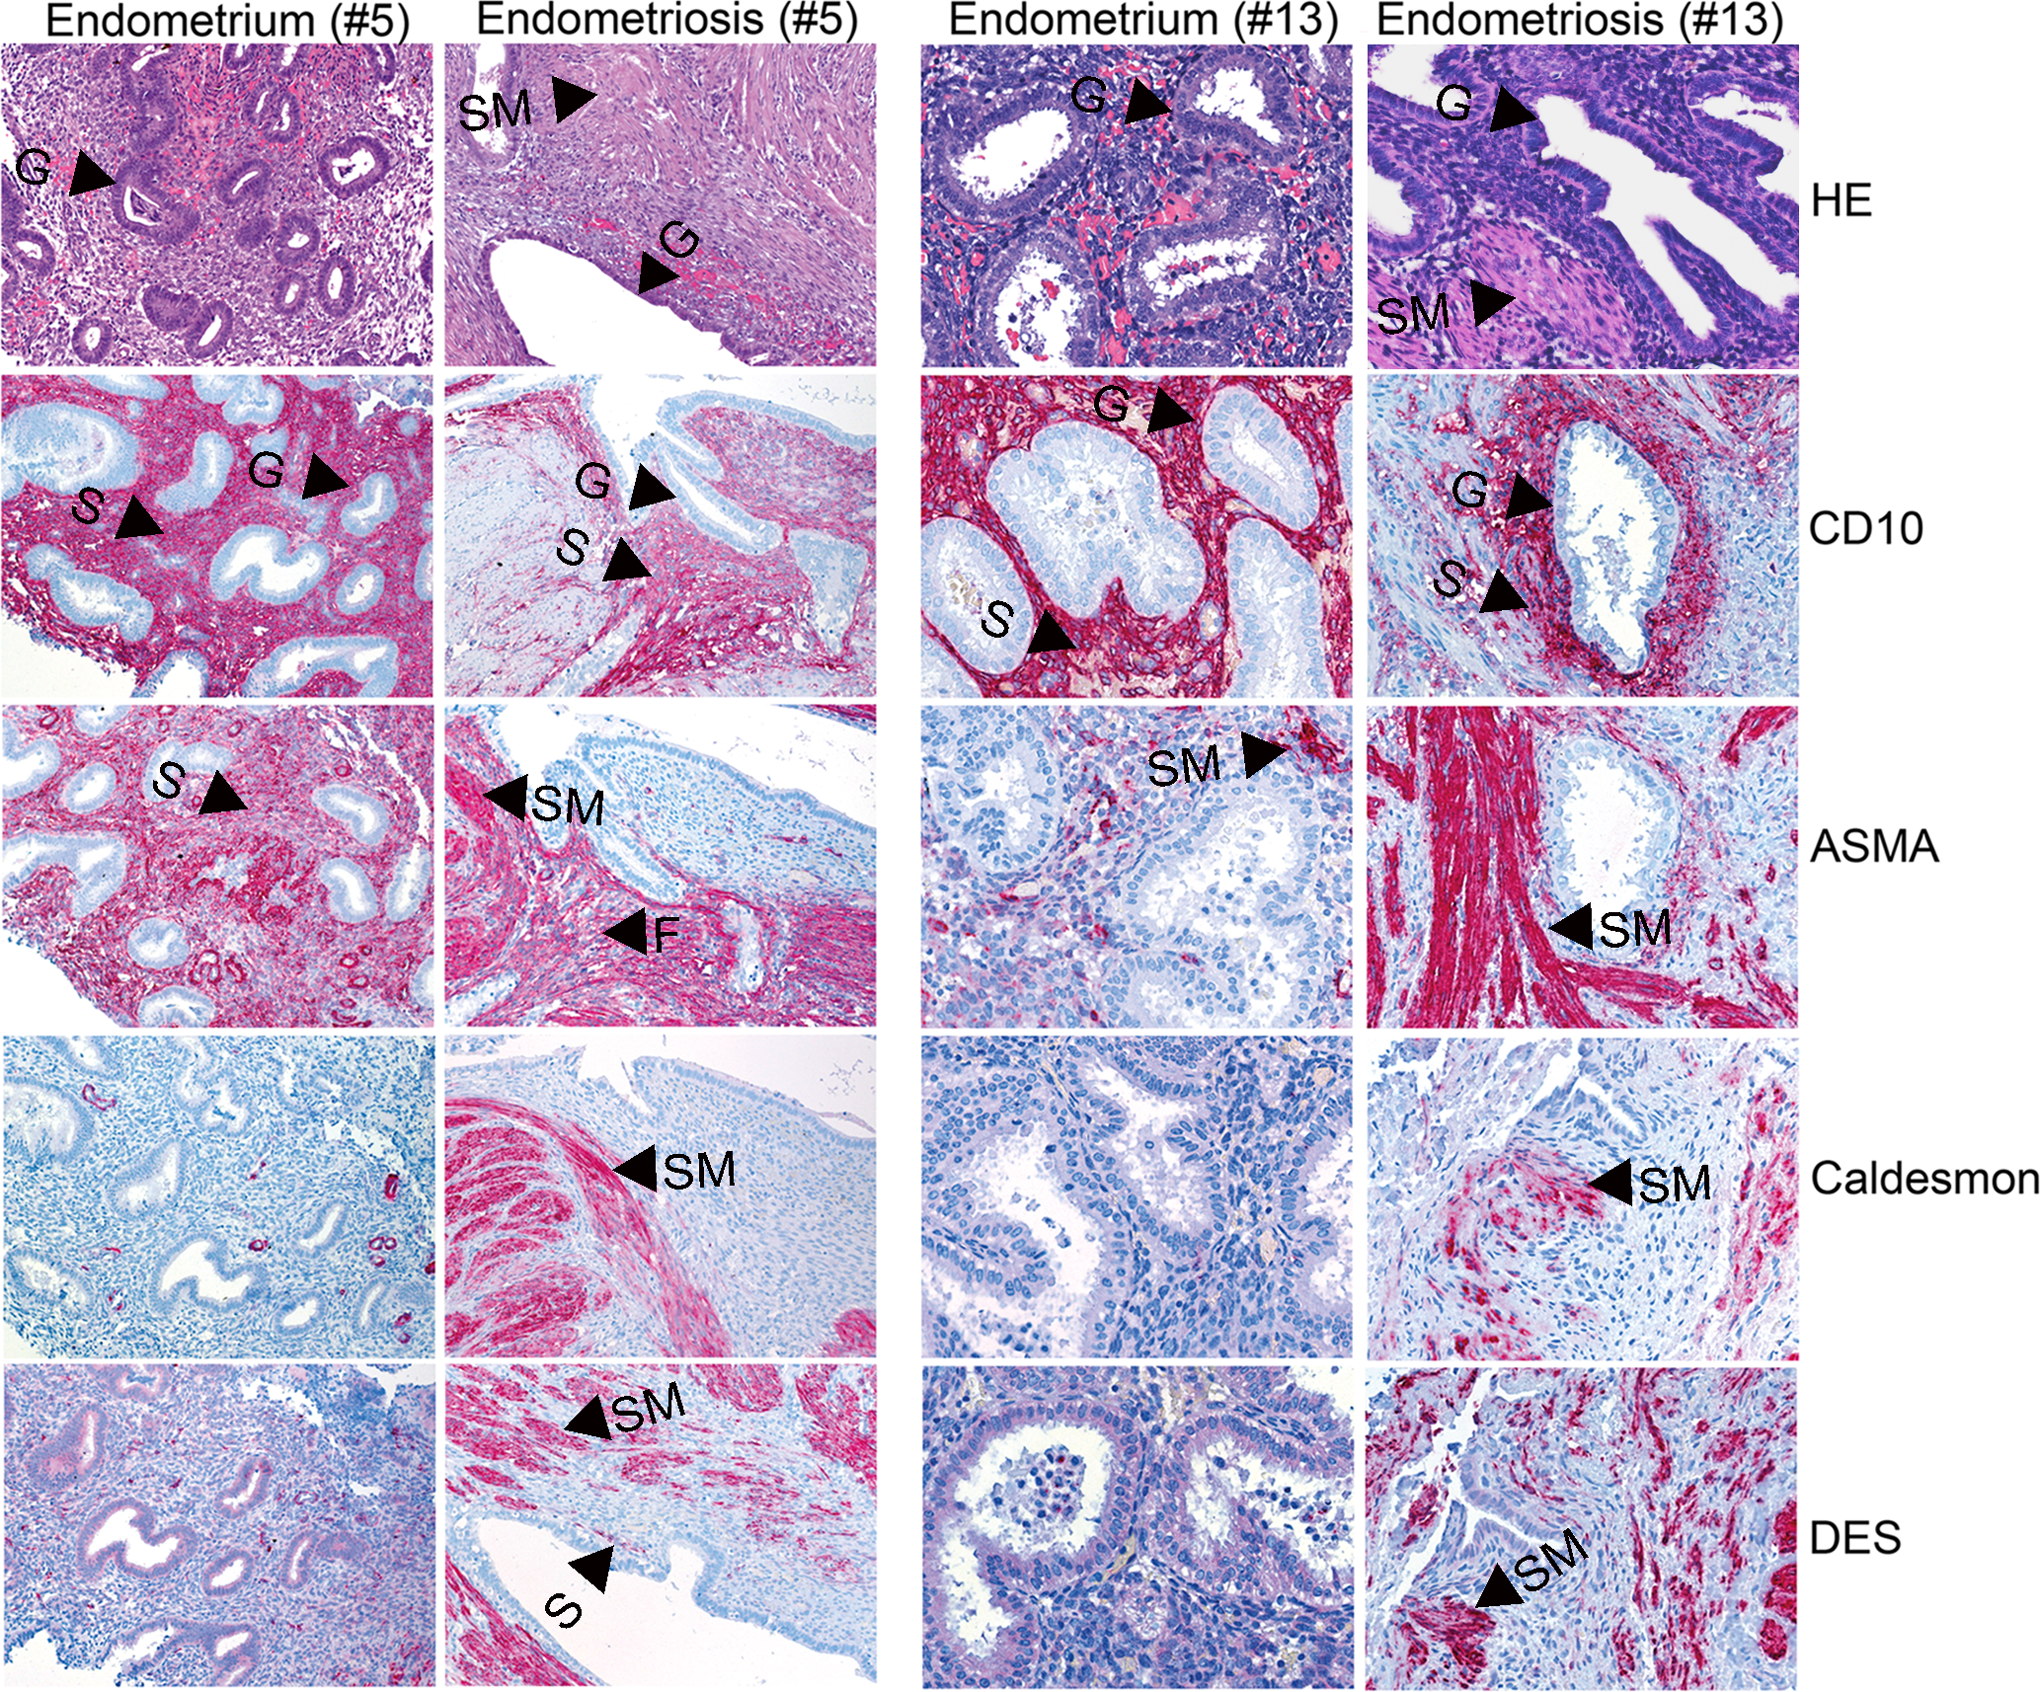
Immunohistochemistry comparing peritoneal endometriosis lesions with eutopic endometrium and peritoneum. Panel showing hematoxylin/eosin (HE) tissue staining and 4 different antibody immunolocalizations of CD10, ASMA, h-caldesmon, and DES of peritoneal endometriosis lesions (patient 5 demonstrating both SM metaplasia and hyperplasia; patient 13 representing SM hyperplasia) compared to patient-matched eutopic endometrium. Arrows either point to gland (G), stroma (S), SM (SM), and fibrosis (F). Note that eutopic endometrium from patient #5 represents the proliferative phase compared to the lesion showing secretory-like characteristics (Figure 3, Table 4; pictures represent ×200 magnification). The eutopic endometrium from patient # 13 demonstrates the secretory phase compared to the matched lesion which shows no definitive menstrual cycle phasing (Table 4; pictures represent ×400 magnification). ASMA indicates aortic smooth muscle actin; DES, desmin; SM, smooth muscle.
Other patient cases revealed 3 lesions as SM metaplasia (#3, 7, and 17); and 5 lesions with a mixture of SM hyperplasia and SM metaplasia (#4, 5, 9, 15, and 16). Our IHC criteria defining different scenarios involving SM metaplasia was (1) higher expression of ASMA in fibrous tissue and/or (2) higher DES expression in the stroma and fibrous tissue; and (3) no detectable SM cells. In cases where SM metaplasia and SM hyperplasia were together in addition to the above, ASMA, DES, and h-caldesmon demonstrated high expression in SM cells. Since h-caldesmon was specifically expressed in fully differentiated SM cells, but was absent or only focally expressed in endometriotic stroma and fibrous tissue could further discriminate hyperplasia from metaplasia. In regard to eutopic endometrium in general we observed no or low DES expression in stromal cells (Table 5). However, in two cases (patients 7 and 11) high DES expression was found and corresponded specifically with a late secretory menstrual cycle phase, which could relate to a possible cycle-dependent DES in decidual cells. 46
Discussion
In the present analyses, 18 peritoneal endometriosis lesions were compared with eutopic endometrium and peritoneum from both cycle phases using a large-scale gene microarray of 54 675 probe sets (Table 1). Significant findings were confirmed with RT-PCR and IHC. The themes discussed below will be presented in light of earlier publications especially addressing similarities to ovarian lesions (Table 1), but also in view of peritoneal endometriosis as a steroid hormone-dependent disease, its proliferative nature, and the dynamic tissue remodeling process occurring at lesion sites.
Establishing that eutopic endometrium demonstrated 1137 differentially expressed gene probe sets between proliferative and secretory phases, including 8 known menstrual cycle phase reference genes, paved the way for several comparisons with lesions. As predicted, both ESR1 and PGR showed high expression levels in the proliferative phase of eutopic endometrium. This finding is in line with Fujishita et al 48 who demonstrated the highest possible score using IHC for ESR1 and PGR in the early proliferative phase of eutopic endometrium in a variety of gynecological disorders, including peritoneal endometriosis. Furthermore, our histological analyses of eutopic endometrium showed distinctive proliferative or secretory menstrual phases supporting responsiveness to steroid hormones. Thus, we conclude for eutopic endometrium that the gene expression, serum hormones, and histology were congruent.
Our findings that lesions showed no statistical evidence for menstrual cycle phasing according to a PCA, menstrual cycling genes, and histology are supported in part by previous studies but also bring forth new information regarding significant differences to eutopic endometrium possibly relating to growth. These above observations establish that peritoneal lesions do not have the same proliferative and secretory menstrual cycling characteristics as eutopic endometrium and thus are distinctly different and no longer synchronized with eutopic endometrium under the same hormonal control. For example, very early investigations using both electron and light microscopy demonstrated that lesions were either 33% or 87% nonsynchronous with patient-matched eutopic endometrium in terms of menstrual cycle phasing.49,50 In our analyses, 1 of 8 pairs of patient-matched tissues showed the same histology indicative of the secretory phase, but for all 11 other patient and nonmatched lesions a distinctive menstrual cycle phase was not identifiable or only “secretory-like” characteristics with no indication of menstrual cycling were found. Although we determined that ESR1 and PGR were significantly lower in peritoneal lesions compared to eutopic endometrium, lesions showed constant levels of both receptors with no significant change. In line with this finding, other investigators observed constant ESR1 and PGR protein expression levels with no significant fluctuation throughout the menstrual cycle for both peritoneal and ovarian endometriosis lesions.48,51,52 In SM cells associated with deep infiltrating lesions, ESR1 and PGR expressions were also not different throughout the menstrual cycle. 53 Furthermore, it is interesting to note that no previous microarray study identified significant differences of both steroid hormone receptors comparing ovarian lesions with eutopic endometrium.31,33,36–39 However, it was previously demonstrated using gene 39 and tissue 52 microarrays that peritoneal lesions expressed significantly higher levels of ESR1 and PGR compared to ovarian lesions, supporting that increased steroid hormone regulation plays a more prominent role at peritoneal lesion sites. Importantly, it was noted early on that upon hormonal therapy of endometriosis patients, including 17α-ethinyl testosterone (Danazol), medroxyprogesterone acetate (Progestin) or oral contraceptives, steroid hormone receptor expression significantly decreased to undetectable levels in lesions when compared to lesions of untreated patients. 51 This supported that hormonal suppression of endometriosis patients was linked with a reduction in hormonal responsiveness of the lesion, possibly blocking lesion growth. 51
It is known that high local E2 levels in endometriotic tissue could result from reduced expression of HSD17B2 and contribute to abnormal growth. 15 We identified that HSD17B2 was the fifth most downregulated gene (26.6-fold) in peritoneal lesions compared to eutopic endometrium. A 5.9-fold significant HSD17B2 decrease in expression was also found exclusively for ovarian lesions 38 and an 8.7-fold but nonsignificant decrease in expression was noted from Eyster et al. 39 Decreased PGR expression, especially the loss of the PGR-B isoform but not PGR-A, has been implicated as one cause for lower HSD17B2 expression and a P4 resistance phenotype in endometriosis lesions related to therapy.54,55 However, it is unknown at present how PGR-A target gene regulation is affected in endometriotic cells when PGR isoform ratios become unbalanced. Although our study could not discern between PGR-A and PGR-B expression levels in lesions, our findings of significantly reduced total PGR and HSD17B2 expression along with a lack of distinctive secretory phase characteristics point to a possible P4 resistance phenotype. Both PGR-A and PGR-B differ in protein size, cellular distribution, transcriptional target gene regulation, and protein domain regulation. 56 Particularly during the menstrual cycle, PGR plays an essential role in the inhibition of estrogen-induced epithelial proliferation. Therefore, in light of the literature along with our above findings we predict an overall growth advantage for proliferation of endometriosis lesions since luteal phase differentiation and decidualization would be halted either due to low PGR expression or possibly by P4/PGR-A signaling. This scenario would result in constant E2/ESR1 signaling as a prominent feature, however, promoting a slow and steady growth.
Interestingly, other genes like N-acetylgalactosaminyl-transferases (GalNAc) and -transferase-like proteins (GALNT and GALNTL), which fluctuate throughout the menstrual cycle and mediate posttranslational protein modifications, were also found deregulated in our study as well as ovarian endometriosis lesions. 38 Furthermore, these genes were also implicated in morphological and glycosylation changes during the menstrual cycle in a baboon model of endometriosis. 57 Our study determined that peritoneal endometriosis lesions were significantly different in expression for 13 different GALNT, GALNTL, and GCNT gene family members compared to eutopic endometrium. Regarding ovarian lesions, 10 of the same genes showed the same deregulation as peritoneal sites. 38 Taken together, these findings point to similar abnormal regulation of posttranslational protein modifications which may relate to a lack of menstrual cycling regarding endometriosis lesions.
Highly proliferative eutopic endometrium from our patient cohort showed an increased expression of genes involved in the regulation of the cell cycle, for example CCNB1 and CDC6, where we identified CDC6 as the sixth most significant overexpressed gene compared to the secretory phase. As a key proliferation marker, significant Ki67 gene and protein overexpression around 30% to 50% distinguished highly proliferative endometrium. In strong contrast, our study along with the literature clearly demonstrated significantly lower proliferation of peritoneal and ovarian endometriosis lesions according to Ki67.52,58 In a recent tissue microarray study, Ki67 was found to be significantly lower in ovarian endometriosis lesions compared to peritoneal lesion sites. 52 Additionally, ovarian lesions were considered nearly quiescent showing suppression of cell cycle genes. 38 Our findings that significantly underexpressed key cell cycle genes showed no statistical difference between menstrual cycling phases further proves that a steady, but low-proliferative growth is a prominent feature of peritoneal lesions.
Tissue remodeling is an essential process during embryonic development as well as in wound healing. This dynamic process involves cross-talks between different tissues via protein and/or hormonal regulators leading to for example increased cellular proliferation, inflammation, or changes in cell–cell contacts and cellular differentiation. It is important to note that for both peritoneal and ovarian lesions all 10 gene expression array studies including ours demonstrated a significant role for immune cells and cytokines supporting inflammation at lesions and point to the importance for continued research in this area (Table 1). In regard to cell adhesion, there is strong evidence for a prominent role in both peritoneal and ovarian endometriosis. Deregulation of cell–cell adhesion results in cellular detachment and increased invasiveness, which are essential during development but also in tumorigenesis. In this and other studies, a loss of E-cadherin and a gain of vimentin was observed in both peritoneal and ovarian lesions compared to eutopic endometrium, supporting a change to more mesenchymal phenotype.31,38,39,58 Gaetje et al 59 ,60 demonstrated in primary endometriosis cells that decreased E-cadherin levels corresponded with increased invasion. Other cell–cell adhesion molecules like the claudin superfamily regulate apical cell–cell adhesion, paracellular permeability, and epithelial cell polarity. 61 Interestingly, our study showed the same over- and underexpression pattern for 6 claudin family members as found in ovarian endometriosis. 38 These findings are also in line with one investigation where a custom array identified several aberrant expression of claudin family members in both ovarian (n = 3) and peritoneal endometriosis lesions (n = 3). 62 Deregulation of the claudin superfamily has also been found in a variety of tumors in a tissue-specific manner 61 and yields similarities with endometriosis. For example, the observation of claudin 1 and 5 overexpression in both our peritoneal lesions and ovarian lesions from Borghese et al 38 has been noted in endometrial, ovarian stromal, hepatocellular, pancreatic, and in prostate tumors for claudin 1 and gastric, lung, and ovarian carcinomas for claudin 5. 61 In contrast, the observed significant claudin 3, 4, and 7 downregulation in endometriosis lesions was also common to hepatoblastomas, ovarian, and small cell lung and head/neck carcinomas.38,61 In addition, a similar low expression of claudin 3, 4, and 7 along with low E-cadherin and mucin 1, also called the claudin-low subtype, signified mammary tumor cells with mesenchymal or stem cell-like characteristics. 63 Taken together, alterations in the above cell adhesion molecules may contribute to the invasive properties of a population of peritoneal and ovarian endometriosis cells and contain a claudin-low subtype population of mesenchymal or stem cells involved in clonal regeneration.
The most prominent statistically significant remodeling pathways identified in our study were those involving cytoskeleton and muscle contraction. Our results not only showed that in lesions DES and MYH11 were among the top 20 most significantly overexpressed genes involved in cytoskeleton remodeling and muscle contraction but were the highest significantly overexpressed genes in lesions when compared in a 3-way statistical analysis with eutopic endometrium and peritoneum. The DES is an intermediate filament type III cytoskeletal protein, which locates to dense bodies in SM cells and plays a critical role in maintenance of structural and mechanical integrity of the contractile apparatus. 64 Additional genes significantly overexpressed relating to cytoskeleton remodeling and regulation of muscle contraction were ASMA, other myosin SM–related genes (eg, MYL9, MYLK), and ROCK–1 and -2. Activation of ROCK 1 and 2 permits actin/myosin interactions and SM cell contraction maintaining myosin light chain kinase activity, independent of calcium regulation. 65 Although other array studies detected significant changes in the same remodeling genes specific for SM cytoskeleton, these genes showed differences (Table 1). For example, although DES was significantly overexpressed in ovarian endometriosis, it was not ranked in the top 100 significantly overexpressed genes. 38 Similar to our study, MYH11 ranked in the top 100 overexpressed genes in ovarian endometriosis, but in contrast to our findings other key genes related with SM were either significantly underexpressed or unaffected (eg, MLY9, MYLK, ROCK-1, and -2). In further contrast to our study, genes related to actin cytoskeleton were among the most downregulated genes in ovarian endometriosis. 38 Therefore, it appears that peritoneal lesions demonstrate similar adhesion properties but more aberrant changes in steroid hormone regulation for example receptors, HSD217B, and higher proliferation compared to ovarian endometriosis lesions. In further contrast to ovarian endometriosis lesions, peritoneal lesions showed more prominent tissue remodeling relating to cytoskeleton and SM attributes.
Evidence at the histological and protein expression level for a prominent role of cytoskeleton and muscle tissue remodeling occurring at lesions was shown in this and past investigations. In 4 cases where DES-, h-caldesmon-, and ASMA-positive cells exclusively associated with increased differentiated SM bundles in tissue locations where SM cells or “multipotent cells” are present in normal peritoneum; we concluded that SM hyperplasia stemmed from abnormal proliferation of the peritoneum. There is support from the literature where SM hyperplasia was proven histologically in cases where hyperplasia along with hypertrophic thickening of indigenous SM occurred mainly with deep infiltrating endometriosis of the bowel, rectovaginal, and intestinal regions.23,66,67 Interestingly, in our analyses one hyperplastic lesion occurring in the peritoneum wall (patient #8) was deep infiltrating >4 mm.
Depending on stromal and or fibrotic tissue plus/minus SM cells positive for DES, ASMA, and h-caldesmon could discern SM metaplasia from SM hyperplasia. Although SM hyperplasia occurring alone most likely resulted from proliferation of the peritoneum; in tissues where both SM metaplasia and SM hyperplasia occurred together one cannot rule out that fibroblasts indigenous to stroma or fibrotic regions transdifferentiated into myofibroblasts and then into fully differentiated SM cells. It is important to note that Barcena de Arellano et al 11 using similar antibodies like ASMA, DES, SM myosin heavy chain, and h-caldesmon demonstrated various grades of differentiated SM cells occurring more abundantly in peritoneum lesions compared to normal peritoneum. These authors concluded a process of SM metaplasia stemming from endometriotic cells. 11 van Kaam et al 29 also noted SM metaplasia in 20 deep infiltrating lesions (rectovaginal, colon, vaginal, and bladder) with increased amounts of fibromuscular tissue derived from myofibroblast cells and positive staining for vimentin, DES, ASMA, and MYH11. In parallel these authors also demonstrated fibromuscular differentiation following successful implantation of human endometrium in the peritoneal cavity of nude mice.
Our present microarray study contributes to the understanding of the molecular pathology of peritoneal endometriosis. A hypothetical model of peritoneal endometriosis is presented in Figure 5 which is based from the literature, our microarray, and IHC data. Thus, it will be important in the future to conduct additional studies to further substantiate the pathology of endometriosis. In summary, peritoneal lesions are distinctly different in gene expression to eutopic endometrium where lesions demonstrate no menstrual cycle phasing but constant steroid hormone receptor expression where a slow and steady growth is linked with tissue remodeling. Understanding steroid hormone receptor regulation in benign gynecological diseases after drug intervention is ongoing. 66 Therefore, molecular knowledge of peritoneal lesion growth and tissue remodeling could help to develop new treatments, especially by targeting steroid hormone receptors with for example progestins, selective progesterone, and estrogen receptor modulators, which would affect endometriosis lesions directly.
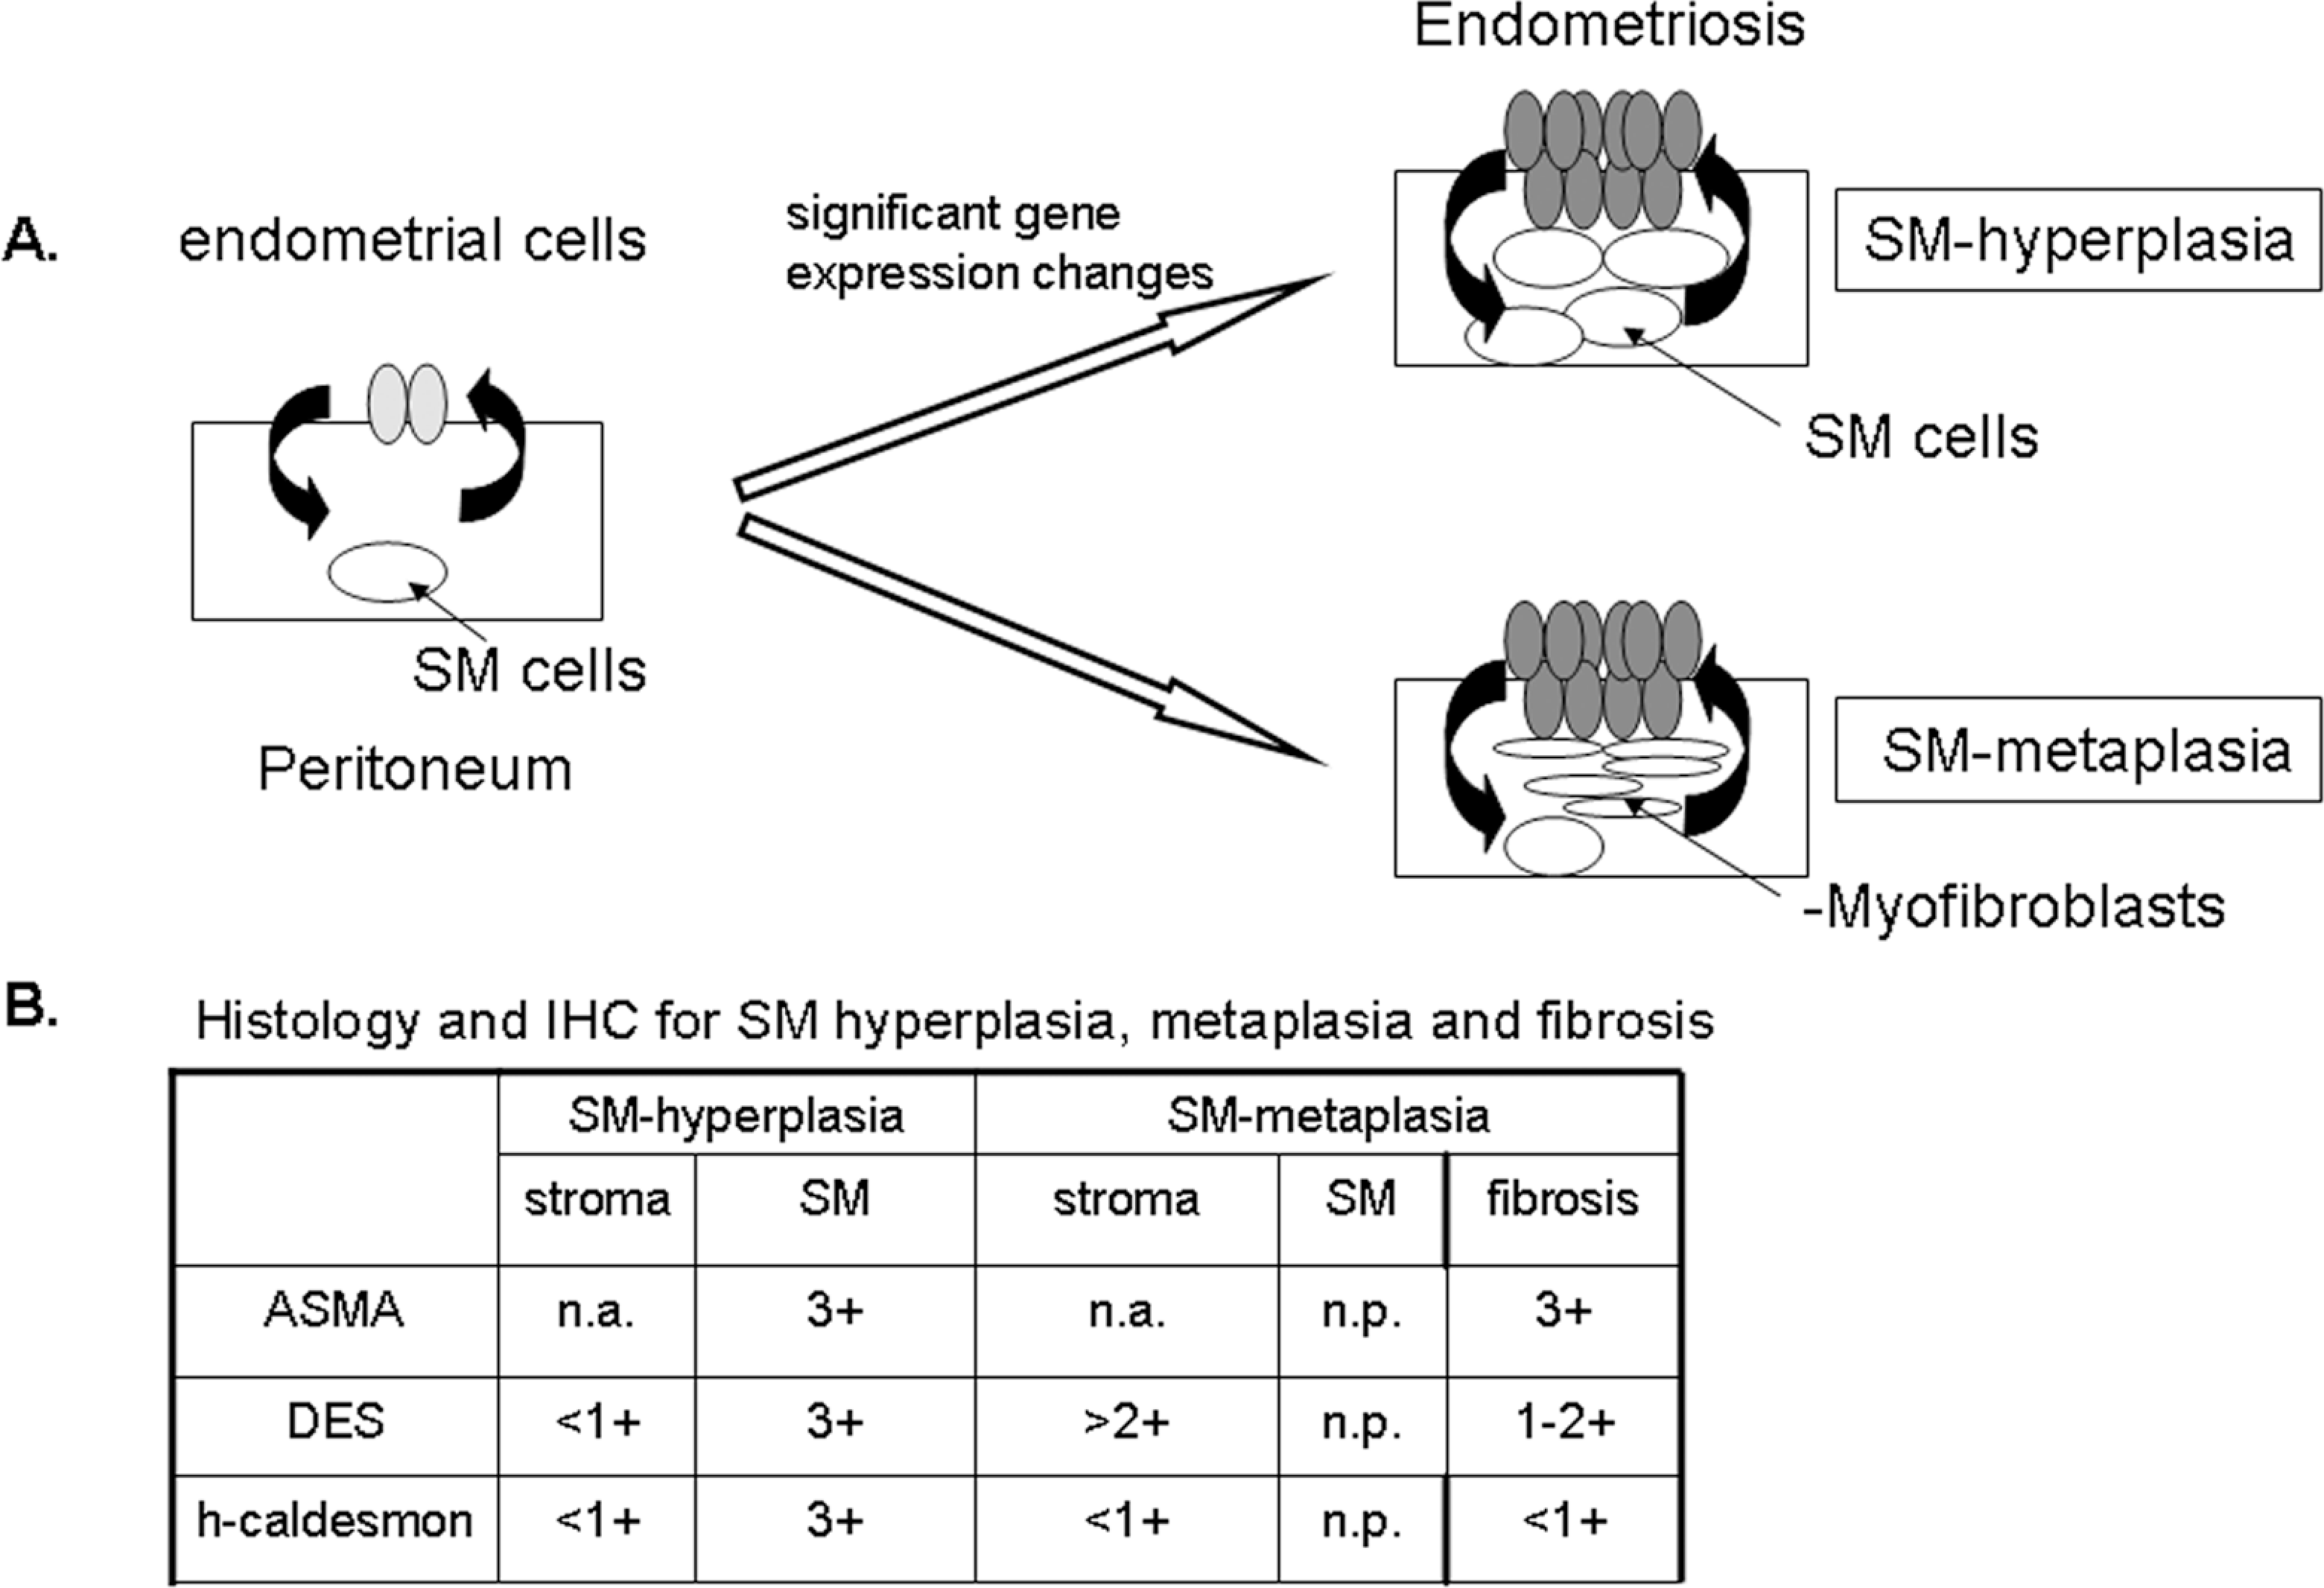
A hypothetical peritoneal endometriosis model and IHC criteria for SM hyperplasia or SM metaplasia along with fibrosis. A, Following retrograde menstruation 68 of endometrial cells (light gray ellipses) into the peritoneal cavity, the cells adhere, invade, and then induce vascularization in the peritoneum. The lesion no longer demonstrates menstrual cycling (dark gray ellipses) but results in a slow and steady proliferation regulated by steroid hormones and constantly expressed receptors. Due to factors released from endometriosis cells, a tissue remodeling process begins early to influence either the growth of peritoneal smooth muscle cells (white circles) leading to SM hyperplasia or stimulate SM metaplasia stemming from stroma, for example fibroblasts to myofibroblasts and then possibly to differentiated muscle cells (thin white ellipses). A metaplasia of fibroblasts to myofibroblasts also occurs in fibrotic tissue associated with the lesion (not shown). Therefore, we propose that directly targeting steroid hormone receptors in lesions would lead to a reduction in growth in all steroid hormone receptor–positive cells including SM cells. IHC indicates immunohistochemistry; SM, smooth muscle. B, A decision matrix demonstrates the histological and IH criteria for discerning SM hyperplasia, SM metaplasia, and fibrosis in peritoneal endometriotic tissue. Endometriotic SM hyperplasia occurring concentrically around the endometriosis, can be defined as low DES expression (<1/ +1) in endometriotic stromal cells but high DES and ASMA expression (+3) in SM cells within lesions. These DES-positive SM cells are further defined as fully differentiated SM cells by high h-caldesmon expression (+3). Therefore, the finding of SM triple positive DES/h-caldesmon/ASMA cells indicates SM hyperplasia, supporting abnormal proliferation of peritoneal SM cells. Note that ASMA expression of endometriotic stroma was not applicable (na) in our analysis for SM hyperplasia or for SM metaplasia (below) due to ASMA high expression in eutopic endometrium. SM metaplasia derived from a metaplastic change of fibroblasts to myofibroblasts within the endometriotic stroma or fibrotic regions was defined by increased DES expression levels (+2/+3) but no significant h-caldesmon expression. High expression of ASMA in the fibrotic tissue also distinguished SM metaplasia. Importantly, SM hyperplasia and SM metaplasia also occurred together in the same lesions. ASMA indicates aortic smooth muscle actin; DES, desmin.
Footnotes
Acknowledgments
The excellent contributions of our technical assistants Alexander Walter, Antje Haeussler-Quade, Martina Sperling, and Sonja Oeser are gratefully acknowledged. We also thank all other internal and external colleagues and, especially, Gabriele Leder and Henrik Seidel, who supported this project.
Authors' Note
The authors Florian Sohler and Anette Sommer contributed equally to this work.
Declaration of Conflicting Interests
The author(s) declared no potential conflicts of interest with respect to the research, authorship, and/or publication of this article.
Funding
The author(s) received no external financial support for the research, authorship, and/or publication of this article.
References
Supplementary Material
Please find the following supplemental material available below.
For Open Access articles published under a Creative Commons License, all supplemental material carries the same license as the article it is associated with.
For non-Open Access articles published, all supplemental material carries a non-exclusive license, and permission requests for re-use of supplemental material or any part of supplemental material shall be sent directly to the copyright owner as specified in the copyright notice associated with the article.