
Abstract
Embryo implantation is a dynamic physiological process involving morphological and molecular changes in the endometrium during the pre-receptivity, receptivity, and implantation phases. A comprehensive analysis of messenger RNA (mRNA) and microRNA (miRNA) profiles during implantation will likely provide new clues to elucidate the underlying mechanisms governing embryo implantation. We characterized the mRNA and miRNA transcriptomes using next generation sequencing (NGS) of the endometrium 1 day postcoitum (dpc) and 4dpc and the implantation site (IMS) and inter-implantation (IIM) site of the endometrium on 5dpc. Real-time quantitative polymerase chain reaction was performed on selected miRNAs and their predicted target mRNAs to validate their negatively correlated expression. Statistical analysis of the data based on Gene Ontology (GO) group annotation and Kyoto Encyclopedia of Genes and Genomes pathway analysis demonstrated that the genes with significant expression at the IIM site were primarily involved in glucose, protein, and lipoprotein metabolism to provide energy for embryo implantation, while the genes identified at the IMS were involved in RNA functions to produce proteins in support of embryo development and trophoblast invasion. Extracellular matrix (ECM)-receptor interactions between cells and the ECM was the most remarkable event during implantation. The miRNA-mRNA interaction network unraveled the regulatory relationship between miRNAs and mRNAs. Hub miRNAs (mmu-miR-96 and mmu-miR-200b) were identified to target B-cell lymphoma 2 (Bcl-2), Kruppel-like factor 13 (Klf13), and Progesterone receptor (PGR), which are associated with the preparation of the receptive condition or the maintenance of early pregnancy.
Introduction
MicroRNAs (miRNAs) are highly conserved small noncoding RNA molecules that have been implicated in diverse fundamental biological processes. In 1993, Victor Ambros discovered the first miRNA (the lin-4 gene), which was confirmed to control the larval development of Caenorhabditis elegans. 1 Currently, approximately 1870 precursors and 2794 mature miRNAs have been identified in humans 2 and shown to regulate more than 30% of the protein-coding genes. 3 It is widely believed that miRNAs serve as an effective regulation method through perfect or imperfect complementation to the 3′-untranslated regions of their target transcripts. 4 Bartel and Chen interpreted the characteristics of miRNA regulation and proposed the function of miRNAs as a rheostat in an electric circuit. The core of this theory is that miRNAs can decrease but not extinguish protein levels. 5 Therefore, the spatiotemporal differential expression of tissue miRNAs implies that miRNAs are more likely to play a regulatory role for their target genes.
Embryo implantation is an intricate process involving reciprocal interactions between the blastocyst and uterus. The successful implantation of the embryo is dependent on the synchronized development of the blastocyst, the implantation competency, and the differentiation of the receptive uterus. 6 Uterine sensitivity to implantation in mice is divided into the prereceptive, receptive, and refractory phases. 7 To coordinate the development of competent blastocysts, 8 the uterus undergoes a series of molecular and genetic changes from the prereceptive to the implantation stage. 9 Regulation has been implicated in the spatiotemporal expression pattern of genes. 10 MicroRNAs are thought to be involved in embryo implantation in a regulatory role because conservative predictions indicate that up to 30% of genes may be regulated by miRNAs in eukaryotes. 11
The regulatory mechanism behind embryo implantation is very intricate. MicroRNAs, as effective regulators, are a major reason for the divergent expression levels of the genes involved in this pathway. 12
Chakrabarty’s experiments in mice identified the spatiotemporal distribution of miRNAs, especially mmu-miR-199a* and mmu-miR-101a, that are predicted to target the Cyclooxygenase-2 (Cox-2) gene. 13 Cox-2 is critical for attachment during implantation. 14 More recently, Kresowik found that miR-31 was significantly upregulated; further study revealed that miR-31 possibly operates through an immunosuppressive mechanism, thereby impacting optimal endometrial receptivity. 15
Additionally, Xia applied models of pseudopregnancy, artificial decidualization, and delayed implantation to identify the temporal and spatial expression of miR-320 and found that regulated divergence in the expression levels of genes that are important in determining the readiness of the uterus for implantation. 16
Recently, studies have focused on the systematic global view of the regulation networks involved in implantation. 17 The characteristics of miRNA expression in implantation have been reported in various animal and cell culture models. Xia et al compared differentially expressed messenger RNAs (mRNAs) and miRNAs in the rat uterus during embryo implantation. 18 Hu et al unraveled the profile of mRNAs and miRNAs during implantation in the mouse. 19 Because peri-implantation is a dynamic process involving the prereceptivity, receptivity, and implantation phases, the expression and characteristics of mRNAs and miRNAs involved in the process are still unknown. The temporal and spatial expression profiles of mRNAs and miRNAs during the 3 phases truly represent the characteristic reactions between miRNAs and mRNAs during the peri-implantation process. This study investigated the dynamic changes in miRNA and mRNA expression levels during the prereceptivity, receptivity, and implantation phases that reflect the mechanism by which miRNAs comprehensively regulate their target mRNAs.
Materials and Methods
Animal Treatment
Mature Kunming mice (white outbred strain, 7-9 weeks old, weighing 25 to 30 g) were maintained in a controlled environment with a 14-hour light to 10-hour dark cycle. All animal procedures were approved by the Experimental Animal Center of Chongqing Medical University (NO: SCXK (YU) 20070001). Female mice in estrus were mated with males at 6:00
Next Generation Sequencing
We collected the endometrium from pregnant mice on 1dpc, 4dpc, and 5dpc IMS and IIM, which corresponded to the prereceptivity, receptivity, and implantation phases, respectively. Total RNA (combined mRNA and miRNA) was extracted using TRIzol (Invitrogen). The isolated RNA was quantified using the NanoDrop 1000 (Thermo Scientific), ratios of absorbance at A260/280 were used to assess RNA purity, and samples with a minimum 260/280 ratio of 1.80 or greater were considered to be sufficiently pure and suitable for NGS. Two adaptors were sequentially ligated to the 3′ and 5′ ends of the sample RNA preparations. The ligated RNA samples were subsequently reverse transcribed, and then the RNA was PCR amplified through the ligated common linker sequences. The RNAs were gel-purified and submitted for sequencing by the Illumina Genome Analyzer System (Beijing Genomics Institute, China).
MicroRNA Target Prediction
We selected 3 databases (the TargetScan database (http://www.targetscan.org/vert_61/), miRanda database (http://www.ebi.ac.uk/enright-srv/microcosm/htdocs/targets/v5/), and DIANA-microT 3.0 (http://diana.cslab.ece.ntua.gr/microT/)) to predict the target genes of the miRNAs. Because these tools use different criteria to predict targets, the use of multiple databases helped to improve the accuracy of the prediction of target genes that intersected with the differentially expressed genes. The target genes were chosen from the intersection of the 3 prediction tools. Then, we screened the negatively related miRNA-mRNA pairs from the most likely targets of differentially expressed miRNAs based on the expression values of the miRNAs and mRNAs from NGS. Cytoscape was used to visualize the miRNA-mRNA pair network.
Real-Time PCR
Total RNA was extracted from mouse endometria with the TRIzol reagent (TaKaRa, Dalian, China) and reverse-transcribed into complementary DNA with the PrimeScript RT Reagent Kit (TaKaRa). MicroRNAs were quantified using stem-loop Reverse Transcription Polymerase Chain Reaction (RT-PCR).
Reverse transcriptase primers with a stem-loop structure and PCR primers for miRNA were designed as described by Chen et al. 20 Small nuclear RNA (snRNA) U6 was used as the internal control for normalization. The mRNA primers was designed by oligo 7; β-actin was used as an endogenous control for standardization. Real-time PCR was performed using a SYBR Premix Ex Taq kit (TaKaRa, Dalian, China) on a BIO-RAD CFX Connect Real-Time PCR System. All experiments were performed in triplicate. All calculations were performed using the BIO-RAD management software.
Bioinformatic Analysis
Based on differences in temporal and spatial expression, the mRNA profiles from the 1dpc, 4dpc, 5dpc IIM, and 5dpc IMS groups were classified into 3 clusters using a Venn diagram. Gene Ontology (GO) analysis was performed on each cluster to determine the functions of the genes and uncover interactions between genes on the basis of biological processes. Kyoto Encyclopedia of Genes and Genomes (KEGG, http://www.genome.ad.jp/kegg/) enrichment analysis was performed to determine the pathways of genes of interest. This analysis provides a better understanding of gene expression information in a complete network.
Result
MicroRNAs and mRNA Expression Profiles
To reveal the dynamic miRNA expression profiles in the endometria of pregnant mice (1dpc, 4dpc, 5dpc IIM, and 5dpc IMS), we sequenced small RNAs and mRNAs from total RNA using the Illumina Genome Analyzer System. MiRNA data from 4 groups were obtained, corresponding to 1dpc endometria, 4dpc endometria, and 5dpc endometria at the IMSs and IIM sites. A total of 384 miRNAs were expressed in every group. Among them, 138 miRNAs were identified with significantly differential expression patterns. To understand the dynamic expression of miRNAs during the prereceptivity, receptivity, and implantation phases, the differentially expressed profiles of 1dpc, 4dpc, 5dpc IMS, and 5dpc IIM endometria of pregnant mice were obtained using pairwise comparisons. We set the cutoff at 2-fold for defining significant up- or downregulation of the differentially expressed RNAs. The expression of most miRNAs on 1dpc was upregulated compared to the receptivity and implantation phases. The tissue morphology and molecular functions were consistent with the fact that this phase is biosynthetically highly active and probably represents the transition state from the prereceptive to receptive state. A comparison of differentially expressed miRNAs between 5dpc IMS and 5dpc IIM showed that 67 miRNAs were upregulated and only 1 miRNA was downregulated at 5dpc IMS (Figure 1). This result may suggest that the miRNAs at the IMS are regulated in response to the blastocyst reaction.
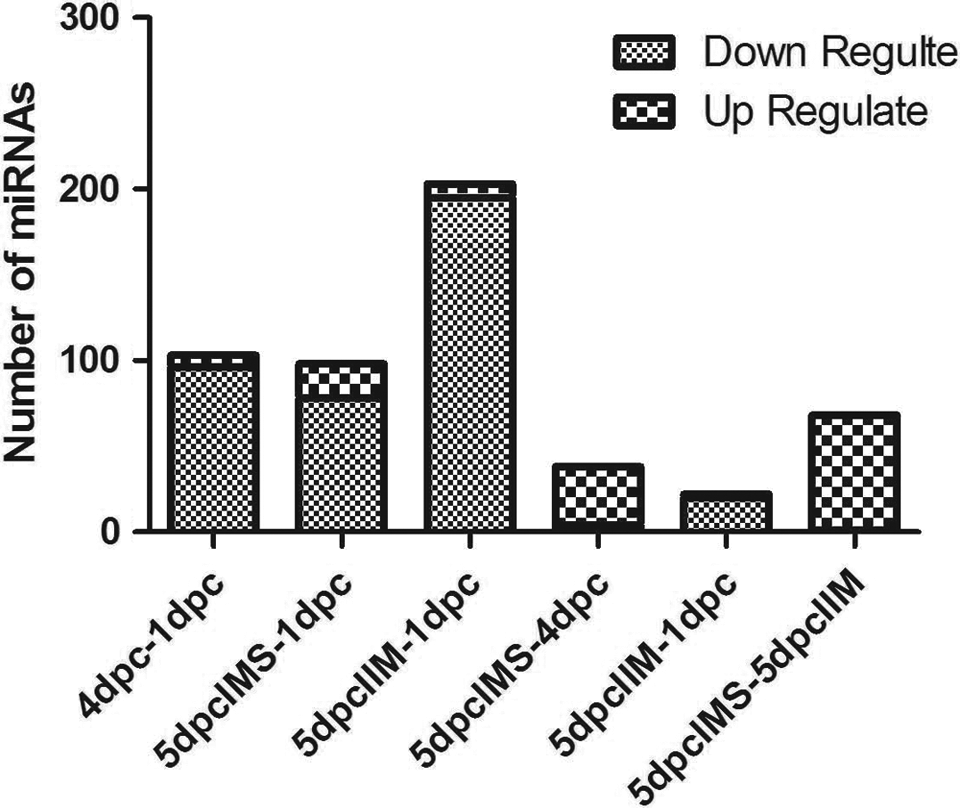
The number of divergent microRNAs (miRNAs) in different pairwise comparisons the number of up- or downregulation miRNAs were count between different pairwise comparisons.
The mRNA Procession and Analysis
The mRNA profiles directly reflect the functions of genes. Therefore, we analyzed the dynamic changes in the divergent transcripts during peri-implantation. The differentially expressed mRNAs were obtained from 6 pairwise comparisons (1dpc-4dpc, 1dpc-5dpc IIM, 4dpc-5dpc IIM, 1dpc-5dpc IMS, 4dpc-5dpc IMS, and 5dpc IIM-5dpc IMS). To identify the temporal and spatial expression of mRNAs, we selected mRNAs resulting from the 6 pairwise comparisons and divided them into 3 sets (Diff Gene1:1dpc-4dpc, 1dpc-5dpc IMS and 4dpc-5dpc IMS; Diff Gene2:1dpc-4dpc, 1dpc-5dpc IIM and 4dpc-5dpc IIM; and Diff Gene 3:5dpc IIM-5dpc IMS) for further analysis using a Venn diagram (Figure 2). The Venn diagram was used to analyze differences in the 3 clusters to identify miRNAs with significant differences in expression between IMS and IIM. Cluster 1 represented a comparison of differentially expressed miRNAs between the prereceptivity and receptivity period, which also plays a key role in the implantation phase. Cluster 2 represented the differentially expressed miRNAs between the implantation and preimplantation phases, which reflected the gene functions at the IMS. Cluster 3 represented the differentially expressed miRNAs between the implantation and preimplantation phases, which emphasized the gene functions of the IIM site. Then, we applied the GOEAST online software (http://omicslab.genetics.ac.cn/GOEAST) to perform GO term analysis to characterize the function and interactions of the differentially expressed mRNAs between clusters 2 and 3 (Figure 3). Because GO term analysis indicated that cluster 1 was involved in an intricate biological process, KEGG analysis was used to determine the function of the RNAs in this cluster (Table 1).
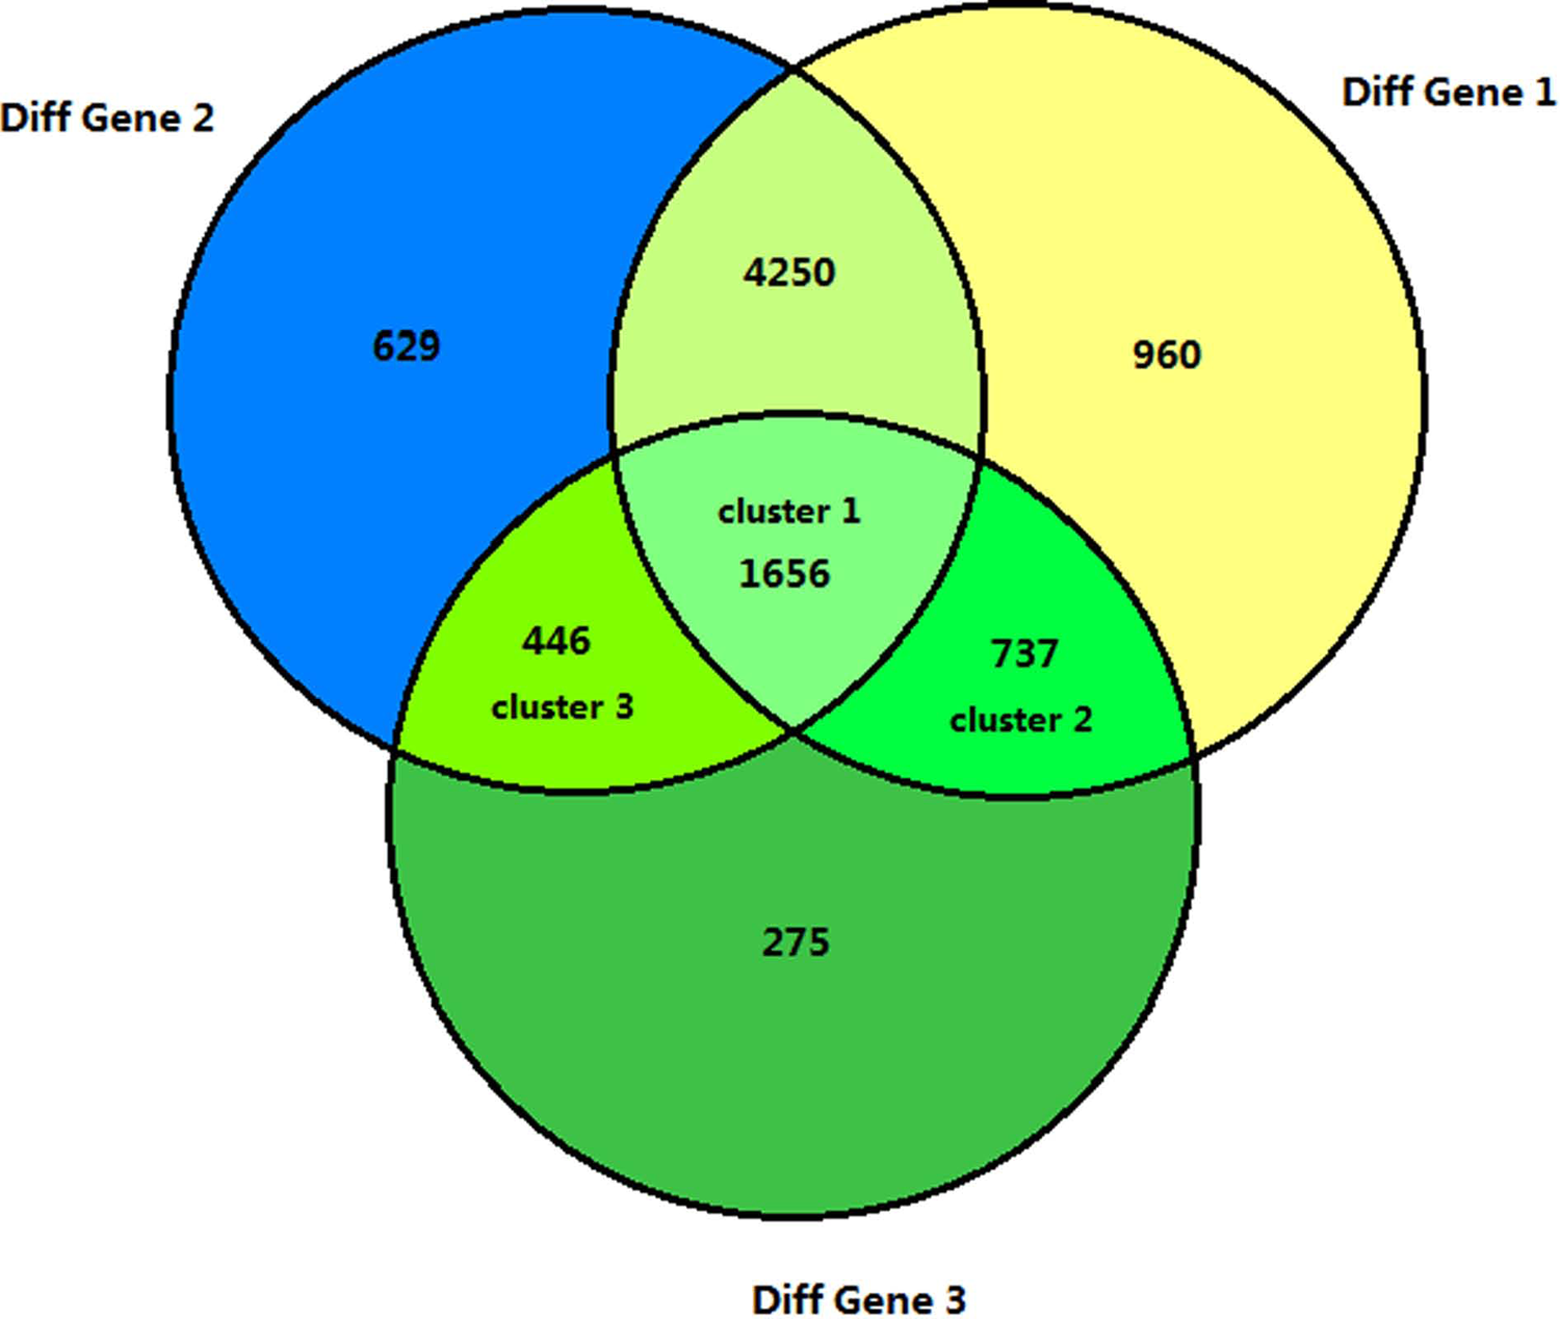
Dynamic comparison of differentially expressed messenger RNA (mRNA) profiles from 1dpc, 4dpc, 5dpc IMS, and 5dpc IIM using a Venn diagram. Diff Gene 1:1dpc-4dpc, 1dpc-5dpc IMS, and 4dpc-5dpc IMS. Diff Gene 2:1dpc-4dpc, 1dpc-5dpc IIM, and 4dpc-5dpc IIM. Diff Gene 3:5dpc IIM-5dpc IMS. dpc indicates 1 day postcoitum; IMS, implantation site; IIM, interimplantation.
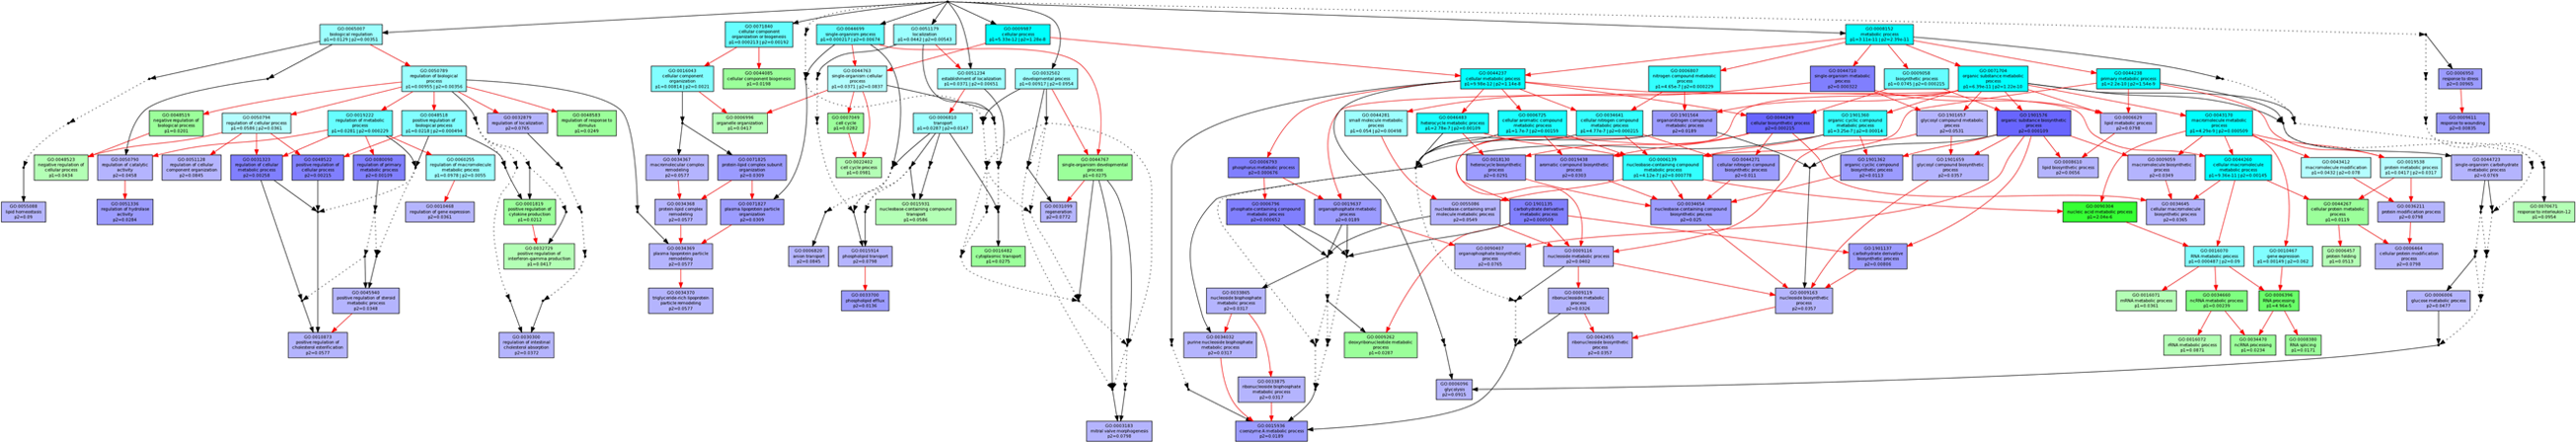
Gene cluster GO enrichment analysis. Enriched GO IDs and their hierarchical relationships in “biological process”. Boxes represent GO terms labeled by their GO ID, term definition, P value, and detailed information. Blue boxes represent significantly enriched cluster 2 GO terms. Green boxes represent significantly enriched cluster 3 GO terms. Light blue boxes represent significantly enriched common GO terms. The degree of color saturation of each node is positively correlated with the significance of enrichment of the corresponding GO term. Red edges indicate relationships between 2 enriched GO terms, black solid edges indicate relationships between enriched and unenriched terms, and black dashed edges indicate relationship between 2 unenriched GO terms. GO indicates Gene Ontology. (The color version of this figure is available in the online version at http://rs.sagepub.com/.)
Pathway Analysis Based on Cluster 1 mRNA Genes.
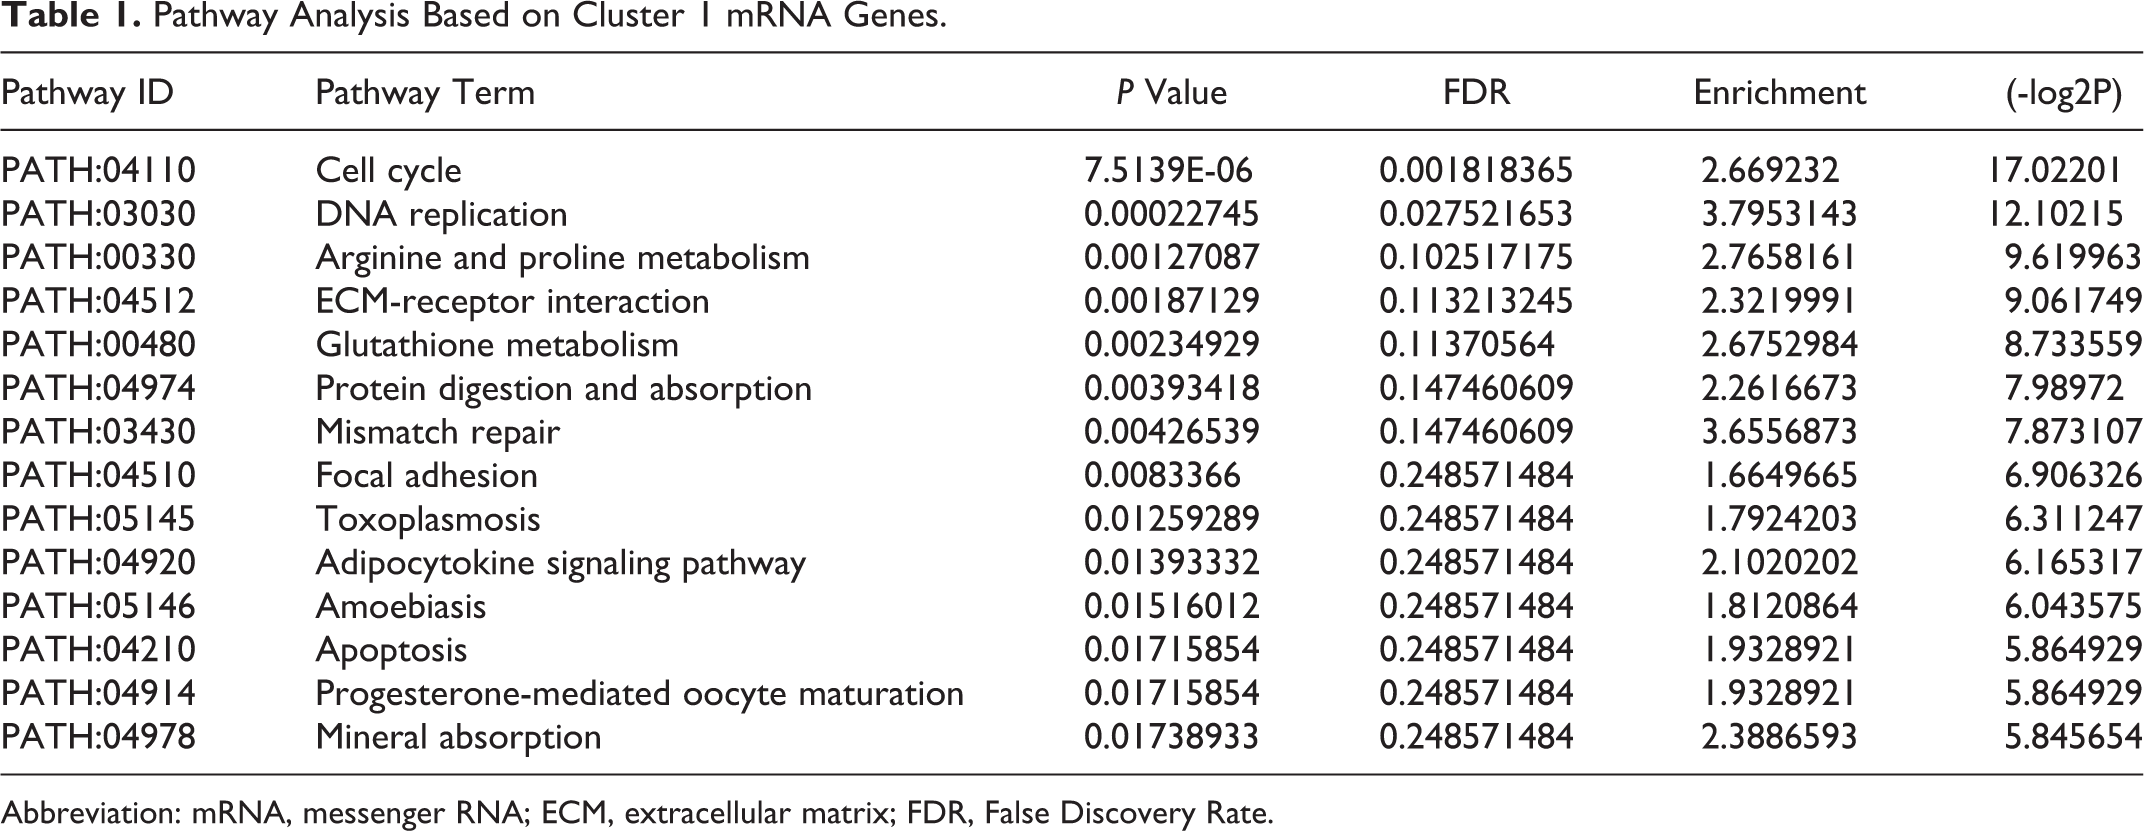
Abbreviation: mRNA, messenger RNA; ECM, extracellular matrix; FDR, False Discovery Rate.
Confirmation of miRNA and mRNA Microarray Data for IMSs on 5dpc
To verify the accuracy of the data, we selected mmu-mir-132, mmu-mir-17, mmu-mir-18a, mmu-mir-20a, mmu-mir-96, Rho guanine nucleotide exchange factor 11 (Arhgef11), JAZF zinc finger 1 (Jazf1), Protein tyrosine phosphatase, receptor type, O (PtPro), Tet methylcytosine dioxygenase 1 (Tet1) and Tribbles homolog 2 (Trib2) and detected their expression levels using real-time RT-PCR. According to the result of the target predictions, the NGS miRNAs targeted and negatively regulated these mRNAs. Differentially expressed miRNA-mRNA pairs were demonstrated by negative correlation from the real-time qPCR data at the 1dpc, 4dpc, and 5dpc timepoints. The results showed that both the miRNA and mRNA expression trends correlated well with the NGS analysis. The comparison between the real-time qPCR results and the NGS results are shown in Figure 4.
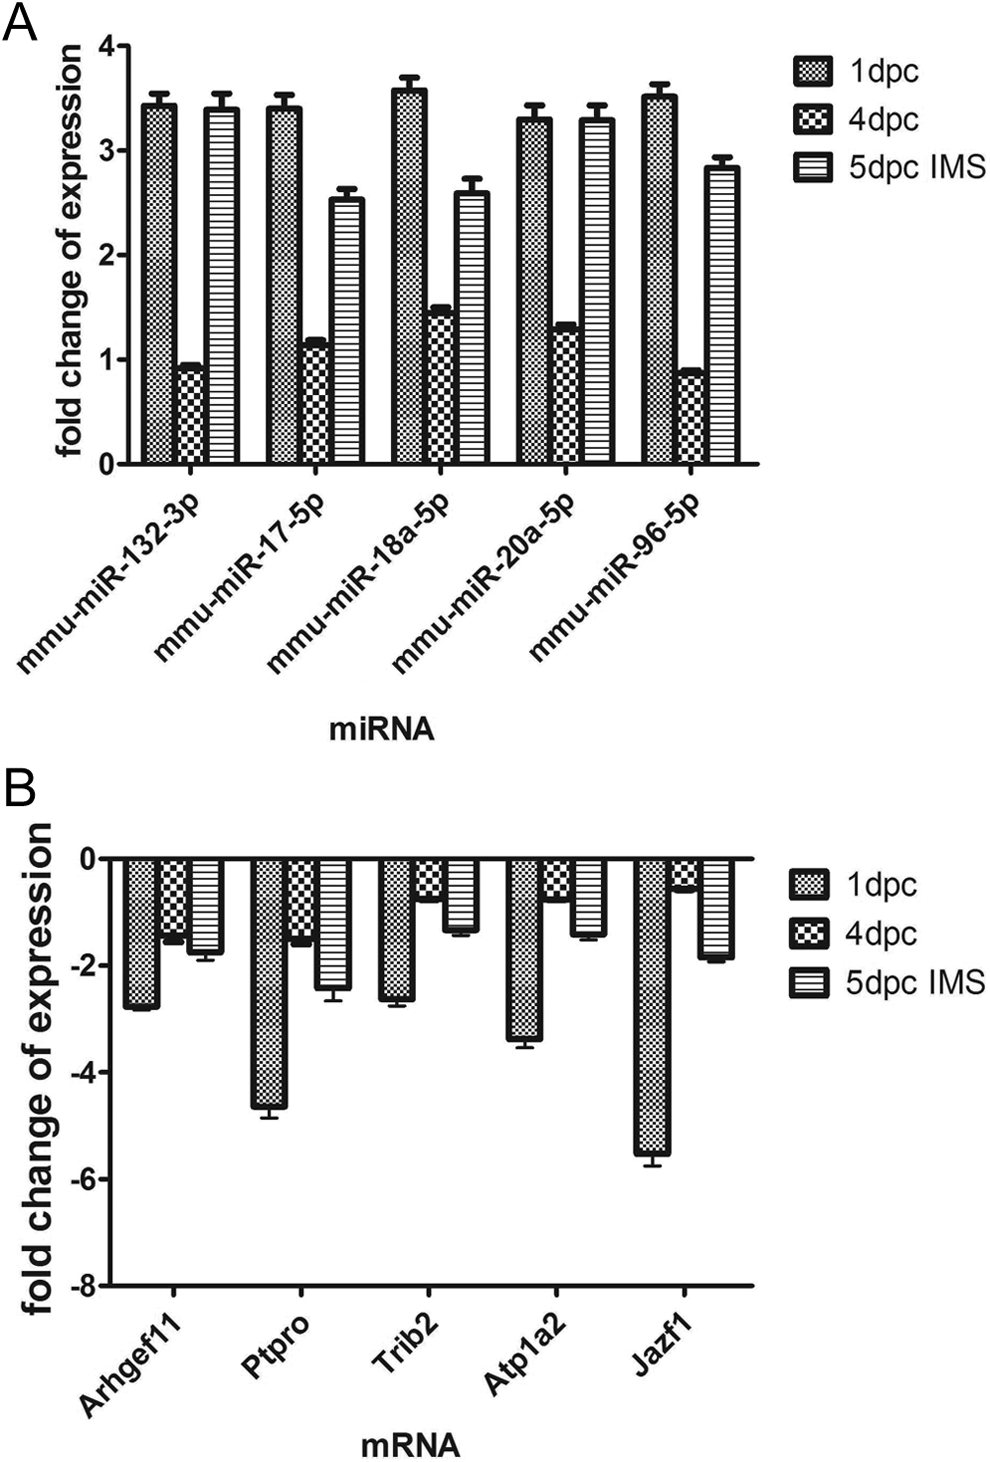
Validation of the expression of miRNAs and mRNAs by real-time PCR. All values are calculated against the CT values of the 5dpc inter-implantation site and are presented as relative fold changes. A, Relative expression of miRNAs by real-time PCR. B, Relative expression of mRNAs by real-time PCR. mmu-mir-132, mmu-mir-17, mmu-mir-18a, mmu-mir-20a, mmu-mir-96 target Arhgef11, Jazf1, PtPro, Tet1, and Trib2 were selected based on the results of the prediction tools. miRNA indicates microRNA; mRNA, messenger RNA; PCR, polymerase chain reaction.
MicroRNA and mRNA Integrated Analysis
An online software tool was employed to predict that the 138 miRNAs targeted 5585 mRNAs. After calculating the expression levels of the miRNAs and mRNAs derived from NGS, 1473 pairs of miRNA-mRNA were shown to be negatively correlated in at least one time point, while 138 miRNA-mRNA pairs maintained inverse correlations throughout the whole process (1pc, 4dpc, and 5dpc; Figure 5). Thus, RT-PCR further confirmed the negative relationship and accuracy of the miRNA-mRNA profiles. The result implied that miRNAs negatively regulated the target genes by mRNA degradation or preventing the mRNA from being translated during peri-implantation. To understand the interaction between the miRNAs and mRNAs, we applied Cytoscape to construct a regulatory network for the miRNAs and mRNAs (Figure 6). Then, we selected the top 5 upregulated miRNAs (mmu-miR-27a, mmu-miR-96, mmu-miR-106a, mmu-miR-23a, and mmu-miR-200b) that represented the top 15% of the nodes by degree and corresponded to the miRNAs regulating 30% of the target genes in our study (Figure 7). These miRNAs were defined as the hub miRNAs. 21
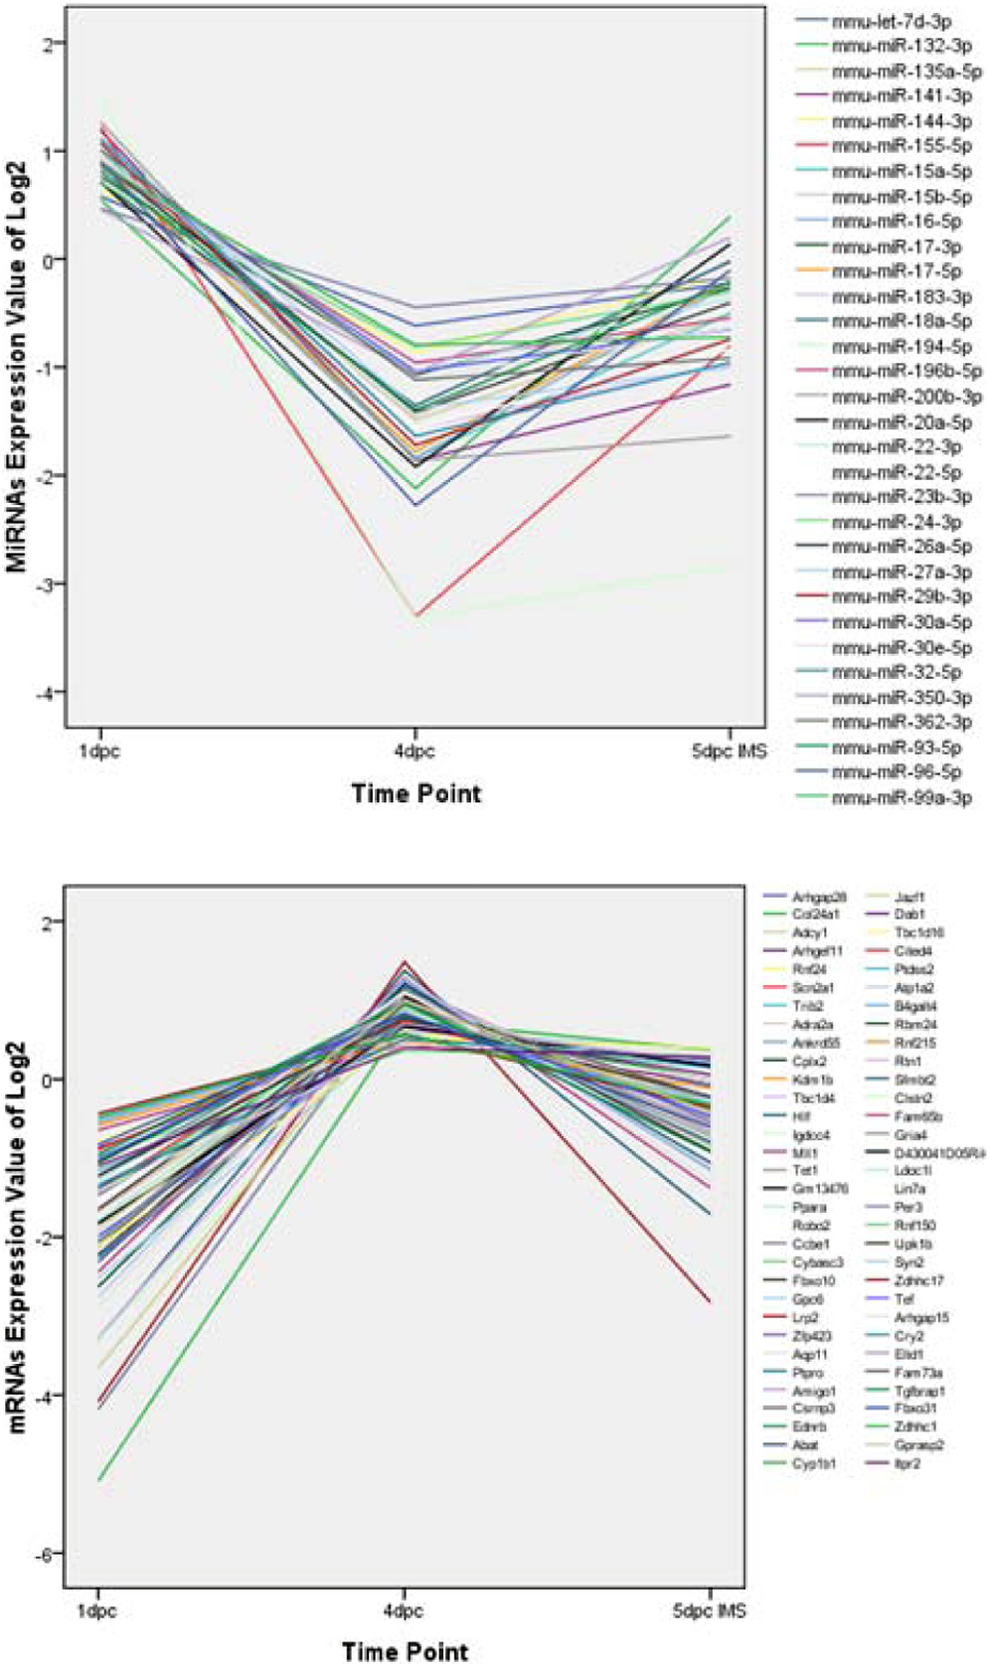
Short time-series expression of miRNAs and mRNAs. The profiles were ordered based on expression. A, log2 miRNA expression values. B, log2 mRNA expression values. miRNA indicates microRNA; mRNA, messenger RNA.
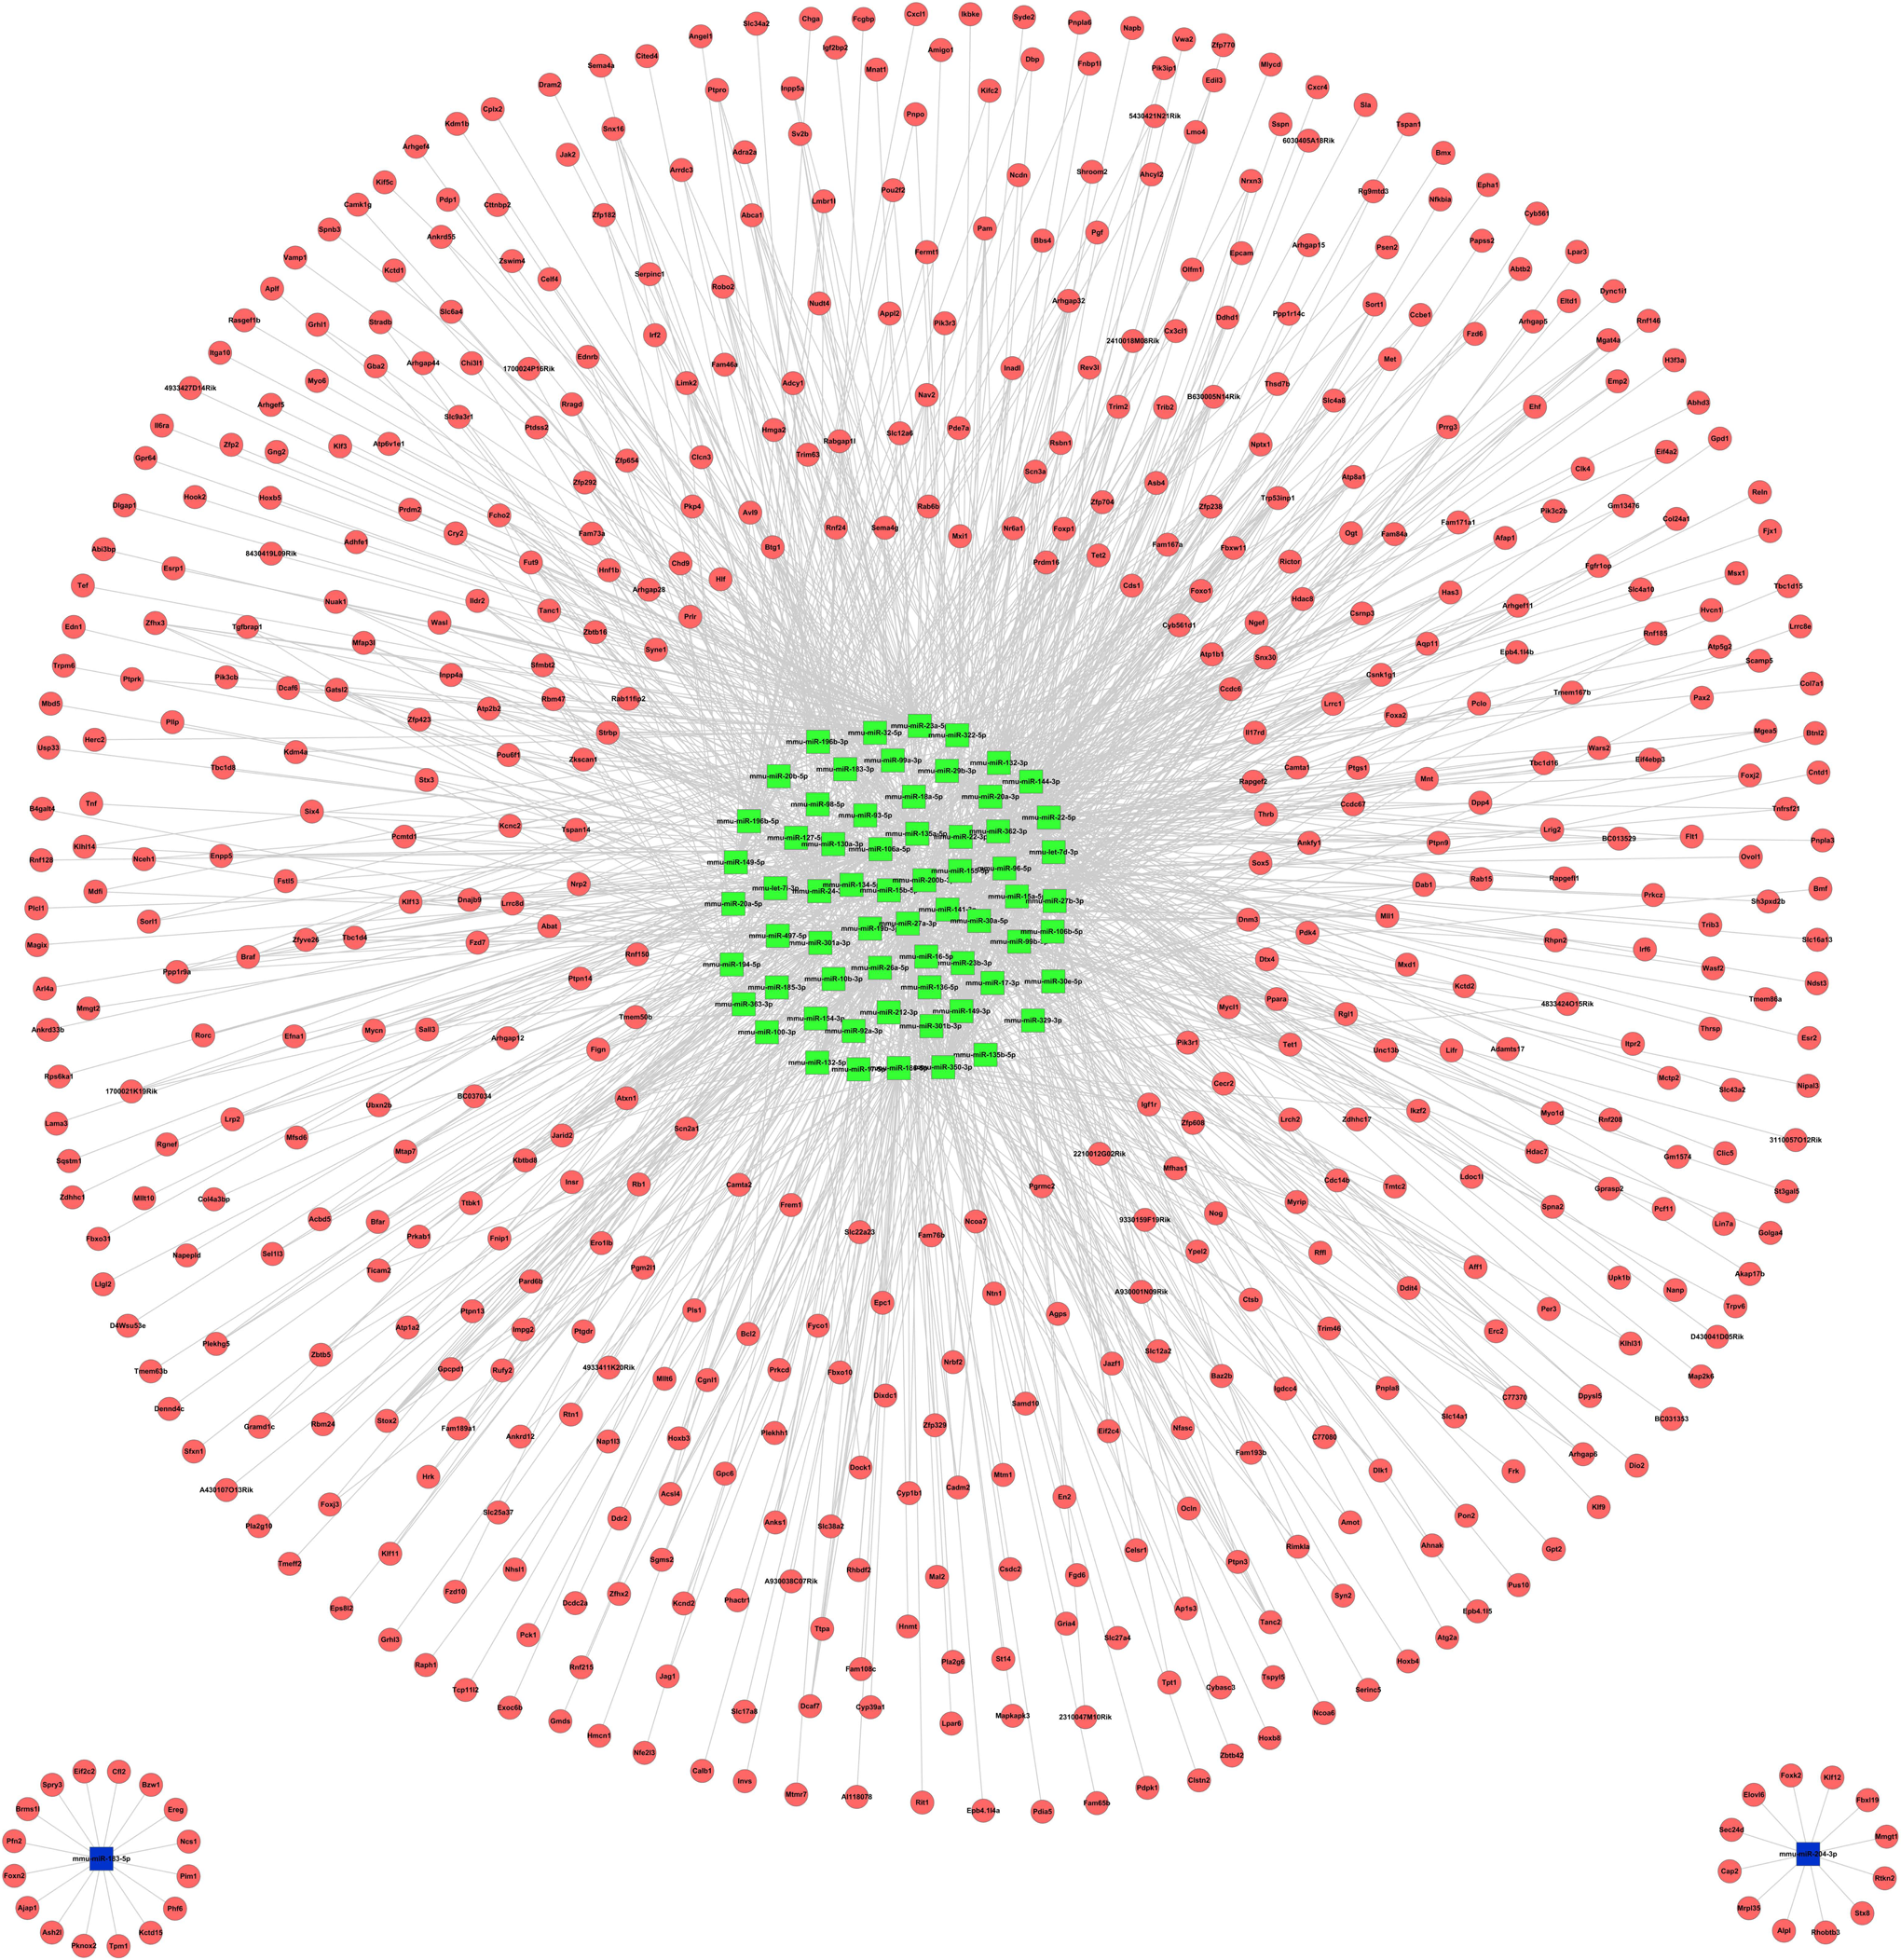
MicroRNA (miRNA) interactions with the target mRNA network. The green square nodes represent upregulated miRNAs and the blue square nodes represent downregulated miRNAs. The red circular nodes represent their target genes. The edges demonstrate the inhibitory effect of microRNAs on mRNAs. The miRNAs and their predicted target genes were validated using negative correlations and visualized using Cytoscape. (The color version of this figure is available in the online version at http://rs.sagepub.com/.)
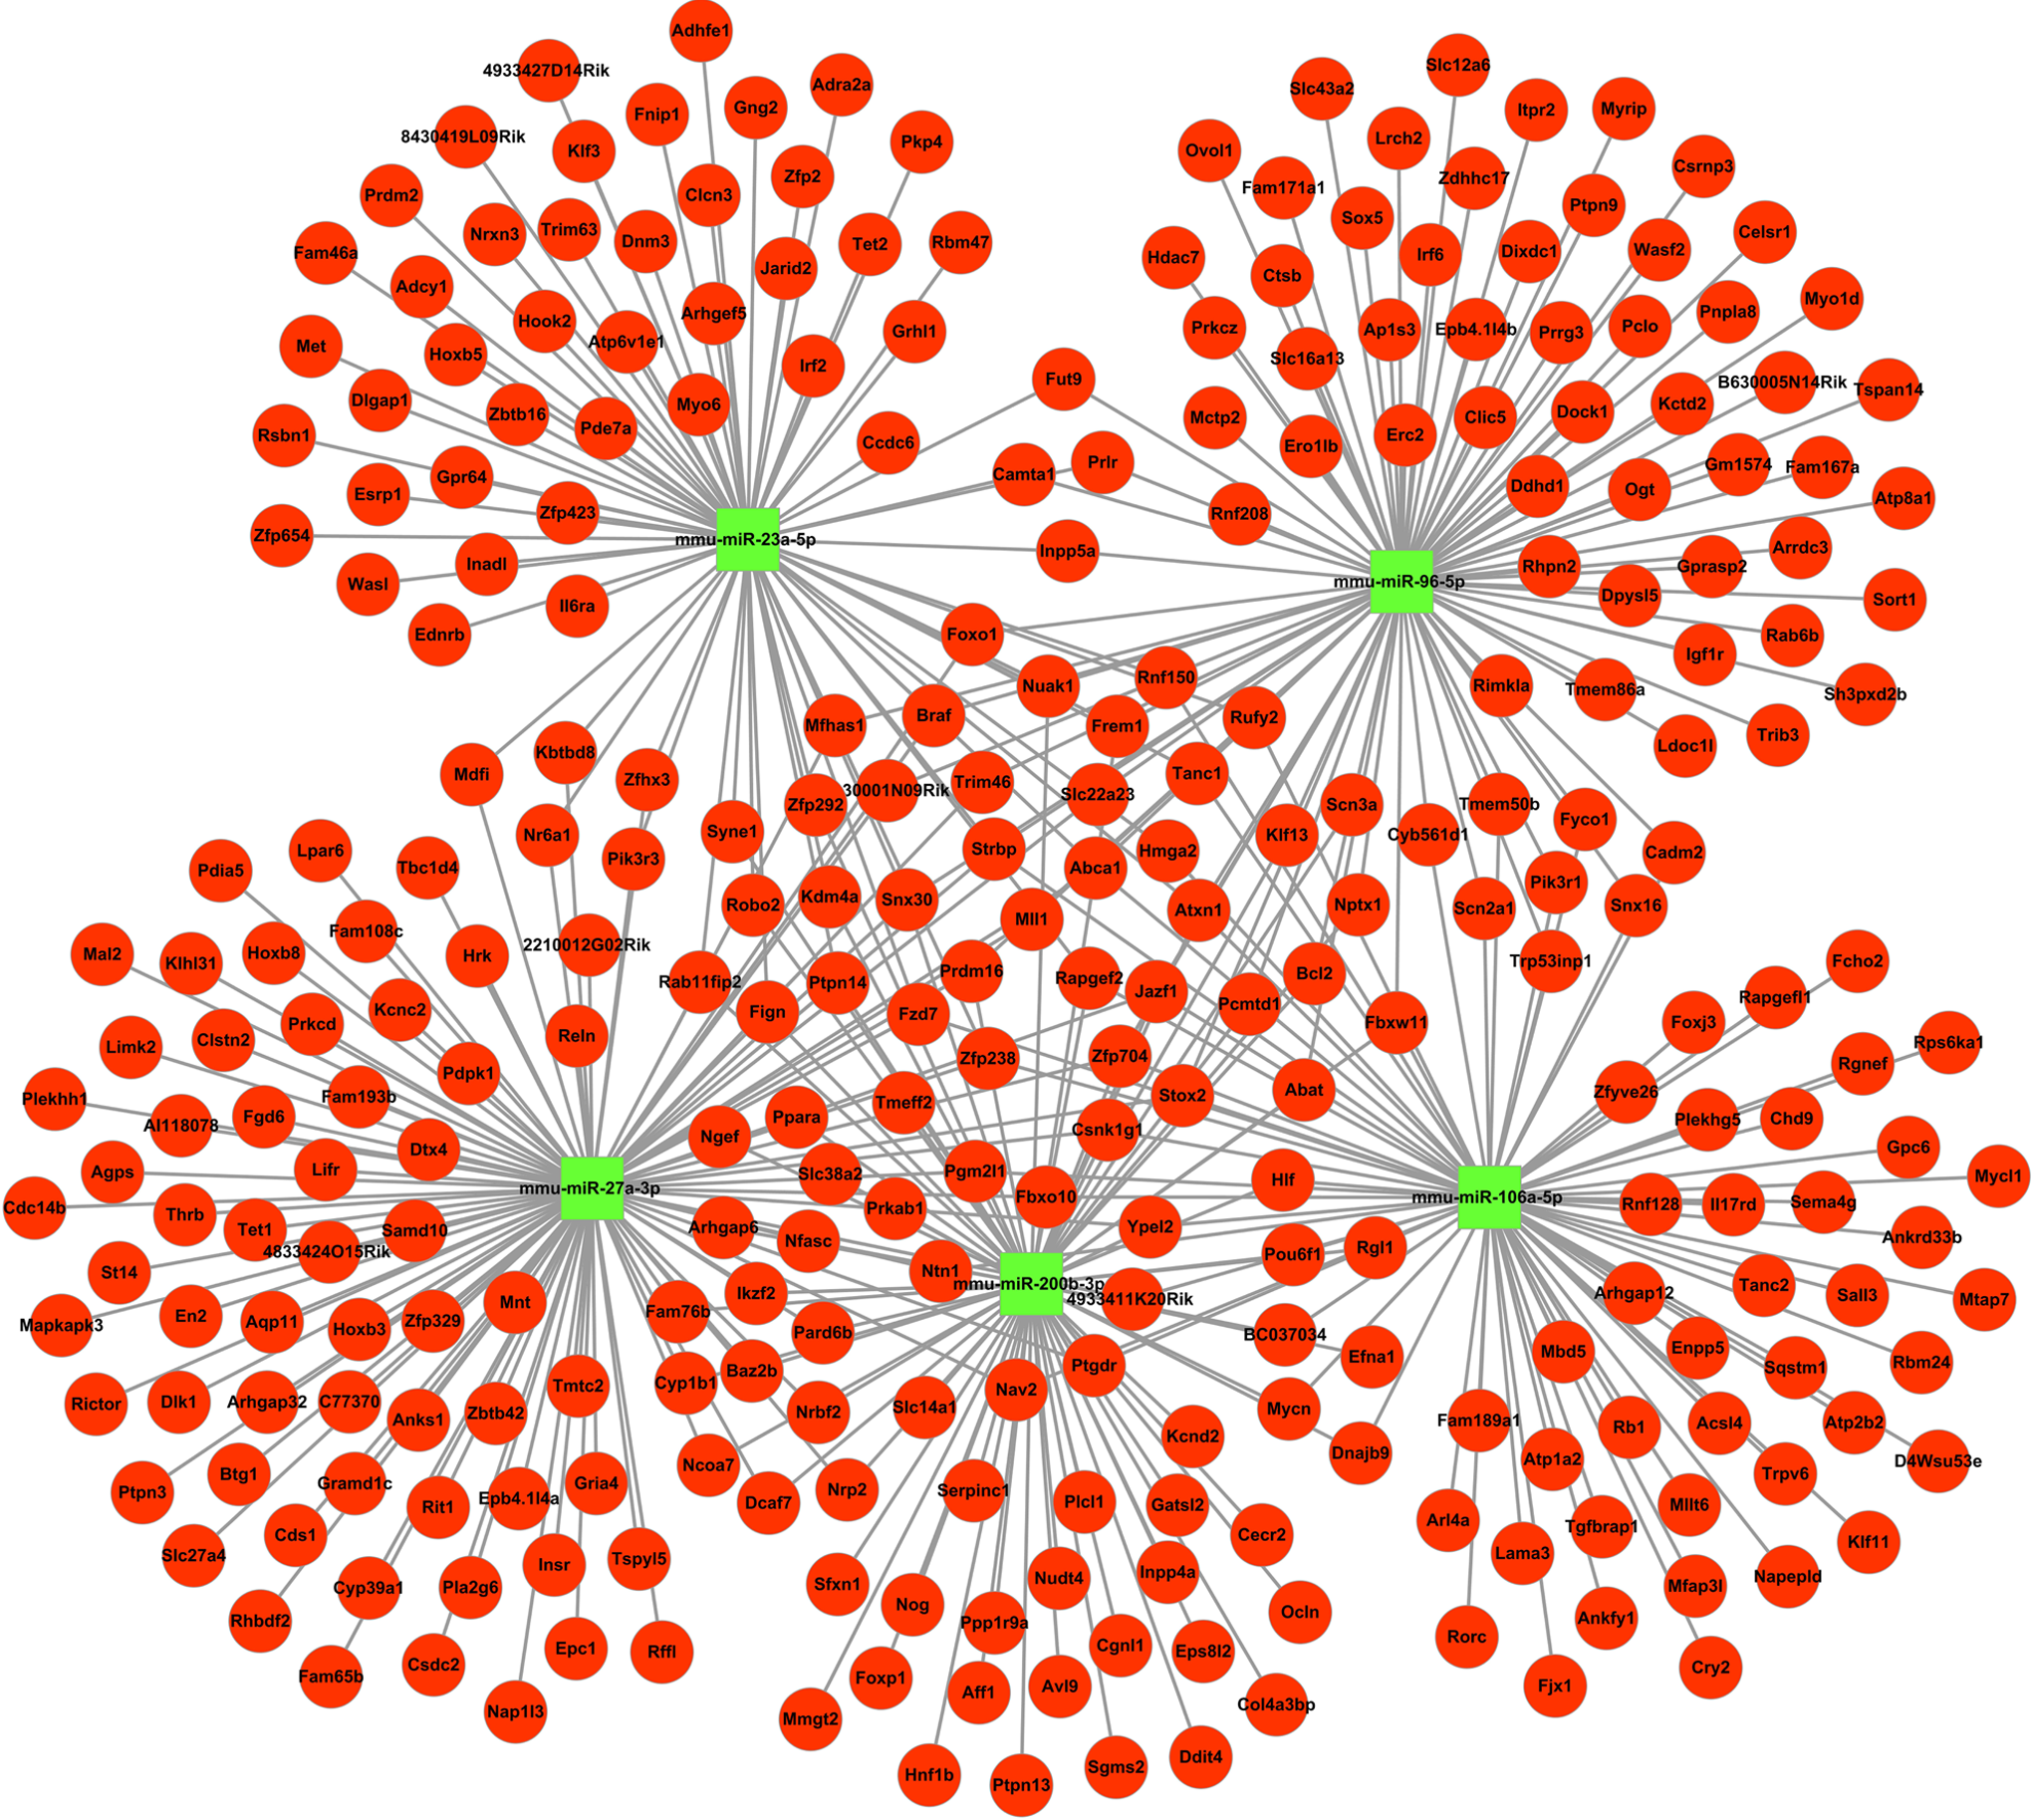
Hub miRNA interactions with target mRNAs. mmu-miR-27a-3p, mmu-miR-106a-5p, mmu-miR-200b-3p, mmu-miR-98-5p, and mmu-miR-23a-5p represent the hub miRNAs between the miRNAs and target mRNAs. mmu-miR-27a-3p has the maximum number of target mRNAs (a total of 101; degree 101). The red circular nodes represent mRNAs and the green square nodes represent miRNAs. The edges demonstrate the inhibitory effect of microRNAs on mRNAs. miRNA indicates microRNA; mRNA, messenger RNA. (The color version of this figure is available in the online version at http://rs.sagepub.com/.)
Discussion
The aim of this study was to screen for dynamic alterations in the profile of miRNAs and mRNAs, clarify the biological function of specific genes with differential spatiotemporal regulation, and elucidate the regulation network of miRNA-mRNA pairs during peri-implantation. Dramatic changes were found in the miRNA and mRNA expression profiles of the different stages or sites in the endometria of pregnant mice. Some of the identified differentially regulated miRNAs may be critical for the preparation of endometrial receptivity or maintenance during early pregnancy.
Using the online Multi-GOEAST tool, we performed GO analysis for clusters 2 and 3. : 0034369), protein metabolic and modification process (GO: 0019538, GO: Comparing the analysis results, we found that the 2 groups of gene sets had specific functions in response to the pattern of mRNA expression. Cluster 3 GO term analysis revealed terms that were significantly enriched in several physiological processes: relevant to lipoprotein process (GO: 0071825, GO: 0071827, GO: 0034368, GO0036211), glucose metabolic process (GO: 0006006), and phosphate metabolic process (GO: 0006796). These data implied that the tissue of the IIM site mainly responded to glucose, protein, and lipoprotein synthesis and metabolism.
Indeed, glucose metabolism plays an important role in the differentiation of the endometrial epithelium and stromal cells into a receptive functional layer. Frolova et al found that the glucose transporter Solute carrier family 2, member 3 (SLC2A3) was specifically expressed at the IMS and during early pregnancy concomitant with the decrease in the glucose concentration. Given this phenomenon, SLC2A3 may absorb glucose from the surroundings to supply nutrients to maintain implantation and the development of pregnancy. 22 Moreover, ribonucleoprotein binding(GO: 0043021), nucleic acid binding (GO: 0003676), and RNA binding (GO: 0003723) were remarkably enriched in cluster 2. It has been proposed that the cells respond to external signals and change their functions in response to implantation. We suggest that the IMS acts as an active site for the processes of RNA splicing and because the RNA splicing (GO: 0008380), mRNA metabolic process (GO: 0016071), and rRNA metabolic process (GO: 0016072) were significantly enriched. Gi-yingNie et al. reported that the mouse Splicing factor SC35 (Sc35) splicing factor was upregulated at IMSs. 23 This study indicated a role for SC35 in the preparation of the receptive uterus, with the provision of secreted proteins to support blastocyst development and trophoblast invasion. Furthermore, several studies have demonstrated that the Sc35 splicing factor exerted its splicing function during implantation by alternative splicing of Sc35, thereby regulating the expression of a number of genes 24 –27 related to embryo implantation and other similar functions.
Interestingly, a large number of GO classes were abundant in the cluster 1 data, most of which were associated with organ morphogenesis, organismal development, cell cycle, and cell proliferation, thereby corroborating the cluster 1 response in the multibiological event of implantation to initiate the process of pregnancy. To further define the function of cluster 1, we applied KEGG to analyze the integrated pathway and genomic information from the gene set. extracellular matrix (ECM)-receptor interactions between the cell and ECM are mediated by transmembrane molecules. This interaction causes a direct or indirect impact on cellular activities such as adhesion, migration, differentiation, proliferation, and apoptosis, which are considered to be the prerequisite events for implantation. Accumulating evidence also suggests that the integrin family acts as a major receptor for the ECM to control different ECM components, such as fibronectin, 28 laminin, 29 and collagen type IV, 30 which respond to trophoblast development in vitro. 31,32 During the peri-implantation period, the integrin heterodimers α5β1, αvβ3, 33 and α3β1 34 are constitutively expressed on both trophoblasts and the uterine epithelia surface and mediate trophoblast interactions with the ECM. Additional ECM components and integrins have been proposed to be involved in trophectoderm attachment and adhesion to the luminal epithelium. 35 A number of studies have demonstrated that the implantation process mediated via integrins is regulated by miRNAs. Liu et al showed that miRNAs exerted a direct dominant role during the implantation process. The study showed that lethal-7a (let-7a) regulated the expression of integrin-β3, thereby partly impacting embryo implantation. 36 Taken together, these results demonstrate that the receptor and integrin interacting with the ECM have direct and indirect effects on implantation.
Our results suggest that the entire process was modulated by miRNAs. Surprisingly, we identified 127 pairs of miRNA with expression levels corresponding to 138 pairs of miRNA-mRNA (High–Low–High) during the 3 time points (1dpc, 4dpc, and 5dpc). Thus, we hypothesized that the miRNAs mainly exerted regulation of mRNAs during the prereceptivity and implantation phases. Nayoung Suh reported that maternal miRNAs did not play a phenotypic role in preimplantation embryo development. In contrast, we propose that miRNAs play an important role in morphological and biochemical modifications in preparing endometrial receptivity during the preimplantation phase. 37 Therefore, after the receptivity phase, miRNAs function in the establishment and maintenance of early pregnancy as suggested by Sha. 38
Based on our miRNA-mRNA network, several pivotal miRNAs were shown to regulate the expression of target mRNAs such as PGR, Bcl-2, Phosphatidylinositol 3-kinase, regulatory subunit, polypeptide 1 (Pik3r 1), V-myc myelocytomatosis viral related oncogene (Mycn), and Forkhead box O1 (FOXO 1), leading to the establishment and maintenance of successful implantation. Liu et al. verified that miR-96 was a potential regulator of PGR, which is commonly accepted as a biomarker of endometrial receptivity. 39 Moreover, both mir-200 and mir-96 targeted the Klf13 gene, which was demonstrated to work together with Klf9 to maintain embryo implantation. 40
Interestingly, our miRNA-mRNA network diagram showed that multiple miRNAs targeted the same gene. This phenomenon suggested that miRNA pairs exerted synergistic regulation on the implantation process. 41 A recent study demonstrated that multiple miRNAs work synergistically to control individual genes. This phenomenon is important for understanding the mechanisms of complex posttranscriptional regulation in mammals. The Drosophila miRNAs lin-4 and let-7 were the first miRNA pairs to be experimentally verified to cooperate. 42 Mir-96 and mir-200 acted as hub miRNAs in our data and were verified to share the target gene Bcl-2 and exert synergistic regulation. Joswig found that Bcl-2 was absent in the endometrium during preimplantation and exhibited complementary expression patterns during the implantation phase. 43 These results implied that specific spatiotemporal expression patterns contribute to the attainment of endometrial receptivity.
Embryo implantation is an intricate physiological processes that includes the prereceptivity, receptivity, and implantation phases. Our results demonstrated that the temporal and spatial changes in mRNA profiles determined the divergent functions of the different stages in the endometrium during preimplantation and peri-implantation. Furthermore, we investigated the regulation between miRNAs and mRNA throughout the process and provided significant insights into understanding the basic mechanisms of embryo implantation. This study will not only help us to understand how miRNAs control preimplantation and peri-implantation but also provide potential biomarkers for embryo implantation events.
Footnotes
Declaration of Conflicting Interests
The author(s) declared no potential conflicts of interest with respect to the research, authorship, and/or publication of this article.
Funding
The author(s) received no financial support for the research, authorship, and/or publication of this article.