
Abstract
Due to the clinical significance of steroidal saponins, multiple stems Paris polyphylla var. yunnanensis (MPPY) has attracted much interest and played a crucial role in drug development. However, developing a simple and efficient method to analyze the chemical composition of MPPY remains a pronounced challenge. Herein, we report for the first time the component analysis of MPPY rhizomes using the chromatographic fingerprint combined with ultra-high performance liquid chromatography coupled with electrospray ionization quadrupole time-of-flight mass spectrometry (UPLC-ESI-Q-TOF-MS) method. Nineteen compositions of MPPY were qualitatively investigated by such strategy and confirmed as steroidal saponins. Among these compositions, 17 steroidal saponins were detected in 10 different batches of MPPY. Thirteen common peaks appeared in chromatographic fingerprint, of which 11 common peaks can be attributed by LC–MS data. The experimental facts demonstrate that the method established is simple, rapid, and reliable to evaluate the quality of MPPY. Besides, the correlation and difference of steroidal saponins in the rhizomes of MPPY from different places were also studied.
Introduction
Paris polyphylla var. yunnanensis (PPY) is a perennial herb distributed mainly in the provinces of Yunnan, Sichuan, Chongqing, Guizhou, Guangxi and other provinces in Southwest China and western portions of Hunan, and used as an authentic medicinal herbs in Yunnan.1-3 The dried rhizomes of PPY are recognized as precious traditional Chinese medicines (TCMs), which are listed in Chinese pharmacopoeia (Chinese Pharmacopoeia Commission, 2015).4-7 The western Yunnan such as Dali and Lijiang are the main original places of PPY raw materials. According to the rhizome shape, there are two different morphologies of PPY. One is the single stem rhizome, namely single Paris polyphylla var. yunnanensis (SPPY) recorded in both Flora Reipublicae Popularis Sinicae and Flora of Yunnan, the other is the multi-stem rhizomes, ranging from a few stems to hundreds of stems, ie, multiple stems Paris polyphylla var. yunnanensis (MPPY), also named as the duo jing chong lou and/or duo ya chong lou. 8 Currently, MPPY plays the main role in artificial planting field because of its morphological advantages including larger leaf area, stronger photosynthesis and faster growth speed than that of SPPY.9,10
The literatures reported on the quality evaluation of MPPY are rare to date, most research focused on those of SPPY and Paris polyphylla var. chinensis (PPC) because of the fact that MPPY has few common peaks in the HPLC fingerprint chromatography spectra and its qualitative analysis remains a significant challenge.11-13 As a result, it is difficult to comprehensively evaluate the quality of MPPY. At present, the fingerprint technology is considered to be one of the most rational and powerful approaches for quality evaluation of TCMs, and has been used by the World Health Organization and the State Food and Drug Administration (SFDA) of China for the determination of TCMs.14,15 As the accurate and rapid analysis function, ultra-high performance liquid chromatography coupled with electrospray ionization quadrupole time-of-flight mass spectrometry (UPLC-ESI-Q-TOF-MS) has been employed widely in qualitative and quantitative research on chemical components.16,17 UPLC-ESI-Q-TOF-MS demonstrates excellent separation efficiency and strong structural characterization capability, and can not only give the molecular weight, structural information but also the qualitative analysis of chemical components.18-20 In this work, we hope to establish HPLC fingerprint chromatography of the MPPY to analyze and assign the common peaks and then combine UPLC-ESI-Q-TOF-MS technology to evaluate comprehensively the quality of MPPY.
Materials and Methods
Apparatus
The HPLC separation was performed using an Agilent 1260 HPLC system (Agilent Technologies), equipped with a quaternary pump (G1311C), an autosampler (G7129A), a column temperature controller (G1316A) and a diode array detector (DAD, G1315D). The UHPLC separation was carried out by UltiMate 3000 UPLC system (Dionex Technologies), equipped with a quaternary pump (DGP-3600A), autosampler (WPS-3000SL), column temperature controller (TCC-3000), and DAD (PDA-3000). The TOF MS experiments were executed using a compact system (Bruker Daltonics). The SK5200H was purchased from Shanghai Kudos Factory, FY131 TCM Crusher was bought from Tianjin Taisite Instrument Co., AE240 Electronic Balance was purchased from Mettler Toledo (Mettler Toledo).
Reagents and Herbal Medicine Samples
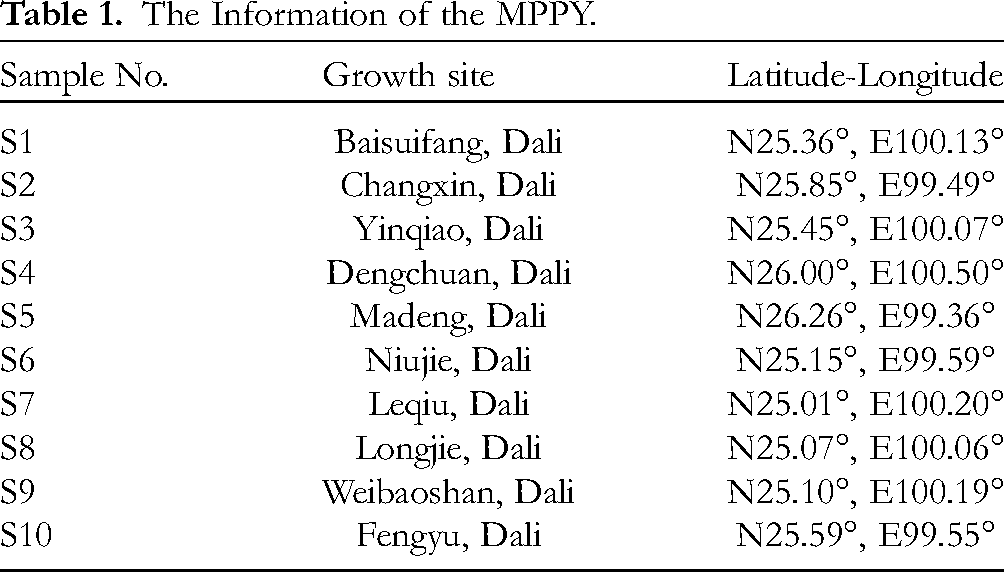
Reference standards (≥98%) including polyphyllin Ⅰ, polyphyllin Ⅱ, polyphyllin Ⅵ, polyphyllin Ⅶ were purchased from National Institutes for Good and Drug Control, polyphyllin H, polyphyllin Ⅲ and polyphyllin Ⅴ were purchased from Shanghai Jinsui Bio-Technology Co., Ltd. Methano and acetonitrile (HPLC grade) were purchased from Tedia. Deionized water was prepared by a Milli-Q system (Millipore). The other reagents used were analytical grade. The rhizomes of MPPY were collected from Dali region of Yunnan Province (Figure S1). Each rhizome of MPPY was dried in an oven at 60 °C to reach a constant weight (Table 1).
The Information of the MPPY.
Sample Preparation
The standard samples (polyphyllin VII, H, VI, II, III, I, and V) were dissolved in methanol to obtain 5 mL expected standard solutions with different concentrations (0.236, 0.238, 0.240, 0.650, 0.736, 0.660, and 0.248 mg/mL, respectively), and stored in a refrigerator at 4 °C. The prepared dry MPPY rhizomes were homogenized using a FY131 TCM crusher. For each sample, the fine powder (0.5 g) was mixed with ethanol (4 mL, 75 wt.%) and then was ultrasonically extracted for 60 minutes. The ethanol mixture solution was filtered, and the residue was extracted again by the same procedure. The filtrate was diluted to 10 mL with ethanol. The supernatant was further treated using a 0.22-μm membrane filter before HPLC and UPLC-ESI-Q-TOF-MS analyzing.
HPLC Condition
HPLC analysis was performed on the Agilent 1260 HPLC system. The samples were separated on the Eclipse XDB-C18 column (4.6 mm × 250 mm, 5 μm), using water (A) and acetonitrile (B) as the mobile phase. The gradient elution program was as follows, 0 to 8 min: 20%-40% B; 8 to 39 min: 40% to 44% B; 39 to 49 min: 44% to 47% B; 49 to 52 min: 47% to 60% B; 52 to 60 min: 60% to 20% B. The flow rate was 1 mL/min, the column temperature was 30 °C, the UV detector was set at 203 nm, the injection volume was 10 μL for all standards and samples.
UPLC-Q-TOF-MS Analysis Conditions
The UPLC analysis was carried out with the Dionex Ultimate 3000 system. The samples were separated on the Eclipse XDB-C18 column (4.6 mm × 250 mm, 5 μm), using water (A) and acetonitrile (B) as the mobile phase. The gradient elution program was as follows, 0 to 10 min: 35% to 45% B; 10 to 25 min: 45% to 50% B; 25 to 35 min: 50% to 60% B; 35 to 45 min: 60% to 80% B; 45 to 55 min: 80% to 100% B; 55 to 60 min: 100% to 35% B. The flow rate was 0.3 mL/min, the column temperature was 30 °C, the UV detector was set at 203 nm, the injection volume was 5 μL for all standards and samples. The TOF MS experiments were conducted using a compact system in the ESI (+) ionization modes. The nebulizer pressure was 253.8 kPa. The source and desolvation temperature were 220 °C and 350 °C, respectively, and the desolvation gas (nitrogen) flow rate was 8 L/min. The capillary voltage was 4 kV for the ESI (+) and the date acquisition range was 50 to 1500 Da. Argon was used as collision gas, which carried 8 eV collision energy when scanning. The RF lens pulse voltage was 70 Vpp and the quadrupole ion energy was 8 eV. The experiment data were collected in centroid mode and the mass accuracy was maintained by a Na[NaCOOH]+ as the reference, m/z 90.9766 ESI (+).
Results and Discussion
Establishment of HPLC Fingerprint
The relative standard deviation (RSD) of the relative retention time and relative peak area for each compound was calculated. The stability of the sample solutions was analyzed at time intervals of 2, 4, 6, 8, 10, 12 and 24 hours at room temperature. For testing the repeatability of experimental results, six independent sample solution extracts were made and analyzed. All results showed that the RSD of relative retention time as well as relative peak area was lower than 3% for the precision, stability and repeatability tests, exhibiting favorable measurement results.
Based on the HPLC results, the similarities of different MPPY rhizomes were calculated using the software Similarity Evaluation System for Chromatographic Fingerprint of Traditional Chinese Medicine, Version 2004A. Simultaneously, a standard chromatogram, containing all the common peaks in those of the 10 samples (S1-S10), was calculated using the median method, and then the similarities between the reference and the sample chromatogram were computed.
Similarity Analysis of HPLC Fingerprints
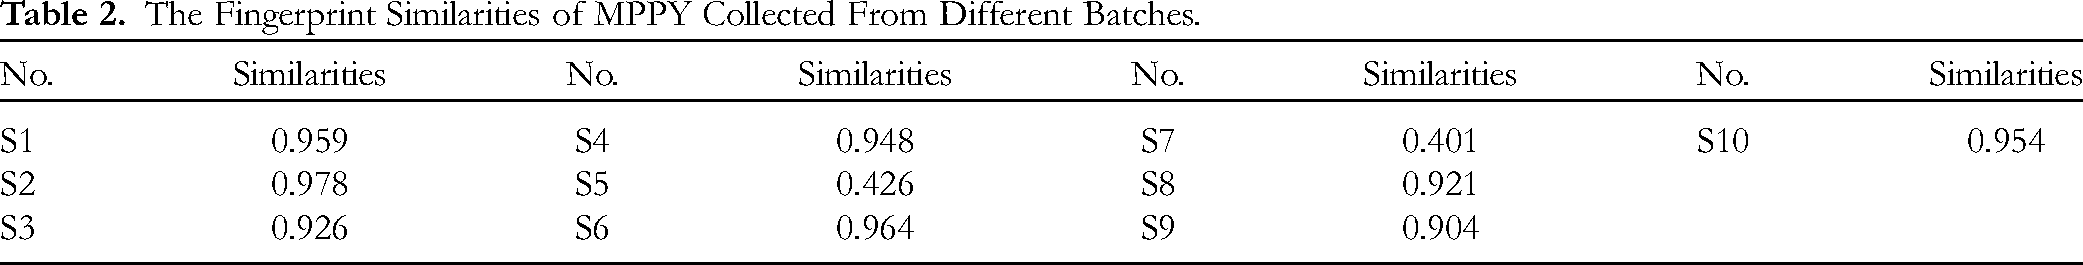
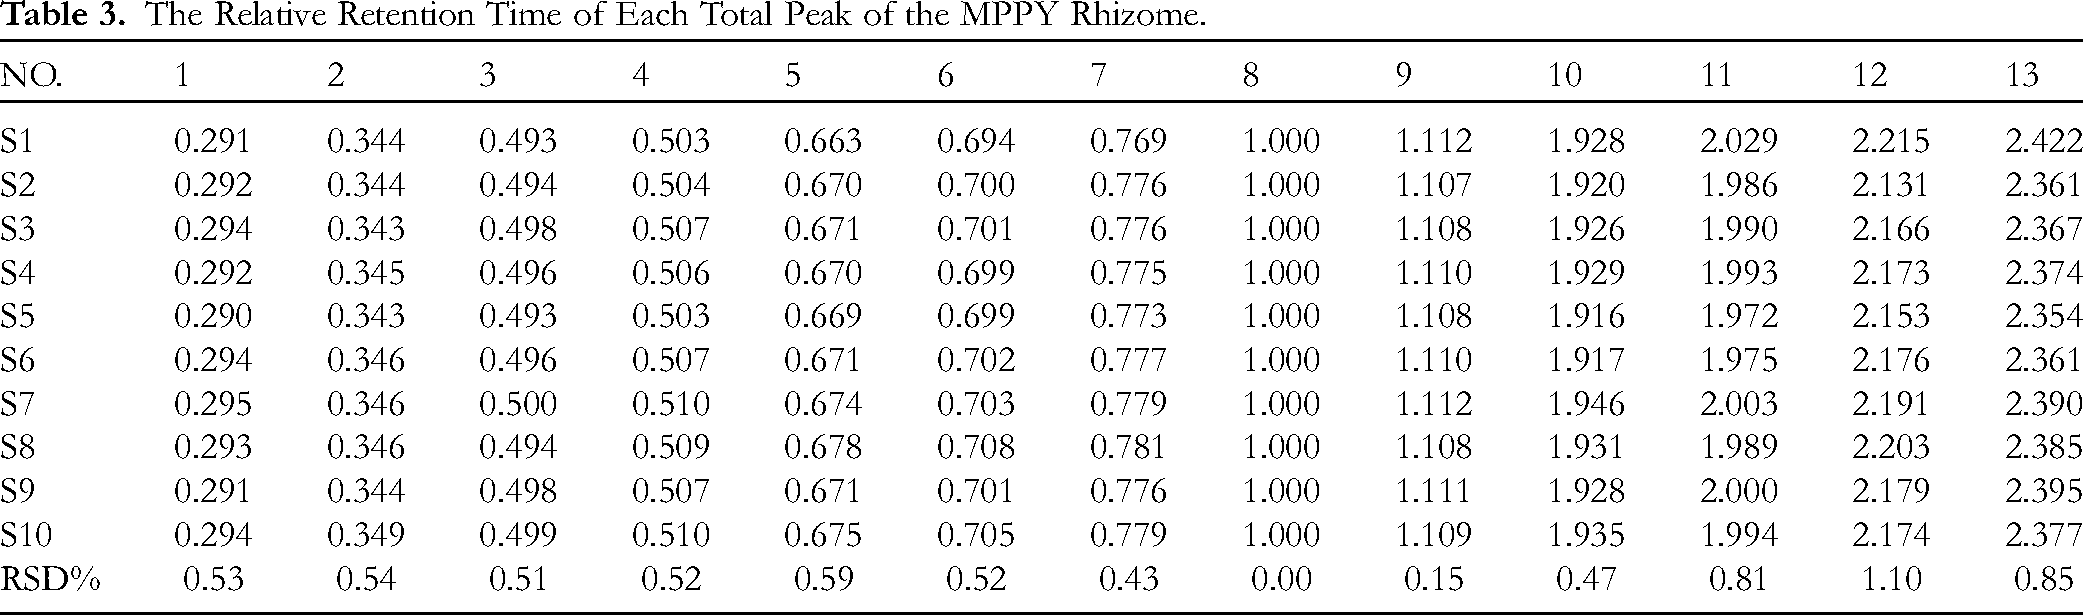
The fingerprints of 10 batches MPPY rhizomes were aligned automatically using the similarity evaluation system for chromatographic fingerprint of traditional Chinese medicine. The Chromatogram generated by the software was shown in Figure 1. There were 13 common peaks marked 1 to 13 in the chromatograms of 10 samples (S1-S10), respectively, indicating the similar chemical composition between these samples. Similarity analysis was conducted between the standard fingerprint and the10 samples shown in Table 2. The similarity values of 10 batch samples were 0.959, 0.978, 0.926, 0.948, 0.964, 0.426, 0.921, 0.401, 0.904, and 0.954. Compared with the standard chromatogram, the majority of these values were higher than 0.900. However, the similarity of S6 and S8 was 0.426 and 0.401, respectively, the possible reason was the habitat effect. The polyphyllin Ⅶ (peak 8) was selected as the reference peak. The relative retention time (tR) and relative peak areas of these 13 common peaks were listed in Tables 3 and 4. The relative retention time RSD of each shared peak was less than 3%, which met the requirements of HPLC fingerprint establishment, while the relative peak area RSD of each shared peak was large. The experimental results indicated that there was a certain difference in the chemical content of S1 to S10 from different producing place.

HPLC fingerprint of 10 samples and the standard chromatogram (R).
The Fingerprint Similarities of MPPY Collected From Different Batches.
The Relative Retention Time of Each Total Peak of the MPPY Rhizome.
The Relative Peak Area of Each Total Peak of the MPPY Rhizome.

Qualitative Analysis of Chemical Components
UPLC-Q-TOF-MS was used to analyze the 10 batch MPPY samples under the above chromatographic and MS conditions. All the MSE centroid data were processed using Data Analysis 4.3 software (Bruker Daltonics). For MS detection, the operating parameters were as follows: HPC mode, the intensity was 1000, and the maximum error of the Q-TOF micr external standard method was set to 5 ppm (m/z > 400) or 4 mDa (m/z < 400). The relative molecular weight and possible molecular formula of the compound were determined by the accurate molecular mass of the excimer ion peak, and the element composition and structure were estimated by fragment ions generated during high-energy scanning. Finally, the possible structure of the chromatographic peak was identified by fragmentation mechanism and retention behavior of steroidal glycosides in the reference. In the ESI (+) ionization modes, the mass spectrogram analysis obtained mainly [M+H]+, [M+Na]+ excimer ion peaks. Based on the exact mass information, the fragmentation characteristics, and retention behavior of steroidal glycosides in the reference,21,22 19 chemical components (Figure 2, peak 1-19) of the 10 batch MPPY samples were identified and classified as steroidal compounds. The analysis of 19 peaks was performed and the results were shown in Table S1. The peaks 1 to 19 were assigned to the Pariyunnanoside A, Dichotomin, Pseudoproto-pb, Pariyunnanoside B, Pariyunnanoside C, Pariyunnanoside D, Pariyunnanoside E, Polyphyllin VII, Polyphyllin H, Tg, Polyphyllin VI, Pb, Polyphyllin II, Reclinatoside, Dioscin, Polyphyllin I, Polyphyllin V, Prosapogenin A of dioscin and Protogracillin, respectively, and the corresponding chemical structure formulas were presented in Figure S2.

UPLC-ESI-Q-TOF-MS chromatogram of MPPY.
As can be seen from Table S2, 17 steroidal saponins were detected in the ten MPPY batches, suggesting their similar chemical compositions, but the chemical compositions of the samples prepared were not the same. Prosapogenin A of dioscin was not found in sample S3 and S4. Protogracillin was not discovered in S1, S2, S3, S4, and S10. The above differences of chemical compositions may be attributed to the influence of different habitat factors on the accumulation of secondary metabolites for the MPPY rhizomes.
Establishment of Principal Component Analysis (PCA) Model
The PCA model was used to investigate the MPPY rhizomes clustering trends and to identify the difference of the peaks between different samples. Herein, the MS data were processed by Profil Analysis software (Bruker Daltonics, Germany). The PCA model was established by single factor grouping to analyze the difference of chemical composition of the MPPY rhizomes. The operating parameters were as follows, time range: 100 to 2400 s, mass range: 50 to 2000 m/z, time tolerance: 2 minutes, mass tolerance: 1.0 m/z, intensity normalization, no data preprocessing, no interference peak deduction, no background deduction. The PCA score plot was shown in Figure 3, in which each point represented an individual sample. The samples with similar chemical compositions were clustered together, whereas those with different chemical compositions were scattered. The PCA scores plot demonstrated a clear distinction between the two classes in the PC1 dimension. Class 1 (S1-S4, S10) was clustered very well, and the rest (S5-S9) were grouped into Class 2. In the analysis of the main differential peaks, the judgment standard was that the farther the point from the center, the greater contribution rate to the difference. As shown in Figure 4, the time points (12.83 min: 375.000 m/z, 17.84 min: 375.000 m/z, 19.51 min: 375.000 m/z, 21.18 min: 375.000 m/z) were the farthest from the center, which were the main reason for the difference.

PCA difference analysis of chemical components in MPPY rhizomes.

Analysis of major difference peaks of MPPY rhizomes.
The Attribution of the Common Peaks in the MPPY Rhizomes
As displayed in Figure 1, there were 13 common peaks existing in all chromatograms of the 10 samples, and the structure of five common peaks was determined by reference standards as polyphyllin VII (peak 8), polyphyllin VI (peak 9), polyphyllin II (peak 11), polyphyllin III (peak 12) and polyphyllin I (peak 13). The UPLC-ESI-Q-TOF-MS technique was used to analyze the possible structures of the common peaks. Based on the exact mass information, the fragmentation characteristics, the fragmentation mechanism and retention behavior of steroidal glycosides in the referenced and combined with relative retention time and relative peaks areas of the HPLC Fingerprint Chromatography, six common peaks were determined as Pariyunnanoside A (peak 1), Dichotomin (peak 3), Pseudoproto-pb (peak 4), Pariyunnanoside B (peak 5), Pariyunnanoside D (Peak 6), Pariyunnanoside E (peak 7).
Conclusions
The chemical compositions of the MPPY are complex and diverse with large differences. In this work, we provided a rational strategy for the rapid analysis of the steroidal saponins in the MPPY rhizomes. Through the UPLC-Q-TOF-MS method, the chemical compositions of the MPPY rhizome were well characterized, and 19 steroidal glycosides were quickly identified. For the PCA results, 10 batches of MPPY were clearly separated depending on the chemical composition contained. 17 steroidal saponins can be detected in the 10 samples, indicating their similar chemical compositions. To sum up, the correlation between steroidal saponins of the MPPY rhizomes from different places was high, while the difference existed. The experimental results showed that the strategy established is simple and efficient for analyzing the chemical composition of MPPY.
Supplemental Material
sj-docx-1-npx-10.1177_1934578X231207524 - Supplemental material for A Simple and Efficient UPLC-ESI-Q-TOF-MS Method for Determining the Chemical Composition in Rhizomes of Multiple Stems Paris polyphylla var. yunnanensis
Supplemental material, sj-docx-1-npx-10.1177_1934578X231207524 for A Simple and Efficient UPLC-ESI-Q-TOF-MS Method for Determining the Chemical Composition in Rhizomes of Multiple Stems Paris polyphylla var. yunnanensis by Xue He, Lin Jin, Qicui Wang, Anzhong Peng and Haifeng Li in Natural Product Communications
Footnotes
Acknowledgements
The authors would like to express their sincere gratitude to Faculty of Pharmacy, Dali University, for their valuable assistance during the experiments conducted in this study.
Authors’ Contributions
Conceptualization, X. H. and L. J.; methodology, L. J.; validation, Q. W. and A. P.; writing-original draft preparations, A. P.; writing-review and editing, A. P. and H. L.; supervision, A. P. and H. L.; project administration, H. L. All authors have read and agreed to the published version of the manuscript.
Data Availability Statement
Declaration of Conflicting Interests
The authors declared no potential conflicts of interest with respect to the research, authorship, and/or publication of this article.
Funding
The authors disclosed receipt of the following financial support for the research, authorship, and/or publication of this article: This work is supported by the National Natural Science Foundation of China (81360616), Expert Workstation of Jiang Yong Yunnan Province (202305AF150048), Postdoctoral orientation training program of 2019 Yunnan Province (ynbh20002).
Statement of Institutional Review Board
Not applicable.
Statement of Informed Consent
Not applicable.
Supplemental Material
Supplemental material for this article is available online.
References
Supplementary Material
Please find the following supplemental material available below.
For Open Access articles published under a Creative Commons License, all supplemental material carries the same license as the article it is associated with.
For non-Open Access articles published, all supplemental material carries a non-exclusive license, and permission requests for re-use of supplemental material or any part of supplemental material shall be sent directly to the copyright owner as specified in the copyright notice associated with the article.