
Abstract
Objective
This study aimed to optimize microwave-ultrasound-assisted extraction (MUAE) for the recovery of phenolic acids from Heliotropium foertherianum leaves collected on the Truong Sa Islands, Vietnam, with a particular focus on rosmarinic acid (RA), caffeic acid (CA), and ferulic acid (FA), and to investigate the biological relevance of the obtained fractions and isolated compounds.
Methods
Extraction parameters were optimized using response surface methodology (RSM), with ethanol concentration, liquid-to-solid ratio, and extraction time as independent variables, and RA, CA, and FA contents, determined by HPLC, as response variables. The crude extract was further partitioned into n-hexane, chloroform, ethyl acetate, n-butanol, and aqueous fractions, which were evaluated for antioxidant, antimicrobial, and anti-inflammatory activities using DPPH radical scavenging, agar-well diffusion, and nitric oxide inhibition assays, respectively. The major phenolic acids were subsequently isolated and structurally characterized by MS, FT-IR, Raman, and NMR analyses.
Results
The optimized MUAE conditions were 50% ethanol, a liquid-to-solid ratio of 1:15, and an extraction time of 40 min, under which RA, FA, and CA reached 8.356, 3.92, and 0.125 mg/g, respectively. Among the fractions, the n-butanol extract was the most enriched in phenolics, with RA representing 58.2% of the total phenolic compounds, and it displayed the strongest antioxidant, anti-inflammatory, and antimicrobial activities.
Conclusion
These findings demonstrate that MUAE is an effective and environmentally favorable strategy for recovering bioactive phenolic acids from H.foertherianum, particularly RA-rich fractions.
1. Introduction
Heliotropium foertherianum belongs to the Boraginaceae family, formerly known as Argusia Argentea, and has recently been given the new scientific name H.foertherianum.1,2 H.foertherianum is a small tree or shrub typical of coastal areas, native to tropical Asia, Madagascar, the islands of Micronesia and Polynesia, and Northern Australia.3,4 H.foertherianum leaf extracts and their bioactive constituents possess diverse therapeutic properties, including antimicrobial, antitumor, antiviral, and anti-inflammatory activities, as well as benefits for wound healing and demonstrated cytotoxic and phytotoxic effects.5-7
Extracts from the leaves of the H.foertherianum contain the following main components: pyrrolizidine alkaloids (supinine, 3′-acetylindicine, heliotrine, trachelanthamidine, indicine, viridiflorine), phenolic acids (caffeic acid, rosmarinic acid, ferulic acid), flavonoids (quercetin, kaempferol, isoquercetin, astragalin, luteolin), terpenoids, glycosides, and fatty acid esters.2,8
The extraction and purification of bioactive phenolic compounds from plant matrices represents a significant challenge in natural product chemistry. Traditional techniques such as maceration and soxhlet extraction are commonly used due to their simplicity, but they often consume large amounts of solvent, require long processing times, and carry the risk of degrading heat-sensitive compounds. 9 Modern energy-assisted extraction methods, such as ultrasonic extraction (UAE) and microwave extraction (MAE), have been widely applied.10,11 UAE helps shorten the time and reduce solvent use, but requires optimization of factors such as power, temperature, and solid/solvent ratio, whereas MAE enhances diffusion and cell disruption, but excessive power or irradiation time can cause degradation of heat-sensitive compounds.12-16 Garcia-Vaquero et al 17 demonstrated that microwave-ultrasound assisted extraction (MUAE) significantly enhanced the recovery of bioactive compounds from the brown seaweed Ascophyllum nodosum, yielding 3533.75 mg fucose/100 g dry weight, 10408.72 mg glucose equivalents/100 g dry weight, and 2605.89 mg GAE/100 g dry weight, which were higher than those obtained by UAE or MAE applied individually. Similarly, Kwansang et al. 18 reported that MUAE under optimal conditions (200 W microwave power, 200 W ultrasonic power, and a particle size of 22.6 μm) significantly increased the total phenolic, caffeic acid, ferulic acid, and α-mangostin contents extracted from mangosteen pericarp compared with conventional decoction extraction.
The microwave-ultrasound-assisted extraction (MUAE) method combines the cavitation effect of ultrasound with microwave heating, creating a synergistic dual-energy approach that substantially enhances extraction efficiency, reduces processing time, and minimizes solvent consumption in alignment with green extraction principles. 2
This study identified H.foertherianum leaves collected in Truong Sa islands, Vietnam, and investigated the factors affecting the recovery efficiency of the main phenolic acid compounds in H.foertherianum leaf extract using the MUAE method. Evaluated the biological activity of the extracted fractions and isolated 3 phenolic compounds with significant content in the extract.
2. Materials and Methods
2.1. Chemicals
Standard: rosmarinic acid (RA), caffeic acid (CA), ferulic acid (FA), 98 % for HPLC, Sigma-Aldrich; vanilin, formic acid (HCOOH) acetic acid (AA), 99%, Macklin, China; solvent: ethanol (EtOH), methanol (MeOH), 96°, Duc Giang, Vietnam, n-hexane, n-butanol, ethyl acetate (EtOAc), acetone ((CH3)2CO), chloroform (CHCl3), toluene (C6H5CH3), 99%, Macklin, China. All chemicals and solvents were used without further purification.
2.2. Plant Collection and Identification
H. foertherianum was collected from Truong Sa district, Khanh Hoa province, Viet Nam, and was identified by a plant taxonomist in the Institute of Ecology and Biological Resources, Vietnam Academy of Science and Technology (VAST).
2.3. Ash Value and Moisture Value
Determination of ash value of H.foertherianum leaves according to ISO 1575 standard, used Furnace F6020C-80, Thermo Scientific. The moisture content of H.foertherianum leaves was determined by the Loss on Drying method (European Pharmacopoeia - EP; EP 2.2.32).
2.4. Extraction and Fractionation
Microwave, Ultrasound-Assisted Extraction (MUAE) Program

The extract was filtered, concentrated by rotary evaporation under reduced pressure (60°C, 150 mmbar, 2 hours), 100 ml of ethanol was added, cooled to 0°C overnight, the precipitate was filtered, and the concentrate was concentrated by rotary evaporation under reduced pressure (50°C, 250 mmbar, 15 minutes). The soft extract obtained from the extract was dissolved in water and fractionated with the following solvents: n-hexane, CHCl3, EtOAc, and n-BuOH (Figure 1). HPLC analyzed the fractionated solutions. Fraction solutions of H.foertherianum leaves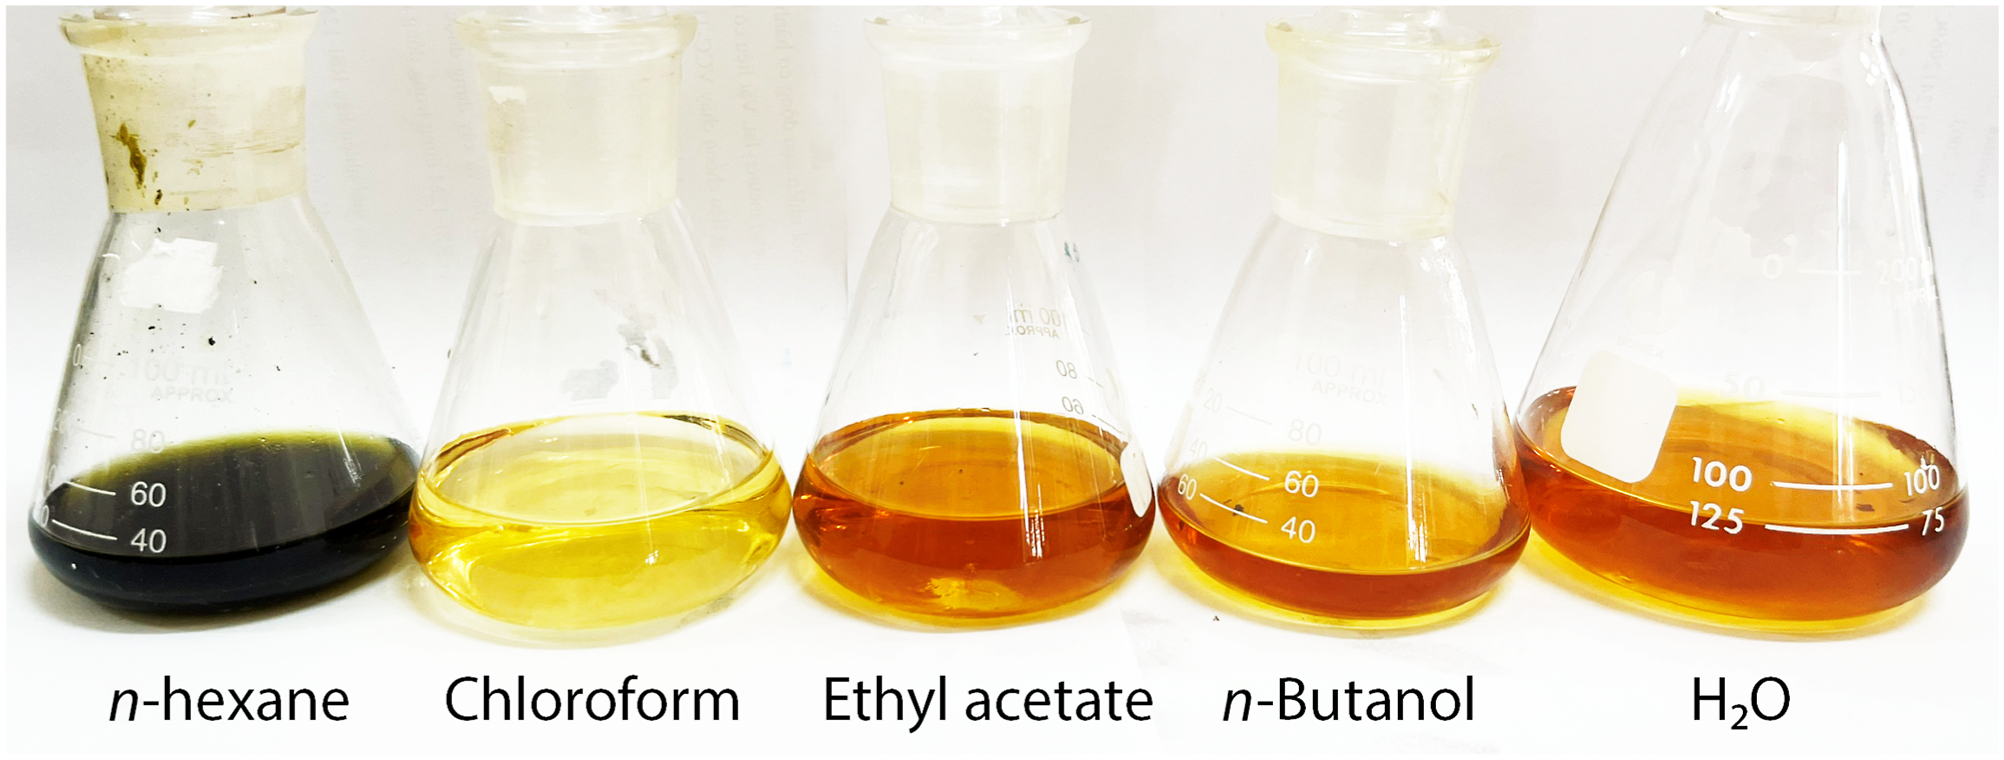
The soft extracts (semi-solid extracts with a sticky consistency) from the fractions were obtained by rotary evaporation under reduced pressure, and their biological activity was subsequently evaluated.
2.5. Biological Activity
2.5.1. DPPH Assay
The DPPH assay was conducted according to the method of Liao H et al.
18
1,1-Diphenyl-2-picrylhydrazyl (DPPH) is a free radical that has a purple color and shows maximum absorption at 517 nm. When antioxidants are present, it is reduced to 2,2-Diphenyl-1-picrylhydrazine (DPPH-H), which appears yellow. The decrease in absorbance at 517 nm is measured to assess the free radical scavenging ability of the antioxidant against DPPH radicals.
19
The free radical scavenging activity (SA) of the test sample against DPPH radicals is calculated using the following formula.
2.5.2. Agar-Well Diffusion Assay
An antibacterial test was conducted using the agar-well diffusion assay on gram (+) microbial strains, Bacillus cereus (ATCC 11778) and Saccharomyces cerevisiae (ATCC 9763), and gram (-) Escherichia coli (ATCC 25922) according to the method of Hossain et al. 20
2.5.3. Anti-inflammatory Activity
The fraction extracts were evaluated for their potential anti-inflammatory activity by measuring NO production in LPS-stimulated RAW 264.7 macrophages (ATCC TIB-71), according to the method of Tsai PJ et al.21,22 The nitrite content of each experimental sample was determined using a NaNO2 standard curve and compared as a percentage with the negative control (LPS). Nitric oxide (NO) was detected and quantified spectrophotometrically as its stable breakdown product, nitrite, using the Griess reaction. The inhibitory capacity of NO production corresponding to each sample was determined using the following formula: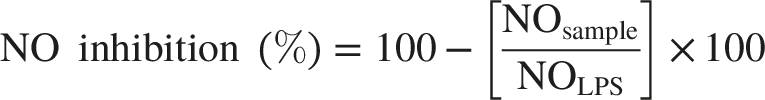
Biological experiments (DPPH, agar-well diffusion, and anti-inflammatory) were performed at the Laboratory of the Institute of Biotechnology, VAST.
2.6. HPLC Analyses
Standard Curve Data for 3 Phenolic Acids

2.7. Isolating Phenolic Compounds
Analytical and preparative TLC were carried out on Merck 60 F2S4 silica gel plate (thickness: 0.25 mm) and on a plate (thickness: 0.50 mm), respectively. Column chromatography (C.C.) and flash-column chromatography (F.C.C.) were carried out with Kieselgel 60 H (Merck) accroding to the method of Amani et al. 24 The purity of the isolated phenolic compounds was assessed by thin-layer chromatography and HPLC.
2.8. Spectroscopic Methods to Elucidate Structure
Spectroscopic analysis in IR (FT-IR) was performed on the Perkin Elmer Spectrum Two with the applied ATR attachment (Attenuated Total Reflectance method), spectras were recorded at 4000–400 cm-1 frequency and peak values were recorded. 25 Raman spectra were performed on the DXR3 Raman spectrometer with a 532 nm laser source. 26 Melting point of compounds measured on the BIBBY Stuart apparatus. 27 These spectroscopic methods (FT-IR, Raman, and melting point) were performed at the Institute of Materials, Biology, and Environment.
Mass spectra were performed on the Thermo Fisher MSQ Plus with DAD (Diode Array Detector); the spectroscopic analysis of nuclear magnetic resonance (NMR) was performed on the Bruker NMR System 600 MHz using the internal pattern -tetramethylsilane (TMS). As dissolvents, deuterated chloroform (CDCl3) and DMSO-d6 were used. 28 The measurements were made at 25°C. Spectroscopic methods were performed at the Institute of Chemistry, VAST.
2.9. Statistical Analysis
All experiments were conducted in triplicate. The extraction process was optimized using response surface methodology in Design-Expert 12, with ethanol concentration, liquid-to-solid ratio, and extraction time as independent variables and HPLC-quantified contents of RA, CA, and FA as response variables. Experimental data were fitted to a second-order polynomial model, and ANOVA evaluated the statistical significance of the model and its terms. Model adequacy was assessed using R 2 , adjusted R 2 , predicted R 2 , and the lack-of-fit test, with statistical significance set at p < 0.05. HPLC peak integration, calibration calculations, and quantitative data processing were performed in Microsoft Excel 365, and calibration curves were prepared using OriginPro 2024.
The free radical scavenging concentration SC50 (Scavenging Concentration at 50% – the concentration that scavenges 50% of DPPH free radicals) or IC50 (the antioxidant concentration that reduces 50% of free radicals) is determined using TableCurve 2Dv4 software.
IC50 value (concentration that inhibits 50% of NO formation) was determined using TableCurve 2D v4.0 software through dose-response curve fitting. 29
3. Results
3.1. Botanical Identification
Morphological documentation of Heliotropium foertherianum, including leaves, flowers, and stamens, is presented in Figure 2. The plant specimens were systematically compared against the Global Biodiversity Information Facility (GBIF) database (Species Code: 4065845; Dataset: GBIF Backbone Taxonomy; Rank: SPECIES), confirming taxonomic congruence with established species criteria. This standardized taxonomic verification ensures accurate species identification and validates the botanical authenticity of the phytochemical and biological activity evaluations conducted on H.foertherianum leaf extracts. Photograph: H.foertherianum (Blanco) Mabb. (A, B) Growth habit; C, D. Adaxial and abaxial leaf surfaces; E, F. Flower clusters; G. Flower; H. Corolla opened; I. Flower in longitudinal section; J. Calyx adaxial and abaxial surfaces; K. Stamen; L. Pistil; M. 10x optical
Leaf anatomy results of H.foertherianum are given in Figure 3. The transverse section through the midvein of the H.foertherianum leaf exhibits a symmetrical anatomical structure. The illustration presented herein depicts a half-section of the leaf cross-section, encompassing both the principal vein and an adjacent portion of the lamina. Leaf anatomy in transverse section. Notes: 1. Protective trichome; 2. Secretory trichome; 3. Adaxial epidermis; 4. Adaxial hypodermis; 5. Mesophyll (spongy parenchyma); 6. Xylem (wood); 7. Phloem (sieve tissue); 8. Abaxial hypodermis; 9. Abaxial epidermis; 10 and 11. Palisade parenchyma; 12. Spiculate calcium oxalate crystals
3.1.1. Midvein Anatomy
The midvein displays the following tissue organization in a basipetal direction: (1) Protective trichomes (unicellular hair): These simple, unicellular structures are distributed abundantly across both the adaxial and abaxial leaf surfaces. (2) Secretory trichomes (multicellular glandular hair): These multicellular glandular hairs, possessing rounded apical heads, are dispersed sparsely across the adaxial (upper) leaf surface. (3) Adaxial epidermis: This layer comprises a single row of rounded epidermal cells arranged in close juxtaposition to one another. (4) Adaxial hypodermis (upper palisade parenchyma): This tissue consists of five to six rows of rounded cells with uniformly thickened cell walls; however, cellular dimensions vary considerably. (5) Mesophyll (spongy parenchyma): This tissue occupies the majority of the vascular cross-section and is composed of rounded cells with variable dimensions. The cells exhibit thin walls and are arranged in an interstitial pattern, creating conspicuous intercellular spaces. (6) Xylem (Wood): The vascular wood is organized as gently curved bundles, with the concave surface oriented adaxially and the convex surface oriented abaxially. The xylem cells possess thick walls and exhibit heterogeneous dimensions, with smaller cells positioned dorsally and larger cells positioned ventrally. Thin-walled parenchymatous cells are interspersed between the xylem bundles. (7) Phloem (sieve tissue): The phloem tissue exhibits a curved arrangement closely appressed to the xylem. It consists of cells exhibiting the smallest dimensions within the cross-sectional anatomy, with distinctly thickened cell walls. These cells are organized in small clusters positioned immediately abaxial to the xylem tissue. (8) Abaxial hypodermis (lower palisade parenchyma): This tissue comprises several layers of rounded cells with non-uniform dimensions, arranged in an interstitial pattern with uniformly thickened cell walls. (9) Abaxial epidermis: This layer is composed of a single row of rounded epidermal cells arranged in close juxtaposition, exhibiting larger dimensions than the cells of the adaxial epidermis.
3.1.2. Laminar (Blade) Anatomy
(10, 11) Palisade parenchyma (columnar tissue): The palisade parenchyma is organized into scattered clusters distributed throughout the upper half of the lamina. This tissue comprises elongated rectangular cells with variable dimensions, oriented perpendicularly from the adaxial to the abaxial surface. Interspersed among the palisade bundles are spongy parenchyma cells of notably large dimensions with thin walls, arranged in a disorderly fashion. (12) Calcium oxalate crystals (spiculate druses): Spherical, needle-like calcium oxalate crystal aggregates are dispersed throughout the spongy parenchyma cells in the lower half of the lamina.
Morphological features of leaf powder were presented in Figure 4. The powder exhibits a fine texture and pale greenish coloration. Upon microscopic examination at 40x magnification, the following characteristics are observed: (1) Annular vessels (spiral tracheids): Spiral-configured vascular elements are scattered abundantly throughout the microscopic field of view. (2) Reticulate vessels (network-patterned tracheids): Network-patterned vascular elements frequently accompany and are dispersed together with the spiral vessels. (3) Epidermal Fragments with Stomata: Epidermal tissue fragments bearing stomatal apparatus are present. (4) Calcium oxalate crystals (spiculate druses): Spherical, needle-like crystal aggregates are observed. (5) Starch granules: Individual starch granules occur in isolation but are encountered infrequently. (6) Protective trichomes (unicellular hair): Simple, unicellular hair structures are present throughout the powder. Powder microscopy characteristics of H.foertherianum leaf. Note: 1. Spiral vessel element; 2. Reticulate vessel element; 3. Epidermal tissue fragment bearing protective trichomes; 4. Spiculate calcium oxalate crystals; 5. Starch granule; 6. Protective trichome
3.2. Ash Value and Moisture Value
The moisture value of H.foertherianum leaves was 85.723 ± 0.398%, whereas the ash value was 3.370 ± 0.029%.
3.3. Optimization of MUAE Extraction and Fractionation
3.3.1. Effect of Extraction Parameters on Phenolic Acid Recovery
The effects of ethanol concentration, liquid-to-solid ratio, and extraction time on the recovery of ferulic acid (FA), caffeic acid (CA), and rosmarinic acid (RA) were evaluated by response surface methodology (RSM), and the corresponding response surface plots are presented in Figure 5. RSM diagram of factors affecting the recovery efficiency of phenolic acids
Optimization studies show that the liquid-to-solid ratio greatly affects extraction yield. Increasing the ratio from 1:10 to 1:15 significantly boosts phenolic acid concentration, but ratios above 1:15 provide little to no additional benefit; therefore, a ratio of 1:15 is recommended to optimize solvent use and cost-effectiveness. Concerning solvent composition, a higher ethanol concentration in hydroalcoholic solutions improves phenolic acid recovery; however, extraction efficiency drops at ethanol levels of 70-100%. This decline is due to a change in solvent polarity that makes it harder for the target compounds to dissolve. Consistent with earlier research suggesting a 50–60% ethanol range to balance cell permeability and compound stability, empirical data confirmed that a 50% ethanolic solution used for 40 minutes achieved the highest extraction efficiency (FA: 3.92 mg/g; CA: 0.125 mg/g; RA: 8.356 mg/g). As a result, these conditions were adopted as the standard protocol for later fractionation and isolation of phenolic acids.
RSM models were statistically significant for all responses (p < 0.01), with R 2 values of 0.94 (FA), 0.88 (CA), and 0.90 (RA), indicating acceptable model fit within the tested design space.
3.3.2. Distribution of Phenolic Acids Among Solvent Fractions
The distribution chart of retention time and peak area of the extracted fractions (Figure 6) shows that the n-BuOH fraction has the highest peak intensity distributed around 2-5 minutes: FA (RT= 2.8-2.9); CA (RT= 2.9-3.0 min); RA (RT= 4.9-5 min), indicating that it has the highest phenolic acid content. The analytical results showed that rosmarinic acid was the phenolic acid with the highest content (58.2%), which was mainly concentrated in the n-BuOH fraction (73.69% of the total RA). Retention time and peak area distribution diagram of extracted fractions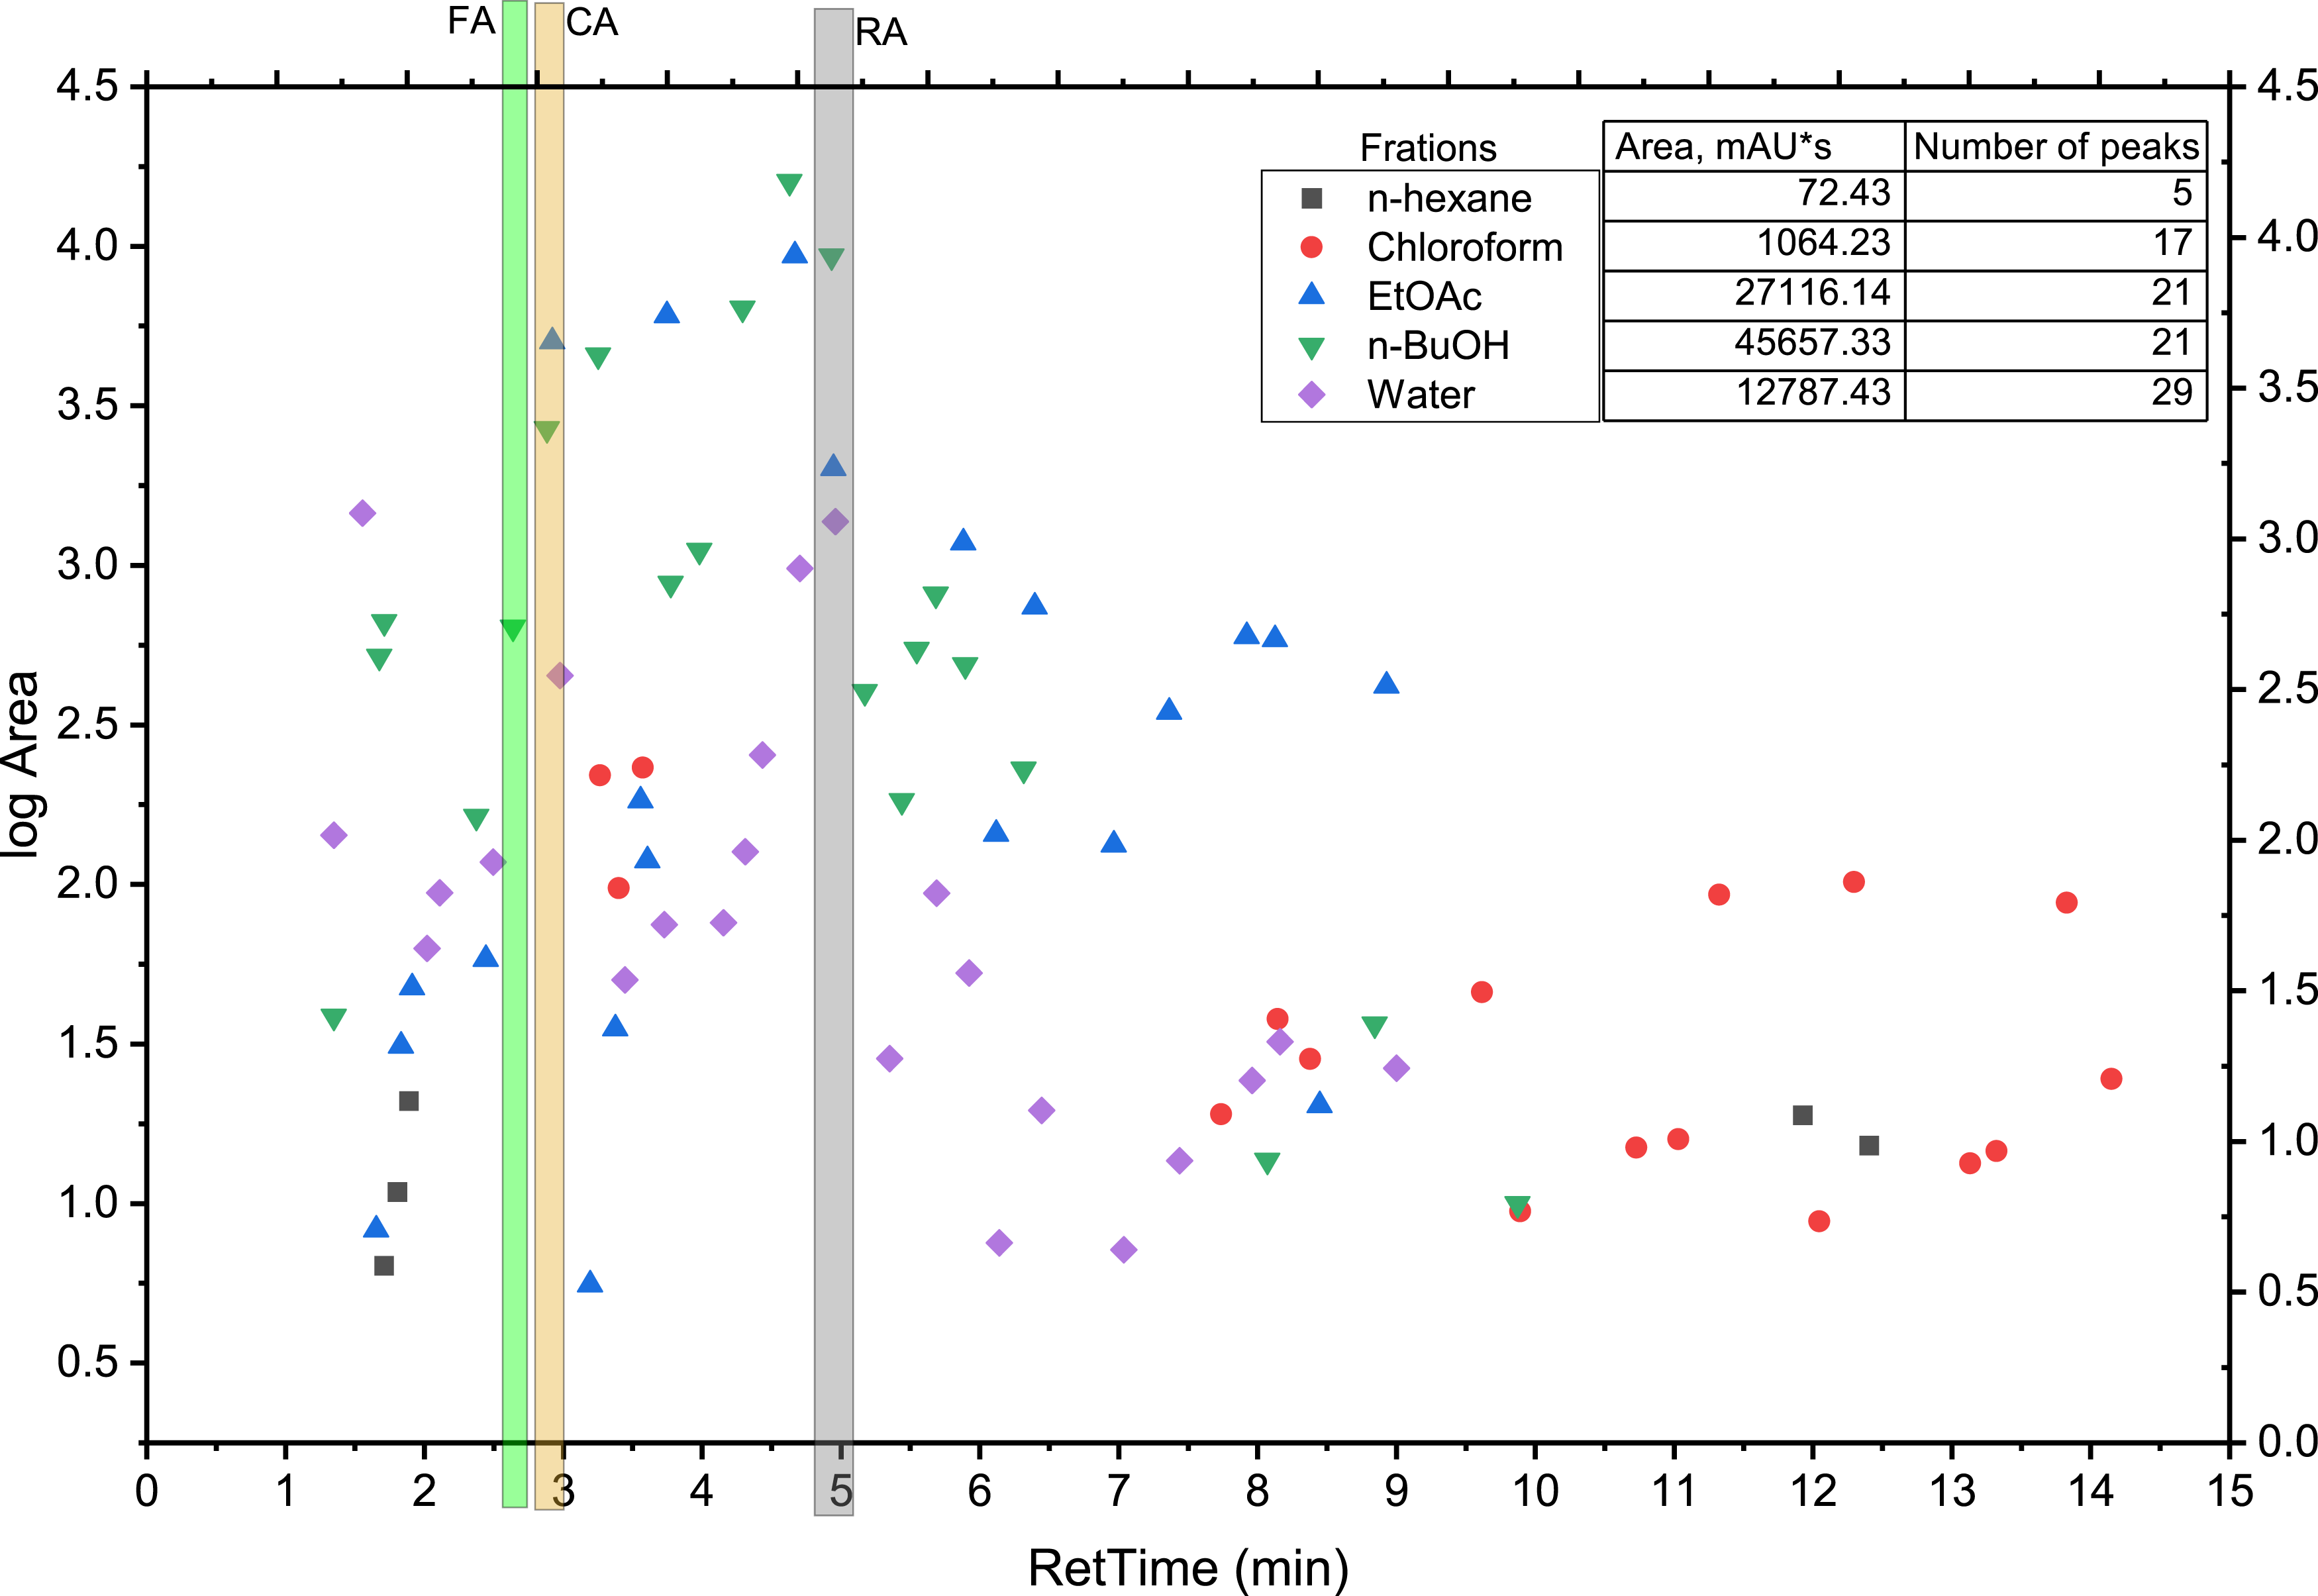
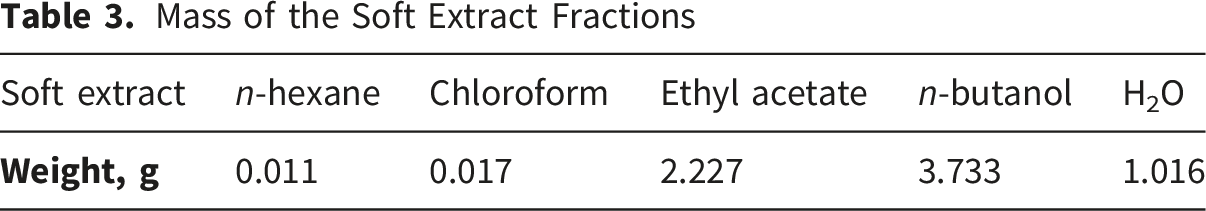
Mass of the Soft Extract Fractions
3.4. Biological Activities of the Extract Fractions
The biological activities of the solvent fractions were evaluated by DPPH radical scavenging, agar-well diffusion results are presented in Figure 7, Table S5, Table S6; nitric oxide inhibition assays results are presented in Table 4. DPPH and antibacterial results of the extract fractions The Ability of Soft Extracts to Inhibit NO Production Because the NO assay was performed in LPS-stimulated RAW 264.7 cells, the present results should be interpreted as in vitro NO inhibition-related evidence rather than definitive proof of anti-inflammatory efficacy.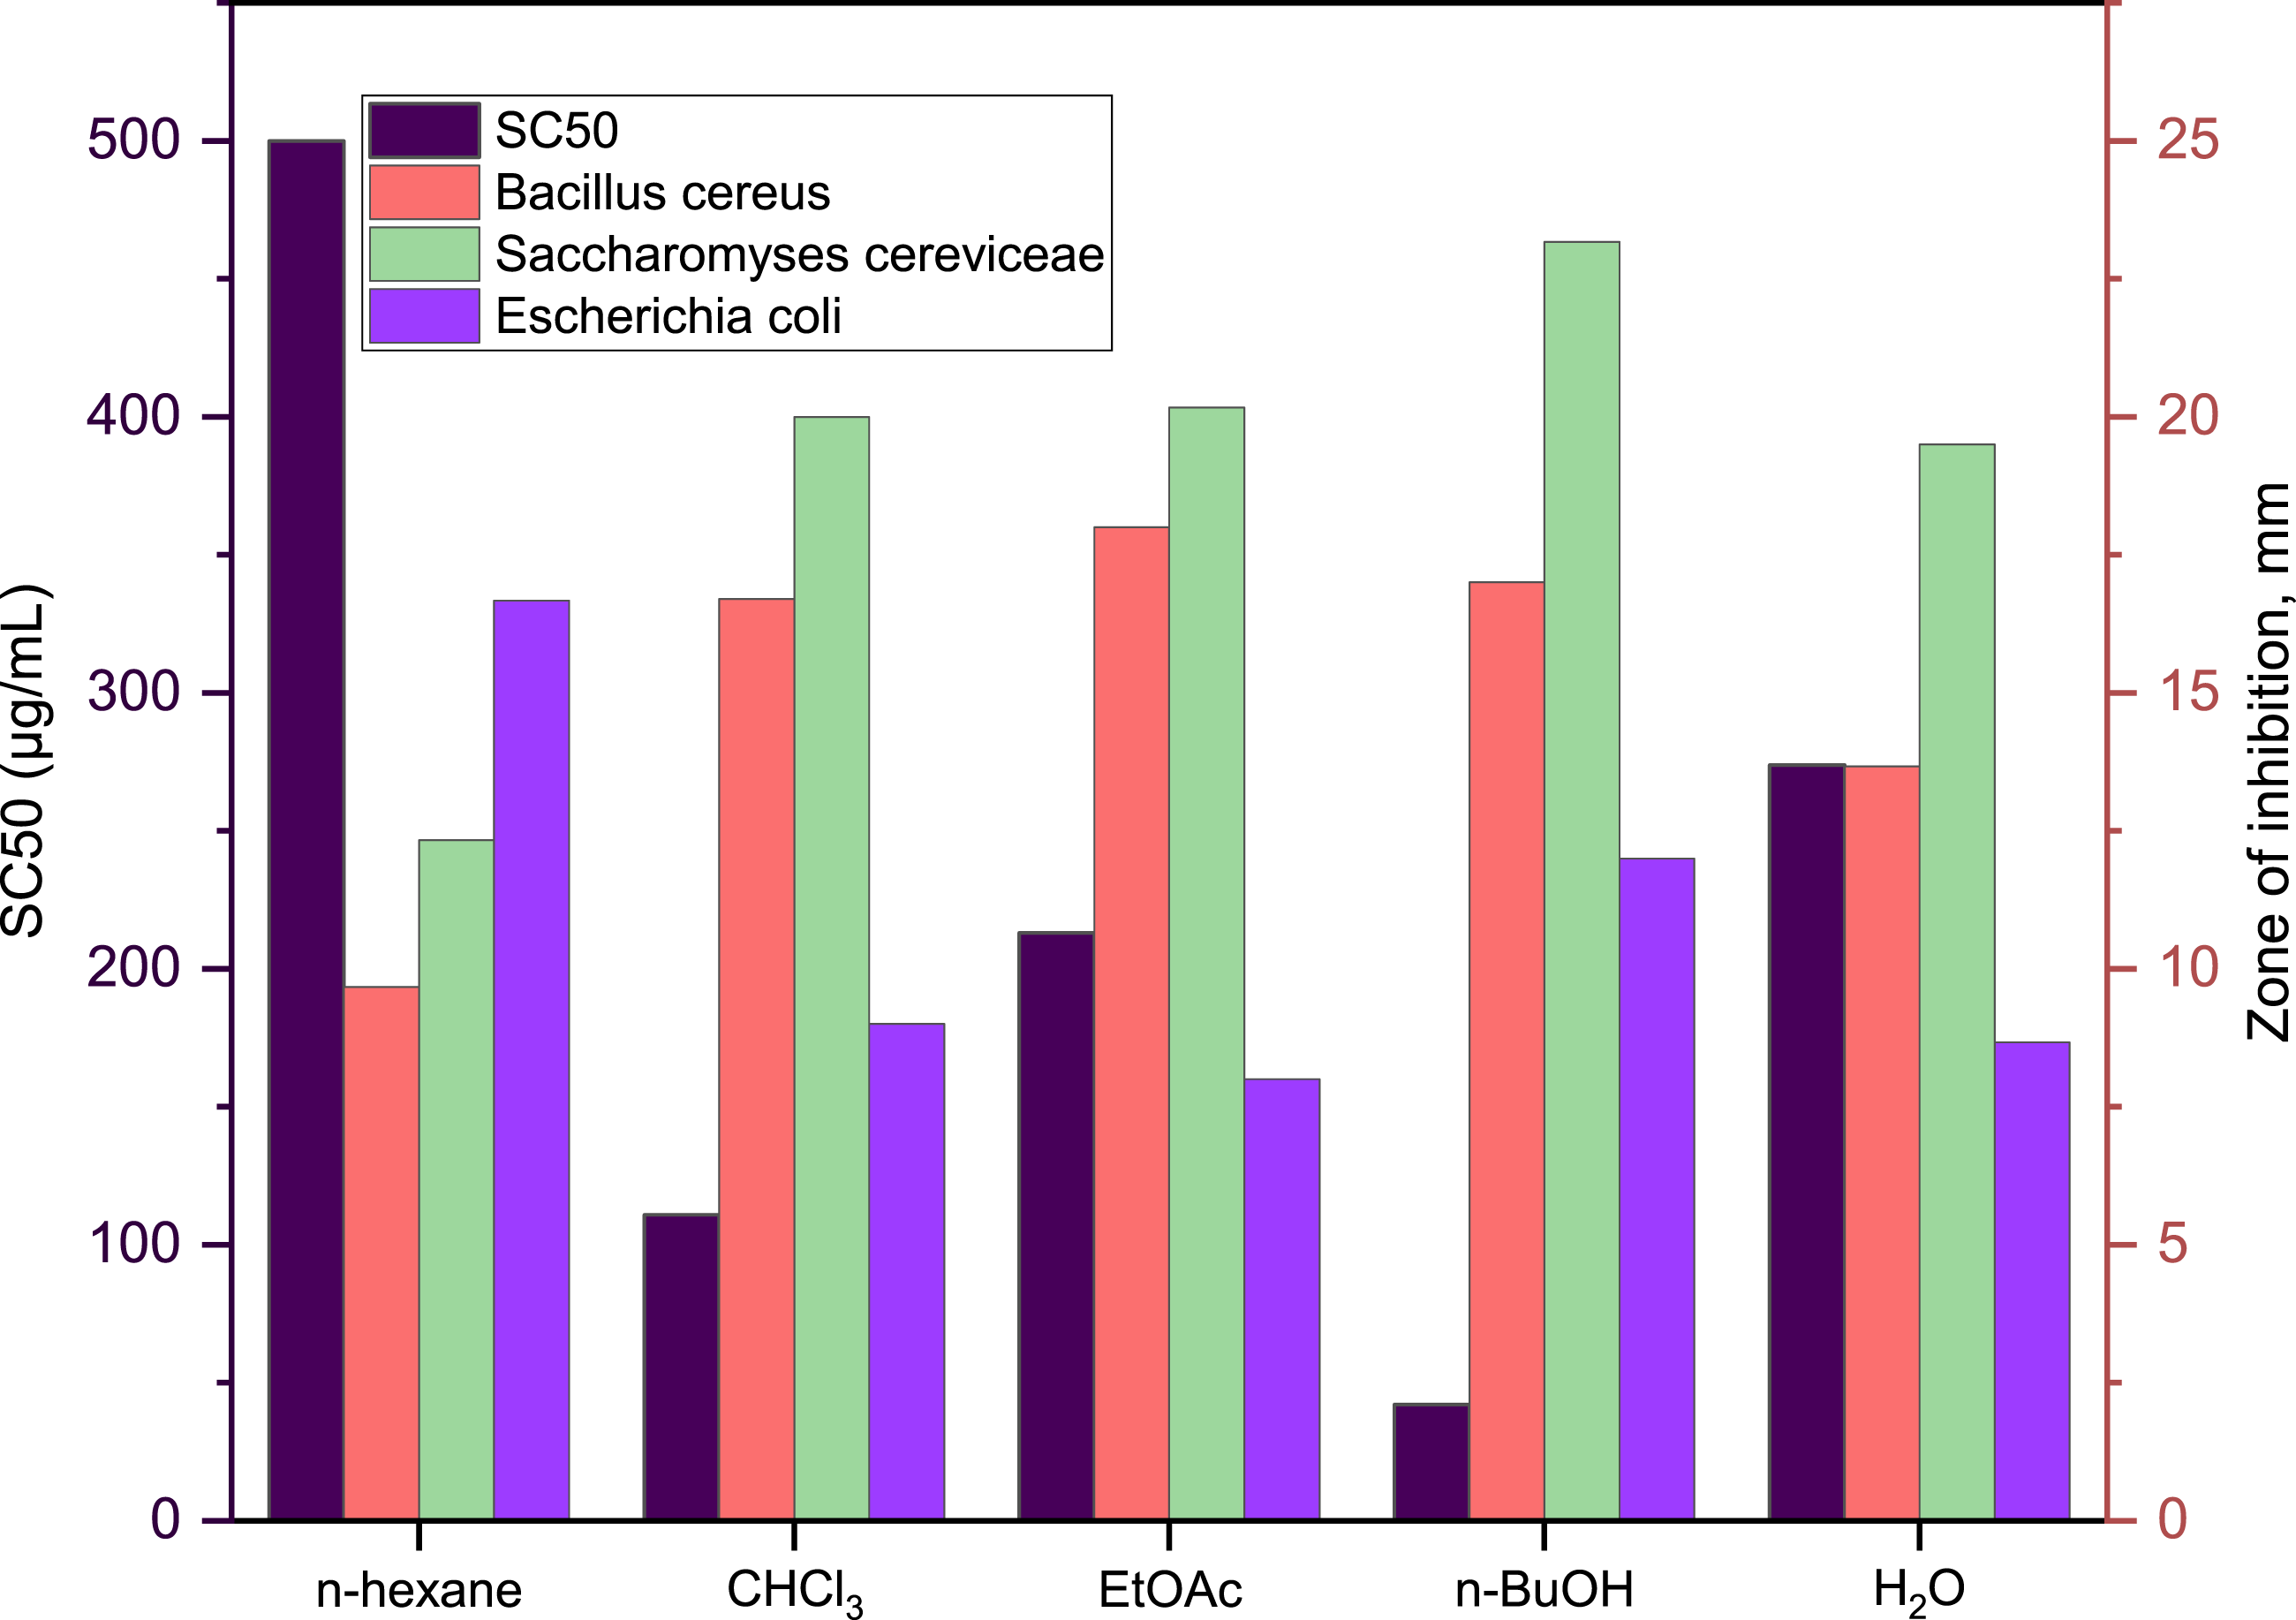
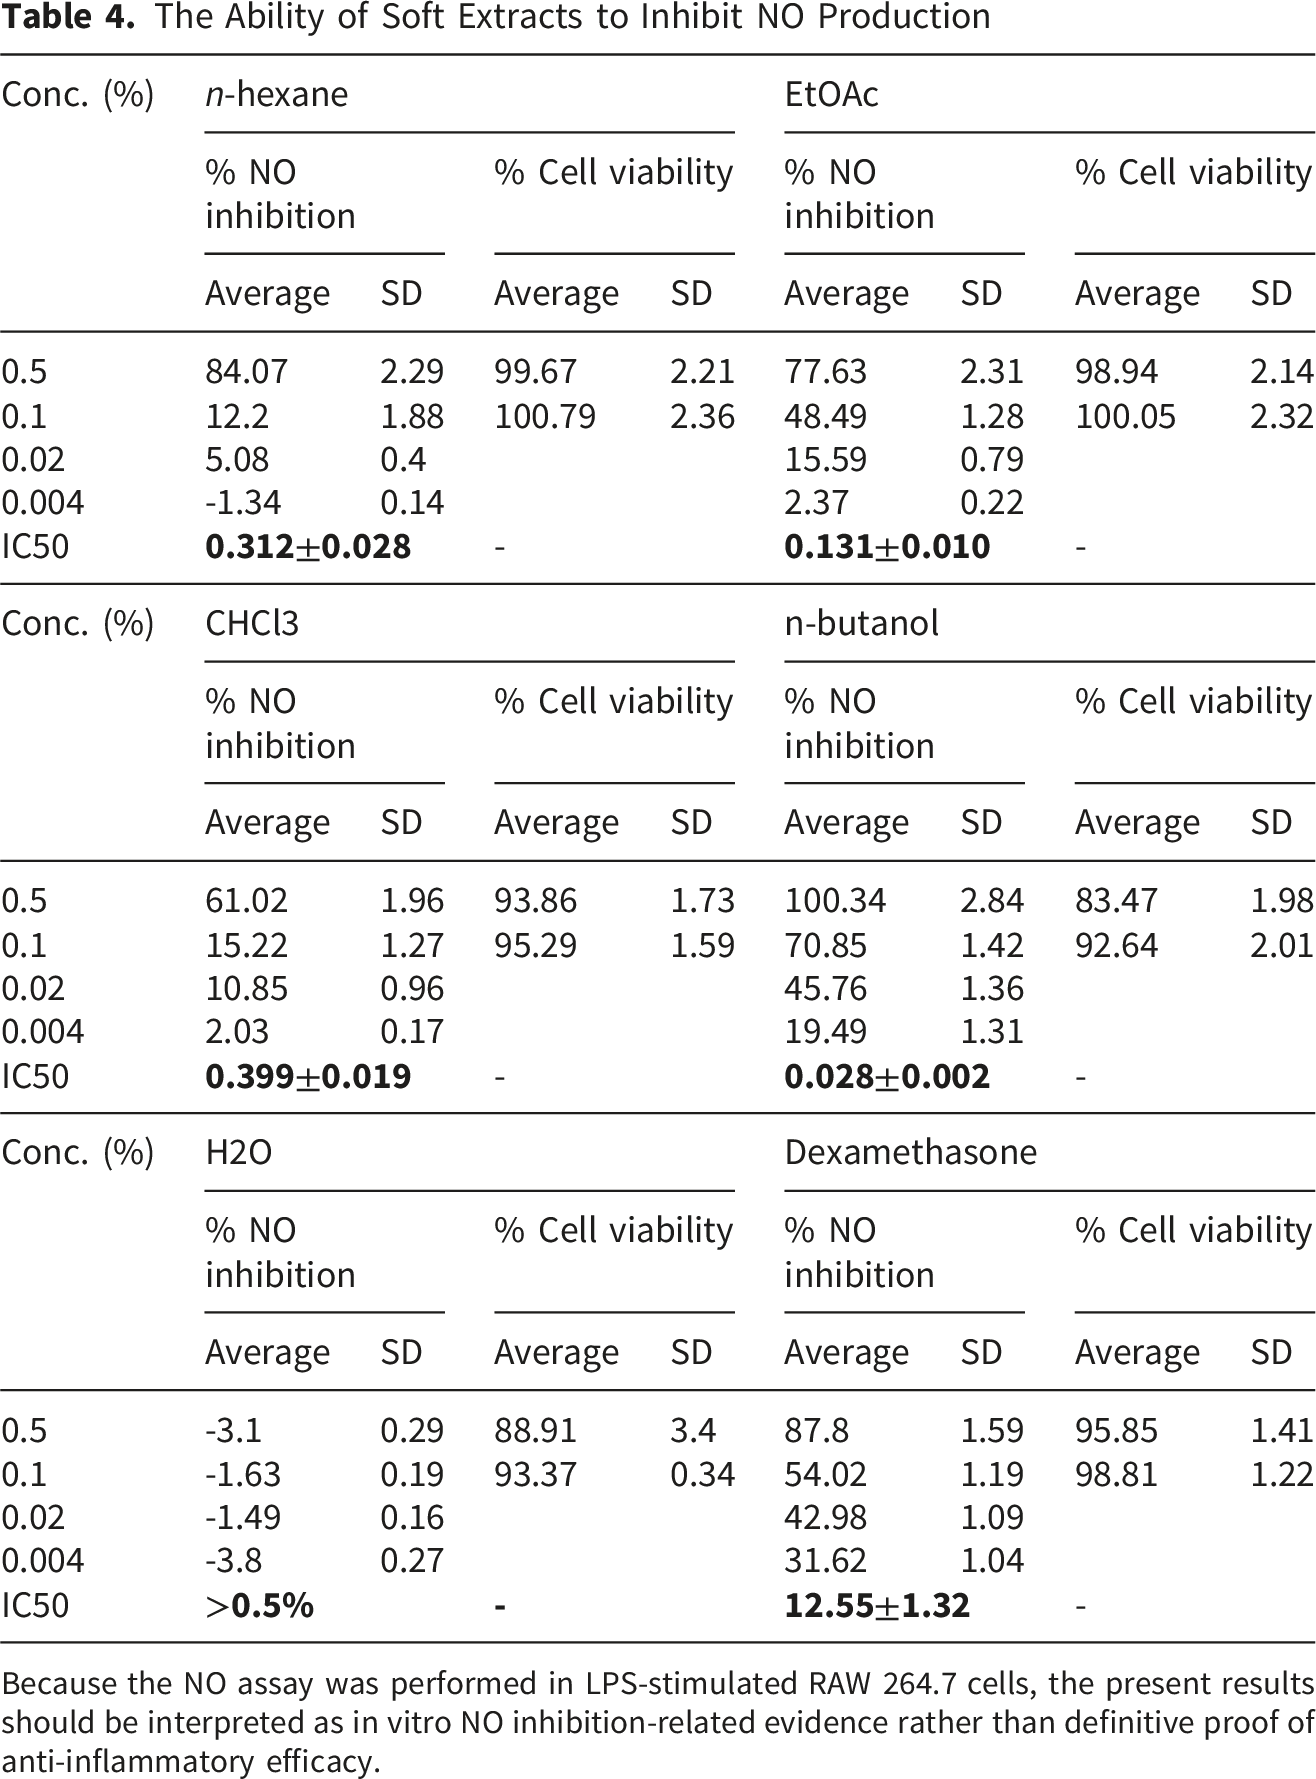
Among all tested fractions, the n-butanol fraction exhibited the strongest in vitro activity profile in the assays used in this study. This fraction showed the lowest SC50 (42.21 µg/mL) and IC50 (0.028%) for nitric oxide inhibition, as well as the most pronounced antimicrobial inhibition in the agar-well diffusion screening assay against Bacillus cereus, Escherichia coli, and Saccharomyces cerevisiae.
The ethyl acetate fraction exhibited moderate antioxidant and NO inhibition-related activity, with an SC50 of 213.05 µg/mL and an IC50 of 0.131%. It also showed selective antimicrobial activity, with stronger inhibition against Bacillus cereus and Saccharomyces cerevisiae than against Escherichia coli.
The aqueous fraction showed weak antioxidant and limited NO inhibition-related activity, with an SC50 of 273.85 µg/mL and an IC50>0.5%, although selective antimicrobial activity against E. coli was still observed. The chloroform fraction exhibited moderate antioxidant activity (SC50 = 110.89 µg/mL) and NO inhibition-related activity (IC50 = 0.399%), whereas the n-hexane fraction showed the weakest antioxidant activity (SC50 > 500.0 µg/mL) and limited overall bioactivity.
3.5. Isolation, Characterization, and Biological Activities of Phenolic Acids
3.5.1. Isolation and Structural Characterization of Phenolic Acids
Based on the HPLC, DPPH, and antibacterial analyses, the n-BuOH fraction rich in phenolic acids was used to isolate the main phenolic compounds. Reverse-phase column chromatography with solvent system Toluene: EtOAc: HCOOH = 5:5:0.5 obtained 3 main phenolic compounds with high content: Ferulic acid (FA), caffeic acid (CA), rosmarinic acid (RA). Phenolic compounds with significant content were isolated, and their structures were elucidated by IR, Raman, NMR spectroscopy (processed using MestReNova 14.2.1 software), and melting point (mp) measurement (presented in Figure S1-S4). Spectroscopic and HPLC analysis data (Figure S5-S7; Table S7-S9) demonstrated that the isolated phenolic compounds were of high purity.
3.5.2. Antioxidant and Antimicrobial Activities of Isolated Phenolic Acids
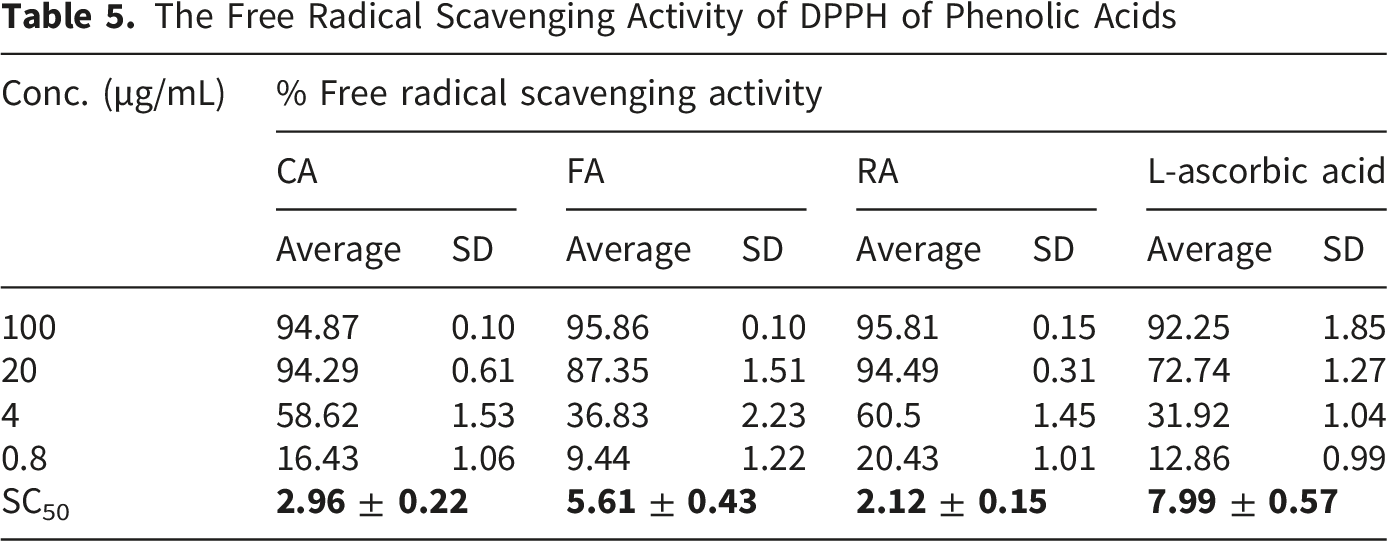
The Free Radical Scavenging Activity of DPPH of Phenolic Acids
Antibacterial Activity of Phenolic Acids

(D: diameter of the antibacterial zone, d: diameter of the 7 mm agar hole).
4. Discussion
4.1. Authentication and Material Quality
The combined macroscopic and microscopic analyses confirmed the botanical authenticity of the investigated plant material and established a useful pharmacognostic profile for H. foertherianum leaves. The presence of characteristic trichomes, vascular organization, and calcium oxalate crystals provides diagnostic features that may facilitate future identification and quality-control studies.
The measured moisture and ash values also provide baseline physicochemical parameters for raw material assessment. These data are relevant to extraction studies because the quality and consistency of the starting plant material can substantially influence extraction efficiency and reproducibility.
4.2. Efficiency of MUAE for Phenolic Acid Recovery
4.2.1. Effect of Extraction Parameters on Phenolic Acid Recovery
Binary aqueous-alcoholic solvent systems are commonly used for the non-destructive extraction of phenolic compounds from botanical matrices. 10 Literature indicates that alcohol concentrations between 30% and 80% generally optimize recovery efficiency.30-32 In these hydroalcoholic mixtures, the aqueous phase plays a vital role in causing the swelling of plant tissue, which increases the interfacial surface area and helps the diffusive transfer of polyphenols, such as rosmarinic acid, into the solvent mixture.33,34 The superior extraction performance of MUAE can be attributed to the synergistic effect of microwave heating and ultrasonic foaming during extraction. The efficiency of MUAE has proven its value as a green extraction method, as it allows for high phenolic recovery in relatively short processing times and with moderate solvent concentrations, which is essential for subsequent fractionation and isolation steps.17,35,36 Research by Hung et al 2 showed that MUAE maintained the maximum extraction efficiency of the conventional solvent maceration method while reducing extraction time and enhancing the recovery of rosmarinic acid from H. foertherianum leaves by 9-42% in other suboptimal solvent compositions, highlighting the practical advantages of this combined technique. The observed solvent effect is also consistent with the physicochemical properties of hydroxycinnamic acids. The highest extraction efficiency at 50% ethanol suggests that a balanced hydroalcoholic solvent system is required to provide both sufficient matrix swelling and favorable solubility for polar phenolic constituents.
In addition, the ANOVA results presented in the Table S1-S4 indicate that the effects of ethanol concentration, extraction time, and liquid-to-solid ratio on FA, CA, and RA recovery were predominantly nonlinear, with quadratic terms contributing more strongly than linear or interaction terms in most cases. This behavior suggests that increasing the extraction variables beyond the optimal region does not necessarily improve phenolic acid recovery and may, instead, reduce extraction performance due to saturation effects, solubility shifts, or partial degradation of labile compounds. Collectively, these findings support MUAE as an efficient approach for obtaining RA-rich phenolic fractions from H. foertherianum.
4.2.2. Distribution of Phenolic Acids Among Solvent Fractions
The fractionation pattern observed in this study clearly indicates that the major phenolic acids of H. foertherianum are concentrated predominantly in the n-butanol fraction. This result is consistent with the relatively high polarity of RA, CA, and FA, all of which contain hydroxyl and carboxyl groups that favor partitioning into moderately polar solvents. The marked enrichment of RA in the n-butanol fraction, together with the co-occurrence of CA and FA in the same fraction, suggests that n-butanol is the most suitable solvent among those tested for concentrating the principal phenolic acids of this plant. By contrast, the low phenolic content observed in the n-hexane and chloroform fractions indicates that these solvents preferentially extracted nonpolar or weakly polar constituents.
4.3. Biological Activities of the Extract Fractions
A clear relationship was observed between the phenolic composition of the fractions and their biological activities. The n-butanol fraction, which contained the highest proportion of phenolic acids and was particularly enriched in RA, exhibited the strongest antioxidant, anti-inflammatory (NO inhibition in LPS-stimulated RAW 264.7 cells), and antimicrobial effects. These findings suggest that the biological profile of the n-butanol fraction is associated with its enrichment in phenolic constituents. The polyphenolic constituents, including hydroxycinnamic acid derivatives, exert their multifunctional bioactivity through efficient DPPH radical scavenging via hydrogen-atom abstraction, suppression of NF-κB signaling pathways for anti-inflammatory effects, and disruption of bacterial cell membrane integrity via multiple synergistic antimicrobial mechanisms.37-41
The ethyl acetate fraction displayed moderate antioxidant, measurable NO inhibition-related activity, and selective antimicrobial activity in the screening assay. Accordingly, the constituents enriched in the EtOAc fraction appeared to contribute less strongly to the measured in vitro activities than those concentrated in the n-butanol fraction. This differential antimicrobial susceptibility pattern may be related, at least in part, to differences in microbial cell envelope structure.42,43
The aqueous fraction exhibited weak antioxidant activity and limited NO inhibition-related activity, yet retained some antimicrobial activity in the screening assay. This may indicate that the aqueous fraction mainly contains highly polar constituents with relatively limited free radical-scavenging capacity under the assay conditions used.39,44-46
The chloroform and n-hexane fractions showed the lowest overall in vitro activity among the tested fractions. These reduced biological activities reflect preferential extraction of non-polar lipophilic compounds (fatty acids, hydrocarbons, terpenoids) lacking hydroxyl functional groups necessary for efficient DPPH radical scavenging. The relatively low phenolic content of the chloroform and n-hexane fractions is consistent with their weaker activities in the assays performed. 47
This pattern suggests that phenolic acid enrichment is an important contributor to the biological activity of the extract fractions. The antioxidant effect of the n-butanol fraction is consistent with the known radical-scavenging capacity of hydroxycinnamic acid derivatives. Likewise, its nitric oxide-inhibitory activity suggests the presence of constituents that reduce NO production in LPS-stimulated RAW 264.7 cells. However, further mechanistic evidence is required before inferring a broader anti-inflammatory effect.
4.4. Biological Activities of Phenolic Acids
The three phenolic acids exhibited high DPPH free radical scavenging capacity (Table 5), outperforming L-ascorbic acid across most concentrations (0.8–100 μg/mL). RA achieved the lowest SC50 (2.12 μg/mL), followed by CA (2.96 μg/mL) and FA (5.61 μg/mL), indicating superior efficacy for RA. Scientific literature corroborates that phenolic acids such as caffeic acid (CA) and ferulic acid (FA) possess robust antioxidant properties attributable to hydroxyl and methoxy groups, enabling ROS scavenging and lipid peroxidation inhibition.48,49
Agar well diffusion assays (Table 6) revealed RA producing the largest inhibition zones against Bacillus cereus, Escherichia coli, and Saccharomyces cerevisiae, exceeding those observed for CA and FA. These compounds were effective against both Gram-positive and Gram-negative strains, with RA and CA particularly potent against S. cerevisiae and E. coli.
Taken together, these findings demonstrate that the biological activities of the extract fractions from H. foertherianum leaves were closely associated with the degree of phenolic acid enrichment, particularly with the abundance of RA. The n-BuOH fraction provides the clearest illustration of this relationship, as it was the richest fraction in RA, CA, and FA and simultaneously exhibited the strongest antioxidant activity, NO inhibition-related activity, and antimicrobial inhibition in the screening assay. It can therefore be reasonably inferred that the three isolated phenolic acids, especially RA and, to a lesser extent, CA, are the principal contributors to the biological activities of H. foertherianum leaf extract. In contrast, FA may play a supportive or complementary role in the overall activity of the polyphenol-rich fraction.
5. Limitations
The research presented was limited to H. foertherianum leaves collected from a single geographic source and to in vitro bioactivity assays. Further in vivo validation and broader phytochemical profiling are required to strengthen the biological significance of these findings.
6. Conclusion
In conclusion, this study successfully demonstrated that microwave-ultrasound-assisted extraction (MUAE) is an efficient “green extraction” method for recovering bioactive phenolic compounds from H.foertherianum leaves. Optimization studies established optimal extraction conditions (50% ethanol, 1:15 liquid-to-solid ratio, 40 minutes), yielding the highest phenolic acid concentration (8.356 mg/g), with rosmarinic acid as the predominant component. The n-butanol fraction exhibited the strongest in vitro antioxidant activity, NO inhibition in LPS-stimulated RAW 264.7 cells, and antimicrobial inhibition in the agar-well diffusion screening assay among the tested fractions. These results highlight the novelty and practical value of MUAE as a green, efficient approach for producing phenolic acid-rich extracts from H. foertherianum and indicate that this plant is a promising source of phenolic compounds for further investigation.
Supplemental Material
Supplemental Material -Microwave-Ultrasound Assisted Extraction and Characterization of Phenolic Compounds From Heliotropium foertherianum: Optimization, Isolation, and Biological Activity Evaluation
Supplemental Material for Microwave-Ultrasound Assisted Extraction and Characterization of Phenolic Compounds From Heliotropium foertherianum: Optimization, Isolation, and Biological Activity Evaluation by Pham Kien Cuong Vu Van Dung Vu Ngoc Doan Doan Tuan Dat Nguyen Thi Kim Giang, Vu Quang Hung and Nguyen Thi Huong in Natural Product Communications.
Footnotes
Acknowledgement
The authors thank their host institutions for providing laboratory facilities and technical support.
Author Contributions
Pham Kien Cuong: methodology, investigation, data curation, conceptualization, project administration, writing - original draft, review & editing. Vu Van Dung: extraction, isolation, HPLC analysis, and biological activity experiment. Vu Ngoc Doan: methodology, investigation. Doan Tuan Dat: experiment, extraction, isolation. Nguyen Thi Kim Giang: data curation, conceptualization. Vu Quang Hung: conceptualization, extraction, and analysis of spectroscopy. Nguyen Thi Huong: methodology, conceptualization.
Funding
The authors disclosed receipt of the following financial support for the research, authorship, and/or publication of this article: The authors appreciate financial support from the research grant of the Vietnam Ministry of Defence (No. 26/2025/HDKHCN).
Declaration of Conflicting Interests
The authors declared no potential conflicts of interest with respect to the research, authorship, and/or publication of this article.
Supplemental Material
Supplemental material for this article is available online.
References
Supplementary Material
Please find the following supplemental material available below.
For Open Access articles published under a Creative Commons License, all supplemental material carries the same license as the article it is associated with.
For non-Open Access articles published, all supplemental material carries a non-exclusive license, and permission requests for re-use of supplemental material or any part of supplemental material shall be sent directly to the copyright owner as specified in the copyright notice associated with the article.