






Abstract
Objective
In order to enhance the application value of polyphenolic compounds in Pu’er tea flowers, the extraction methods and physiological activities of these compounds were studied.
Methods
Ultrasonic-assisted extraction was utilized to isolate polyphenolic compounds from Pu’er tea flowers, and the extraction process was systematically optimized using response surface methodology (RSM).
Results
The optimal conditions were determined as follows: ethanol concentration of 55%, solid-liquid ratio of 1:45 (g/mL), extraction temperature of 55 °C, extraction time of 90 min, and ultrasonic power of 480 W. Under these optimal conditions, the total polyphenol yield reached 4.95±0.08 mg/g. The extracted polyphenols exhibited notable in vitro bioactivities. They demonstrated strong antioxidant capacity, with IC50 values of 0.068 mg/mL for DPPH• scavenging and 0.093 mg/mL for ABTS•+ scavenging. In addition, the polyphenols showed significant hypoglycemic potential via inhibition of α-glucosidase, with an IC50 value of 0.73 mg/mL. Moreover, their hypolipidemic effect was evidenced by bile salt binding capacity, with IC50 values of 2.49 mg/mL for sodium taurocholate and 4.40 mg/mL for sodium glycocholate.
Conclusion
In summary, polyphenols derived from Pu’er tea flowers possess remarkable antioxidant, hypoglycemic, and hypolipidemic properties. These findings highlight their potential as a multi-functional natural ingredient for use in functional foods and nutraceuticals, supporting further development and value-added utilization of Pu’er tea flowers.
Keywords
1. Introduction
Pu’er tea(Camellia sinensis var. assamica) is the most famous tea in China. Because its special processing, the Pu’er tea is fermented by traditional technology in long-distance transport by horse-drawn caravans.
1
Pu’er tea originated in Yunnan Province, China, and has long been one of the most popular beverages in Asia.
2
Research over the past few decades has shown that Pu’er tea has a wide range of health benefits, including the ability to lower blood sugar levels,3,4 as well as improving symptoms of type 2 diabetes and inhibiting the progression of the disease.
5
Pu’er tea flowers (Camellia sinensis var. assamica flower) is the reproductive organ of the tea plant and blooms abundantly in autumn each year. In traditional tea production processes, the tea flower is often regarded as a competitor for nutrients with the tea leaves, and to prevent it from affecting the sub-sequent spring tea yield, it is usually removed and discarded in the tea garden during the production period. However, preliminary studies in recent years have shown that the Pu’er tea flowers is not an insignificant by-product. Pu’er tea flowers are known as the “essence of tea trees”, and their main components include cellulose, proteins, amino acids, alkaloids, tea polyphenols, vitamins, etc.6,7(Figure 1). Tea polyphenols are a general term for polyphenolic substances in tea, mainly including flavanones (catechins), flavonoids, anthocyanins, phenolic acids, and condensed phenolic acids. Among them, flavanones are unique components in tea flowers and the main component of tea polyphenols, accounting for 60 - 80% of the total tea polyphenols, mainly including catechin (EC), epigallocatechin (EGC), catechin gallate (ECG), and epigallocatechin gallate (EGCG).8-12 Tea polyphenols have obvious pharmacological functions such as lipid-lowering and weight loss, reducing blood glucose, blood lipids and cholesterol, anti-aging, eliminating excess free radicals in the human body, preventing cardiovascular diseases, and inhibiting tumors.13-17 They have important applications in food processing, medicine, daily chemical industry and other fields.18-22 Tea flowers and tea leaves have similar components and also have important research value. Pu’er tea flowers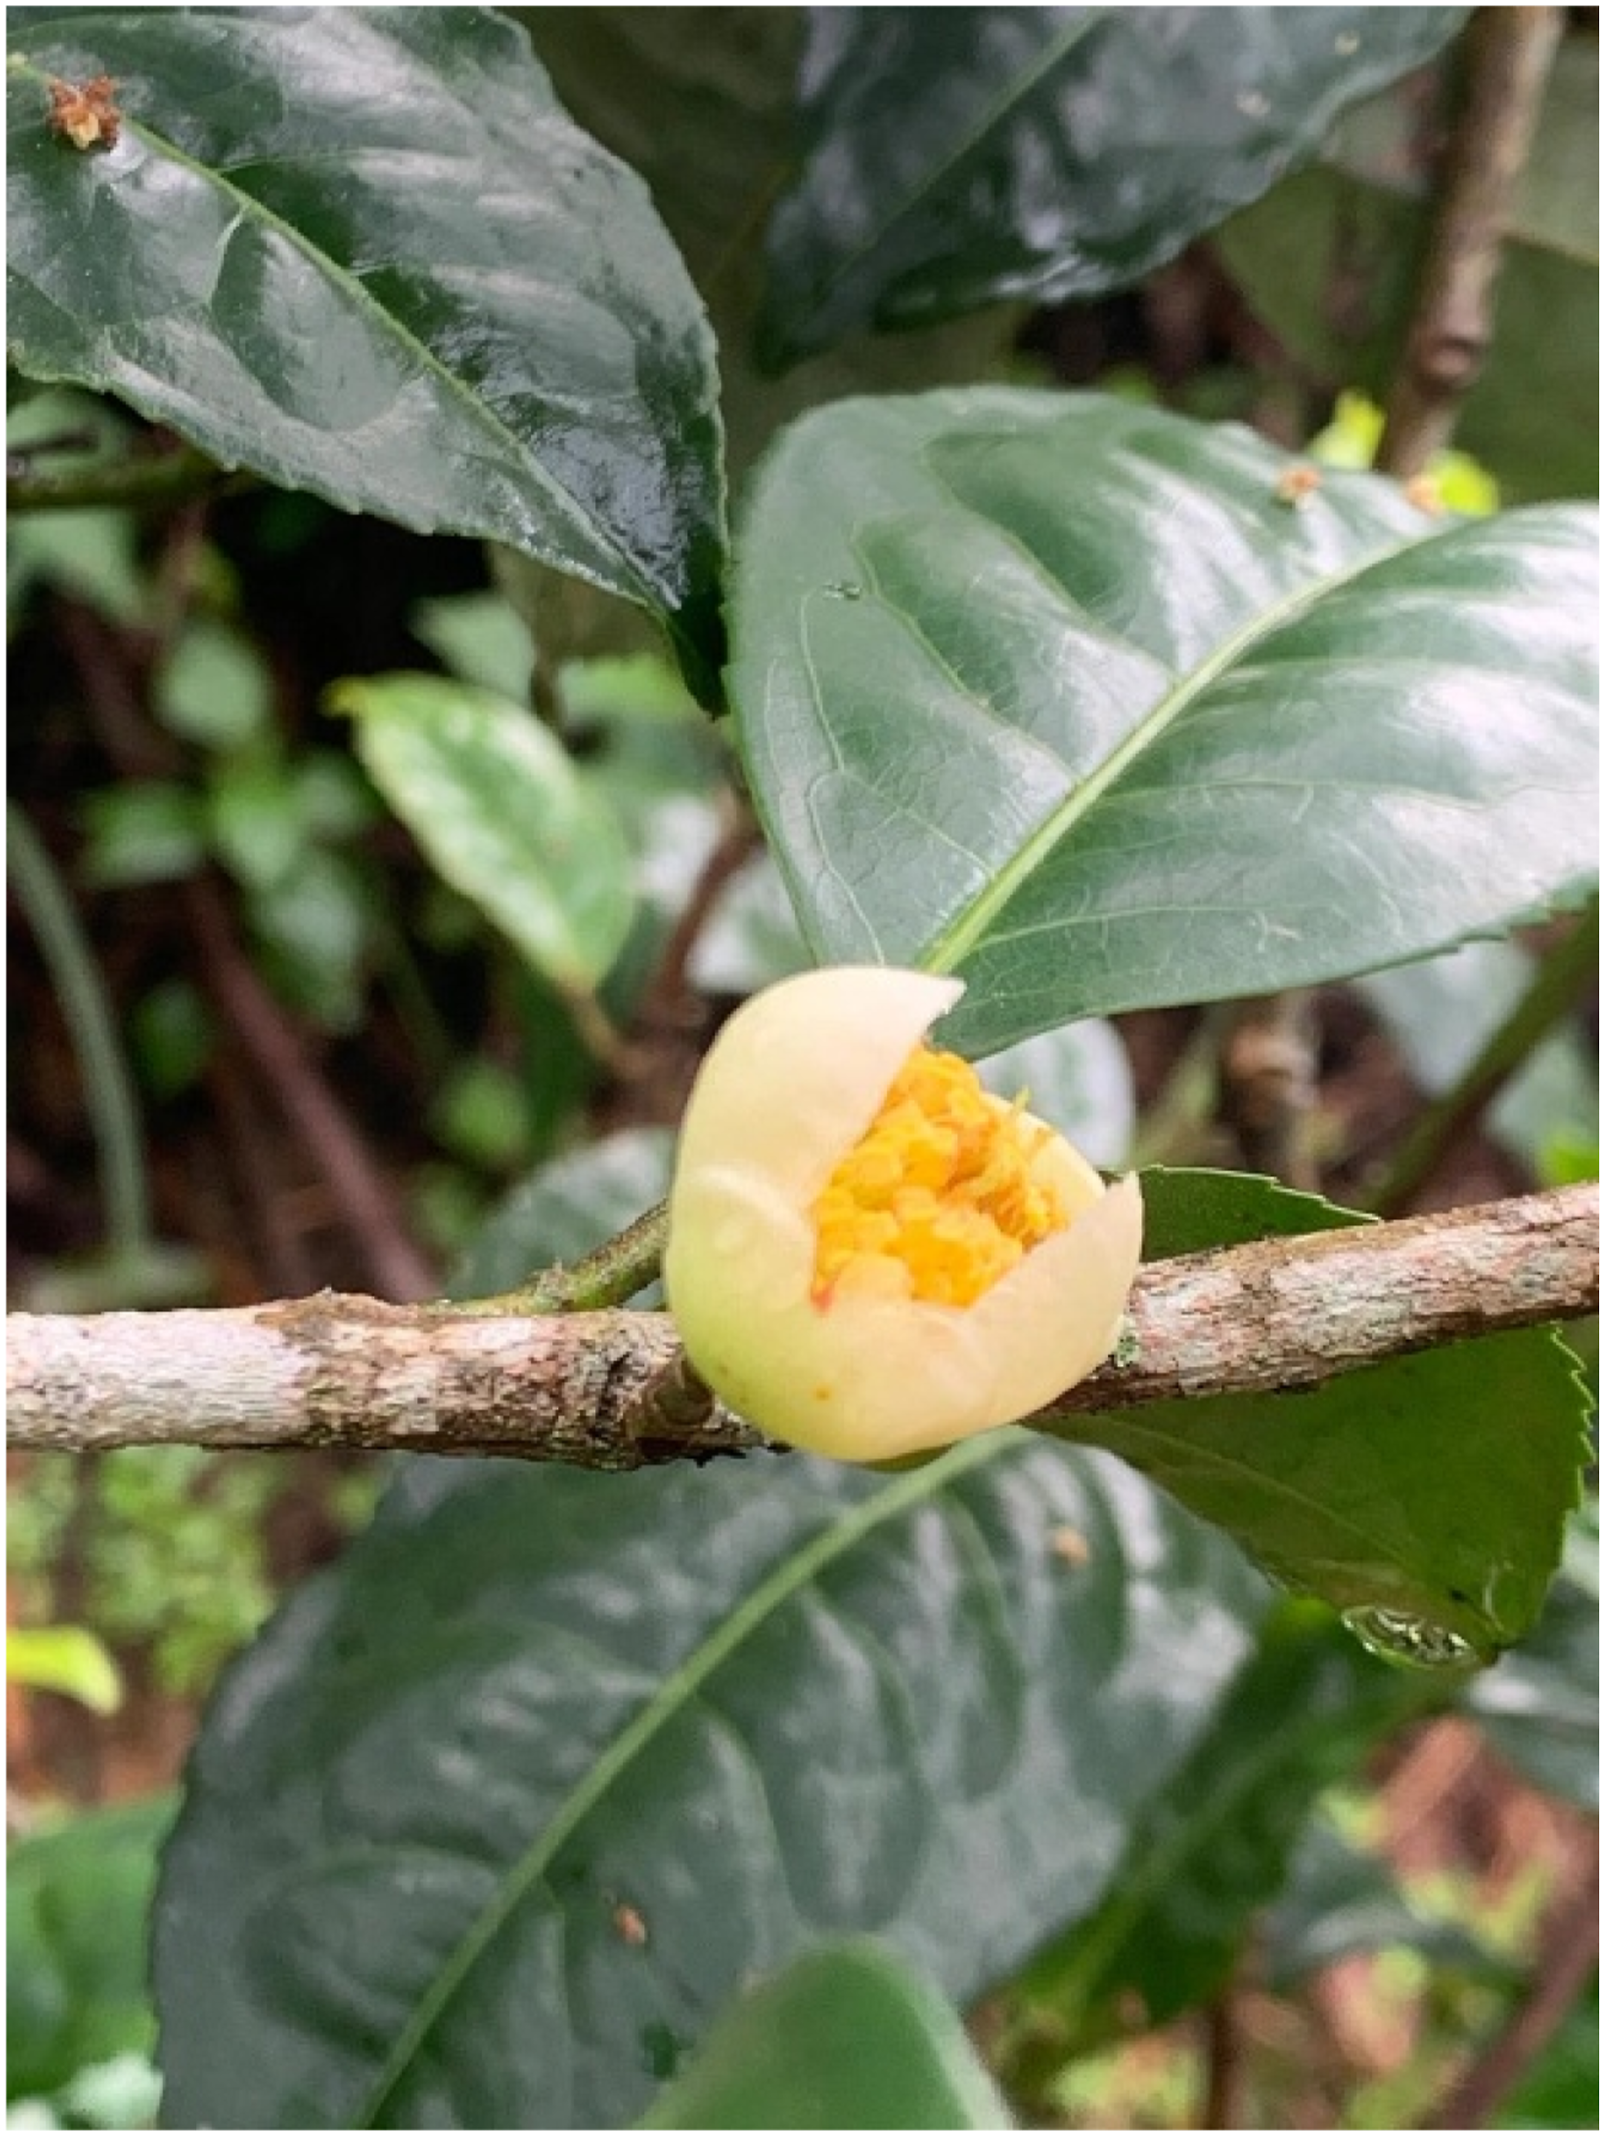
At present, the main extraction methods for phenolic substances are traditional methods, such as solvent extraction, reflux extraction, and supercritical extraction.23-26 Ultrasonic-assisted extraction utilizes the principles of ultrasonic cavitation, thermal effect, and mechanical effect. It has the characteristics of rapidity, high efficiency, and low energy consumption. Meanwhile, ultrasonic extraction does not destroy the structure of substances, and its thermal effect has a water bath effect, which improves the extraction rate of raw materials. It is a commonly used method for extracting active molecules from natural products.27-29 Compared with conventional extraction technologies, this auxiliary extraction technique also features simple operation and mild reaction conditions, which is well suited for the separation and enrichment of heat-sensitive natural active ingredients.
Polyphenols extracted from black tea, green tea, and hawthorn tea have been studied for their antioxidant and antibacterial properties.13,30 Relevant findings have fully confirmed that tea polyphenols are important functional components endowing tea products with excellent biological activities. Due to the fact that Pu’er tea flowers have received less research attention than Pu’er tea, there are no reports on the extraction of polyphenols from Pu’er tea flowers. This unexplored area greatly limits the comprehensive development and high-value utilization of Pu’er tea flower resources. In this study, ultrasonic-assisted extraction was used to extract polyphenols from Pu’er tea flowers,14,31,32 and the response surface methodology was used to optimize the extraction process and evaluate its bioactivity, in order to enhance the application value of polyphenolic compounds in Pu’er tea flowers and lay a theoretical foundation for the subsequent ap-plication of Pu’er tea flowers polyphenols in food processing and pharmacological fields(Figure 2). The extraction process scheme diagram of polyphenols from Pu’er tea flowers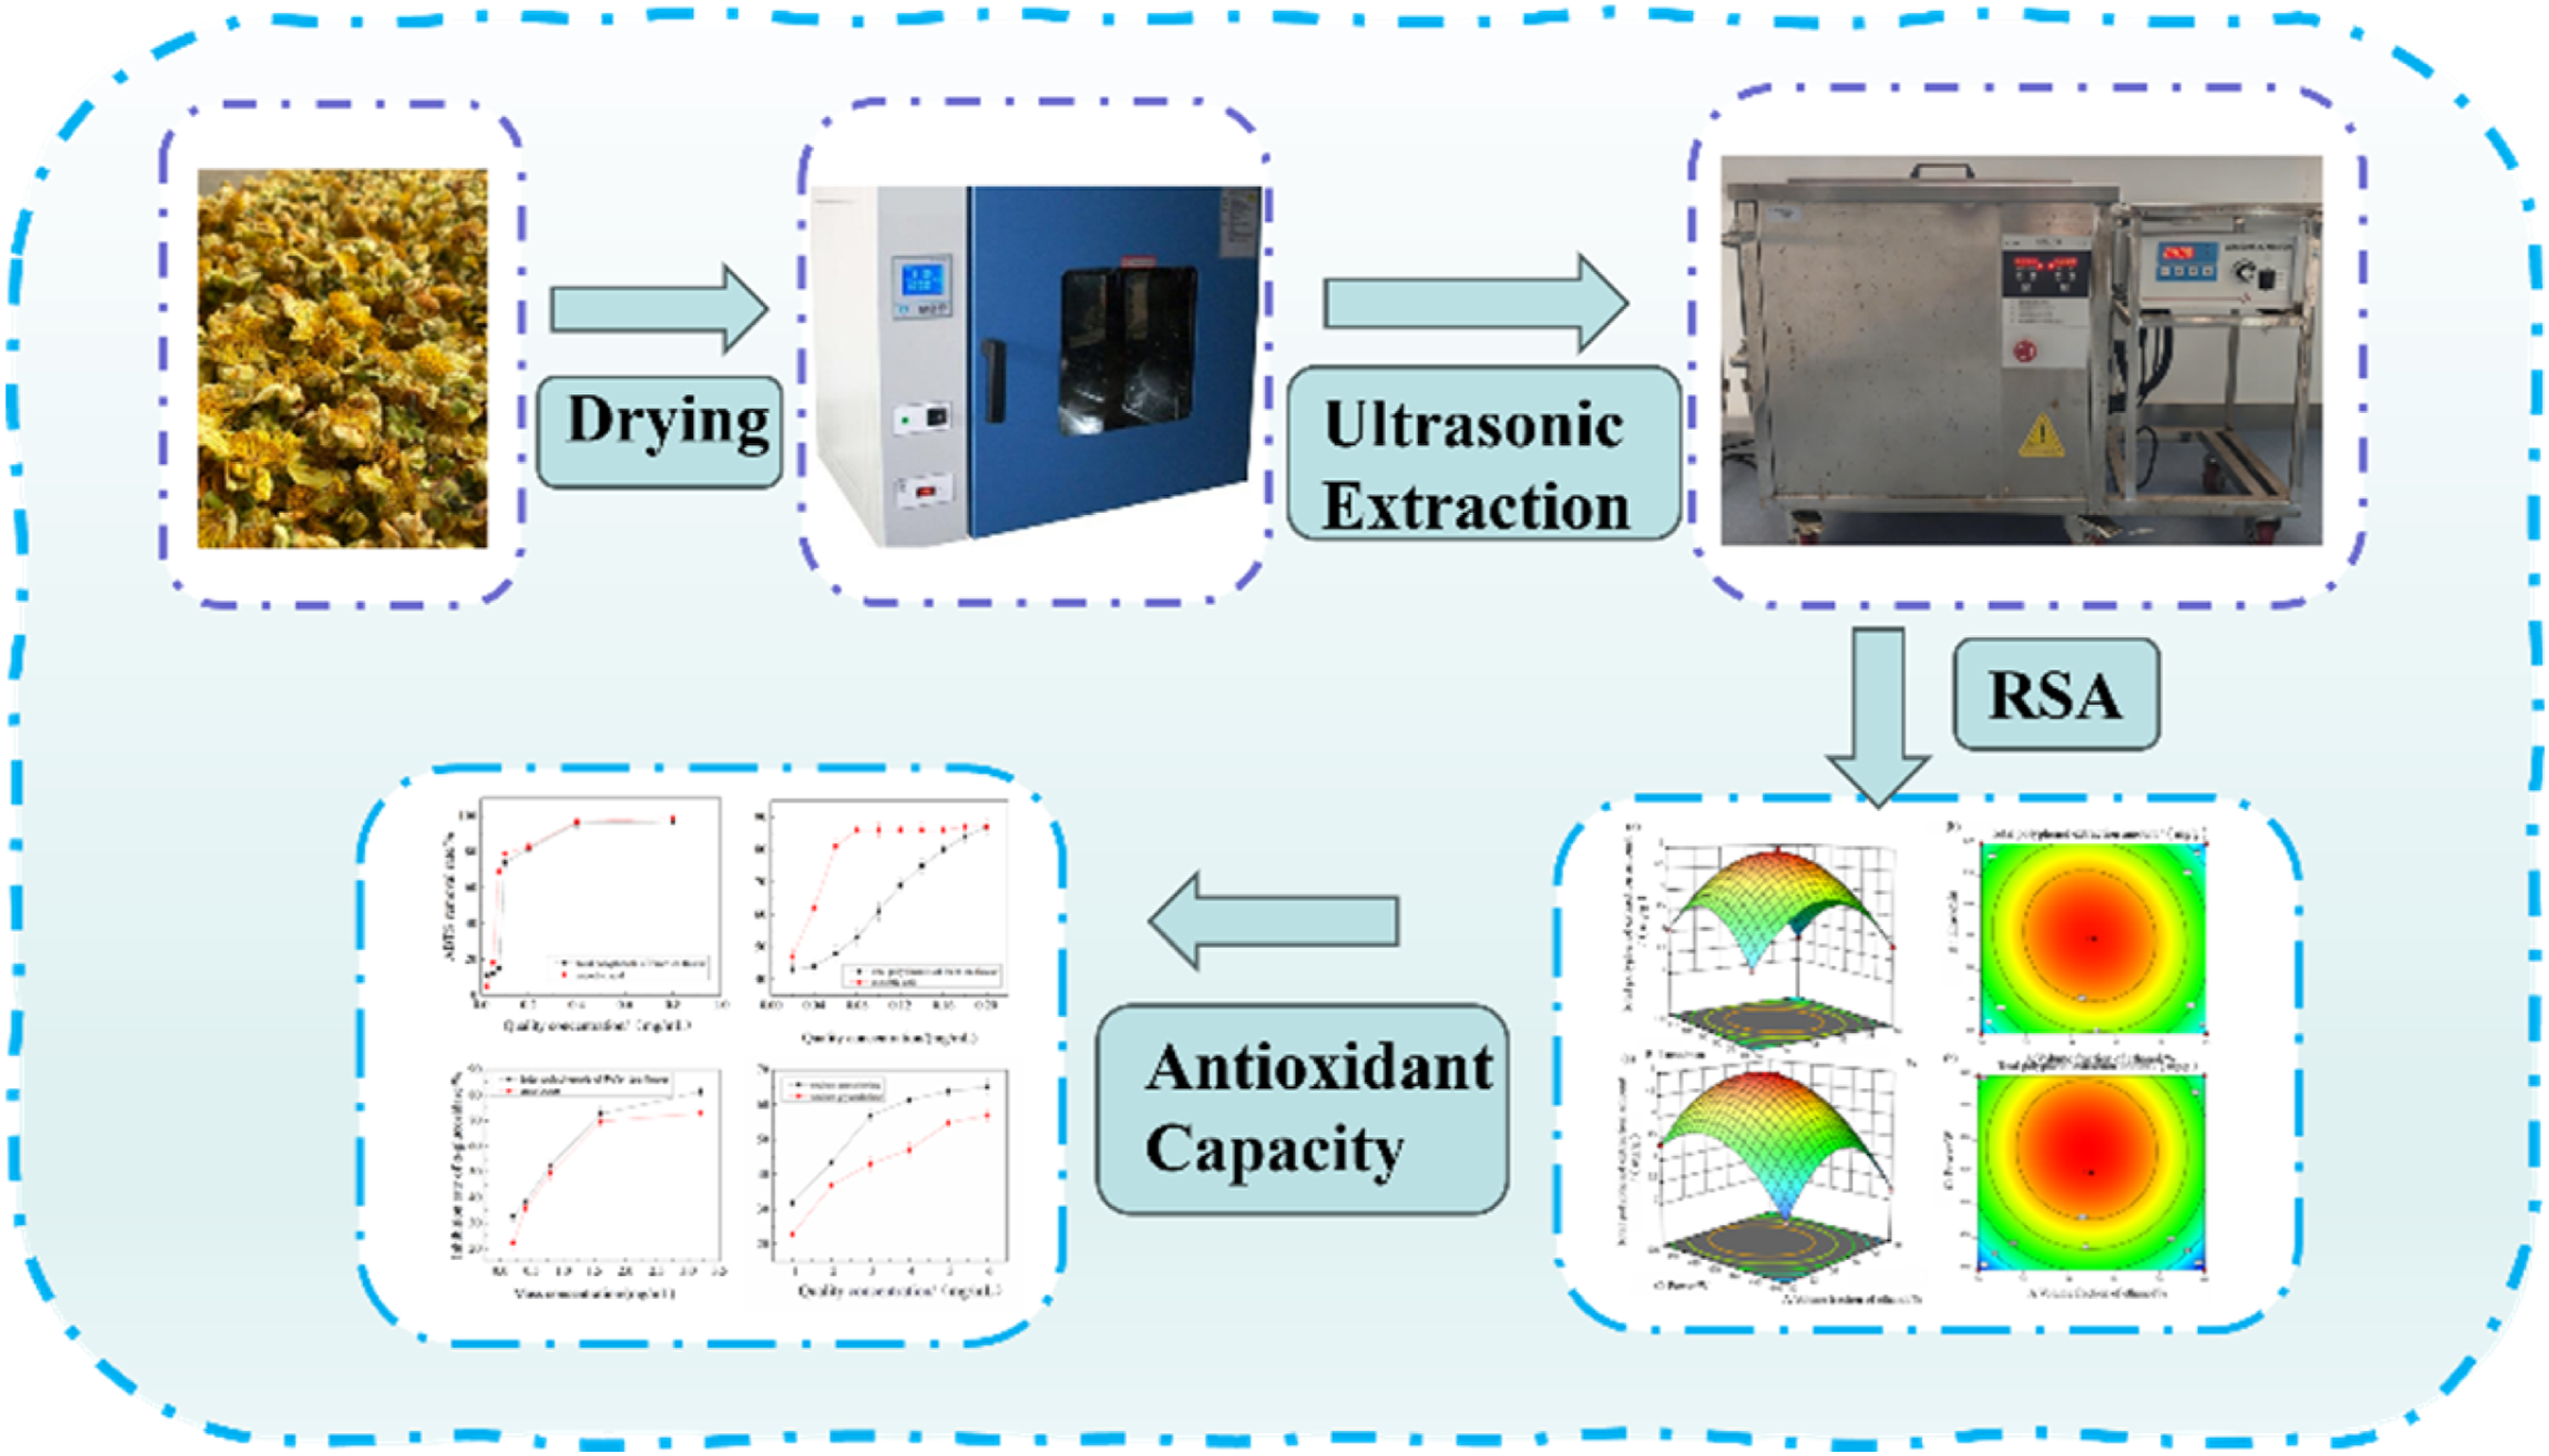
2. Materials and Methods
2.1. Materials and Reagents
Natural Pu’er tea flowers, dried, crushed, and sieved for later use, from Pu’er City, Yunnan Province; gallic acid (purity > 98%), PNPG (99%), acarbose hydrate, from Shanghai Macklin Technology Co., Ltd.; absolute ethanol (analytical grade), from Tianjin Fuchen Chemical Reagent Co., Ltd.; anhydrous sodium carbonate, ascorbic acid, ferrous sulfate, potassium persulfate (all analytical grade), from Tianjin Guangfu Technology Development Co., Ltd.; Folin-Ciocalteu reagent, 1,1-diphenyl-2-picryl-hydrazyl radical (DPPH•), 2,2′-azino-bis(3-ethylbenzothiazoline-6-sulfonate) radical cation (ABTS•) (all analytical grade), from Fuzhou Feijing Biotechnology Co., Ltd.; salicylic acid, hydrochloric acid (all analytical grade), from Sinopharm Chemical Reagent Co., Ltd.; α-glucosidase (analytical grade), from Shanghai Yuanye Biotechnology Co., Ltd.; Phosphate Buffered Saline (PBS) (chromatographic grade), from Liaoning Quanrui Reagent Co., Ltd.; sodium taurocholate, sodium glycocholate, from Shanghai Macklin Biotechnology Co., Ltd.
2.2. Instruments and Equipment
TU-1950 double-beam UV-visible spectrophotometer, from Beijing Puxi General Instrument Co., Ltd.; SHB-IIIS circulating water multi-purpose vacuum pump, from Zhengzhou Great Wall Scientific Industrial and Trade Co., Ltd.; 101-1AB electric blast drying oven, from Shanghai Yarong Biochemical Instrument Factory; RE-52C rotary evaporator, from Shanghai Yarong Biochemical Instrument Factory; DLSB-5L/25 low-temperature cooling liquid circulation pump, from Gongyi Yuhua Instrument Co., Ltd.; AL-204 electronic analytical balance, from Shenyang Lisite Instrument Co., Ltd.; HH-2 constant temperature water bath, from Changzhou Guohua Electric Appliance Co., Ltd.; FR120 ultrasonic cleaner, from Shenzhen Fuyang Technology Group Co., Ltd.
2.3. Experimental Methods
2.3.1. Extraction Process of Total Polyphenols from Pu’er Tea Flowers
Ethanol was chosen as the extraction solvent for this work due to its low toxicity and its wide application in biomedicine and food production. Accurately weigh 1.00 g of dried Pu’er tea flowers powder into a beaker, add 55% (v/v) ethanol solution ac-cording to a solid-liquid ratio of 1:40 (g:mL), and seal the beaker. Extract at an extraction temperature of 50 °C, ultrasonic frequency of 40 kHz, and ultrasonic power of 500 W for 125 min. After cooling to room temperature, suction filtration was performed, and ethanol was removed by rotary evaporation at 45 °C. The extract was diluted to 100 mL with distilled water, stored in the dark and sealed for later use, and the Pu’er tea flowers polyphenol extract was obtained.
2.3.2. Determination of Total Polyphenol Extraction Yield from Pu’er Tea Flowers
The gallic acid standard was prepared into a dilute solution of 0.02-0.10 mg/mL, then 5 mL of 10% Folin-Ciocalteu reagent was added, and after standing for 5 min, 4.00 mL of 7.5% sodium carbonate solution was added, and the volume was adjusted to 10 mL in a volumetric flask. The reaction was carried out in the dark at room temperature for 60 min. After color development, the absorbance value of the gallic acid standard solution was measured at a wavelength of 753 nm. Taking the mass concentration of gallic acid (x) as the abscissa and the absorbance value (y) as the ordinate, a standard curve was drawn, and the regression equation of the standard curve was obtained: y=10.187x+0.0011, R2=0.9994, indicating that the mass concentration of gallic acid had a good linear relationship in the range of 0.02-0.10 mg/mL.33,34
Determination of total polyphenol extraction yield: Accurately pipette 1.00 mL of the total polyphenol extract and dilute it to 10 mL with distilled water. Accurately pipette 1.00 mL of the diluted solution into a 10 mL volumetric flask, add reagents such as Folin-Ciocalteu according to the standard curve drawing method, then measure the absorbance value. Calculate the mass concentration of total polyphenols according to the regression equation of the standard curve, and calculate the total polyphenol extraction yield according to Formula (1):

In the formula, C is the mass concentration of Pu’er tea flowers polyphenols, mg/mL; V1 is the volume of the polyphenol solution, mL; N is the dilution multiple; W is the mass of the sample, g.
2.4. Determination of Antioxidant Capacity
Determination of DPPH• scavenging capacity: Refer to the experimental method of Xu et al
35
Prepare a 0.1 mmol/L DPPH solution with absolute ethanol. Pipette 100 μL of the sample and 100 μL of the DPPH solution into a test tube, vortex thoroughly to mix, incubate in the dark for 30 minutes, and then measure the absorbance at 517 nm. Calculate according to Formula (2). Determination of ABTS• scavenging capacity: Refer to the experimental method in the literature by XU et al
36
with slight modifications. Mix ABTS solution (7 mmol/L) with potassium persulfate solution (2.45 mmol/L) in equal proportions, incubate at room temperature in the dark overnight. On the following day, dilute the mixed solution with absolute ethanol until the absorbance at 734 nm reaches 0.7±0.02 to obtain the ABTS working solution. Pipette 200 μL of the sample into a test tube, add 4 mL of the ABTS working solution, vortex thoroughly to mix, incubate at 30 °C in the dark for 20 minutes, and measure the absorbance at 734 nm. Calculate according to Formula (2):

A0 is the absorbance of the blank group; A1 is the absorbance when Replace the working solution with absolute ethanol; A2 is the absorbance of the sample group.
2.5. Determination of Hypoglycemic Capacity
Determination of α-glucosidase inhibitory activity: Refer to the experimental method of Deng et al.
37
Take 100 μL of the sample solution and 100 μL of the 0.5 mg/mL enzyme solution respectively, incubate them in a water bath at 37 °C for 5 minutes. Then add 200 μL of the 5 mmol/L PNPG solution, mix well, and react at 37 °C for 30 minutes. Finally, add 2 mL of the 0.2 mol/L Na2CO3 solution to terminate the reaction, and measure the absorbance at 405 nm. Using acarbose as the positive control, calculate the α-glucosidase inhibition rate according to Formula (3).

A0 is the absorbance of the blank group; A1 is the absorbance when PNPG solution is replaced with phosphate buffer; A2 is the absorbance of the sample group.
2.6. Determination of Lipid-Lowering Capacity
Determination of bile salt binding capacity: Refer to the experimental method of Kahlon, T. S. et al38,39 Take 1 mL of the sample solution into a test tube, add 1 mL of 0.01 mol/L HCl and 1 mL of 10 mg/mL pepsin, and shake for digestion at 37 °C for 1 hour to simulate gastric digestion. For the blank group, replace the sample with deionized water while retaining the hydrochloric acid solution; adjust the pH to 6.3, then add 2 mL of 10 mg/mL porcine pancreatin solution and shake for digestion at 37 °C for 1 hour to simulate intestinal digestion. Subsequently, add 1.5 mL of 0.3 mmol/L bile salt and continue digestion for 1 hour. After centrifugation at 5,000 r/min for 10 minutes, collect the supernatant, operate in accordance with the kit instructions, and calculate the sodium cholate binding rate using Formula (4).

C0 is the Cholate concentration in blank solution; C1 is the Cholate concentration in sample solution.
2.7. Data Processing
Each experiment was repeated three times in parallel, and the data were expressed as mean ± standard deviation. Design Expert 13 and Origin Pro 2021 software were used for response surface analysis and statistical analysis of the experimental data.
3. Results
3.1. Results of Single-Factor Experiments
3.1.1. Effect of Solid-Liquid Ratio on the Extraction of Total Polyphenols from Pu’er Tea Flowers
The change of solid-liquid ratio affects the extraction yield of total polyphenols from Pu’er tea flowers. As shown in Figure 3, the extraction yield of polyphenols increased initially and then decreased, reaching the highest when the solid-liquid ratio was 1:45 (g/mL). After that, with the increase of solvent dosage, the extraction yield decreased significantly, and the maximum total polyphenol extraction yield was 3.48 mg/g, indicating that most of the polyphenolic substances had been dissolved out at this time. When the ratio of solute to solution increases to a certain extent, the extraction of polyphenols by the extractant has reached saturation. When the solvent dosage is further increased, although the concentration difference inside and outside the cell membrane changes, more impurities are introduced, which not only hinders the dissolution of polyphenols but also may cause the extracted polyphenols to desorb and return to the material to be extracted, resulting in a decrease in extraction yield. Therefore, 1:45 (g/mL) was selected as the optimal solid-liquid ratio. Effect of solid-liquid ratio on extraction of total polyphenols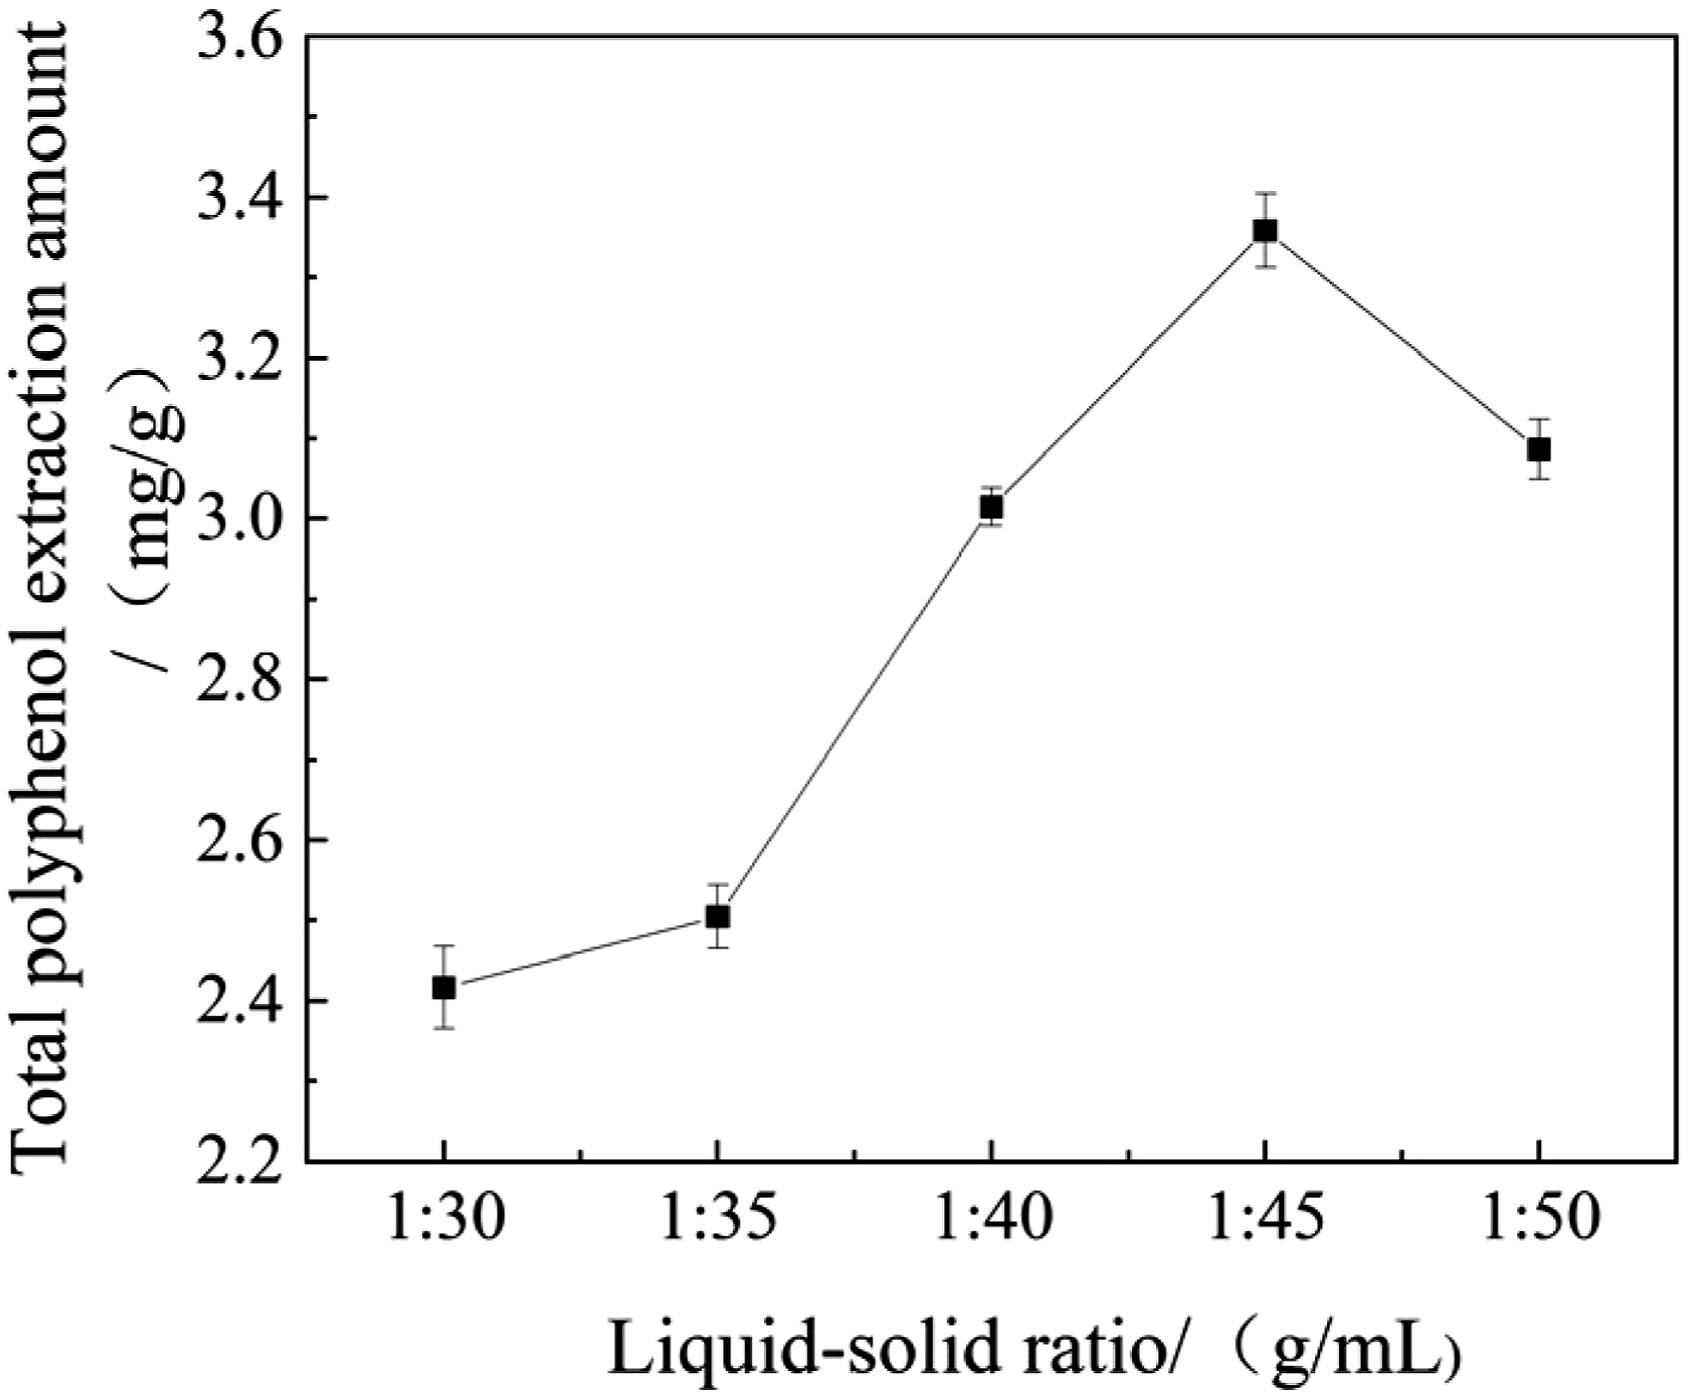
3.1.2. Effect of Ethanol Volume Fraction on the Extraction of Total Polyphenols from Pu’er Tea Flowers
The effect of ethanol volume fraction on the extraction of total polyphenols from Pu’er tea flowers is shown in Figure 4. With the increase of ethanol volume fraction, the extraction yield of polyphenols increased initially and then decreased. When the ethanol concentration reached 45%, the extraction yield of polyphenols reached the highest, which was 4.25 mg/g. Continuing to increase the ethanol volume fraction, the extraction yield of polyphenols no longer increased. Moreover, a too high ethanol volume fraction leads to a decrease in the polarity of the reaction environment, and other sub-stances may also be extracted, which is not conducive to the dissolution of polyphenols. In addition, the higher the ethanol volume fraction, the higher the extraction cost. Therefore, the ethanol volume fraction was finally determined to be 45% in this experiment. Effect of ethanol volume fraction on extraction of total polyphenols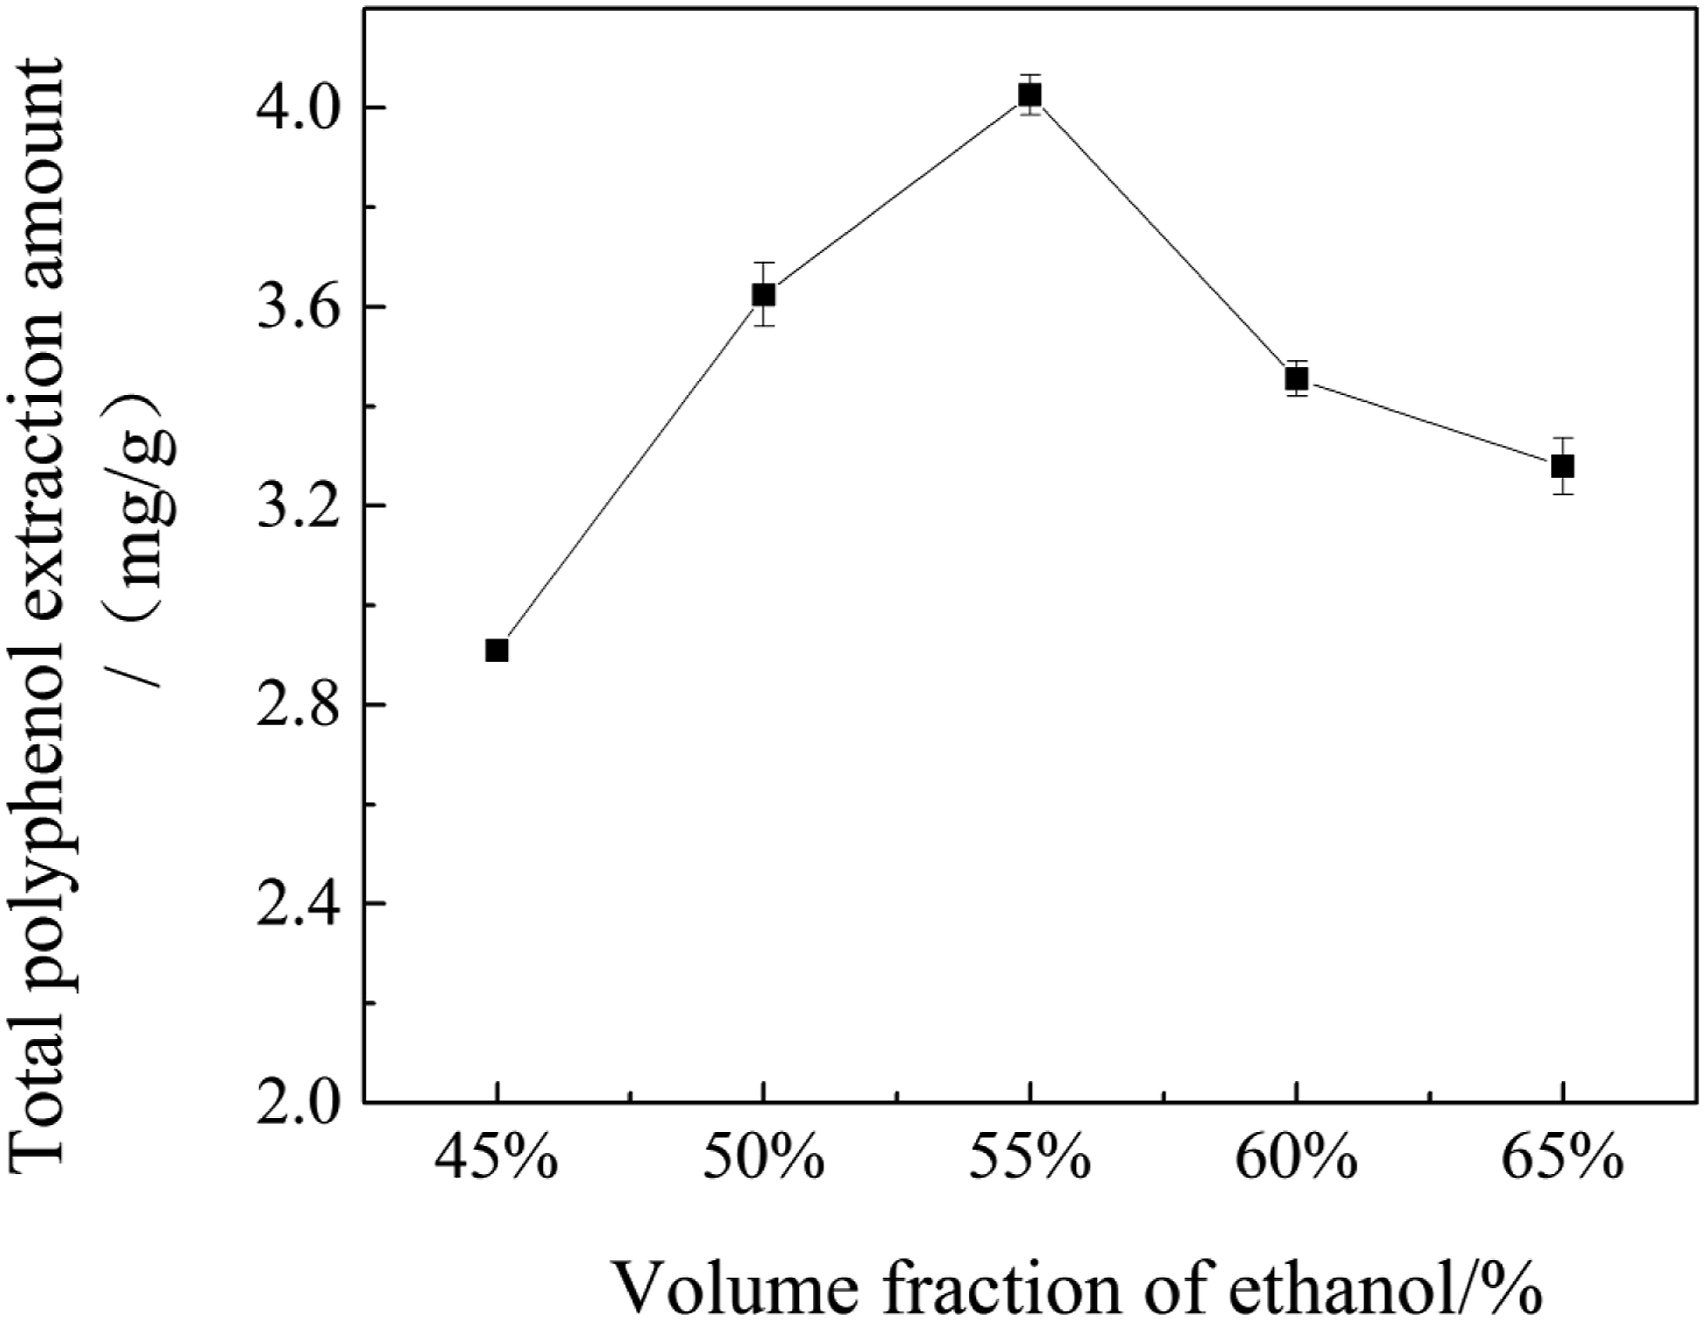
3.1.3. Effect of Extraction Temperature on the Extraction of Total Polyphenols from Pu’er Tea Flowers
The change of extraction temperature affects the extraction yield of total poly-phenols from Pu’er tea flowers. As shown in Figure 5, with the increase of extraction temperature, the extraction yield of total polyphenols increased initially and then decreased. When the extraction temperature was 55 °C, the extraction yield of total polyphenols reached the peak, which was 4.87 mg/g. With the increase of system temperature, the diffusion capacity of molecules is improved, the movement rate of molecules is accelerated, the dissolution of polyphenols is promoted, and the extraction yield of polyphenols is increased. When the extraction temperature was higher than 55 °C, the extraction yield of total polyphenols decreased with the increase of extraction temperature, which may be because too high extraction temperature would destroy the structure of some polyphenolic substances and promote the precipitation of other non-polyphenolic substances. Therefore, 55 °C was selected as the optimal extraction temperature. Effect of extraction temperature on extraction of total polyphenols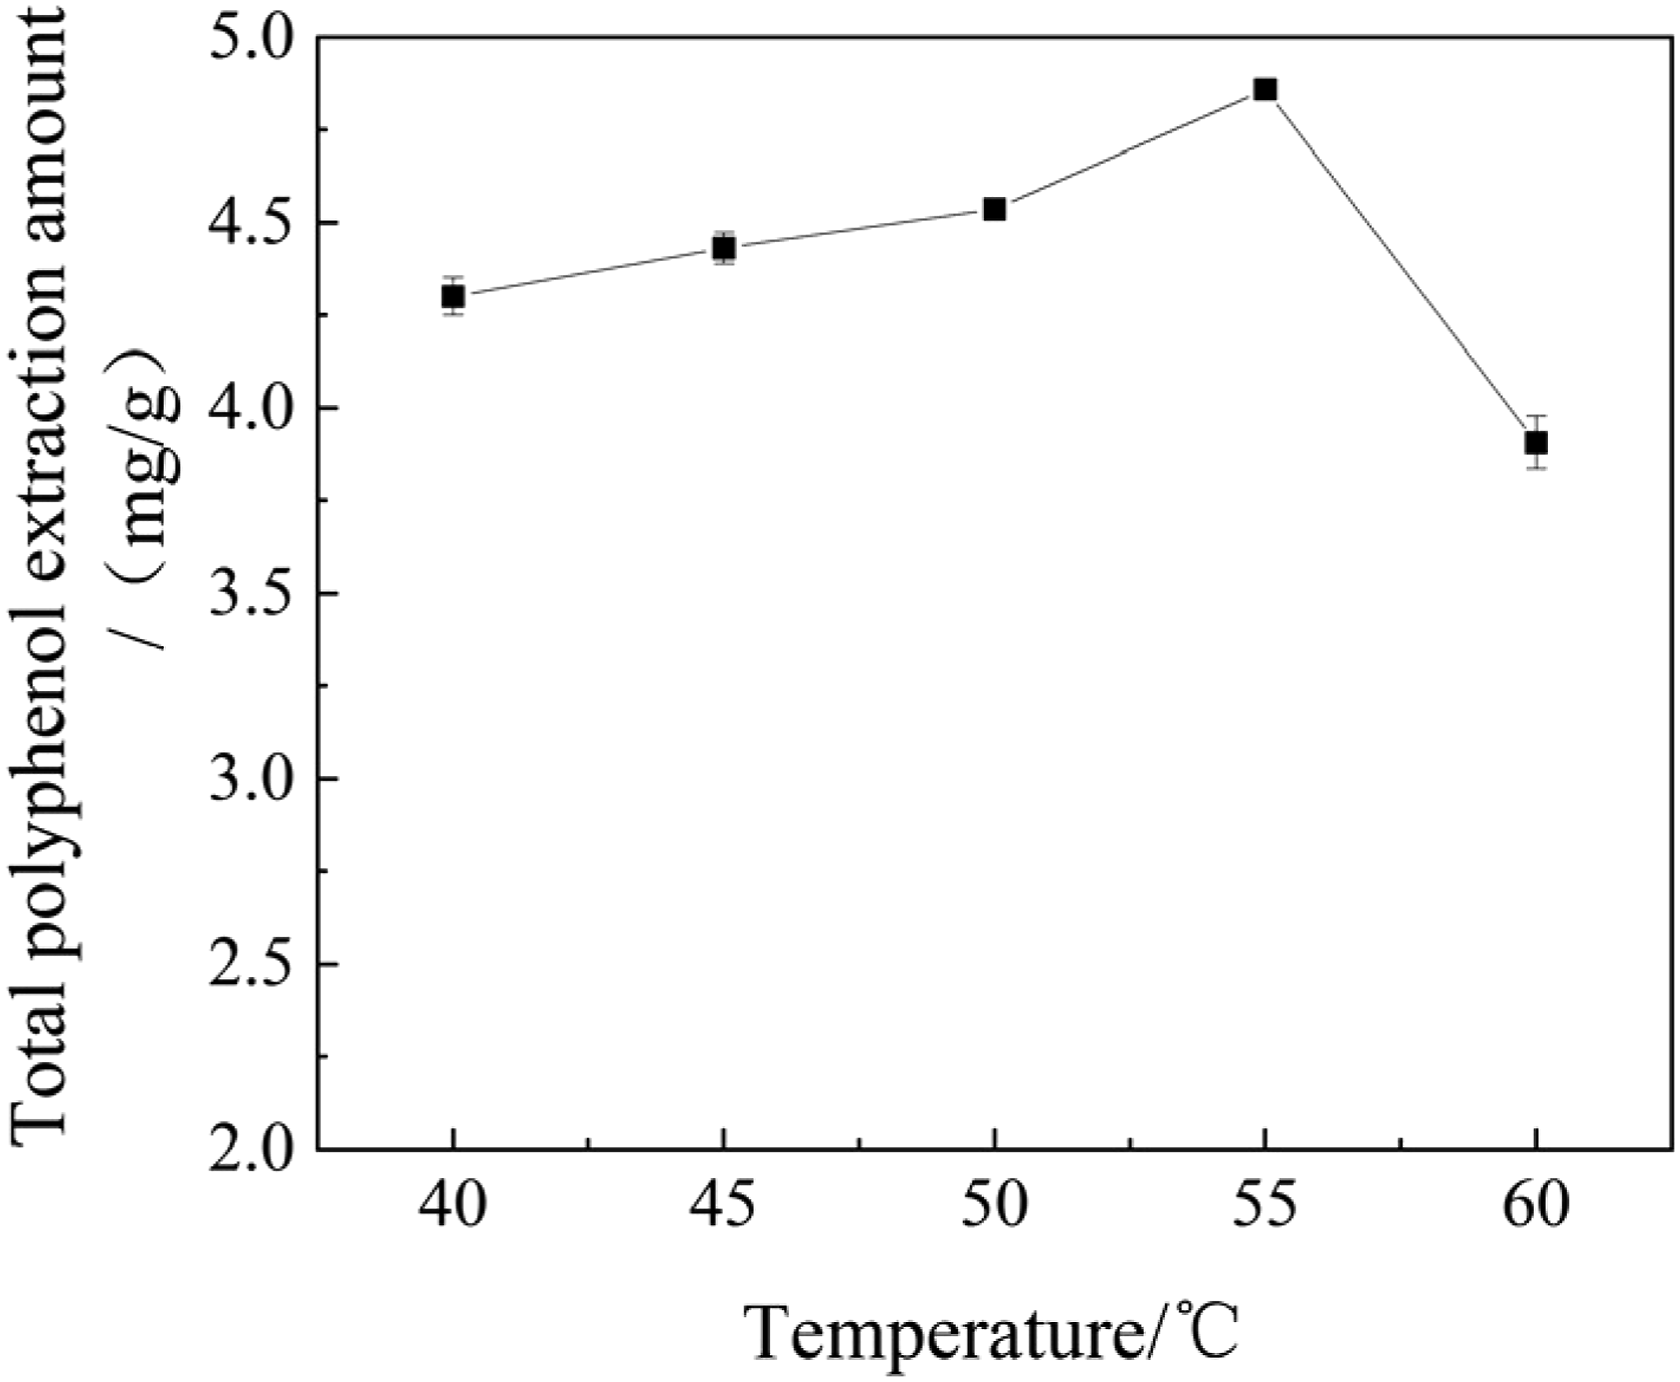
3.1.4. Effect of Ultrasonic Power on the Extraction of Total Polyphenols from Pu’er Tea Flowers
The effect of ultrasonic power on the extraction of total polyphenols from Pu’er tea flowers is shown in Figure 6. With the increase of ultrasonic power, the extraction yield of polyphenols increased, and the extraction rate increased rapidly within the range of 410-530 W. The extraction yield of polyphenols reached the maximum of 4.90 mg/g at 470 W, and then decreased with further increase of ultrasonic power. This is because higher ultrasonic power is beneficial to better break the cell wall, accelerate the penetration rate of the solvent to the extracted substances, and thus promote the extraction process. After the power increases to a certain extent, the extraction rate shows a downward trend, which is because too high ultrasonic power will lead to the denaturation and oxidation of the extracted substances, and even the loss of active components in the solvent. During the extraction process, the ultrasonic power has a certain impact on the extraction rate of tea polyphenols, and this has also been reported in other study. Therefore, it is necessary to explore the ultrasonic power. Effect of ultrasonic power on extraction of total polyphenols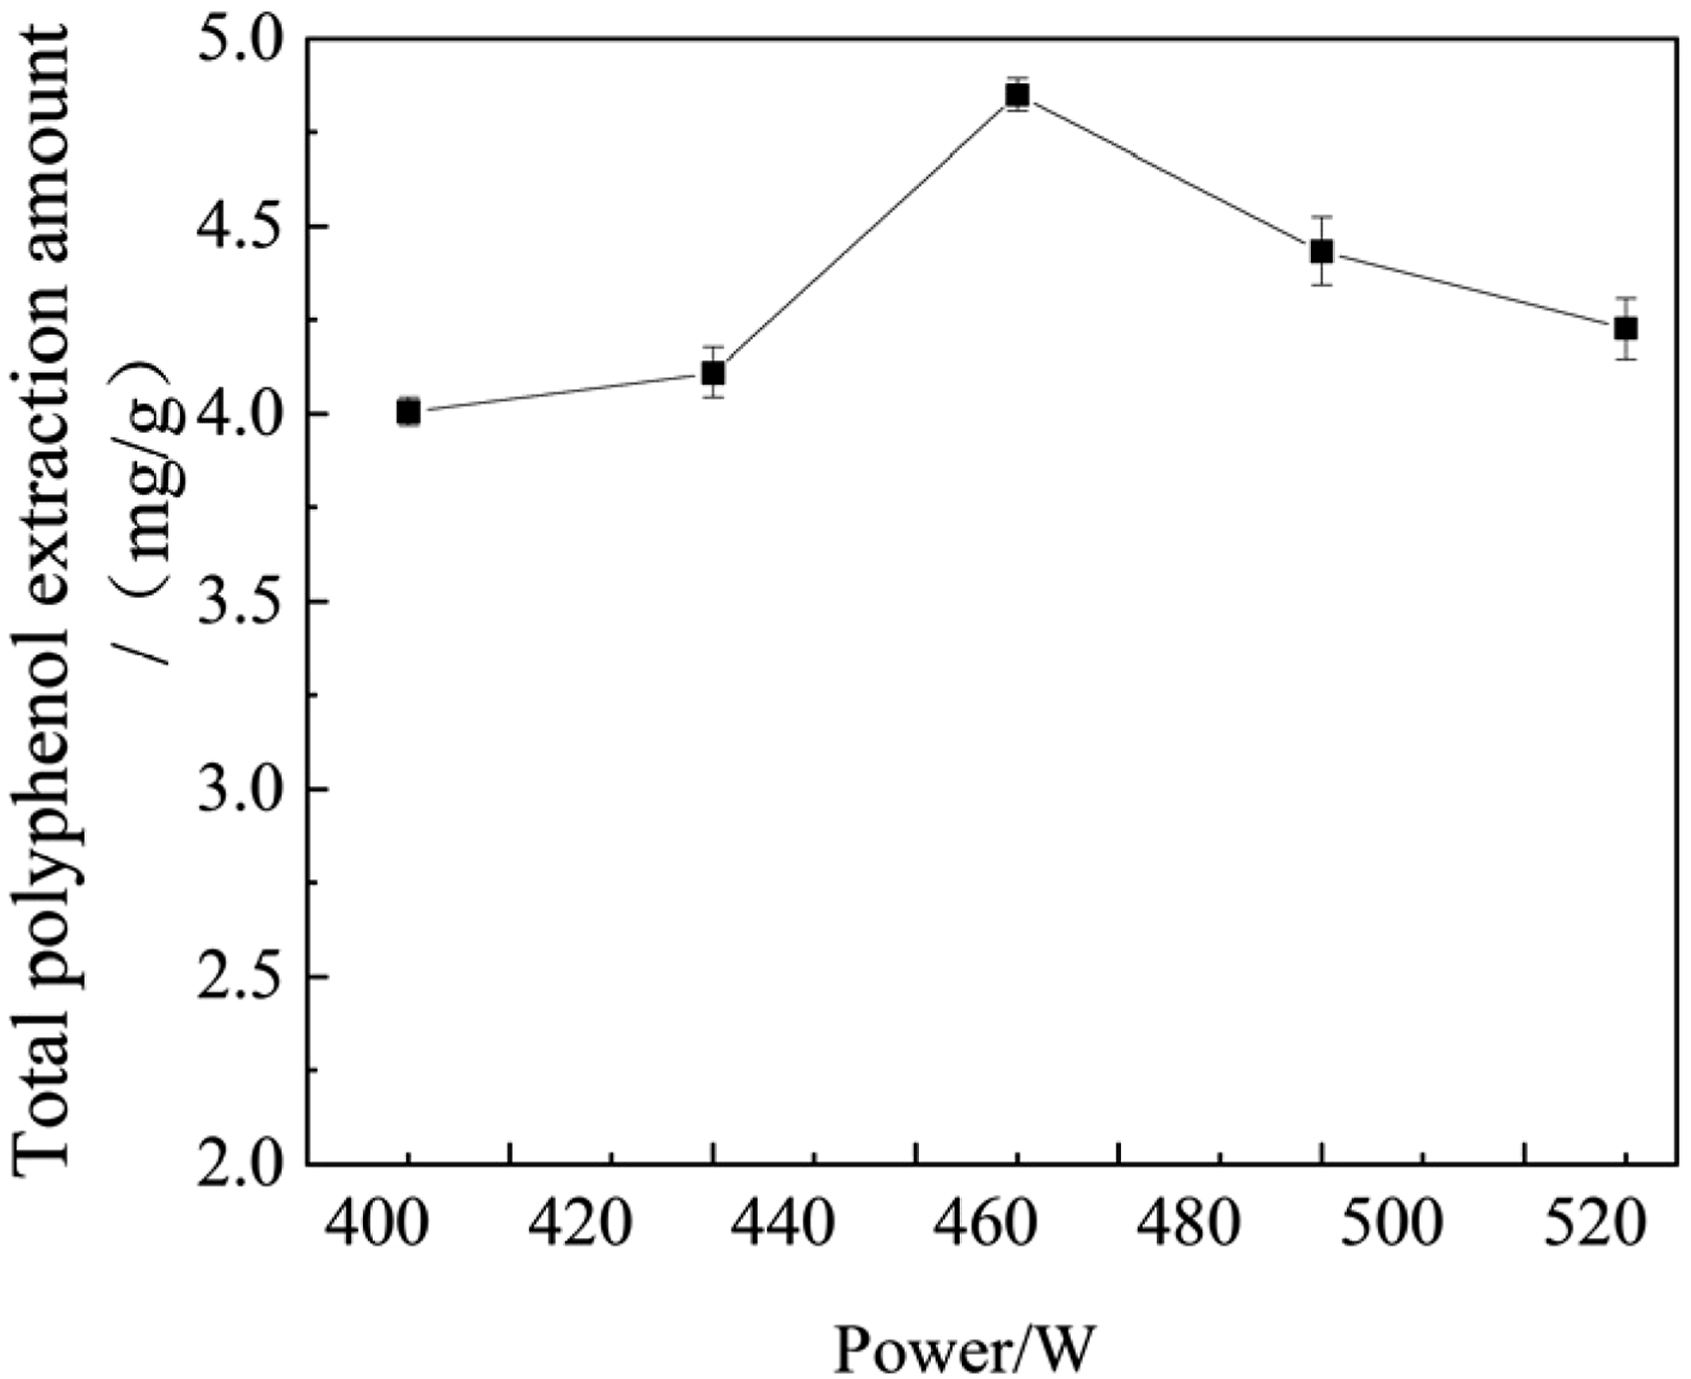
3.1.5. Effect of Extraction Time on the Extraction of Total Polyphenols from Pu’er Tea Flowers
The change of extraction time has an impact on the extraction of total polyphenols from Pu’er tea flowers. As shown in Figure 7, the extraction yield of total polyphenols first increased and then decreased. When the extraction time was 120 min, the extraction yield of total polyphenols reached the peak, which was 4.92 mg/g. The reason for this phenomenon may be that with the extension of treatment time, the Pu’er tea flowers powder is more fully in contact with the extractant, and accompanied by the mechanical effect of ultrasound, so that polyphenols can be more effectively released from the Pu’er tea flowers powder. Therefore, the extraction yield of polyphenols reached the maximum at the extraction time of 120 min. However, with the further extension of ultrasonic time, the extraction yield of polyphenols did not continue to increase. It is speculated that the polyphenolic substances have been basically released during the ultrasonic process, and the polyphenols will contact with air for too long extraction time. The oxygen in the air will promote the chemical reaction of phenolic substances, and other substances such as amino acids and polysaccharides will also be released, leading to a decrease in the extraction yield of polyphenols.
40
Therefore, 120 min was the optimal ultrasonic extraction time. Effect of extraction time on extraction of total polyphenols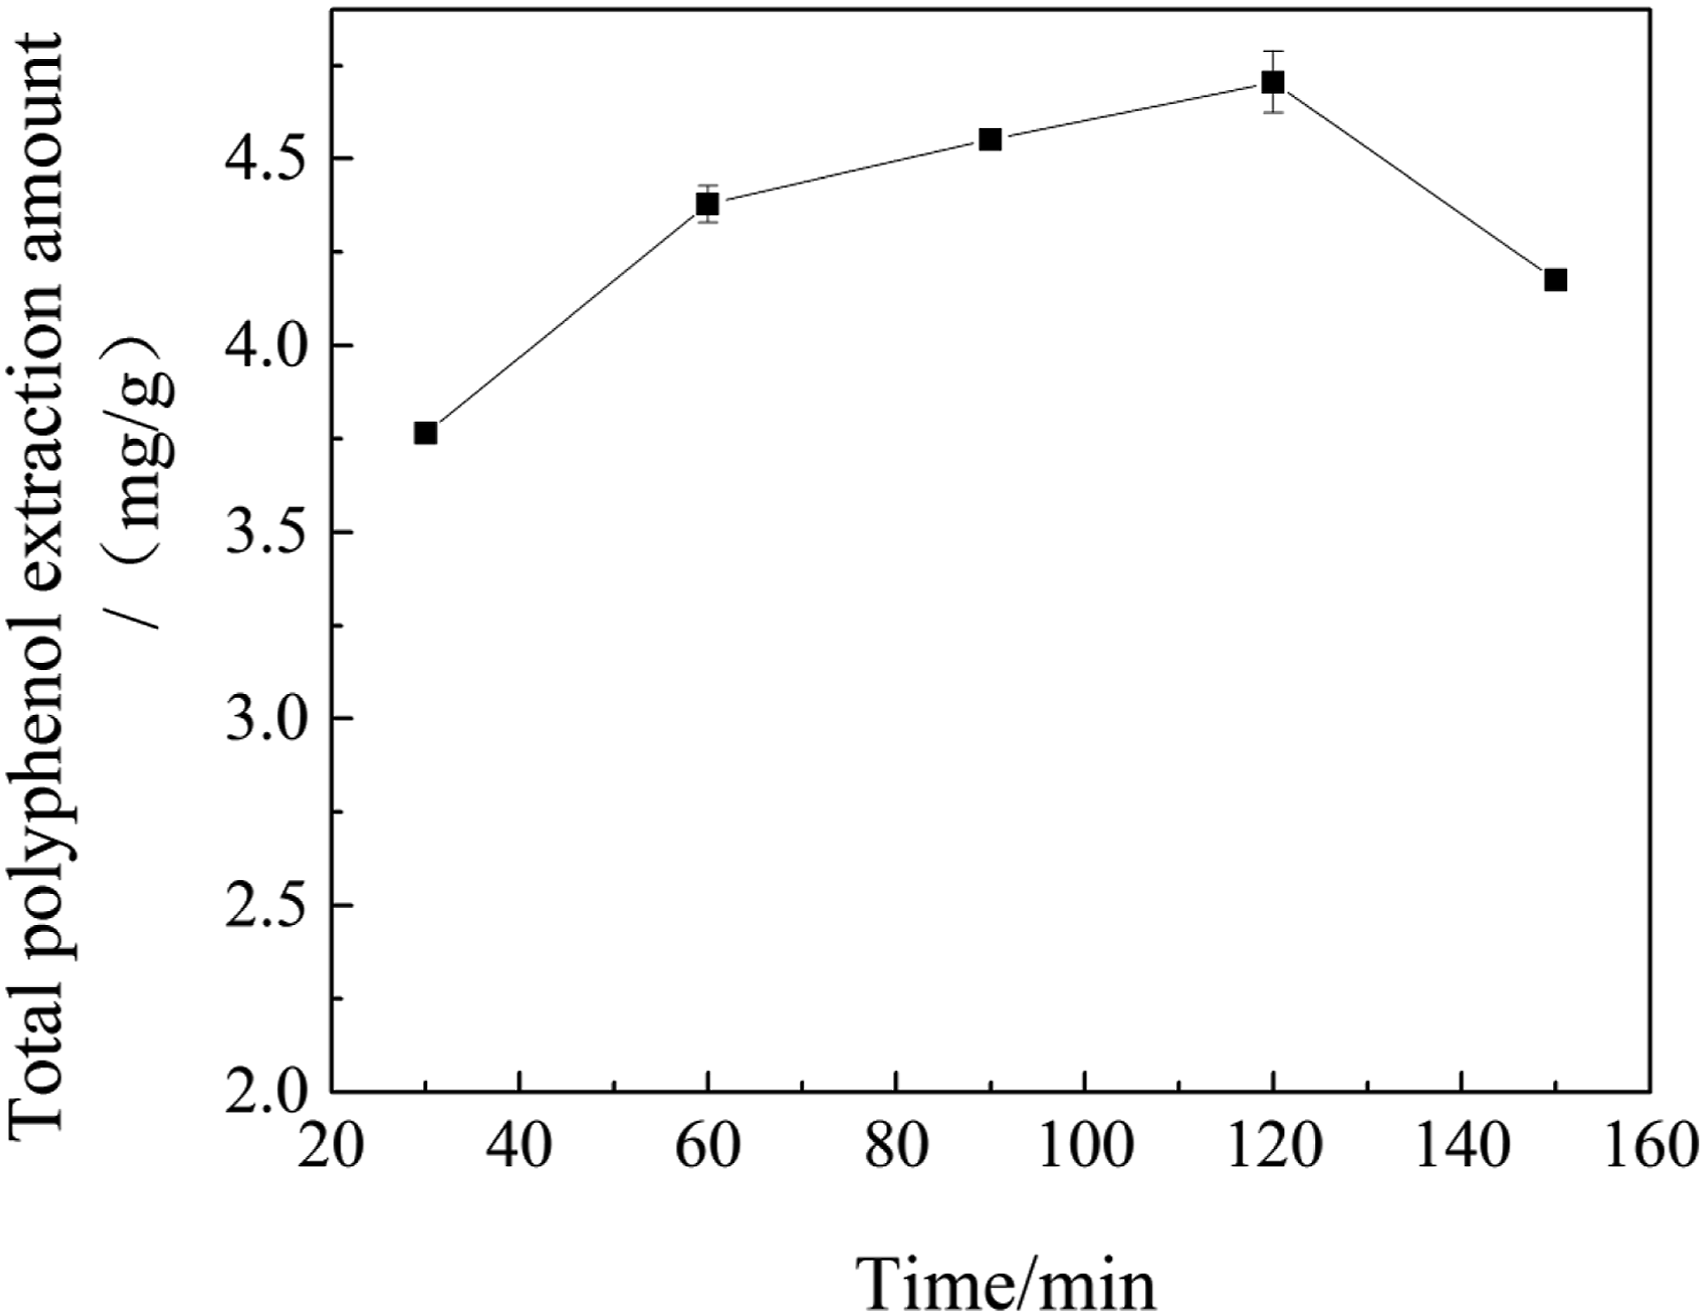
3.2. Results of Response Surface Experiment for Optimization of Total Polyphenol Extraction Process From Pu’er Tea Flowers
3.2.1. Analysis of Response Surface Experiment Results
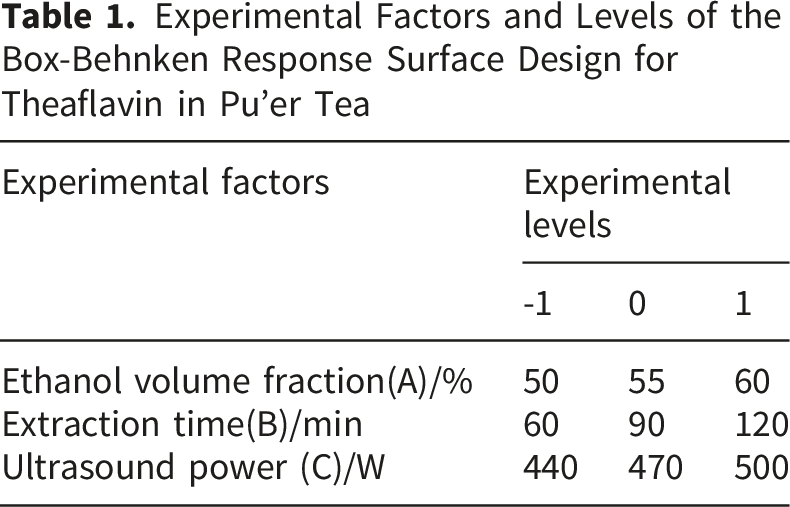
Experimental Factors and Levels of the Box-Behnken Response Surface Design for Theaflavin in Pu’er Tea
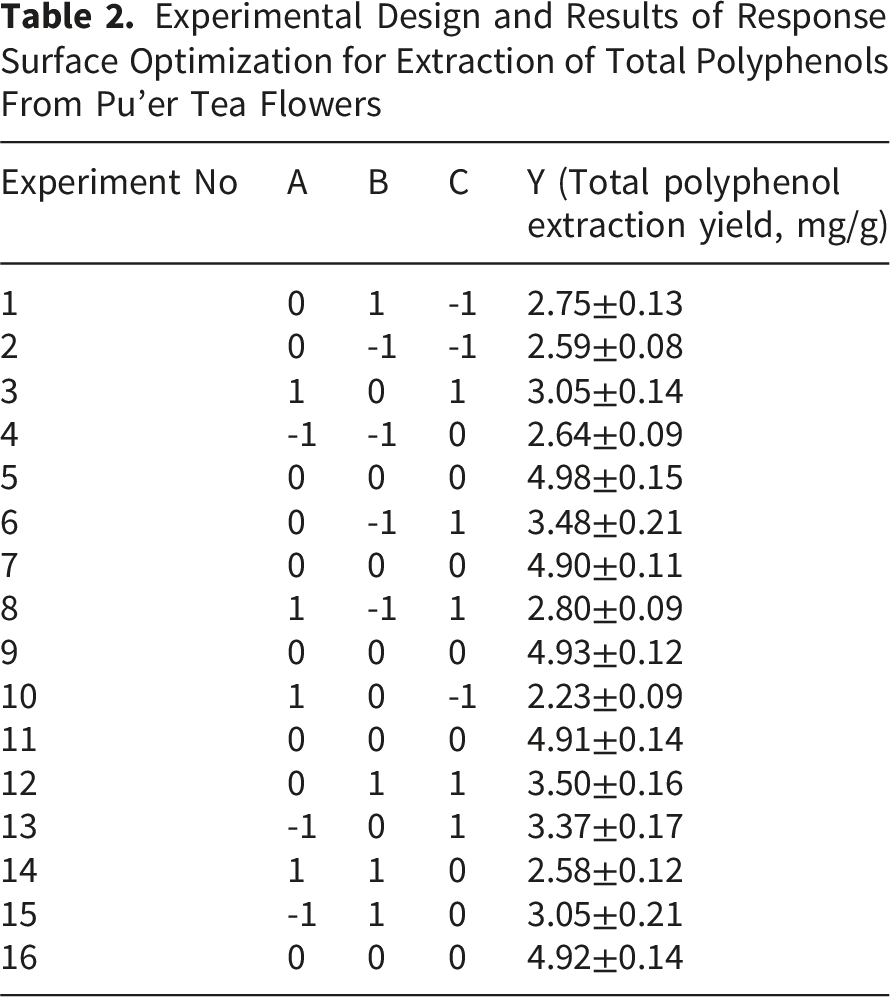
Experimental Design and Results of Response Surface Optimization for Extraction of Total Polyphenols From Pu’er Tea Flowers
Analysis of Variance (ANOVA) of the Regression Model
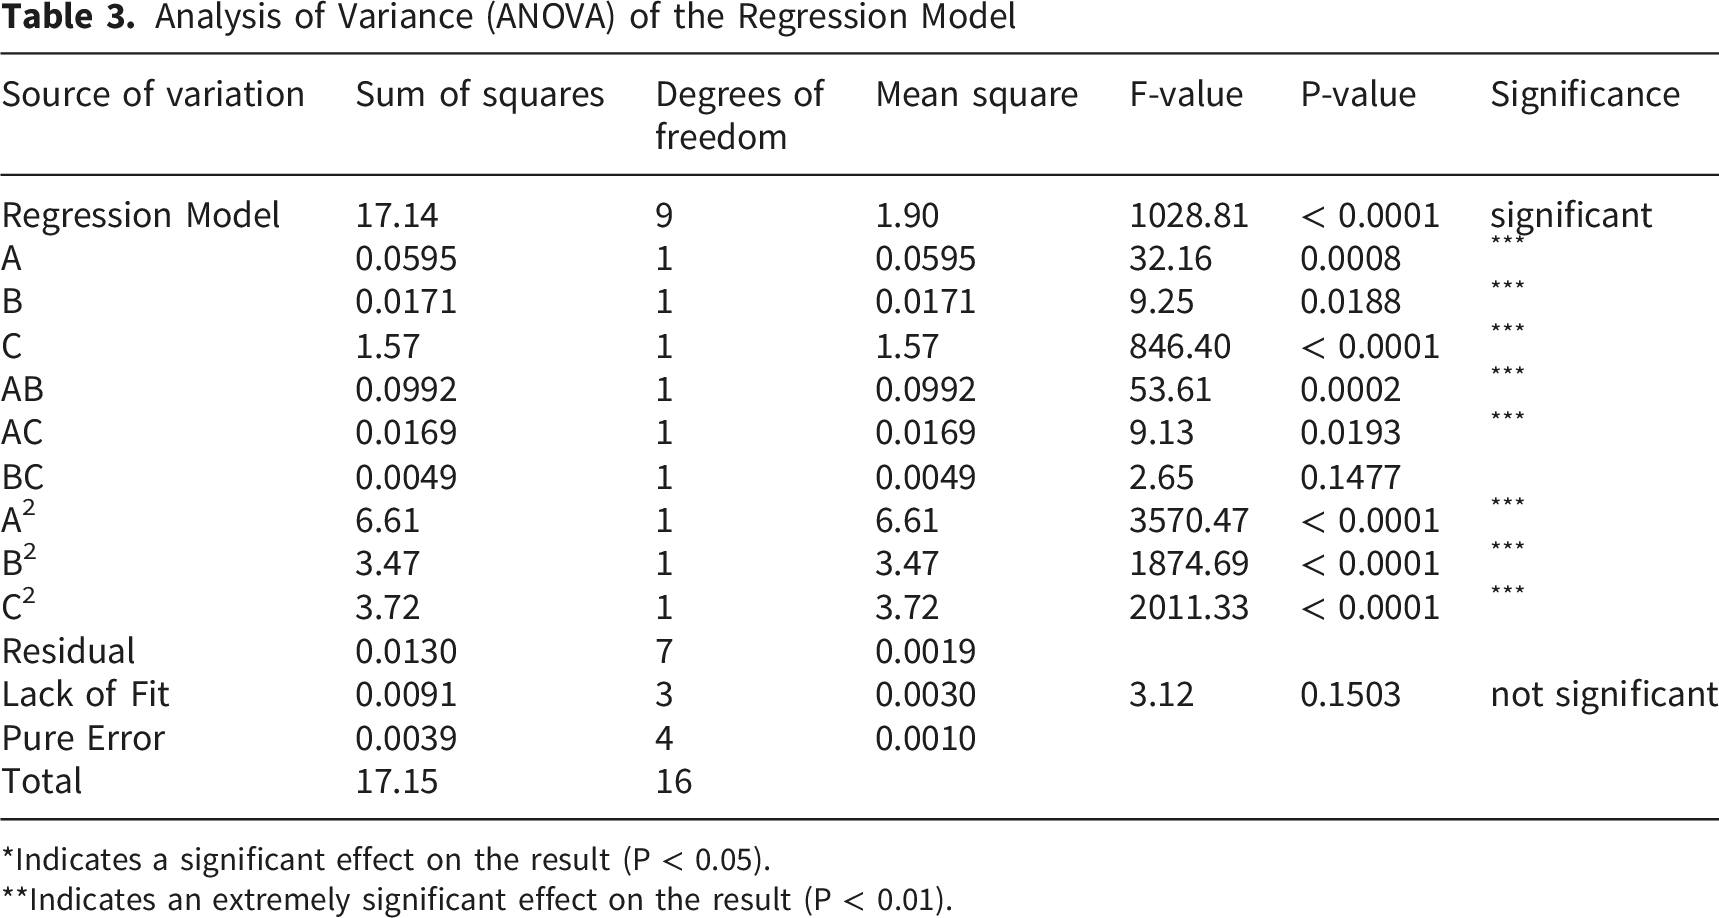
*Indicates a significant effect on the result (P < 0.05).
**Indicates an extremely significant effect on the result (P < 0.01).
Design Expert 13 statistical software was used to perform multiple quadratic regression fitting on the results in Table 2, and the obtained quadratic polynomial regression equation was:
Y=4.93-0.0862A+0.0463×B+0.4425×C-0.1575×AB-0.0650×AC-0.0350×BC-1.25×A2-0.9078×B2 -0.9402×C2 As shown in Table 3, the order of influence of each factor on the extraction yield of total polyphenols from Pu’er tea flowers was: ethanol volume fraction > extraction time > ultrasound power. The results showed that the ethanol volume fraction had a significant influence, while the ultrasound power had a relatively small influence.
3.2.2. Determination of Optimal Conditions and Verification Experiment
As shown in Figure 8, the response surface diagram of the interaction between ethanol volume fraction and extraction time has a relatively steep surface, and the contour shape is elliptical and relatively dense, indicating that these extraction factors jointly affect the extraction yield of total polyphenols from Pu’er tea flowers, and the ethanol volume fraction and extraction time have a significant influence on the poly-phenol extraction yield, which also corresponds to the P-value of the interaction term in the analysis of variance. All response surfaces open downward, indicating that the regression model has an extreme point. At this time, the theoretical extraction process was: ethanol volume fraction of 54.93%, extraction time of 89.99 min, ultrasound power of 477.130 W, and the theoretical value of the total polyphenol extraction yield from Pu’er tea flowers was 4.98 mg/g. Considering the feasibility of actual operation, the optimal extraction process conditions were optimized and revised to: ethanol volume fraction of 55%, extraction time of 90 min, and ultrasound power of 480 W. Three verification experiments were carried out under these conditions, and the ex-traction yield of total polyphenols from Pu’er tea flowers was (4.95±0.08) mg/g, which was close to the predicted theoretical value, indicating that the model had a good fit and could be used to predict the extraction process of total polyphenols from Pu’er tea flowers. Response surface result plots for the interaction of each factor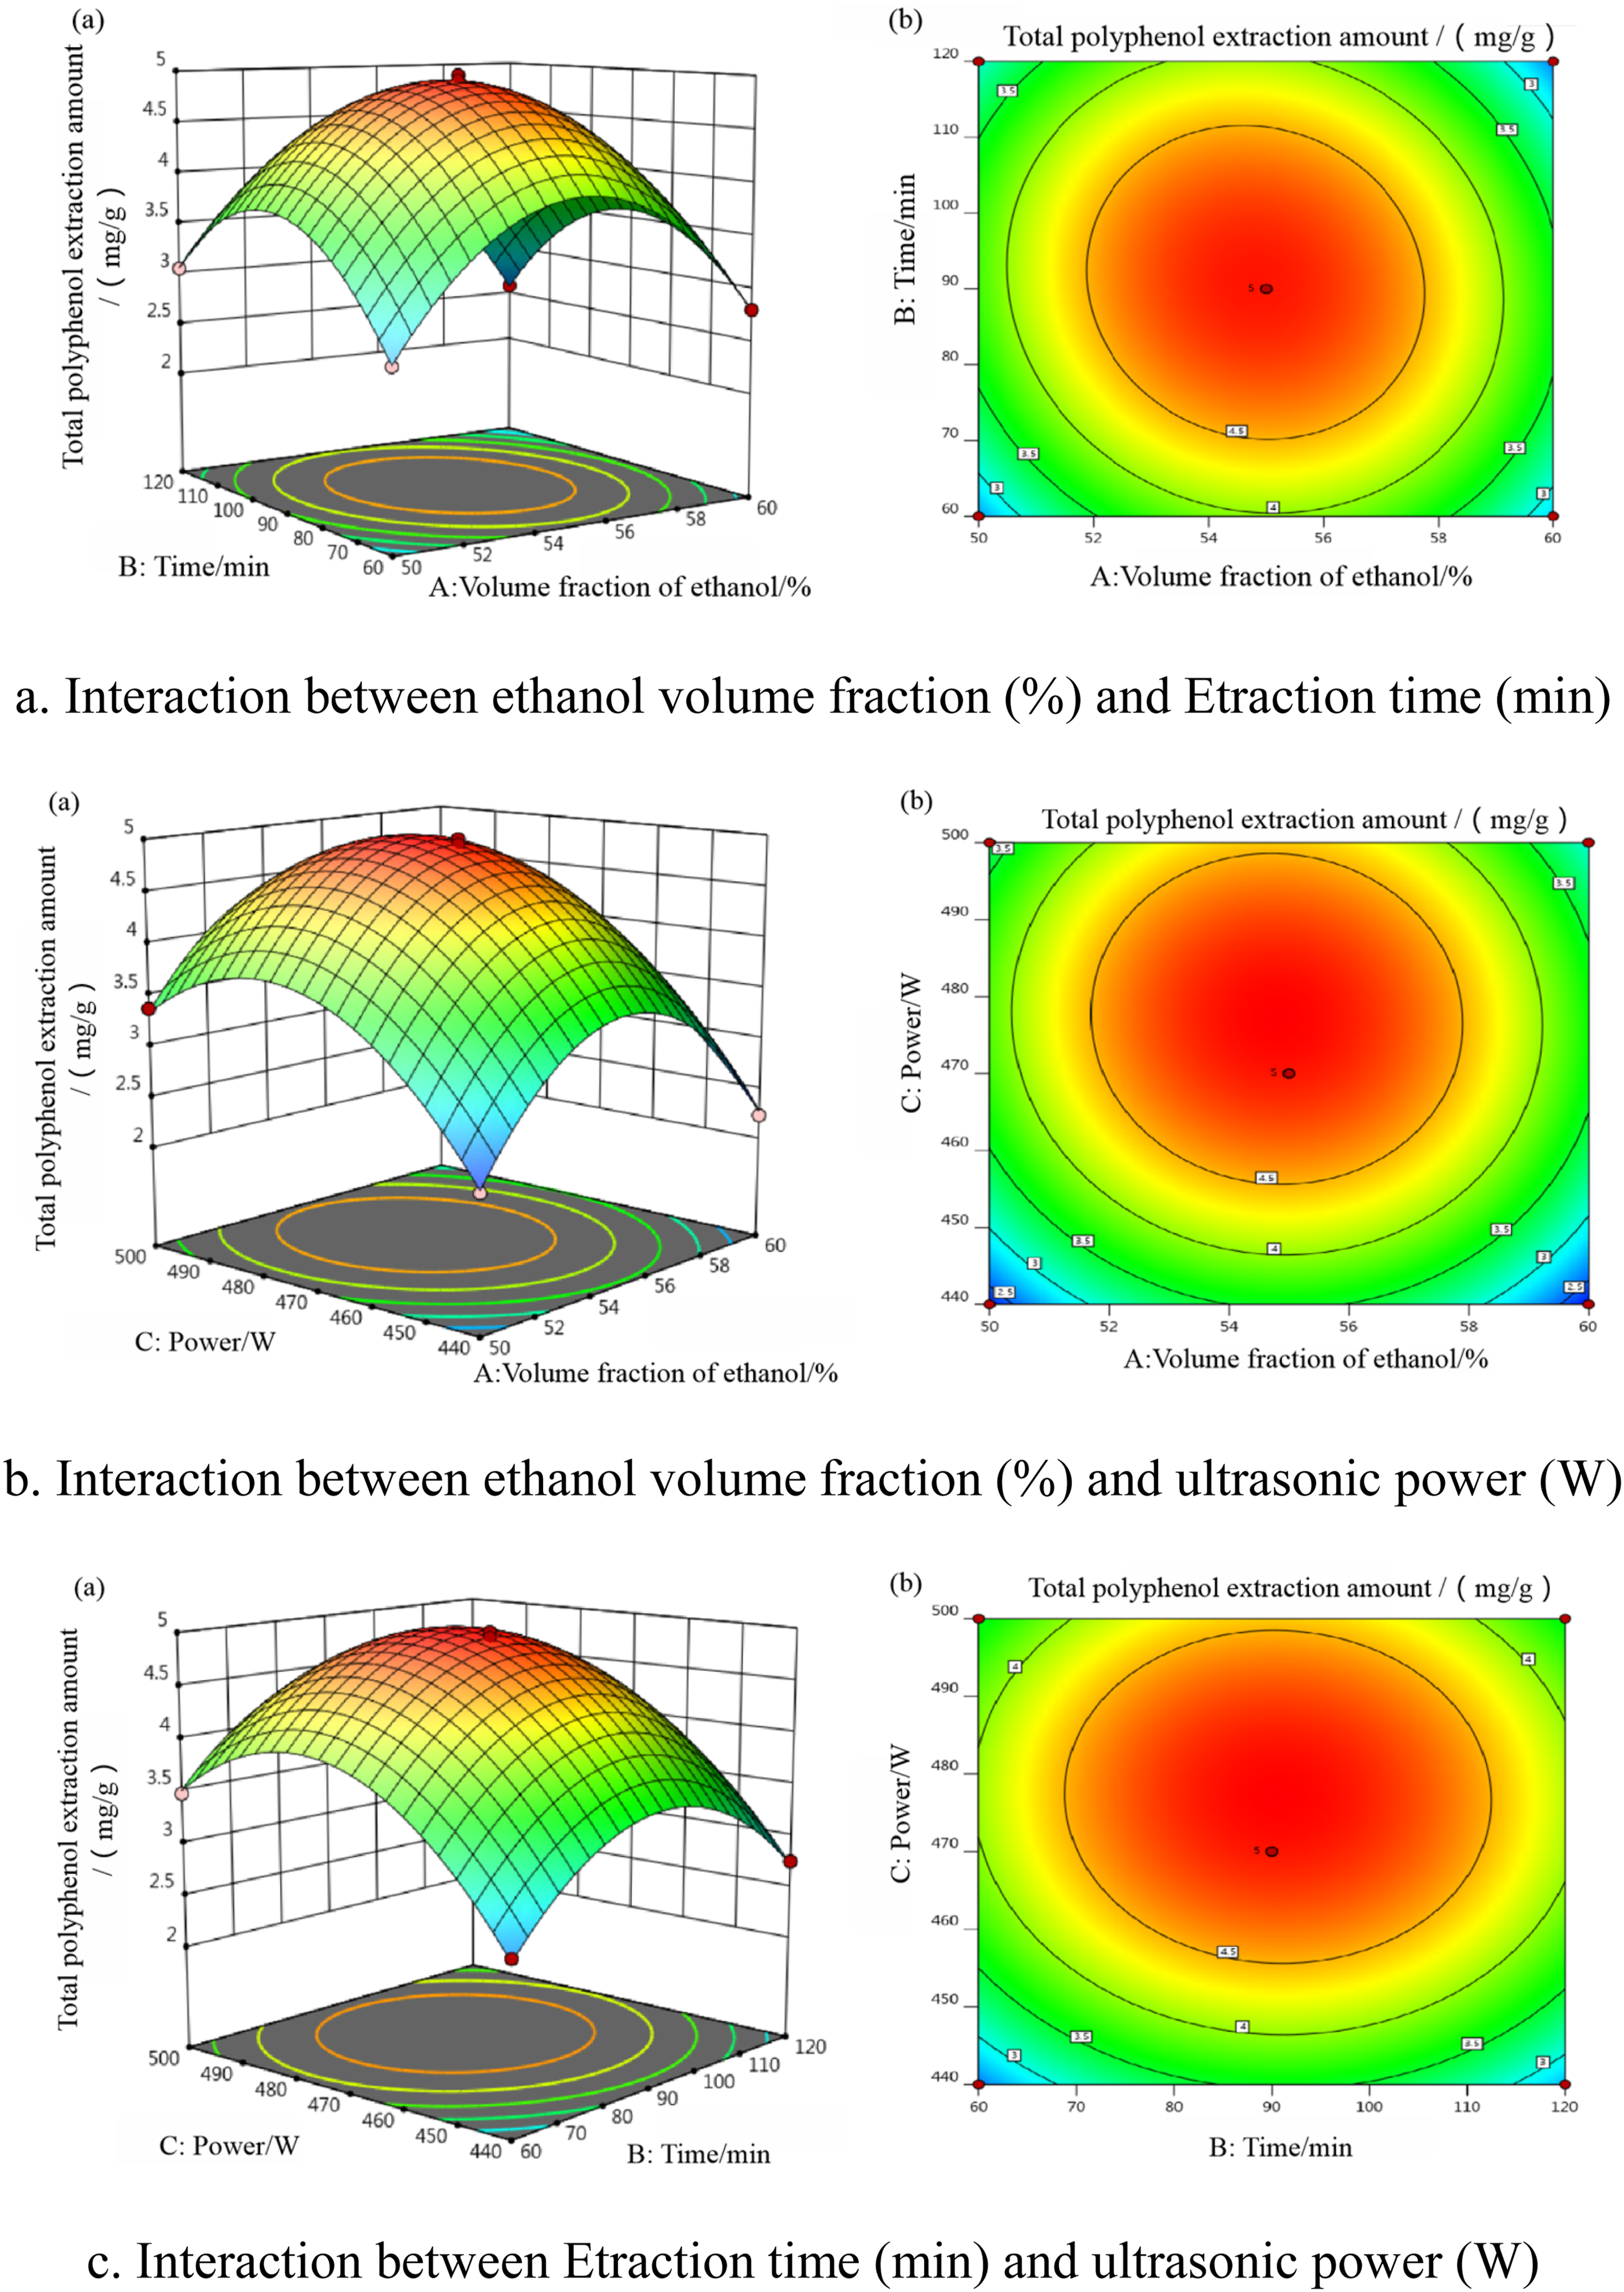
3.3. Determination of Antioxidant Capacity of Total Polyphenols From Pu’er Tea Flowers
3.3.1. DPPH• Scavenging Capacity
The results of DPPH• scavenging capacity of total polyphenols from Pu’er tea flowers are shown in Figure 9. Both total polyphenols from Pu’er tea flowers and ascorbic acid have strong DPPH• scavenging capacity. In the range of 0.02-0.2 mg/mL, the scavenging rates of both increase with the increase of concentration, showing a good upward trend. When the sample reaches a certain concentration, the scavenging capacity of total polyphenols from Pu’er tea flowers approaches that of ascorbic acid for DPPH•. The IC50 value of total polyphenols from Pu’er tea flowers for DPPH• scavenging is 0.068 mg/mL, and the IC50 value of ascorbic acid for DPPH• scavenging is 0.024 mg/mL. The study shows that both total polyphenols from Pu’er tea flowers and ascorbic acid have good DPPH• scavenging capacity, but the DPPH• scavenging capacity of ascorbic acid is stronger than that of total polyphenols from Pu’er tea flowers. Scavenging effect of ascorbic acid and total polyphenols of Pu’er tea flower on DPPH•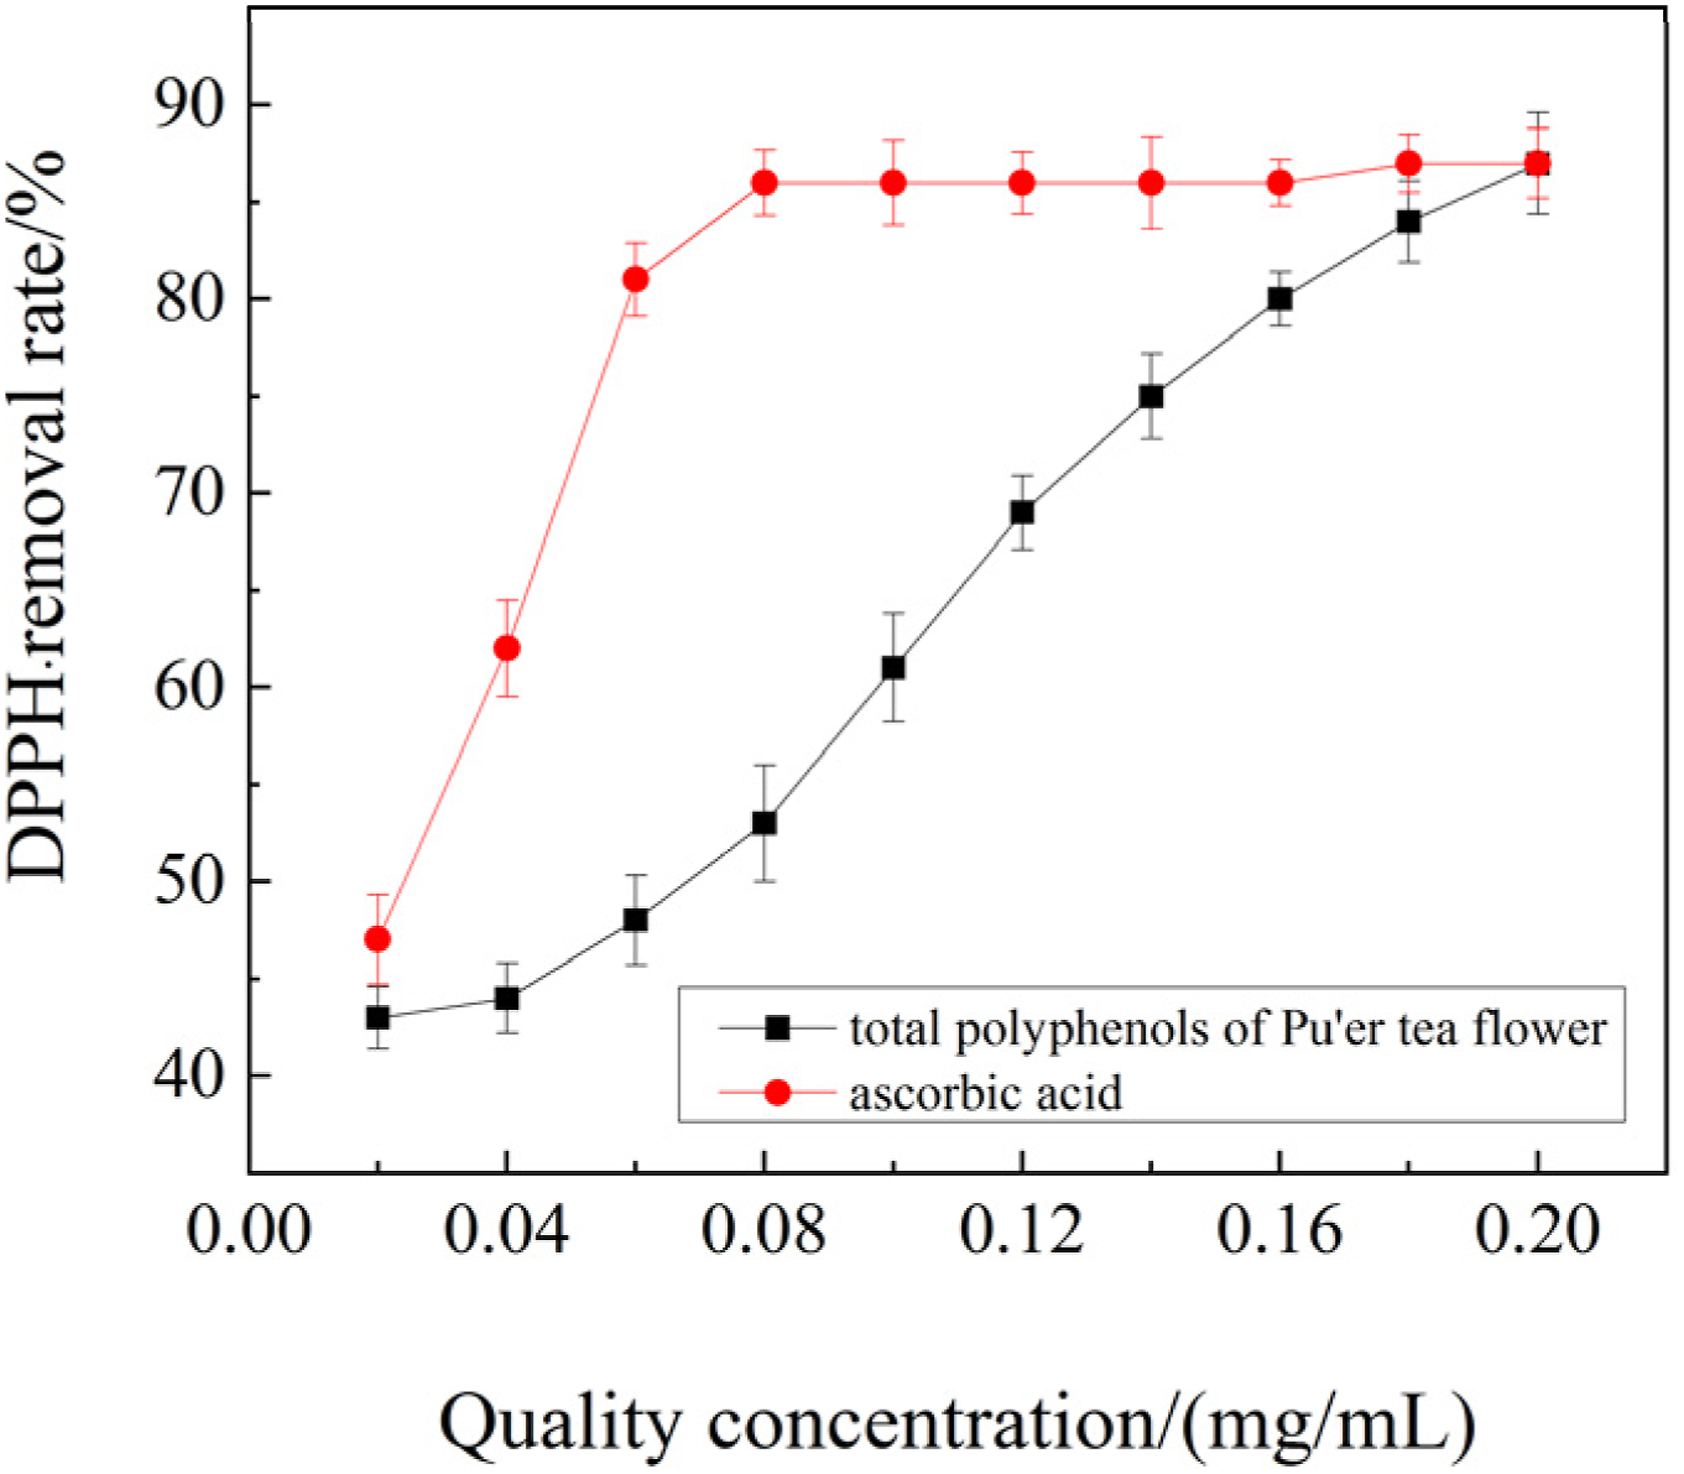
3.3.2. ABTS• Scavenging Capacity
The determination results of ABTS• scavenging rate of total polyphenols from Pu’er tea flowers are shown in Figure 10. At low concentrations, the ABTS• scavenging rate of ascorbic acid is lower than that of total polyphenols from Pu’er tea flowers. The scavenging rate increases with the increase of sample concentration. At 0.80 mg/mL, the ABTS• scavenging rate of total polyphenols from Pu’er tea flowers reaches 97.0%, which is slightly lower than that of the reference substance ascorbic acid (99.0%). The IC50 value of ascorbic acid for ABTS• scavenging is 0.065 mg/mL, and the IC50 value of total polyphenols from Pu’er tea flowers for ABTS• scavenging is 0.093 mg/mL. It can be seen that the total polyphenols from Pu’er tea flowers have a strong ABTS• scavenging capacity, but it is slightly lower than that of ascorbic acid. Scavenging effect of ascorbic acid and total polyphenols of Pu’er tea flowers on ABTS•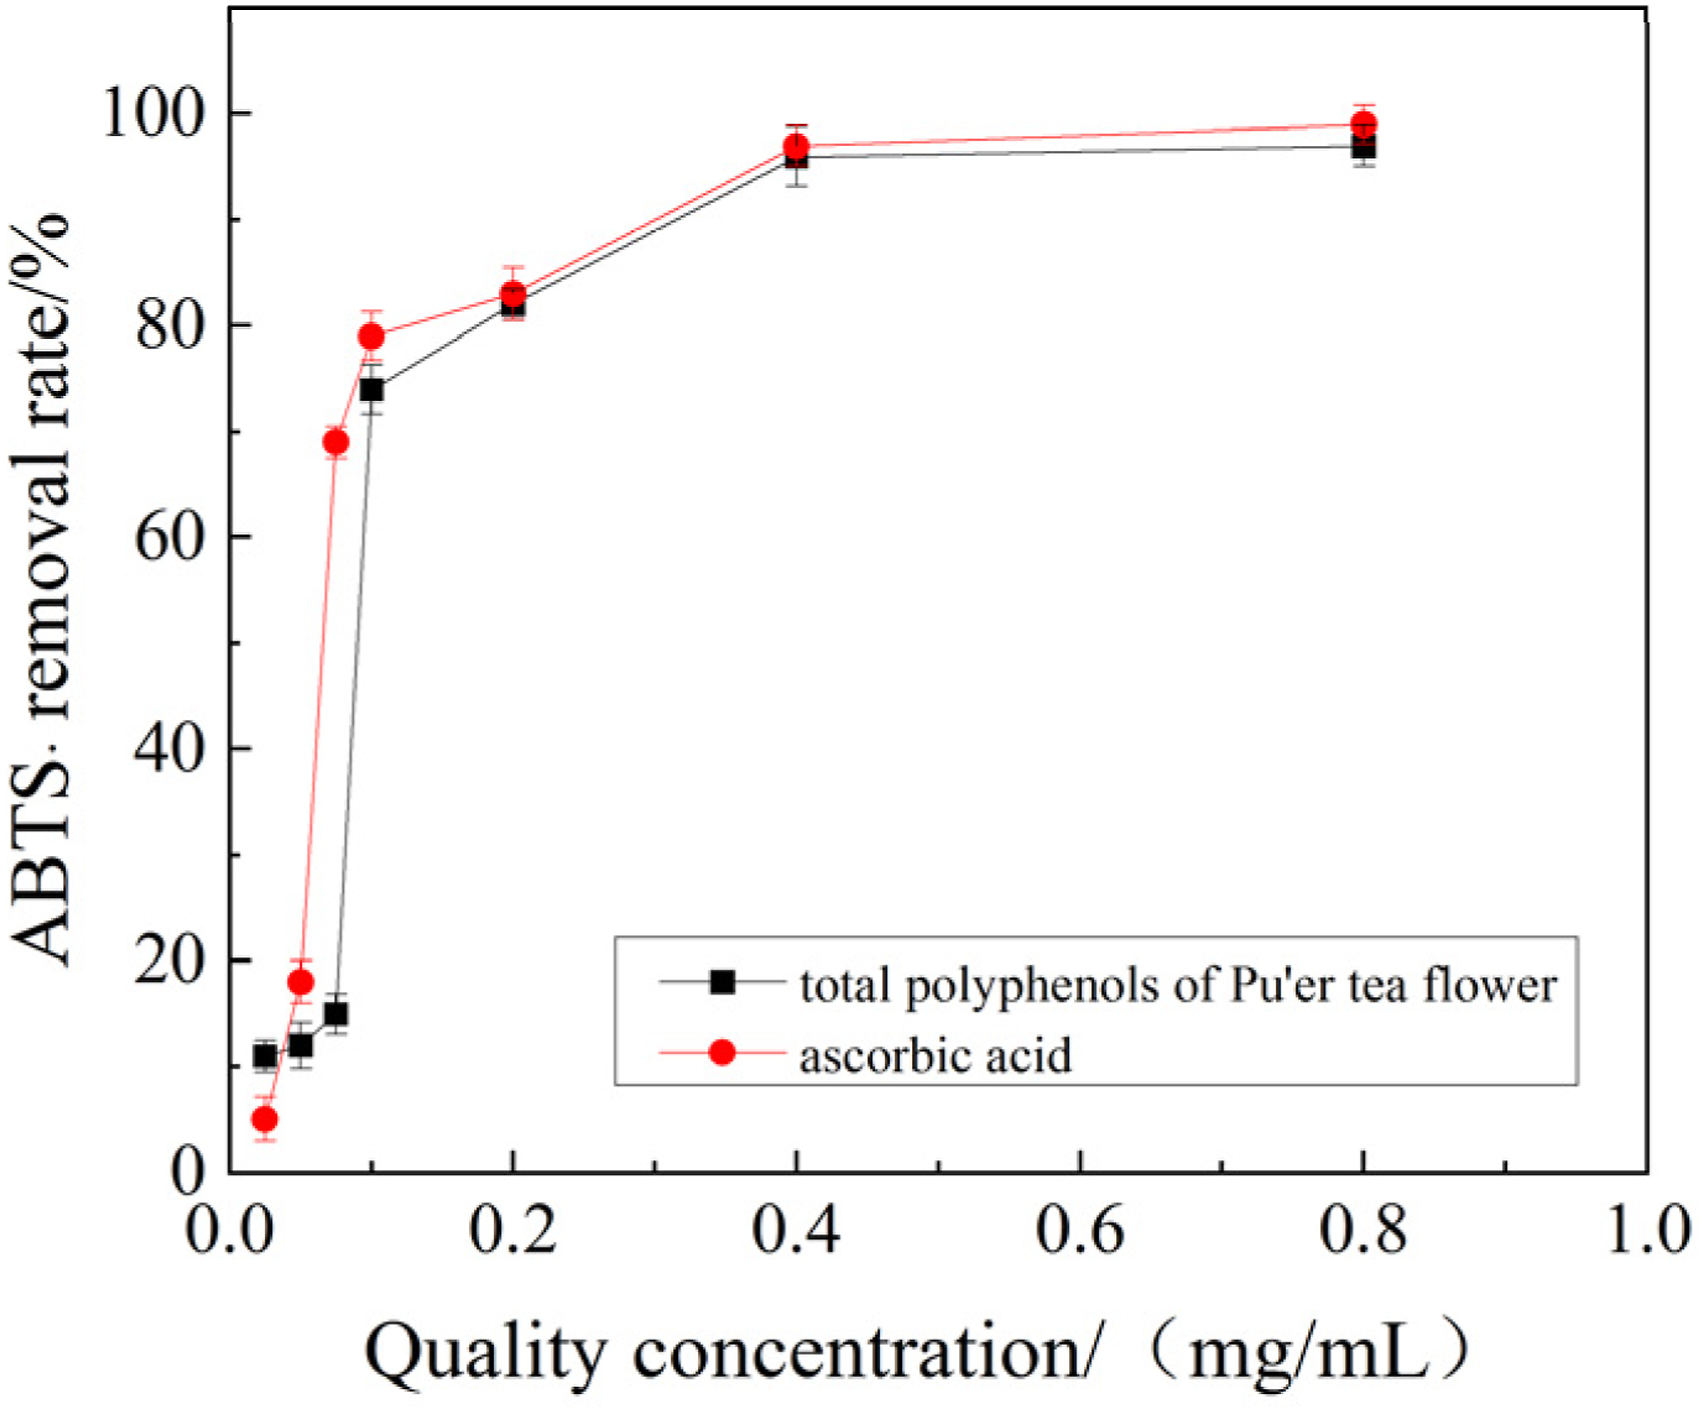
3.4. Determination of α-Glucosidase Inhibitory Capacity of Total Polyphenols From Pu’er Tea Flowers
α-glucosidase can hydrolyze glycosidic bonds to produce glucose. Inhibiting α-glucosidase can reduce blood glucose levels and thus play a role in protecting the pancreas.
40
As shown in Figure 11, it is the change curve of the inhibitory activity of total polyphenols from Pu’er tea flowers with different concentrations on α-glucosidase. With the continuous increase of the concentration of total polyphenols from Pu’er tea flowers, the inhibition rate of α-glucosidase gradually increases. When the concentration of total polyphenols from Pu’er tea flowers is 3.2 mg/mL, the inhibition rate of α-glucosidase is 81%, while the inhibition rate of 3.2 mg/mL acarbose on α-glucosidase is 73%. The IC50 value of acarbose for α-glucosidase inhibition is 0.80 mg/mL, and the IC50 value of total polyphenols from Pu’er tea flowers for α-glucosidase inhibition is 0.73 mg/mL. This indicates that the total polyphenols from Pu’er tea flowers have a strong inhibitory capacity on α-glucosidase. Inhibitory effect of acarbose and total polyphenols of Pu’er tea flower on α-glucosidase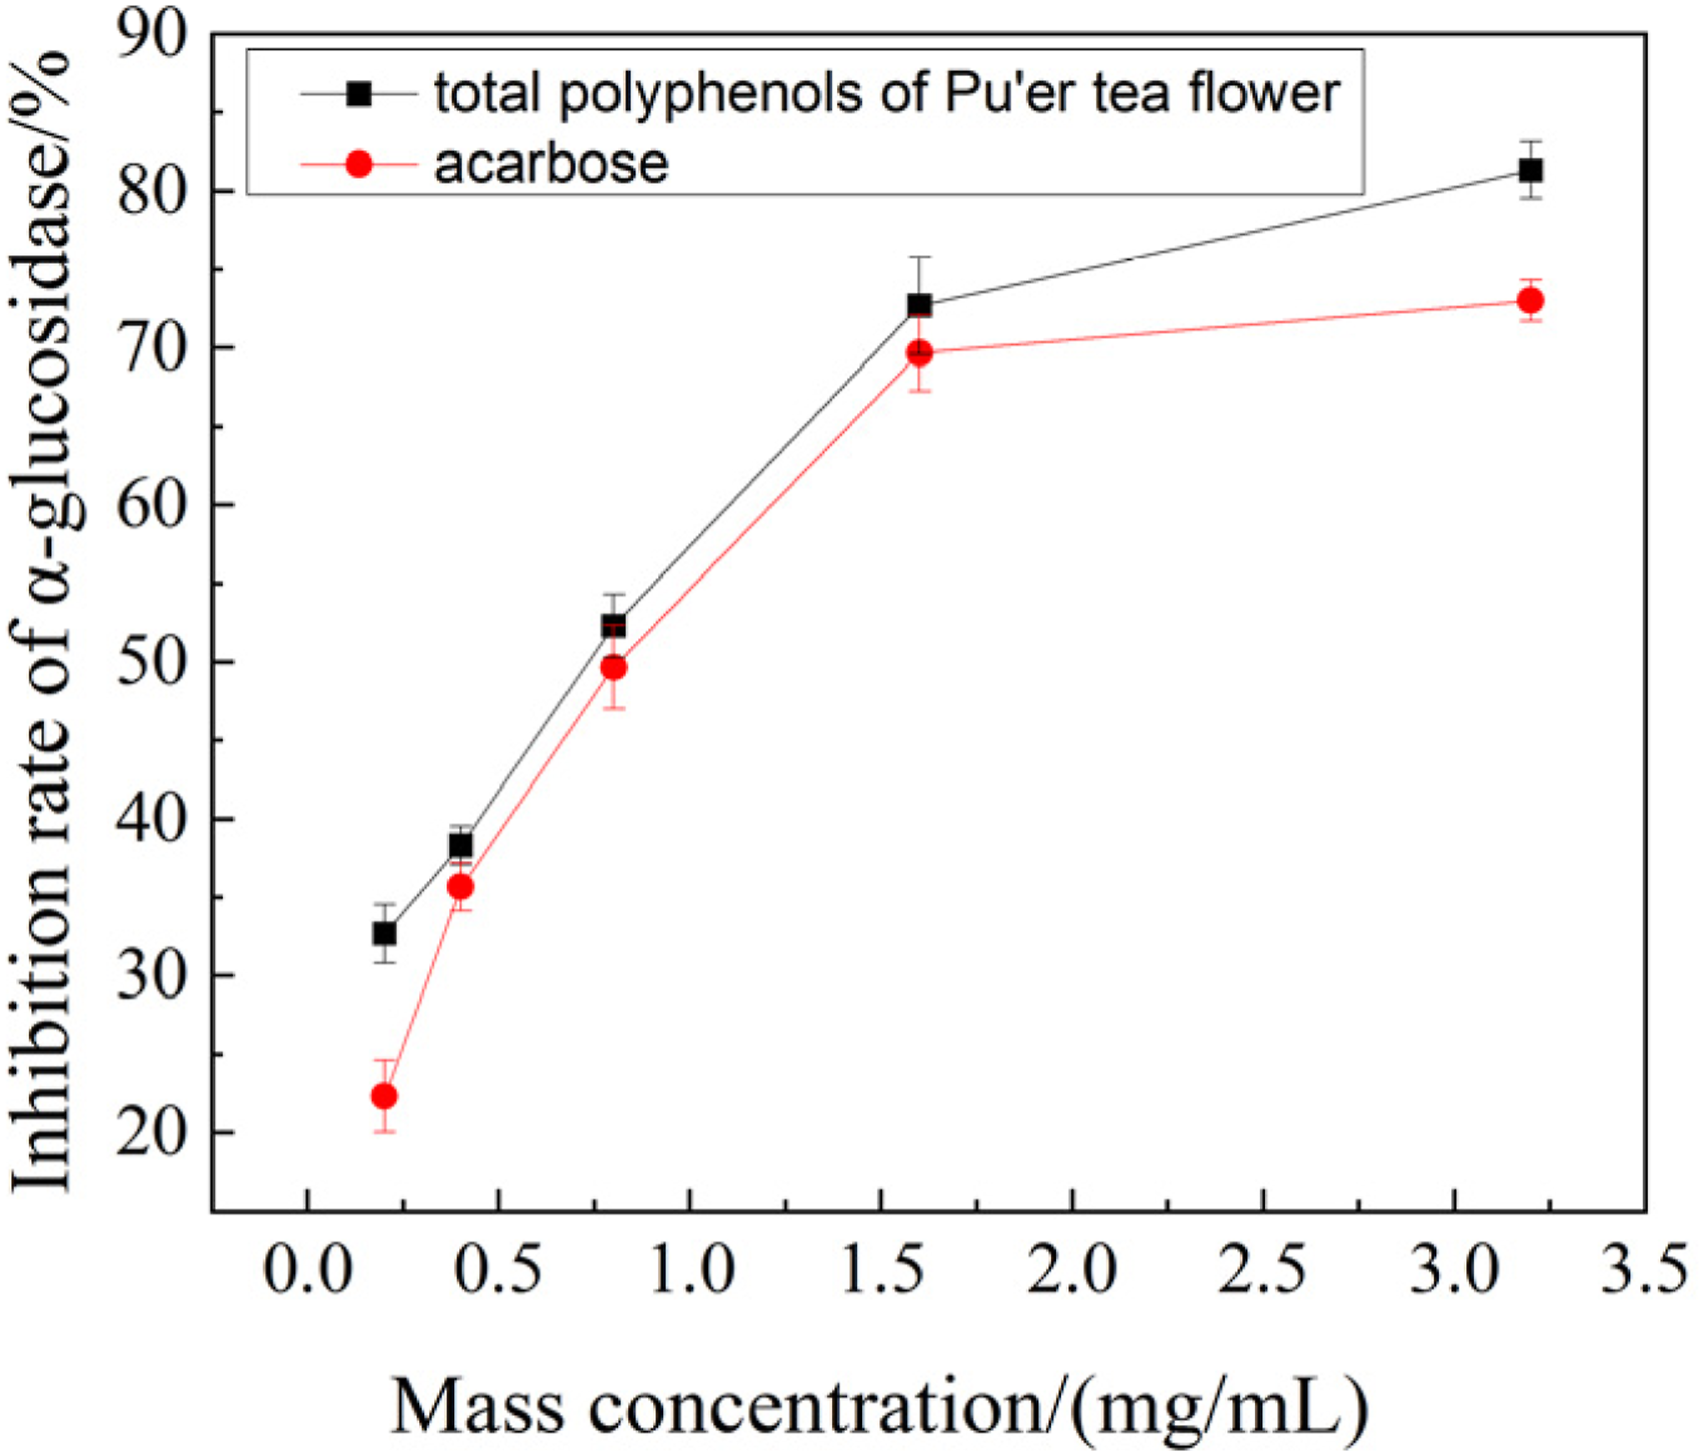
3.5. Bile Salt Binding Experiment
The degradation products of cholesterol are mainly bile salts such as sodium glycocholate and sodium taurocholate. If polyphenolic compounds bind to bile salts, the reabsorption of bile salts in the intestine can be reduced, thereby achieving the purpose of lowering blood lipids.
41
As shown in Figure 12, the binding rates of total polyphenols from Pu’er tea flowers to sodium taurocholate and sodium glycocholate increase with the increase of concentration in the range of 1-6 mg/mL. When the con-centration is 6 mg/mL, the binding rates to sodium taurocholate and sodium glycocholate are 65.05% and 56.96% respectively, with IC50 values of 2.49 mg/mL and 4.40 mg/mL respectively. This indicates that the total polyphenols from Pu’er tea flowers have a good binding capacity to bile salts and have a certain hypolipidemic effect. The binding capacity of total polyphenols from Pu’er tea flower to bile salts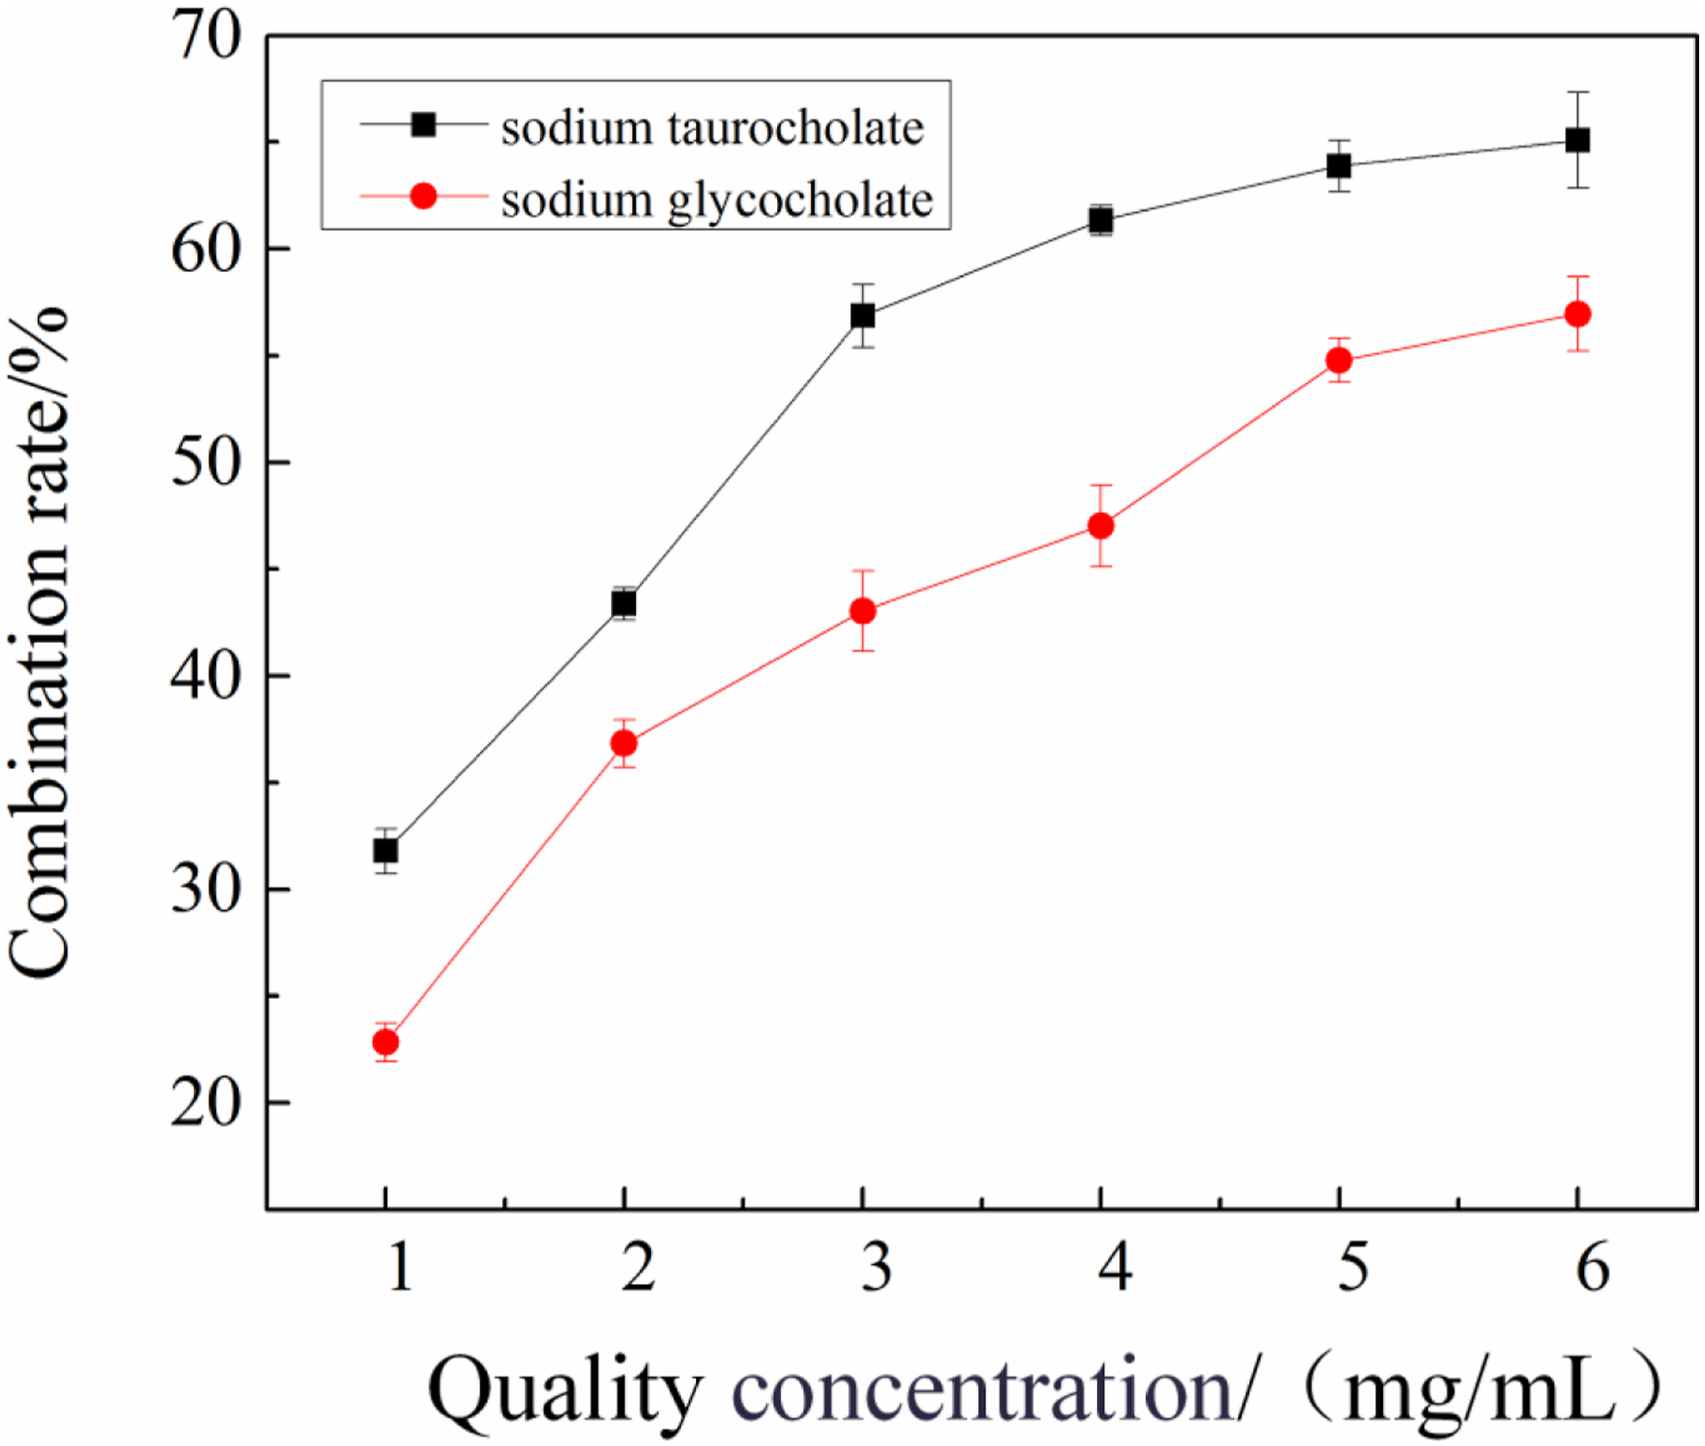
4. Discussion
This study successfully established an efficient ultrasonic-assisted extraction process for polyphenols from Pu’er Tea Flowers, optimized via Response Surface Methodology. The optimal conditions (55% ethanol, 1:45 g/mL, 55°C, 90 min, 480 W) yielded 4.95±0.08 mg/g of total polyphenols. The extracted polyphenols demonstrated significant bioactivities. They exhibited potent antioxidant capacity with IC50 values of 0.068 mg/mL and 0.093 mg/mL for DPPH• and ABTS• scavenging, respectively. Furthermore, they showed notable α-glucosidase inhibitory activity (IC50 = 0.73 mg/mL), comparable to acarbose at higher concentrations, indicating hypoglycemic potential. Additionally, their hypolipidemic effect was evidenced by strong bile salt binding capacity, with IC50 values of 2.49 mg/mL and 4.40 mg/mL for sodium taurocholate and sodium glycocholate, respectively. These research results have confirmed that the polyphenolic substances in Pu’er tea flowers are a natural resource with multiple functions.37,40 Compared with other natural extracts,42,43 they have better physiological activity and are expected to be applied in functional foods and nutritional health products to address issues such as oxidative stress and metabolic disorders.
5. Conclusions
In this work, the high extraction yield achieved under the optimized conditions underscores the effectiveness of ultrasonic-assisted extraction in disrupting plant cell walls and facilitating the release of bioactive compounds. More importantly, the extracted PTPs demonstrated significant bioactivities. Their potent free radical scavenging ability, as evidenced by the low IC50 values against DPPH• and ABTS•, can be at-tributed to the hydroxyl groups in phenolic compounds, which donate hydrogen at-oms to stabilize free radicals. This strong antioxidant capacity positions Polyphenols from Pu’er Tea Flowers as a promising natural alternative to synthetic antioxidants in the food and pharmaceutical industries.
Furthermore, the notable inhibitory effect on α-glucosidase suggests that Poly-phenols from Pu’er Tea Flowers could function as a natural hypoglycemic agent. By delaying carbohydrate digestion and glucose absorption, similar to the drug acarbose but from a natural source, Polyphenols from Pu’er Tea Flowers hold potential for managing postprandial blood glucose levels. Concurrently, the ability of Polyphenols from Pu’er Tea Flowers to bind bile acids in vitro indicates a plausible hypolipidemic mechanism. The binding prevents bile acid reabsorption, forcing the body to utilize cholesterol to synthesize new bile acids, thereby potentially reducing circulating cholesterol levels. The concurrent presence of antioxidant, hypoglycemic, and hypolipidemic activities in Polyphenols from Pu’er Tea Flowers suggests a synergistic potential for managing metabolic syndromes, where oxidative stress, hyperglycemia, and dyslipidemia often coexist. These findings collectively highlight the value of Pu’er tea flowers as a functional material worthy of further development.
Footnotes
Acknowledgments
We thank Mr. Gengwei Liu for providing the Pu’er tea flower samples for this work.

Ethical Considerations
This study did not involve any experiments on live animals. According to the relevant ethical review guidelines and regulations, ethical approval is not required for research that does not include live animal experiments.
Author Contributions
Weiwei Luo: formal analysis, visualization, and writing – original draft. Liyang Sun: formal analysis, validation. Xiaoli Wen: formal analysis, validation. Linlin Lv: investigation, methodology. Guang Xin: methodology, and writing – review and editing. Quanping Diao: conceptualization, funding acquisition, project administration, resources, supervision, and writing – review and editing.
Funding
The authors disclosed receipt of the following financial support for the research, authorship, and/or publication of this article: This research was funded by PhD Initiation Fund of Liaoning Science and Technology Department, Grant/Award Number: 2024-BS-282; Education Department of Liaoning Province, Grant/Award Numbers: LJ212510169008; University Research Project of Anshan Normal University, Grant/Award Numbers: 23asyc003.
Declaration of Conflicting Interests
The authors declared no potential conflicts of interest with respect to the research, authorship, and/or publication of this article.
Data Availability Statement
The authors confirm that the data supporting the findings of this study are available within the article.