






Abstract
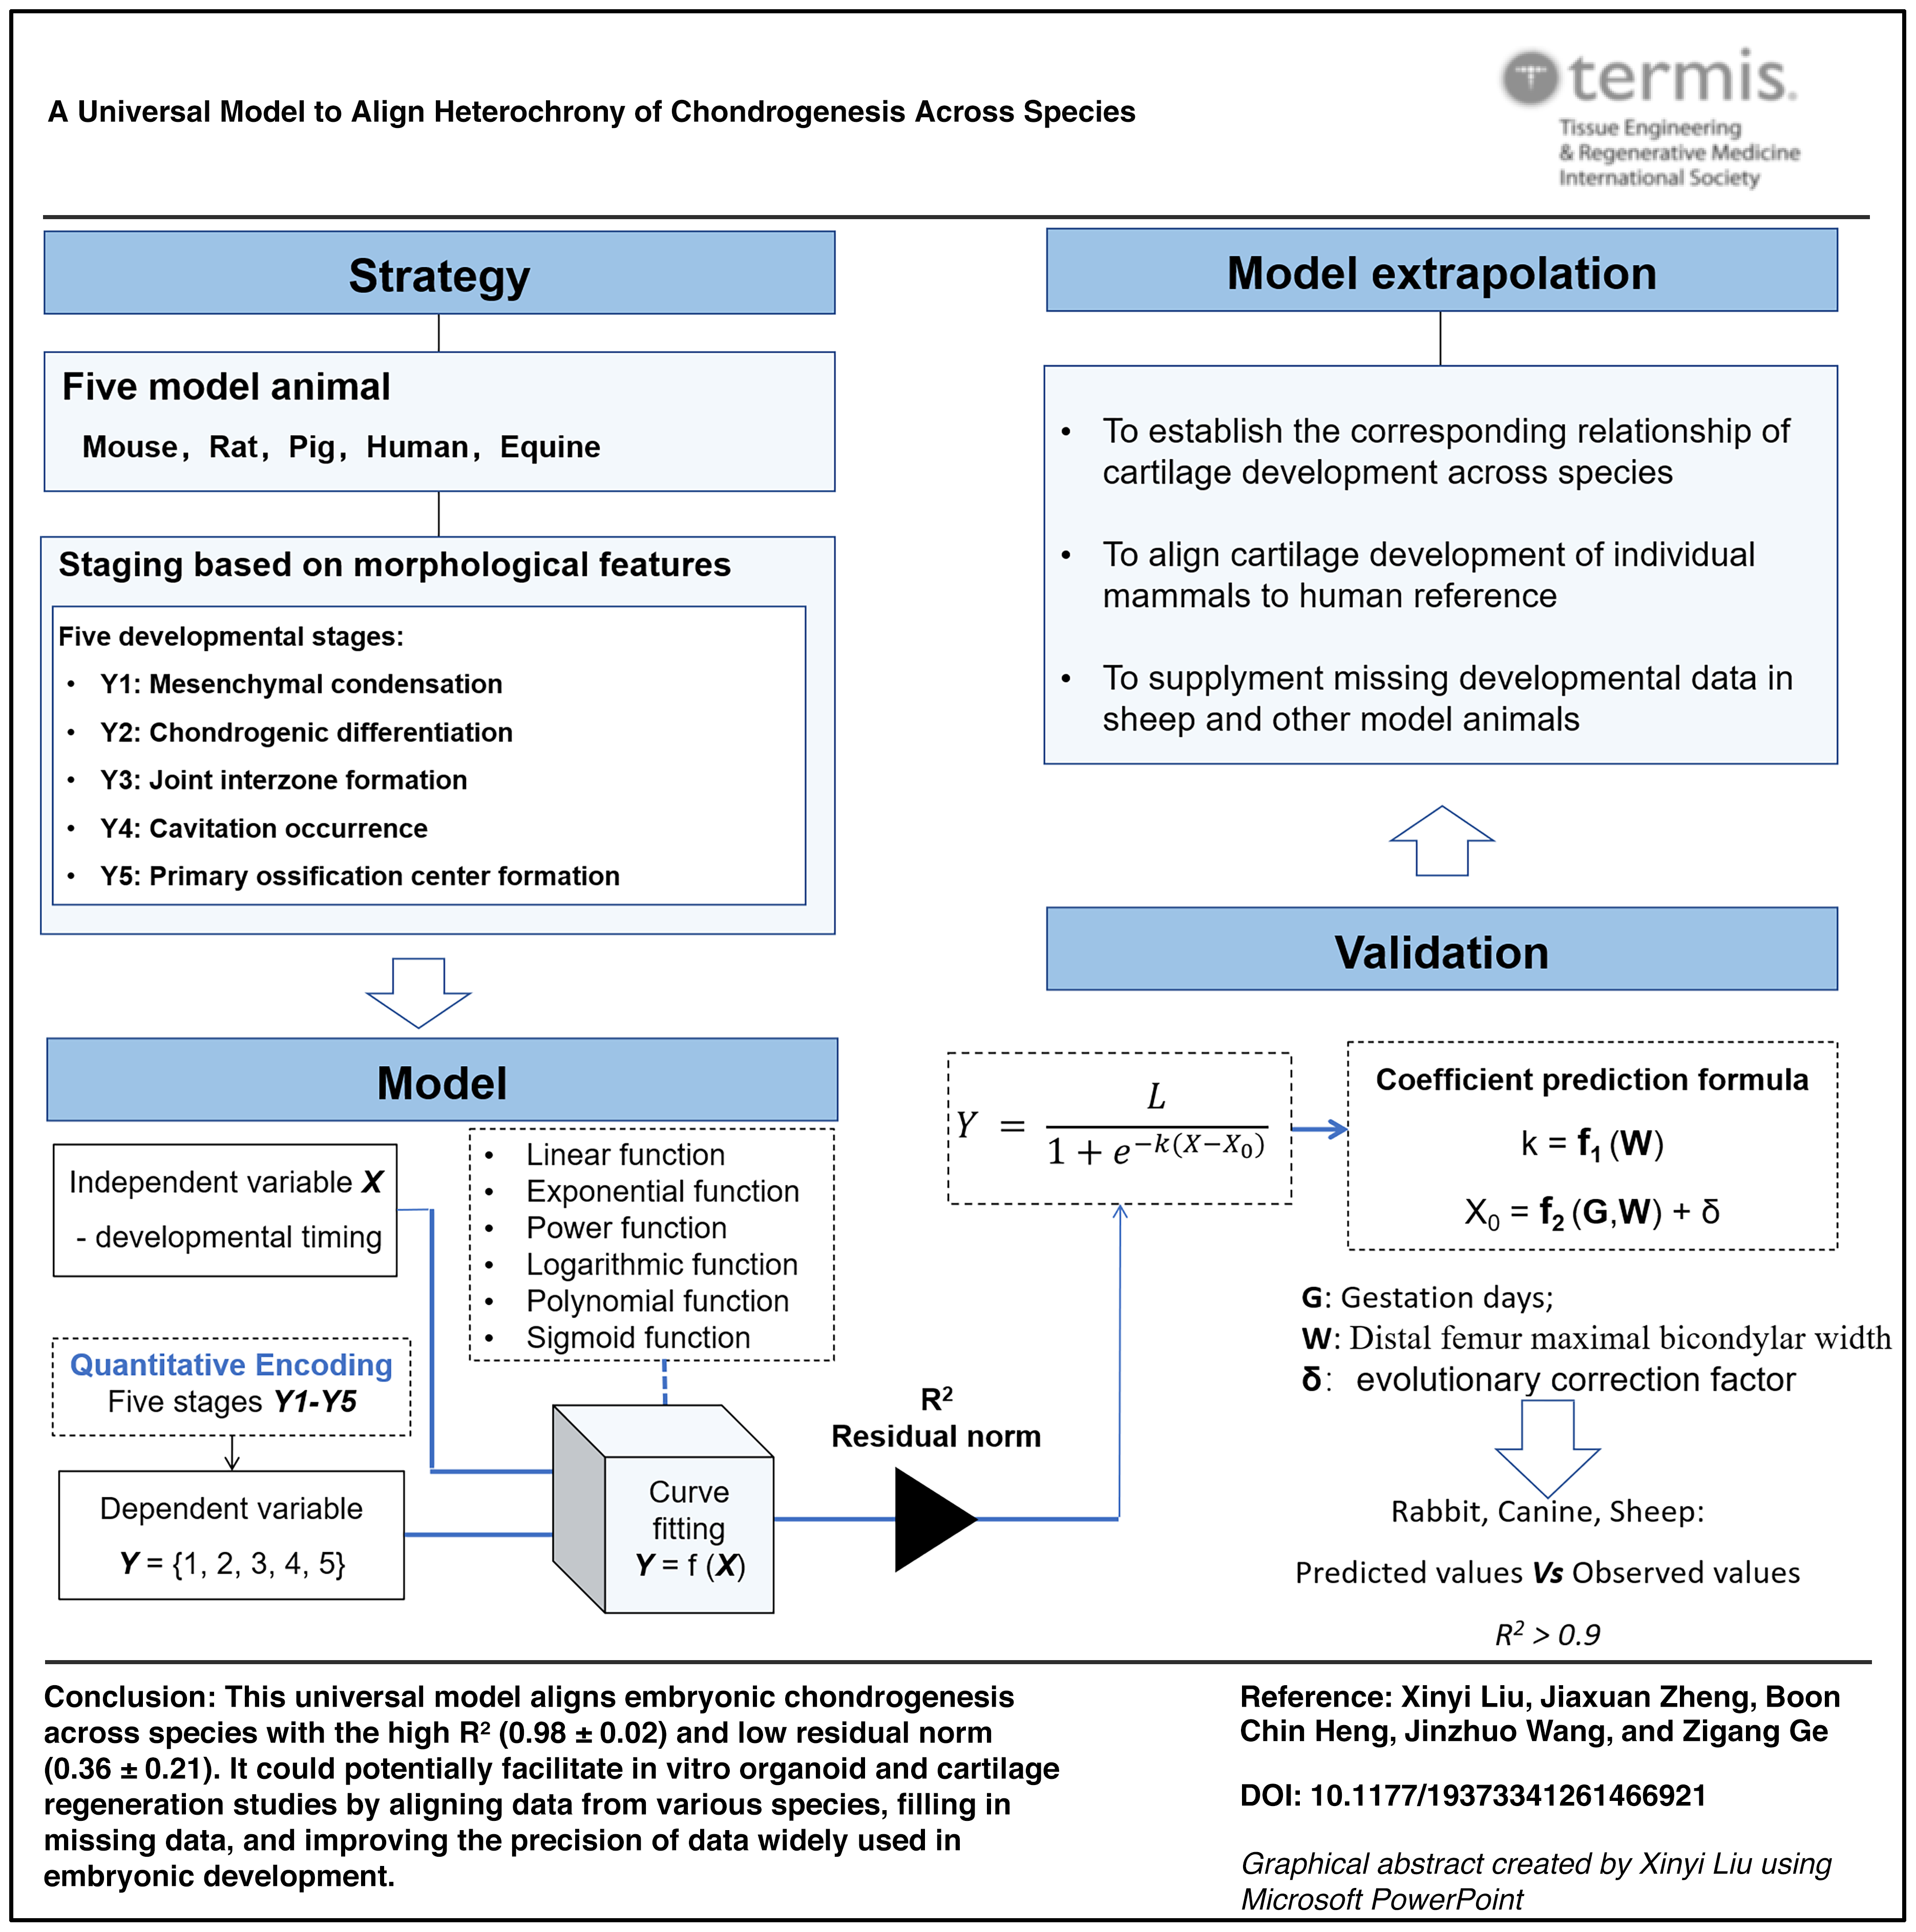
Although embryonic chondrogenesis follows conserved developmental stages across mammalian species, the rate of this process varies significantly. We hypothesized that these varying developmental rates could be normalized and modeled by aligning key developmental milestones of articular cartilage: mesenchymal condensation, chondrogenic differentiation, joint interzone formation, cavitation, and primary ossification center formation. A mathematical model was developed in MATLAB by fitting the developmental curves of these key stages in mice, rats, pigs, horses, and humans. Among various mathematical models, a sigmoid curve model demonstrated the best fit, with the highest R2 (0.98 ± 0.02) and lowest residual norm (0.36 ± 0.21) after normalizing for gestation period and femoral condylar width to account for species-specific differences. The model’s high predictive accuracy (R2 = 0.98) was further validated using data from rabbits, canines, and sheep. By differentiating the developmental curve equation, we determined the developmental rate for each species. Our results indicate that embryonic chondrogenesis occurs within a relatively narrow window of gestation (11–32%), with rodents exhibiting faster rates than larger animals. This study presents the first mathematical model to quantitatively align embryonic chondrogenesis across mammals. This model has the potential to fill gaps in developmental timelines through rational calculation and by improving the precision of developmental timing, factors that have often been overlooked in the field. As a pioneering effort, this work opens new avenues for cross-species alignment and enhances the accuracy of data related to embryonic chondrogenesis.
Impact Statement
As the first mathematical model to align chondrogenesis across different mammals, this work has the potential to enhance the consistency and accuracy of data from various species by correcting inaccuracies and supplementing missing information.
Keywords
Introduction
Functional cartilage regeneration remains a significant challenge, despite considerable progress in recent decades. 1 A significant challenge lies in the inconsistency of findings among animal studies involving different species. 2 This inconsistency stems from the arbitrary use of animal models: studies involving a wide range of mammalian species—from small rodents like mice and rats to large mammals such as rabbits, canines, sheep, pigs, and horses—often employ inconsistent postoperative observation periods (e.g., 4–12 weeks), which are loosely defined as “short-term” or “mid-term” without considering species-specific differences in developmental and regenerative rates. 3 This oversight, along with variability in animal age, anatomical site, and tissue size, leads to irreproducible data and undermines the validity of cross-study comparisons.4,5 A systematic comparison of embryonic cartilage development across mammals could help resolve these disparities, as regeneration is believed to recapitulate developmental processes.
Correlating the regenerative potential of different animal models with that of humans is crucial, but progress has been slow due to the complexity of the factors involved. The cartilage of small mammals is typically thin, small, and has a high cell density,6,7 which contributes to a greater regenerative capacity. 8 In contrast, large animal models have higher proteoglycan content and lower expression of chondrogenesis-related genes, which may impede cartilage regeneration. 9 Additionally, the knee joints of small animals tend to bend to a greater degree than those of large animals, resulting in significant differences in weight-bearing and loading patterns. 10 Allometric scaling laws are widely used to describe the relationship between body size and organ growth in various tissues, 11 while physiological time models are used to align developmental stages across species based on gestation period.12,13 Although comparative studies on heart morphogenesis 14 and skeletal regeneration 15 across species have been conducted, a quantitative model specifically for cartilage development is still needed. Previous cross-species comparisons in cartilage research have focused on either matrix composition or in vitro chondrogenic differentiation,16–18 but have not addressed the temporal dynamics of chondrogenesis during embryogenesis. It is essential to align the chondrogenesis process in model animals with that in humans and to determine whether the developmental rate is consistent across different animal models.
Embryonic chondrogenesis is highly conserved across species, even though there are many anatomical disparities among various species.6,7 Embryonic development is traditionally elucidated based on morphological features. 19 Development of joint cartilage is highly conserved across diverse animal models, from mice, rabbits, canines, pigs, equines, to humans. 20 It begins with the emergence of the limb bud and subsequent mesenchymal condensation. With increased expression of N-cadherin and enhanced cell–cell contact, condensed mesenchymal cells initiate chondrogenic differentiation, characterized by the expression of type II collagen (COL II) and proteoglycans, 21 which are regulated by Sox 5, 6, and 9. 22 As development progresses, a region of prechondrogenic cells, known as the joint interzone, forms at future joint sites. Wnt and FGF signaling are necessary to influence the fate of interzone cells. 23 Joint cavitation then occurs, creating a space filled with a fluidic extracellular matrix. Subsequently, some of the primary cartilage tissue transforms into a primary ossification center, with hypertrophy of chondrocytes in the deep layer. The remaining cartilage continues to develop into mature articular cartilage with specific mechanical properties.24,25 While most of the significant morphological changes in articular cartilage occur during embryonic development, cartilage remodeling and matrix deposition take place during postnatal development, 26 mainly due to mechanical load and subsequent hydrostatic fluctuation and associated metabolic changes. 27 The changes primarily occur at the molecular level within the extracellular matrix, including collagen crosslinking, collagen isoform composition, proteoglycans, and collagen structure. These processes require more complex experiments to construct models of cartilage maturation, yet small animal models rarely provide sufficient extracellular matrix data, making them difficult to use for simulation. Thus, the postnatal cartilage maturation is not considered in this mathematical model.
Species heterochrony, or variation in the timing of developmental events, is evident in the pace of ontogeny. Small mammals typically develop more rapidly than their larger counterparts. 28 However, each embryonic stage may have a different developmental rate due to variations in hormones and tissue sizes. It is crucial to align these varied developmental rates rationally and quantitatively across species. In this study, we defined chondrogenesis by five key stages and collected data for these stages in five model animals (mouse, rat, pig, human, and horse). We then fitted various curves to these data to establish a mathematical model for chondrogenesis. The resulting model was further validated using chondrogenesis data from rabbits, canines, and sheep.
Method
Data sources
Data on the timing of five key events and gestation periods in different species were collected from research articles on PubMed. A search of PubMed was conducted in January 2025 using the following terms: “(mouse OR rat OR pig OR human) AND (cartilage OR joint OR knee) AND (development OR mesenchymal condensation OR chondrogenesis OR joint interzone formation OR cavitation occurrence OR primary ossification center formation).” The inclusion criteria were research articles published in English. The collected information is summarized in Supplementary Table S1.
Time points of key stages
Mesenchymal condensation, chondrocyte differentiation, joint IZ formation, joint cavitation, and matrix maturation were defined as the five key stages (labeled
Curve fitting
The time points (
Cross-species comparative analysis of cartilage evolution
Analysis of similarity of key molecules
Protein sequences of SOX9 and COL II were retrieved for each species. Sequence alignment was performed to calculate the sequence similarity between each species and humans. Furthermore, signaling pathways involving the SOX9 gene were searched in the database, and those related to cartilage development were selected. The complexity of the SOX9 gene during evolution was then analyzed.
Evaluation of phylogenetic signals for coefficients k and X0 in the mathematical model
A phylogenetic tree for the nine species (rat, mouse, human, pig, equine, rabbit, canine, sheep, and goat) was constructed based on the NCBI taxonomy backbone. Branch lengths were calibrated using divergence times derived from TimeTree (timetree.org). Concurrently, the species phylogenetic tree file in Newick format was imported using the read.tree function from the ape package. Pagel’s λ and Blomberg’s κ were calculated to test the evolutionary signal. The phylosig function from the phytools package was used. The software automatically calculated the value of λ and κ for both
Validation of the established model
The intercondylar width of the distal femur (W) was set as the independent variable, and the coefficients k of the chondrogenesis curve were set as the dependent variables. Among linear, polynomial, power law, and rational function fittings, the fitted curve with the highest R-squared value was selected.
The complete 9 × 9 phylogenetic tree topology was transformed into a continuous distance matrix that quantifies the precise evolutionary proximity between all species pairs based on ancestral divergence time. During the training phase, a universal physiological baseline formula was established using gestation period (
Data on the time points of the five key events and gestation periods in different species were collected from research articles on PubMed as previously described. A search of the PubMed database was conducted in January 2025 using the following terms: “(rabbit OR canine OR sheep OR goat) AND (cartilage OR joint OR knee) AND (development OR mesenchymal condensation OR chondrogenesis OR joint interzone formation OR cavitation occurrence OR primary ossification center formation).” The inclusion criteria were research articles published in English. The gestation period (G) and intercondylar width of the distal femur (W) of rabbits were used to calculate the coefficients of the chondrogenesis curve function. The time points for the five key stages were then calculated (Supplementary Table S1).
Results
Embryonic chondrogenesis begins earlier in gestation and has a shorter relative duration in large animals compared to small animals
Embryonic chondrogenesis from mesenchymal condensation to primary ossification center formation takes a relatively longer time in pigs, humans, and horses (22, 49, and 35 days, respectively), compared to rodents such as mice and rats (5 and 7.25 days, respectively) (Fig. 1a and Supplementary Table S2). The duration of embryonic chondrogenesis is positively correlated with the maximal bicondylar width of the distal femur (Fig. 1b), but not with cartilage thickness (Supplementary Fig. S1). The relative time of chondrogenesis across species was derived by dividing the day of each key event by the gestation period (Fig. 1c). Embryonic chondrogenesis from mesenchymal condensation to primary ossification center formation occurs over a relatively shorter percentage of the gestation period in pigs, humans, and horses (19%, 18%, and 11%, respectively) compared to mice and rats (25% and 32%) (Fig. 1c). The ratio of the chondrogenesis period to the gestation period is broadly conserved across mammalian species (21% ± 7.9%). Embryonic chondrogenesis occurs relatively earlier in large animals and relatively later in rodents. The timing of the start of chondrogenesis is positively correlated with the gestation period. Moreover, differences in relative time are also observed between mice and rats, although both belong to the same rodent group. This finding suggests that the relative time of cartilage development may also be associated with other factors, such as the distal femur maximal bicondylar width mentioned above.
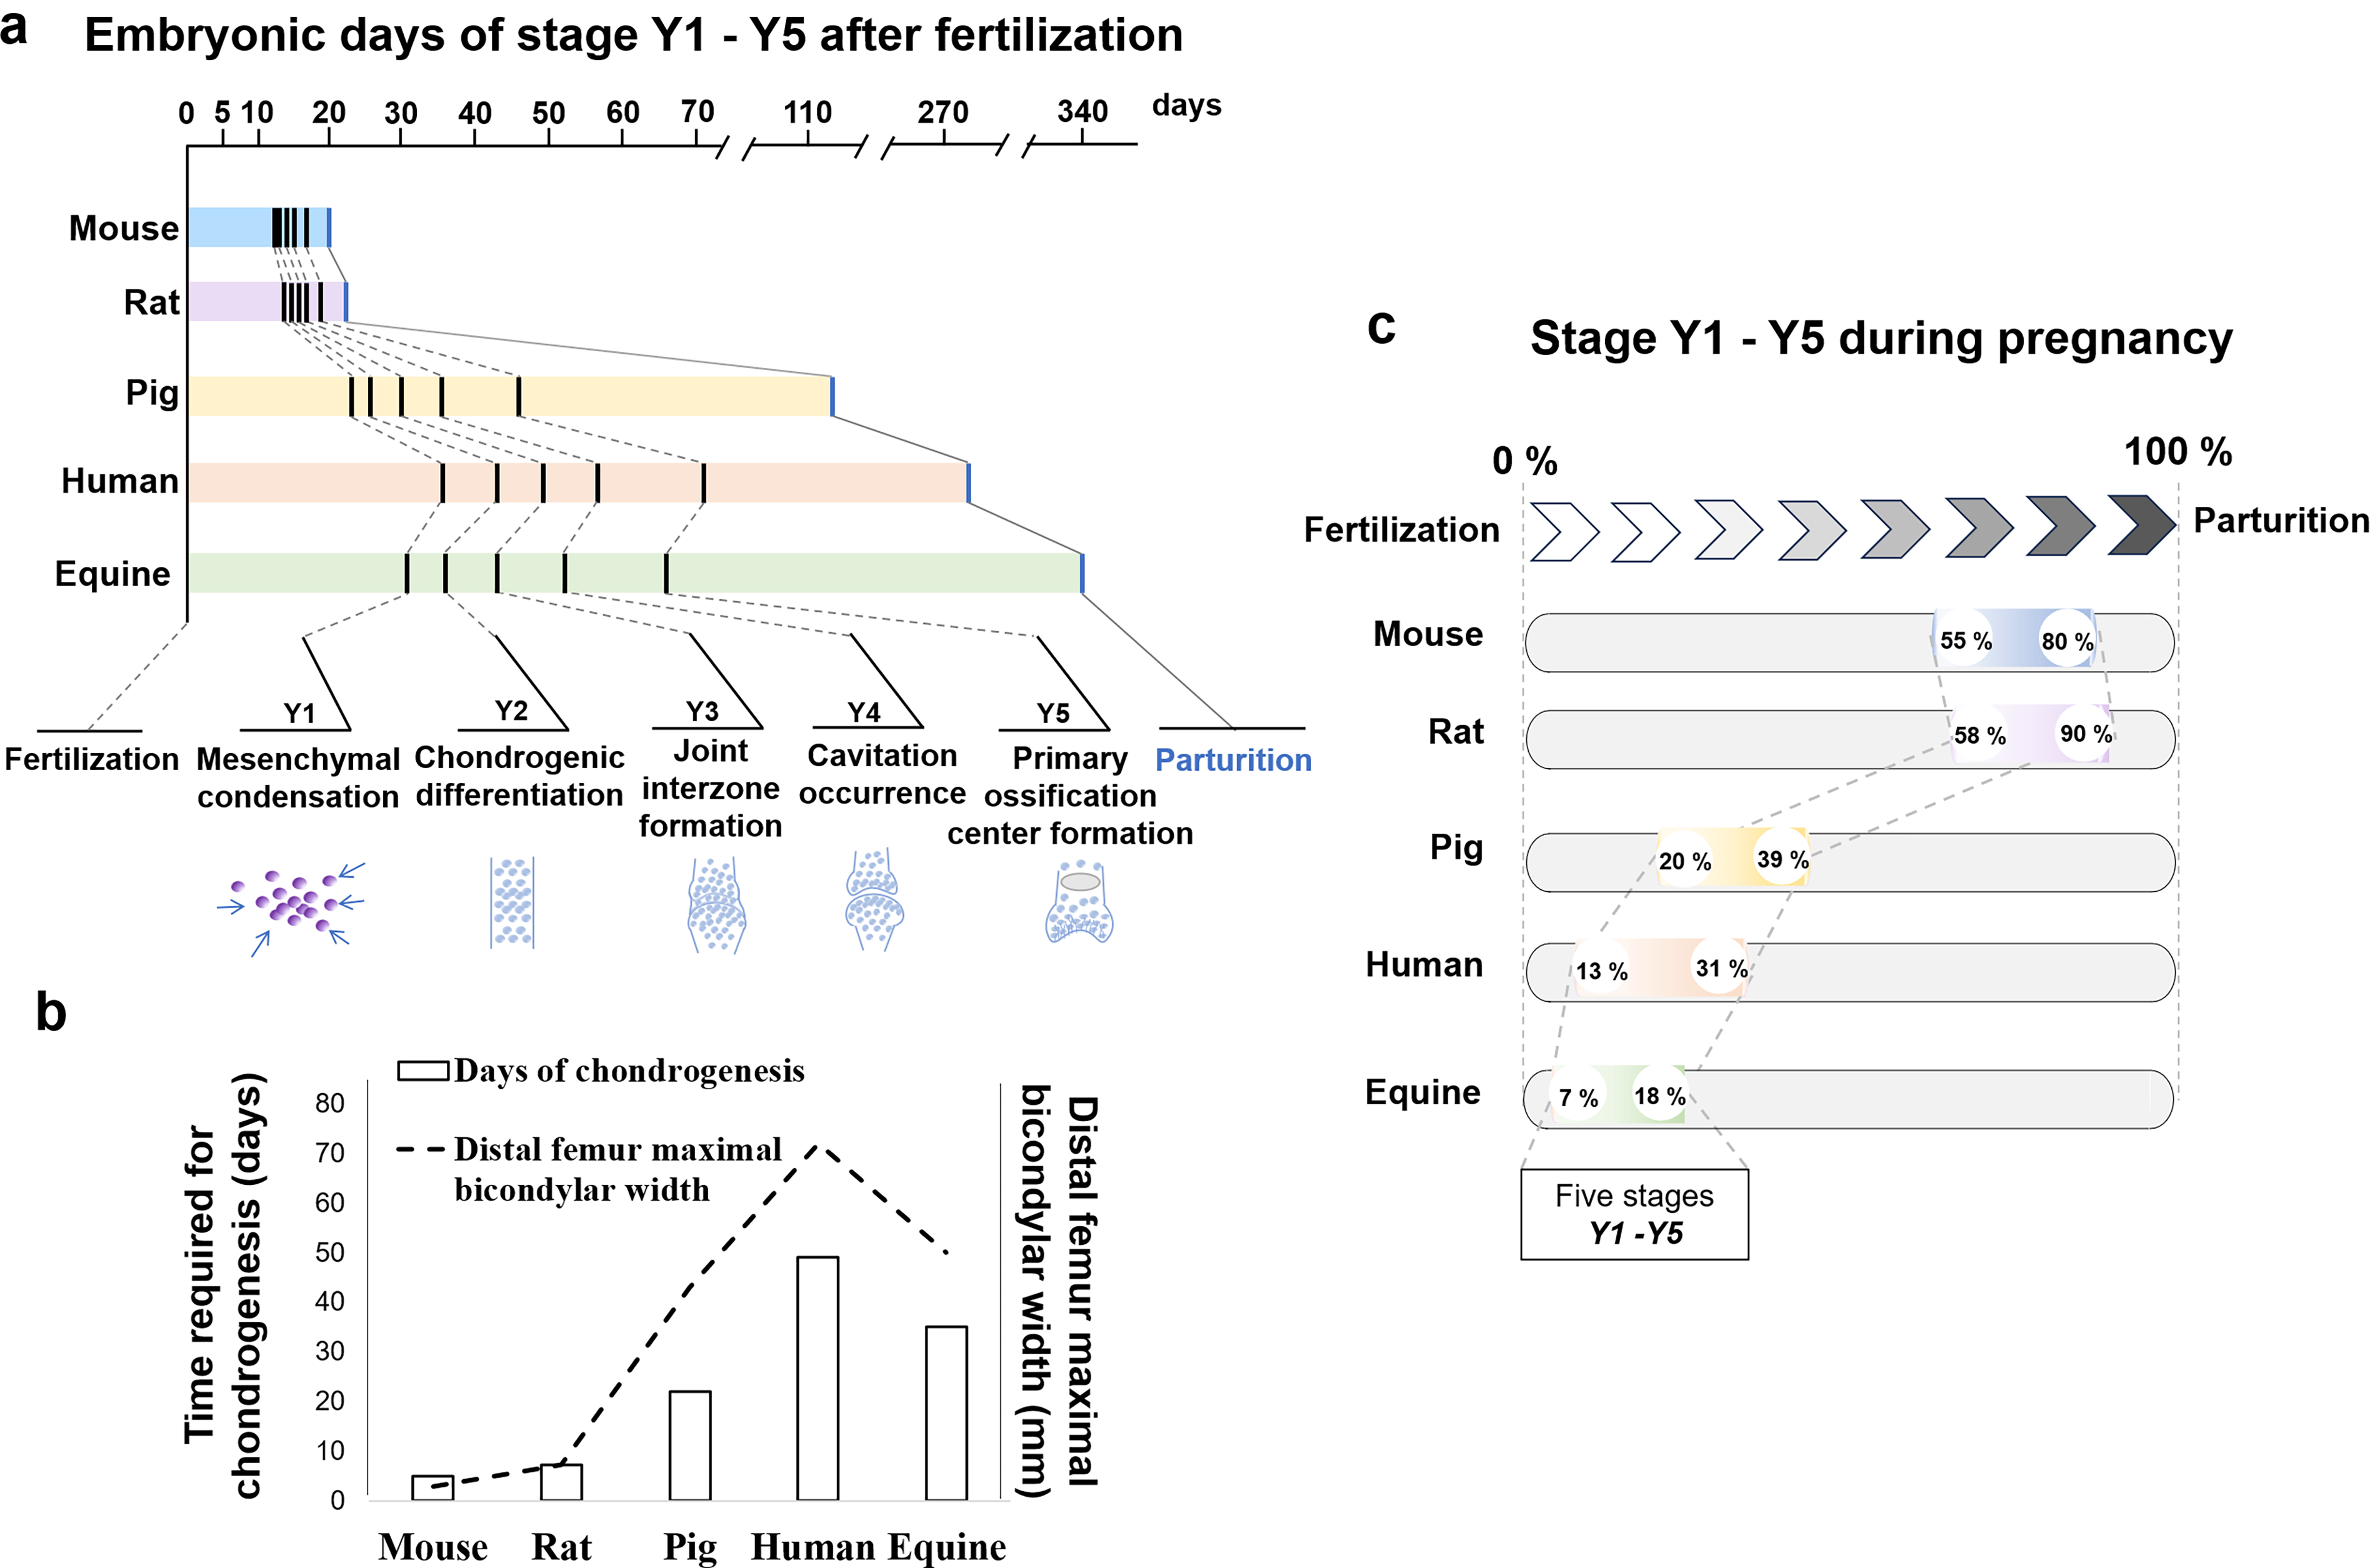
Analysis of chondrogenesis time points across species.
A sigmoid curve was found to be the optimal fit for the developmental curve among six different function types. Six different types of function curves were fitted using MATLAB (Supplementary Fig. S2a–e). The polynomial and sigmoid function curves were the most suitable, with higher average R2 values (>0.98) and lower average residual norms (<0.4) (Fig. 2a and b). Although both the polynomial and sigmoid curves yielded high R2 values and low residual norms, the polynomial curve showed marked inconsistency across species. Specifically, the data points for mice and rats were restricted to the region before the inflection point, whereas those for large animals (e.g., pigs, humans, and horses) were distributed across both the ascending and descending limbs of the curve (Supplementary Fig. S2e). This pattern suggests that a single polynomial function cannot capture the unified developmental trajectory of chondrogenesis across species.
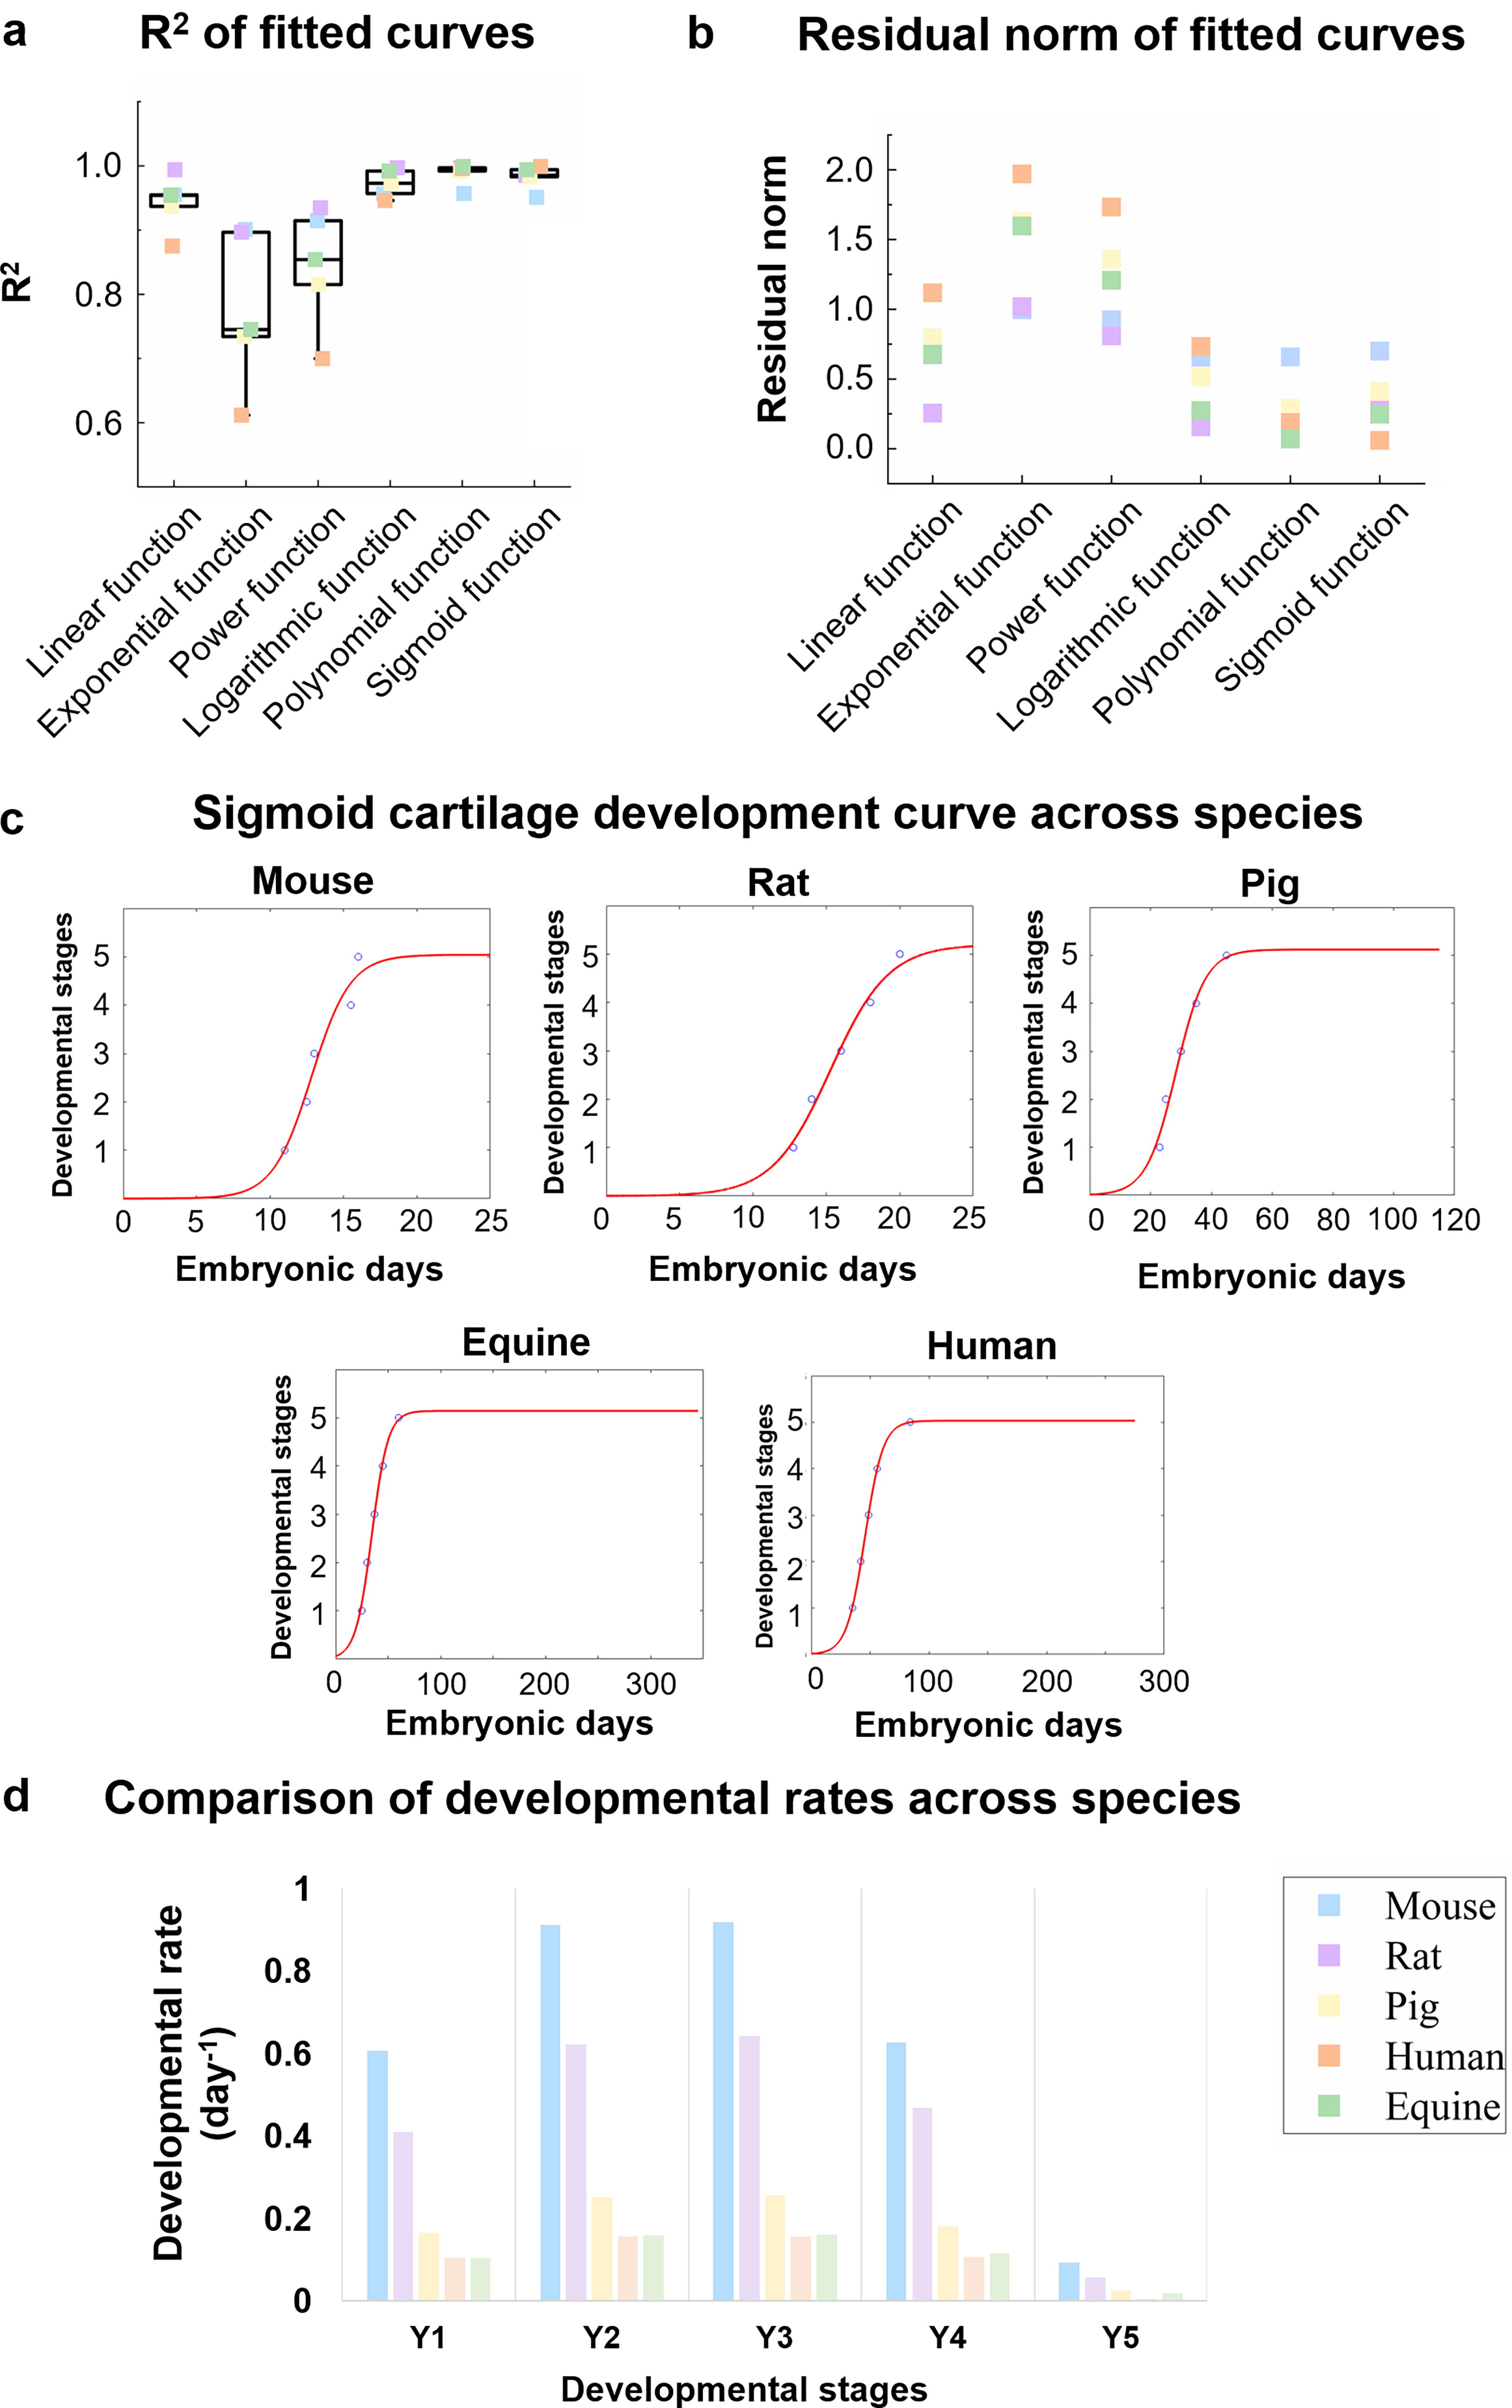
Sigmoidal curve as the optimal fit for cross-species chondrogenesis modeling.
The final growth trajectory of embryonic chondrogenesis is characterized by an initial lag phase, followed by exponential progression and an eventual plateau. These five mammalian species follow the same developmental pattern for cartilage (Fig. 2c). The equation for the sigmoidal curve is as follows:
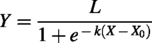
In the sigmoidal curve,
Chondrogenesis is not a uniform process; rodents develop more quickly than large animals at each stage
The progression of chondrogenesis in all observed animals follows a biphasic pattern, characterized by an initial rapid phase succeeded by a slower phase (Fig. 2d). Embryonic chondrogenesis in rodents, specifically mice and rats, progresses significantly faster than in larger mammals such as pigs, horses, and humans at every developmental stage. Among the larger mammals, chondrogenesis in human and equine exhibits the slowest developmental rates. Despite variations in individual animal developmental rates, the ratios of chondrogenesis developmental rates relative to humans remained consistent from stages Y1 to Y4. Specifically, mice developed 5.9 ± 0.02 times faster, rats 4.1 ± 0.21 times faster, and pigs 1.6 ± 0.04 times faster, while equine development was comparable at 1.0 ± 0.04 times the human rate. An anomaly observed at the final stage (Y5) is likely attributable to a curve-fitting discrepancy (Supplementary Fig. S3). However, when comparing gestation periods, mice developed 13.7 times faster than humans, rats 12.4 times faster, and pigs 2.4 times faster, whereas equine development was 0.8 times slower. The disparity between embryonic and chondrogenesis developmental rate ratios indicates that tissue development proceeds independently and is not solely dictated by the overall organismal developmental rate.
A universal model of embryonic chondrogenesis, referred to as the PKU model, has been established based on the common patterns observed across various mammalian models
To ensure this model’s applicability to all mammals, it is crucial to analyze the relationship between sigmoid curve coefficients and predictive parameters such as gestation period, intercondylar width of the distal femur, cartilage thickness, and the coefficient of evolutionary relatedness among species. The rate of chondrogenesis was associated with condylar width, and its timing was influenced by both gestation period and condylar width. Consequently, gestation days and condylar width emerged as suitable predictive parameters. Conversely, there was no significant correlation between cartilage thickness and either the timing or rate of chondrogenesis (Supplementary Fig. S1). These mammalian models exhibit high evolutionary conservation. Phylogenetically, both rats and mice are more closely related to humans (Fig. 3). Although eight animal species diverged from humans over 80 million years ago, their chondrogenesis-related proteins, specifically SOX9 and COL II, demonstrated similar expression patterns in these model mammals compared to humans (Supplementary Table S4). To explore potential phylogenetic bias and enhance the predictive power of the mathematical model, the correlation between evolutionary distance and cartilage development was validated using Pagel’s λ and Blomberg’s κ, which are standard metrics for quantifying phylogenetic signal in biological traits.29,30 Both Pagel’s λ and Blomberg’s κ values for the days of chondrogenesis and coefficient
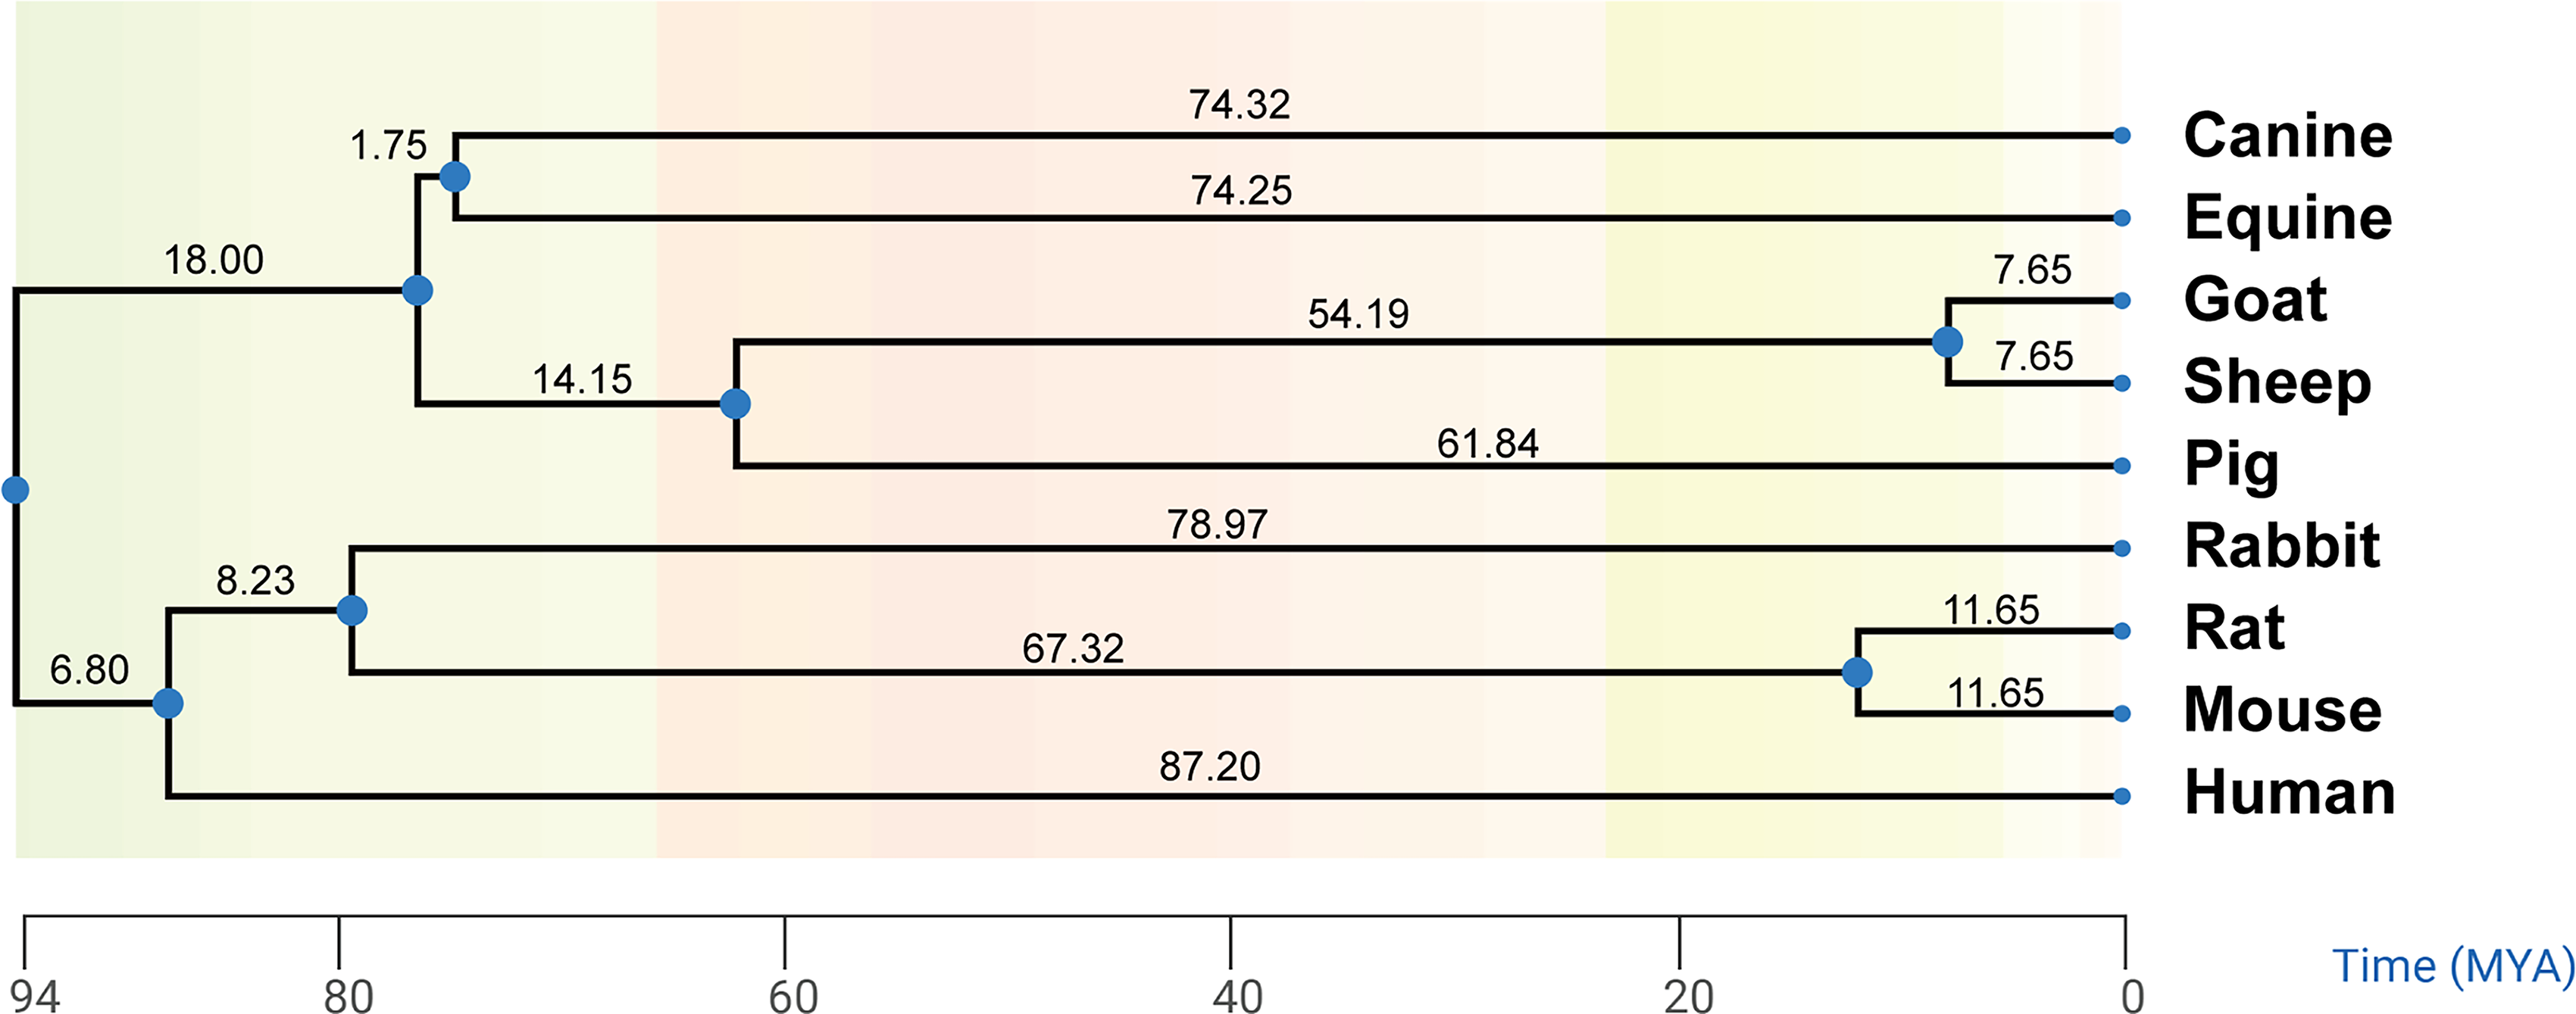
Phylogenetic divergence of eight animal species from humans. All eight animal species analyzed diverged from human beings more than 80 MYA on the phylogenetic tree. MYA, million years ago.
First, by observing the trend of the dependent variable as a function of the independent variable, the coefficient L was found to be nearly constant. Since L represents the maximum theoretical value that the dependent variable Y can reach at the key stage, the average of the five fitted values was used. The coefficient k represents the maximum possible rate of chondrogenesis. According to the findings above, the absolute time required for chondrogenesis is strongly correlated with the femoral condylar width. Through multiple fitting methods, a fractional model was selected. The coefficient X0, representing the midpoint of cartilage development progression, was observed to correlate not only with width but also with the gestation period. Furthermore, the prediction formula for X0 (G, W) required a phylogenetic correction, given that




The PKU model was effectively validated with high accuracy. The predicted time points of the developmental stages are shown in Supplementary Table S8. The high accuracy of these predictions solidified the established model (R2 = 0.98). The predicted time points are useful for complementing the timing of key stages in other mammals, which is critical for studies in developmental biology and for animal sampling.
Discussion
Embryonic chondrogenesis in the mammalian species used as cartilage regeneration models is evolutionarily conserved, which provides a solid basis for the current study. From mice, rats, rabbits to sheep, goats, and horses, these animal species differ significantly in size, gestation, and life expectancy. They share the exact same gene regulatory network of chondrogenesis. 31 Whereas, however, there are significant disparities regarding the size of the joint and body, gestation, and life expectancy. Although the sizes of the joints and bodies in varied mammals differ, sizes of the cells composed of them are similar, which led to the hypothesis that the large animal species may need a longer duration for the cells to proliferate and secrete matrix. The embryonic chondrogenesis process across five mammalian species was systematically compared. The time required for chondrogenesis is much longer in large animals, while the relative time, expressed as a percentage of gestation, is shorter. This may be due to a compression of the developmental time window. The expression of the genes Gdf5 and Sox9 decreases, while Col2a1 remains relatively stable after cavitation occurs. 32 The tissue must form completely within the window of high expression of related genes. The stronger association with femoral width rather than cartilage thickness suggests that the rate is limited by the volume of the joint, not the rate of matrix deposition. Furthermore, the overall coordination of the development of the knee joint may also affect the occurrence and development of cartilage tissue.
Ratios of developmental rates compared to humans are stable from stages Y1 to Y4 among individual species, although the ratios are different between different species. Mouse chondrogenesis proceeds approximately 5.9 times faster than that of human chondrogenesis, despite the gestation period being 13.7 times shorter. This discrepancy implies that the chondrogenic module is consistent with allometric principles in developmental biology. 33 This difference between cartilage and the overall organismal development probably occurs because it responds differently to certain signals, such as thyroid hormone 5 and insulin-like growth factors. 34 It may be because the inner workings of the genes that control chondrocytes develop at different speeds. A unified sigmoidal model, parameterized by gestation length and bicondylar width, can accurately predict the progression of cartilage development across species. The evolutionary conservation of chondrogenesis provides a solid basis for a cross-species model. 35 Vertebrate mammals undergo the same stages of articular cartilage development. 36
While the PKU model demonstrates high predictive accuracy with current parameters, its explanatory power and precision will undoubtedly benefit from the integration of additional layers of biological complexity. One immediate frontier for model refinement is the explicit inclusion of metabolic rate parameters. Embryonic chondrogenesis is an energetically demanding process, requiring extensive synthesis of extracellular matrix proteoglycans and collagens. The basal metabolic rate and cellular anabolic flux differ dramatically between rodents and large mammals. 37 Incorporating empirical data on local oxygen tension, glucose utilization rates, or the activity of nutrient-sensing pathways (e.g., mTOR signaling in the growth plate) could provide a more mechanistic basis. 38 Epigenetic modifications and microRNA networks serve as critical rheostats in chondrogenesis, modulating the stability and translation of key messenger RNAs. 39 For example, species-specific differences in CpG island methylation at the promoters of Sox9 or Runx2 could fine-tune the timing of cartilage development. 40 Future work should combine this temporal framework with comparative transcriptomics to identify the cis-regulatory changes that accelerate chondrogenesis in rodents. Specifically, differences in the binding affinity of key transcription factors like Sox9 to their targets may underlie the observed variation in k.
Conclusions
To the best of the authors’ knowledge, this is the first effort to establish a cross-species alignment of embryonic chondrogenesis. This work could potentially facilitate in vitro organoid and cartilage regeneration studies by aligning data from various species, filling in missing data, and improving the precision of data widely used in embryonic development. Since cartilage development serves as a critical template for regeneration studies, elucidating the ratio of the developmental rate of other animals to that of humans may facilitate the translation of experimental findings to clinical applications, thereby accelerating the clinical translation of basic research. However, the current model relies on a small sample size, which may limit its precision. Future studies integrating additional variables, such as embryonic hormone levels and cellular activity, could further enhance the accuracy of the model.
Authors’ Contributions
X.L.: Conceptualization, investigation, data analysis, and writing—original draft. J.Z.: Data analysis and writing. B.C.H.: Writing—review and editing. J.W.: Conceptualization, review, and editing. Z.G.: Conceptualization, supervision, and writing—review and editing.
Supplemental Material
sj-docx-1-tea-10.1177_19373341261466921 — Supplemental material for A Universal Model to Align Heterochrony of Chondrogenesis Across Species
Supplemental material, sj-docx-1-tea-10.1177_19373341261466921 for A Universal Model to Align Heterochrony of Chondrogenesis Across Species by Xinyi Liu, Jiaxuan Zheng, Boon Chin Heng, Jinzhuo Wang, and Zigang Ge
Footnotes
Disclosure Statement
The authors declare that there are no conflicts of interest.
Funding Information
This study was funded by the National Natural Science Foundation of China Grant (82472165), the National Key Research and Development Program of China (2023YFB3809903, 2023YFC3604900), and the Project “Vice President of Science and Technology” of Changping District, Beijing (202408002038). The funder played no role in the study design, data collection, analysis and interpretation of data, or the writing of this article.
References
Supplementary Material
Please find the following supplemental material available below.
For Open Access articles published under a Creative Commons License, all supplemental material carries the same license as the article it is associated with.
For non-Open Access articles published, all supplemental material carries a non-exclusive license, and permission requests for re-use of supplemental material or any part of supplemental material shall be sent directly to the copyright owner as specified in the copyright notice associated with the article.
