
Abstract
Objectives:
The present study investigates whether space syntax offers appropriate tools for identifying risks of aggression, interventional opportunities, and environmental design strategies to reduce the risk of Type II violence in emergency departments.
Background:
Although healthcare workers are a relatively small percentage of the U.S. workforce, they sustain almost 75% of workplace assaults. Poor environmental design has been identified as an antecedent to aggression by patients and/or their companions.
Method:
Guided by Rational Choice Theory, Lifestyle Exposure Theory, Routine Activity Theory, and Crime Prevention through Environmental Design (CPTED), the study uses five visibility graph analysis (VGA) measures: visibility, control, controllability, mean visual depth, and occlusivity. Three U.S. hospital-based emergency departments were selected. First, a VGA was performed on all three layouts. A second VGA was performed after excluding unconnected spaces, and a third was performed on key patient and staff areas. Last, a fourth VGA was conducted after performing physical modifications to the three departments.
Results:
Statistical analysis revealed significant differences in VGA measures not only between different layouts but also between the original and modified layouts. Specifically, small changes created by architectural features can affect visual access and exposure as measured by space syntax. Alcove-style spaces in key staff areas are also associated with limited visual control of the local environment. Typically, in smaller zones, central staff workstations afford better control of patient spaces.
Conclusion:
This study shows that space syntax analysis is a useful tool for identifying risks of aggression in hospital spaces and for identifying interventional opportunities.
Keywords
Workplace violence among healthcare workers is a global problem. In the United States, healthcare workers constitute 12% of the workforce but sustain nearly 75% of workplace assaults (Lebron, 2020; Philips, 2016). Between 2010 and 2013, the U.S. Occupational Health and Safety Administration reported 24,000 healthcare employee assaults (Gooch, 2018), and studies find that approximately 78% of physicians experience some degree of workplace violence each year (Behnam et al., 2011; Phillips, 2016). While the rate of violent crime in hospitals in the United States increased from 2012 to 2015, 44% of the incidents were aggravated assaults, and nearly half (46%) occurred in emergency departments (EDs; Gooch, 2018). In the United Kingdom, data show that National Health Service employees are subject to workplace violence four times more often than other workers (AbuAlRub & Khawaldeh, 2014), and in Australia registered nurses experience more violence-related injuries than either police or correctional officers (Crilly, 2004). One Australian study reported that ED nurses experience some form of violence almost weekly (Lyneham, 2001).
The most prevalent form of workplace violence among healthcare workers is Type II aggression, which is defined as “an assault committed by a recipient of a service against someone providing that service” (Simonowitz, 1995, p.121). Several studies find that emergency room staff have the highest risk of violence by patients and visitors (Hahn et al., 2012; May & Grubbs, 2002; Roche et al., 2010; Winstanley & Whittington, 2004) and that poor environmental design is a risk factor for Type II aggression (McPhaul et al., 2008). However, the National Institute for Occupational Safety and Health (NIOSH, 1996, 2007) reports that environmental factors can reduce the risk of violence against healthcare workers—examples of which include the spatial configuration of EDs and the clustering layout of patient rooms (Pati et al., 2016; Peek-Asa et al., 2002).
In a recent systematic review of the literature, MohammadiGorji et al. (2020) found that only 15 of 496 articles referenced physical environment attributes (i.e., layout, location, ambient conditions, and equipment) as factors affecting violent incidents and staff security, and only four included environmental design interventions in their research. This scarcity of relevant evidence-based studies calls for methodologically rigorous research to evaluate the impact of healthcare environments on staff security. We know, for example, that the high-risk locations in EDs are the entry zone, waiting areas, triage rooms, treatment areas, and custody/psychiatry rooms (Pati et al., 2016) and that there should be good visibility from the security station (MohammadiGorji et al., 2020). The same review also shows that unobstructed views from the registration desk to points of entry and treatment areas would help to reduce violent incidents in EDs.
A growing body of literature has revealed the impact of healthcare facility layouts on different behavioral outcomes. Using space syntax theories and advanced simulation techniques, researchers have shown how certain spatial attributes of the healthcare setting are linked to wayfinding behaviors, effective communication, and patient satisfaction (Cai & Zimring, 2019; Haq, 2003; Rashid et al., 2014). Although few studies have used space syntax to examine crime opportunities in healthcare settings specifically, space syntax has been used to explore crime opportunities in neighborhoods (Nubani, 2006; Nubani & Wineman, 2005) and academic settings (Kellom & Nubani, 2018).
While the studies show a strong link between environmental design and opportunities for violence, there is a need for a systematic process that quantitatively measures the level of supervision and spatial qualities of layout configurations in EDs for Type II aggression. For this reason, the present study explores the layout of three EDs using visibility-based simulations based on space syntax theories. The study’s main objectives are (1) to investigate whether space syntax analysis is an appropriate method for identifying aggression risks and intervention opportunities and (2) to identify environmental design strategies that might reduce the risk of aggression and improve opportunities for interventions.
Crime-Place Theories
Proposed by Marcus Felson and Lawrence E. Cohen in the 1970s, the routine activity theory emerged as a key theoretical approach to crime. The theory maintains that “most criminal acts require convergence in space and time of likely offenders, suitable targets, and the absence of capable guardians against crime” (Cohen & Felson, 1979, p. 588). Since then, routine activity scholars have focused on strategies to decrease the target’s vulnerability and discourage crime by altering the environment and/or increasing levels of guardianship (Felson, 2006; Jeffery, 1971, 1999). According to this theory, offenders are rationally motivated and will look for places that lack supervision (Cohen & Felson, 1979) because the human element will deter them from committing an offense (Hollis et al., 2013). The routine activity theory is related to a second theory known as the rational choice theory, in which the potential offender appraises the cost/benefit of being observed and their behaviors subject to intervention (Cornish & Clark, 1986; Newman, 1996).
While we would argue that our model does not mean to imply that all patients are criminals, it does mean to suggest that Type II violence is not victimless. We accept that some violence in healthcare settings may result from frustration, fear, anxiety, stress, and even medication side effects and that we must separate behavior from criminal intent. Our purpose in this study is to reduce the risk of violence in healthcare settings using environmental design constructs, a goal supported by other operational and environmental studies that suggest strategies to prevent most forms of violence, including those against healthcare professionals.
It can be assumed from the above crime-place theories that design strategies that optimize layouts can create adequate levels of natural surveillance in healthcare settings (Eggert et al., 2014; Fay et al., 2017; McPhaul et al., 2008; Pati et al., 2016). At their best, design strategies built on controlling access and incorporating acceptable levels of visibility can influence the offender’s cost/benefit assessment before an offense occurs. Therefore, the present research examines the visual properties of EDs in three U.S. hospitals using visibility graph analysis (Turner, 2001), which consists of a grid of spatially distributed points from which an isovist (the volume of visible space from a given point) can be created and measured. Benedikt (1979) computed the algorithms required to represent the different parameters related to an isovist, such as area, boundary perimeter, maximum radial length, or the number of occluding surfaces in an environment, and this study follows his approach to design strategies.
Methods
Preparation of Floor Plans
To compute the visual properties of spaces in vulnerable EDs, the present study used Isovist 2.4, an open software developed by McElhinney (2020), to assess the visual properties of large floor plans. For this study, floor plans were obtained in DXF format and prepared for analysis using the Isovist software: walls, solid doors, curtains, and above-eye-level furniture were placed in a layer read by the software as visual obstructions. To allow for isovist lines to pass through transparent portions, doors with glass panels were placed in two layers. The researchers excluded exterior windows from the analysis to avoid creating false values for interior isovists.
Visual Properties Selected
Based on the literature review by MohammadiGorji et al. (2020), the present study identified environmental visibility as a critical spatial planning attribute that affects ED security (Pati et al., 2016). The study’s goal is to measure the level of supervision (i.e., visibility and control) of patient and visitor areas available from staff locations. It explores the feasibility of using space syntax analysis to measure the spatial properties that contribute to the risk and/or opportunity of violent incidents against healthcare workers and the visual access across the overall layout and the immediate neighboring spaces in each zone.
Previous research indicates that hospital spaces with a low control value are linked to violent incidents (Alalouch & Aspinall, 2007; NHS Estates, 1994). This study, therefore, identifies the link between visibility and control, controllability, directed visibility, mean visual depth, and occlusivity to measure the level of guardianship and supervision proposed by the routine activity theory. Although some scholars argue that staff in a technology-rich environment can supervise an area without recourse to visual access, the present study used visibility and control-related metrics to examine natural surveillance from staff locations to patient areas created by their spatial configurations.
To better understand which measures the study used and why, the following section presents a brief description of isovist measures. The Isovist_App produces 21 fields, 10 of which are local, five global, and six semi-local. Local measures are linked to the occupant’s experience within the space. Global measures describe the spatial and configurational relationships across the whole plan and are essentially space syntax measures (McElhinney, 2020). A third category crosses over the local and global measures and is referred to as semi-local or relational, which includes visibility, control, controllability, metric depth to location, visual depth to location, and angular depth to location (McElhinney, 2020).
Among this study’s measures, visibility, control, controllability, mean visual depth, and occlusivity are the most relevant for assessing the risk and/or opportunity of Type II aggression. Generally, visual connectivity can be inferred as approximating the size of the visual field. The visibility (or directed visibility) measure shows how frequently a point can be seen from other isovist points and regions within the selected area (McElhinney, 2020). The Isovist_App generates isovists within locations that are selected stochastically in a sample region and records any isovist point (e.g., point “V”) in each generated isovis (McElhinney, 2020). The mean value is then calculated by dividing the resulting score at point “V” by the number of generated isovists, which is a relative value between 0 and 1 (McElhinney, 2020).
Linked to visual and physical access, control explains the location’s level of visibility to its immediate neighbor while considering the spatial connections of all neighboring locations (Rashid et al., 2014). In this study, a simple definition for the control measure is that a point or space has a high level of control if it can “see” many other (small) areas that cannot “see” the others. An example of this concept is the center of Jeremy Bentham’s panopticon in which a guard oversees numerous prison cells, but the prisoners can see only the guard (McElhinney, 2020, p. 26). According to Hillier and Hanson (1984), control expresses the visual level of a point over its neighboring spaces and measures the relationship between a space and its neighboring regions (Hillier & Hanson, 1984). A high regional control level means that an area can “see” spaces that can “see” relatively fewer spaces (McElhinney, 2020). Controllability (renamed covisibility in the app) is linked to visual exposure and expresses the quality of a point that is visually dominated by its neighboring spaces (McElhinney, 2020). A higher control level means that the region can “see” relatively more spaces than those spaces “see” (McElhinney, 2020).
Control is a scalar value, essentially the mean reciprocal of the area, that is, X per sq. ft., X per sq. m, and so on. To relate accurately to a unit of value, it needs the scale bar in the app to be set accordingly for each plan; otherwise, the measure is of value in a relative term on a plan-by-plan basis but harder to relate between plans. Like control, controllability is a scalar value of the average shared area, that is, XX sq. ft., m sq., and so on. Again, the scale needs to be set by the user (McElhinney, 2020). Control and controllability are two measures that can be described as “visibility as a matter of control” (Koutsolampros et al., 2019). Therefore, this study tries to measure the levels of visibility, control, and controllability of different locations to identify how the metrics are balanced across key staff and patient areas in the whole floor plan.
Occlusivity, which is an isovist local measure, was collected for visibility, control, and controllability measures to identify the level of the blockage of visibility created by the architectural features in the space, and if and how it differs for different metrics, regions, and isovist points. Occlusivity is absolute, calculated as a ratio, that is, between 0 and 1, therefore, has no units to be applied. It is the ratio of the length of the occluded edges against the overall perimeter of the isovist at that point (McElhinney, 2020). In other words, occlusivity is described as taking the perimeter of the visual field and making a ratio of the length that runs through open space (as compared to running along a hard boundary such as a wall) to the total length of the perimeter.
The mean visual depth, which is linked to visual step-depth, is a global measure for evaluating the depth of spaces, that is, the network of spaces in the layout and their visual connectivity patterns. Visual step depth is the number of steps needed to cover a subject area, and the number of steps is measured by how far one can see; that is, in isovist terminology, the least number of visual steps from a point “V” to a single universal sample location where a path goes through the threshold of all visible spaces from the previous visible step (McElhinney, 2020). Because the studies indicate that a lower mean visual step depth is linked to the ease of wayfinding and spatial orientation, designers favor a lower mean visual depth for hospital layouts (Geng et al., 2020). A lower mean visual depth can be linked to ease of accessibility to different units across a floor plan in terms of security personnel involved in the event of an incident.
Studies of crime-vulnerable locations indicate that control and integration measures are associated (Alalouch et al., 2007; Kellom & Nubani, 2018). Their results suggest that the qualities of seeing others and being seen are significantly associated with integration measures, that is, integration of the spatial configuration (Alalouch & Aspinall, 2007; Kwon & Sailer, 2015). While the integration measure was found to have a persistent effect on interaction, it is argued to be linked to searching acts, hence a good predictor of the distribution of visitors who are unfamiliar with a space (Haq, 2003; Kellom & Nubani, 2018; Koutsolampros et al., 2019).
Therefore, while this study should benefit from examining the integration measure, due to technical reasons, integration in the Isovist software does not explain the same concepts and relationships.
As an alternative, the present study used mean visual depth, which functions similarly and was used in previous studies (Koutsolampros et al., 2019; McElhinney, 2020). Those studies show that mean visual depth is a good movement predictor for accessibility and visibility; they are used as much as or, in some cases, more than, other variations for the integration metric (Koutsolampros et al., 2019).
Moreover, compared to integration, mean visual depth expresses the effect of the layout size on spatial properties more clearly due to the meaningful units (i.e., number of visual turns). While both measures encompass a term to normalize for the size of a spatial system, integration also holds a standardization term that is not useful for our study. The outcome for the control, controllability, and directed visibility is a value between 0 and 1.
Description of Case Studies
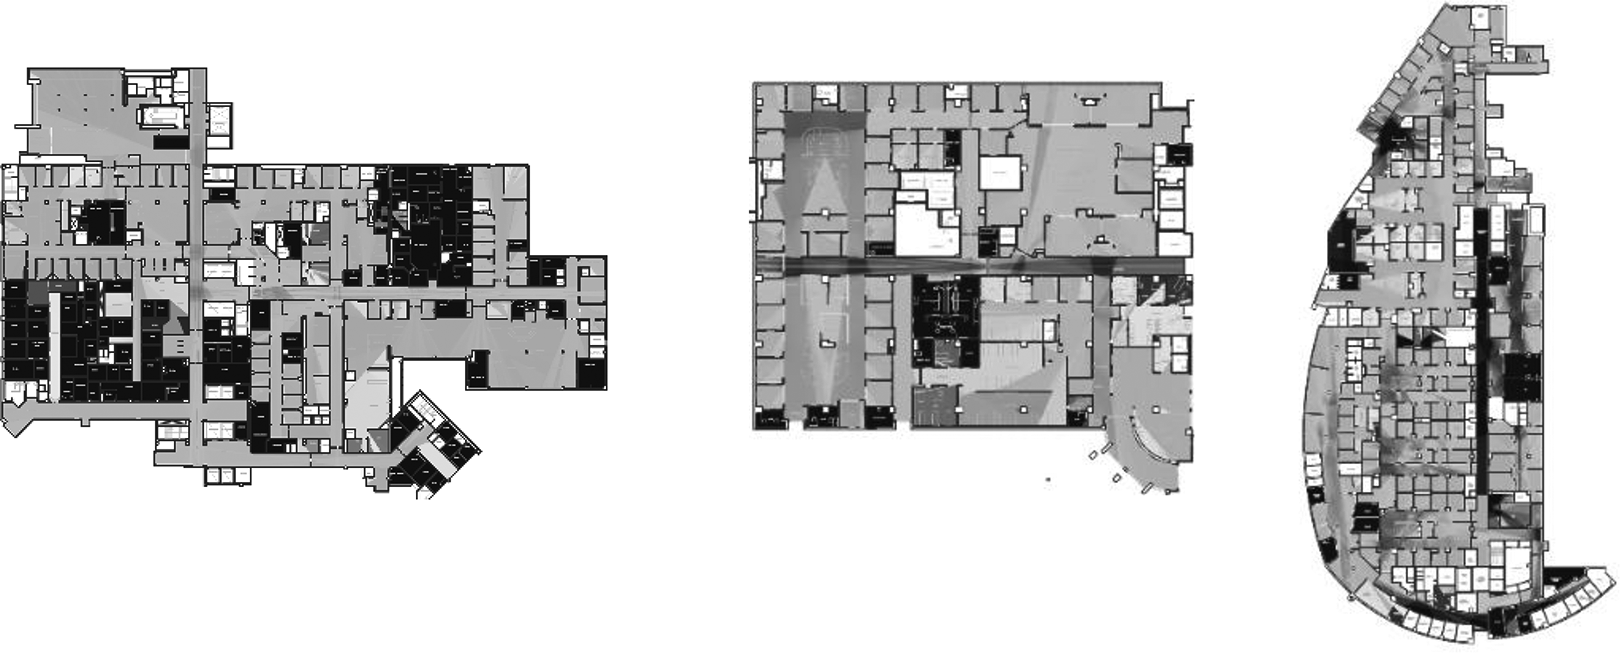
The first case study, ED-A, is a hospital-based Level I trauma center consisting of four adult exam/treatment zones and one pediatric zone. Each zone has one or two care team stations. The overall area is approximately 62,998 sq. ft. The ED provides emergency care to more than 90,000 patients annually. The second case study, ED-B, is also a hospital-based Level 1 trauma center for adults, where the overall area is approximately 37,000 sq. ft. and the annual census is over 65,000. It has three exam/treatment cores, two of which, combined, have 29 private exam rooms, and the third core has 14 cubicles separated by curtains without monitors. The trauma center consists of four trauma rooms and two resuscitation areas. The third case study, ED-C, consists of six exam/treatment pods on the second floor of a general hospital with more than 90,000 adult and pediatric visits each year. It has an area of 62,000 sq. ft. (see Figure 1).
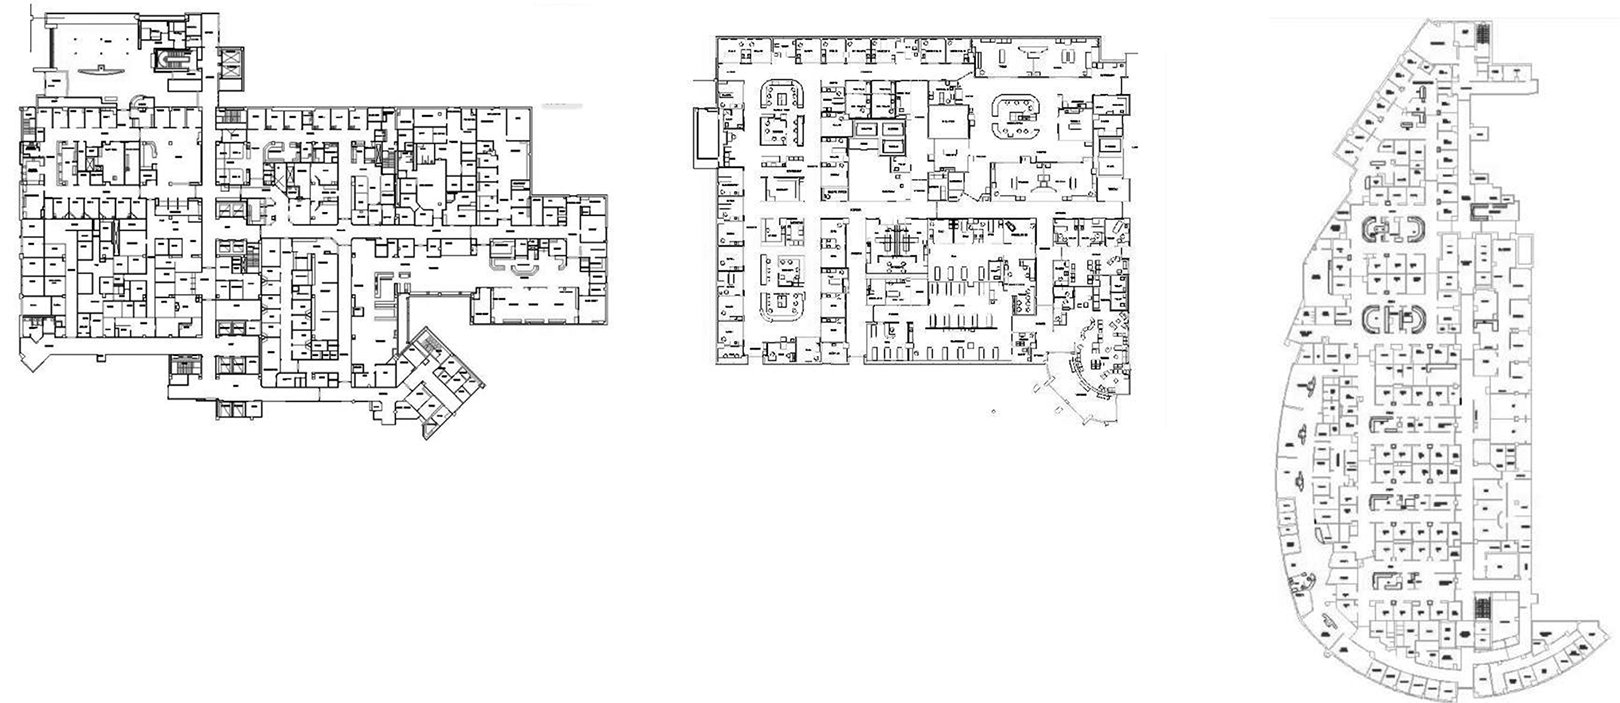
Layout for ED-A (left), ED-B (middle), and ED-C (right). ED = emergency department.
Visibility Analysis Description
We followed two approaches in this research: (1) an analysis of the entire ED floor plan and (2) an analysis of the separate zones.
Visibility Graph Analysis for Overall Floor Plan
First, mean visual depth and control were computed because they are the only two standardized measures comparable across buildings of different layouts and sizes. The statistical analysis used for the first stage compared the Welch test (and the Brown–Forsythe test), and post hoc T3 test using Dunnett’s. With reference to Central Limit Theorem, the assumption of normality was met because of the large amount of data in each data set. A one-way analysis of variance (ANOVA), which is recommended when there is one categorical independent variable (hospital-based EDs) with three groups/levels (i.e., three different EDs) that predicts dependent variables (mean visual depth and control) that are numerical, was conducted to compare differences in measures across the three hospitals. However, Levene’s F test revealed that the homogeneity of variance assumption was not met (p < .05). Therefore, the one-way ANOVA was no longer appropriate. As such, the Robust Test of Equality of Means was used, that is, Welch’s and Brown–Forsythe’s F (p < .05). In the next stage, Dunnett T3, which is based on Robust test and is used when the homogeneity of variance assumption is not met, was used. An α level of .05 was used for all subsequent analyses.
Second, some of the unconnected spaces to the main circulation areas (such as the janitor’s room) were excluded, and only mean visual depth was investigated using descriptive statistics. The purpose of this stage was to measure and compare the levels of visual and physical connectivity of the entire floor plans across the three EDs.
Visibility Graph Analysis for the Key Patient and Staff Locations
First, the study used descriptive analysis to examine control, controllability, directed visibility, and occlusivity in key patient locations, such as waiting areas, triage areas, exam, and treatment rooms, as well as key staff locations such as reception desks, security stations, triage stations, and nurse stations. Second, a similar analysis was performed after modifying the key patient and staff locations to understand the impact of physical connectivity, visual obstruction, region size, and distance on visual properties such as control, controllability, and directed visibility. Examples of these modifications included removing columns or adding solid blockages in certain spaces. In ED-A, the reception area was modified, and an independent t test was conducted to compare the original and modified areas. In ED-B, two exam/treatment areas received modifications, and in ED-C, two exam/treatment pods were modified. For ED-B and ED-C, the Welch test, the Brown–Forsythe approach, and Dunnett T3 post hoc test were used to compare the original spaces to the modified areas (Figure 2).
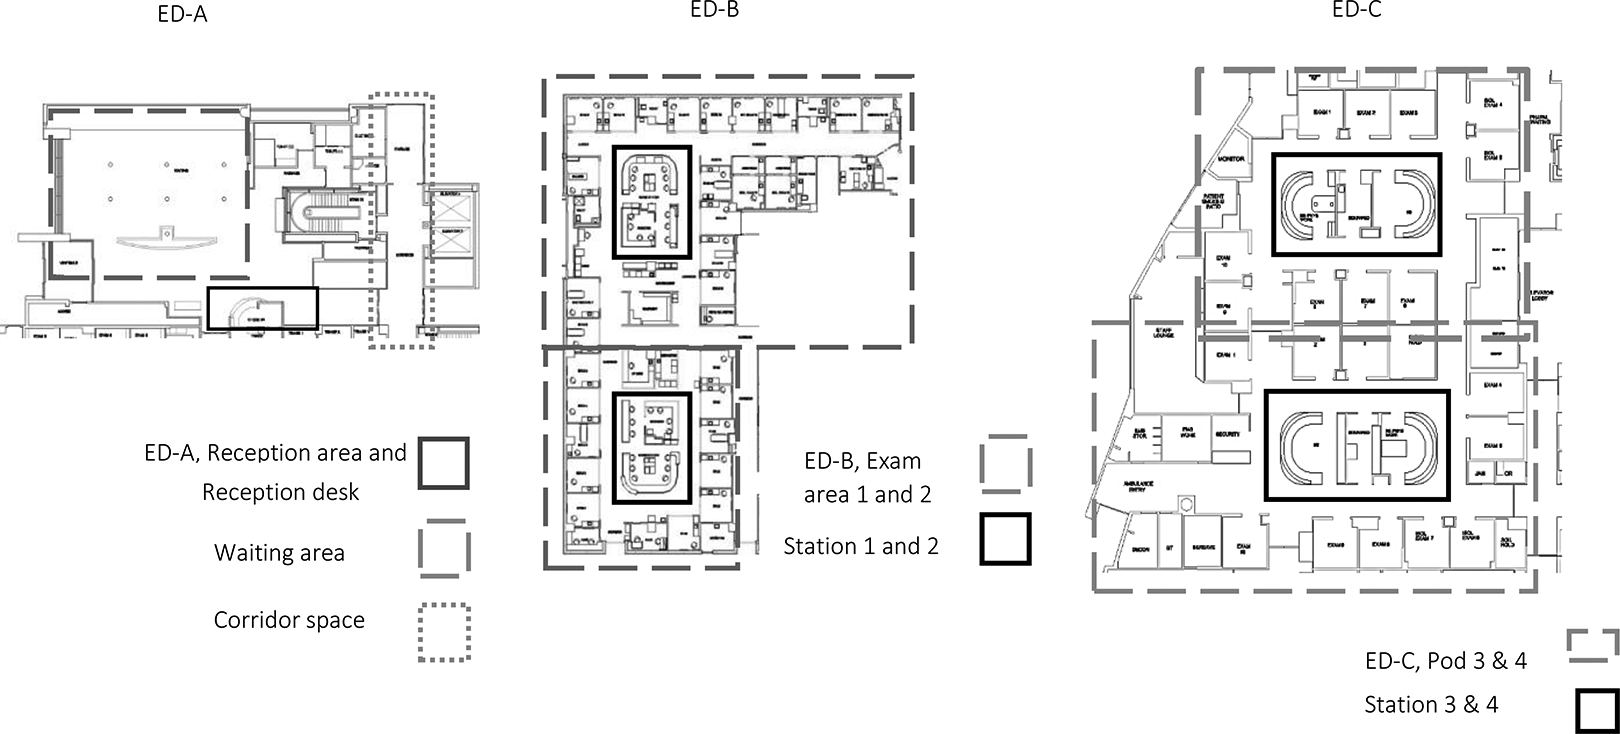
Spaces that received design modifications.
Results
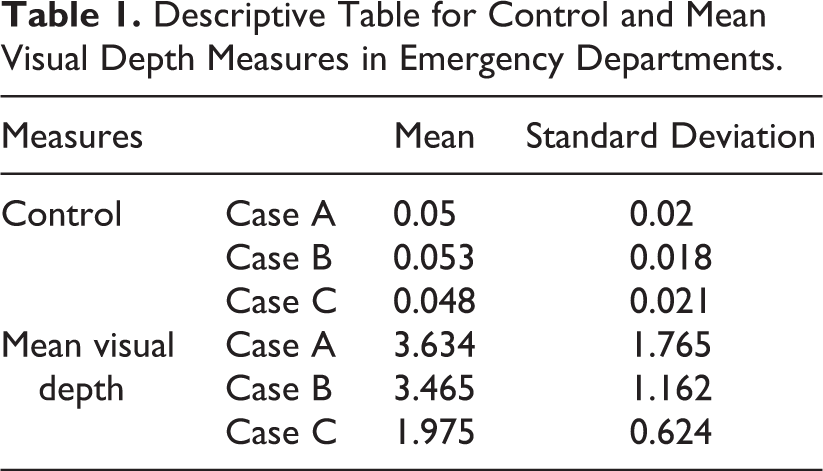
The results of analyzing the mean visual depth and control across the layouts of the three EDs enabled the researchers to understand which spatial design features affected visibility measures (see Tables 1 and 2; Figures 3 –5). The findings show that the mean visual depth across the three EDs differed significantly when Welch’s F(2, 729,347.31) = 382,083.10, p < .001. The post hoc comparison, using the Dunnett T3 procedure, revealed that mean visual depth was lower in ED-C (M = 1.98, SD = 0.62) than ED-A (M = 3.63, SD = 1.77) and ED-B (M = 3.47, SD = 1.16). By comparison, the difference between the mean visual depth in ED-A and ED-B was not statistically significant.
In contrast to the mean visual depth, the difference between control measures in ED-C (M = 0.05, SD = 0.02) and ED-A (M = 0.05, SD = 0.02) was not statistically significant. Similarly, the difference between the control measures in ED-C and ED-B (M = 0.05, SD = 0.02) was not statistically significant; neither was the difference between the control in ED-A and ED-B. These results suggest that the mean values of control indicate a low-visual access level across the three EDs.
Descriptive Table for Control and Mean Visual Depth Measures in Emergency Departments.
Multiple Comparisons of Control and Mean Visual Depth Measures Across the Three Emergency Departments.
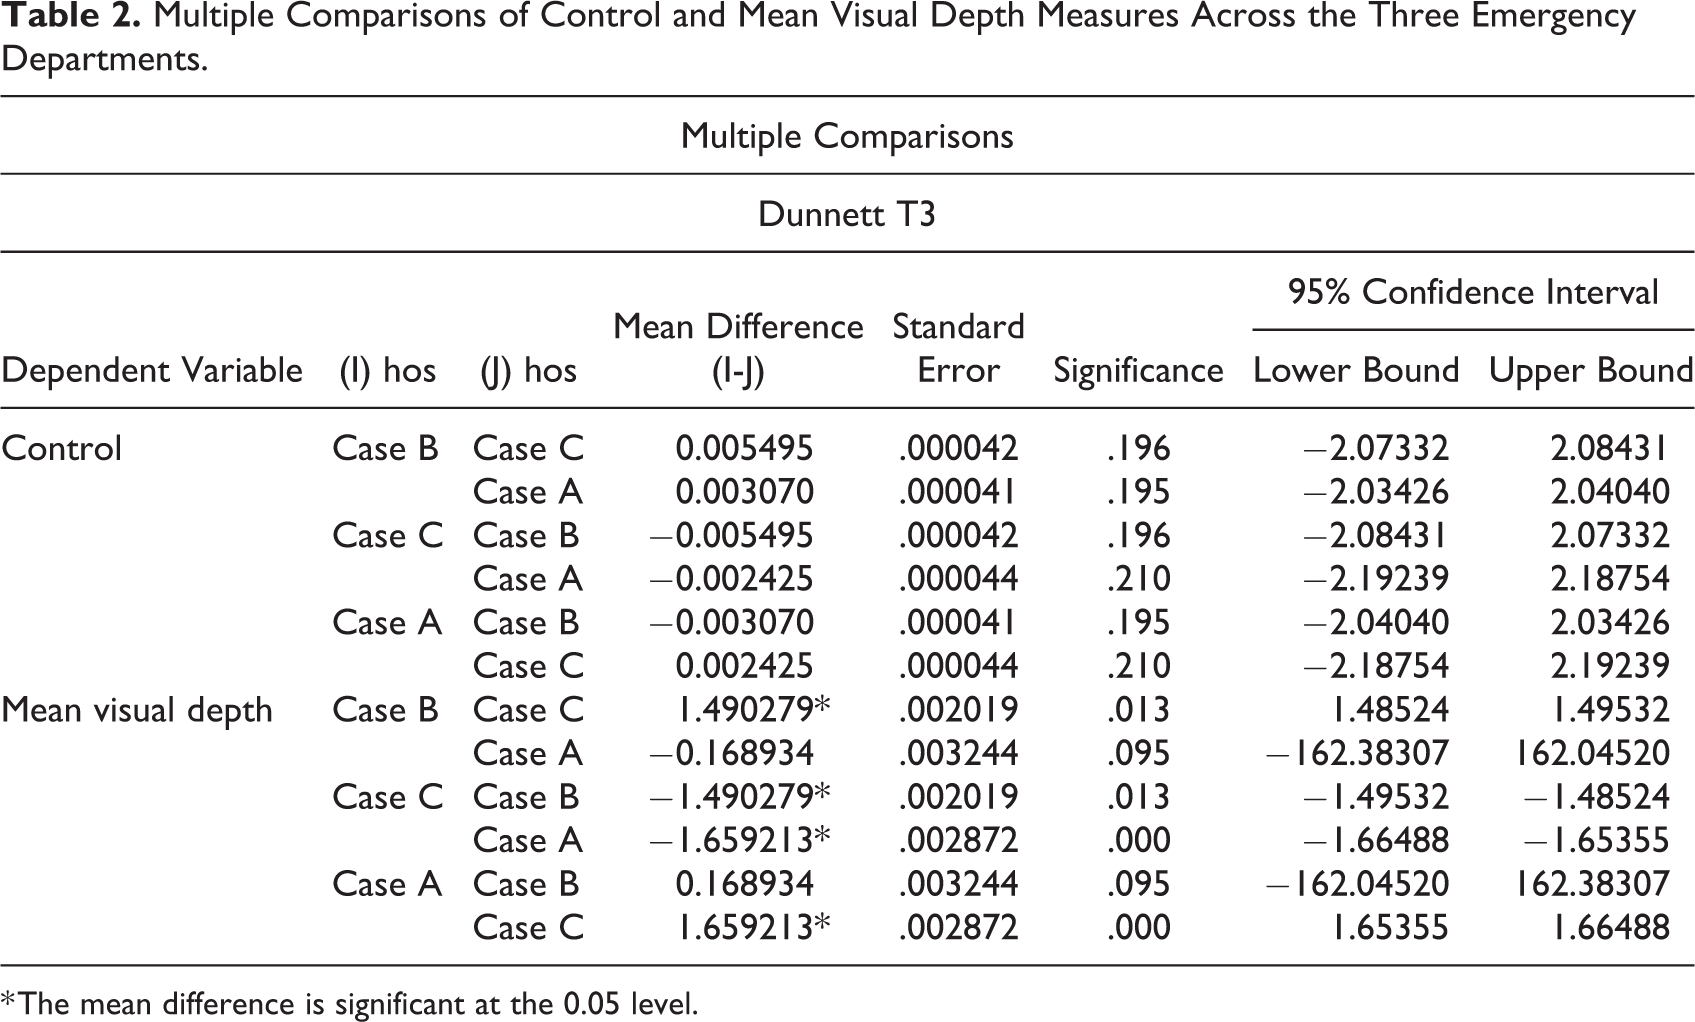
* The mean difference is significant at the 0.05 level.
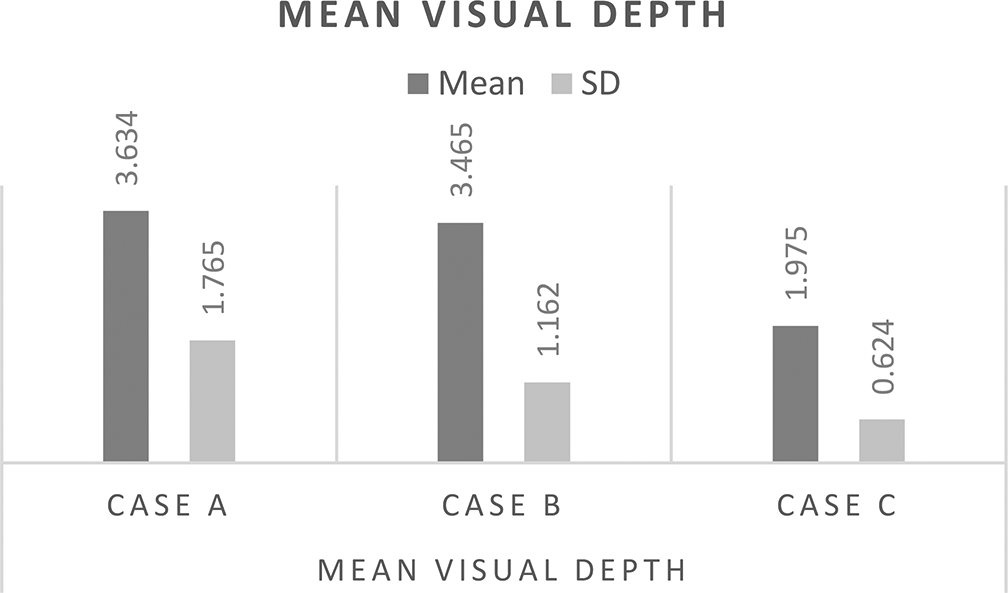
Mean visual depth measure across the three emergency departments.
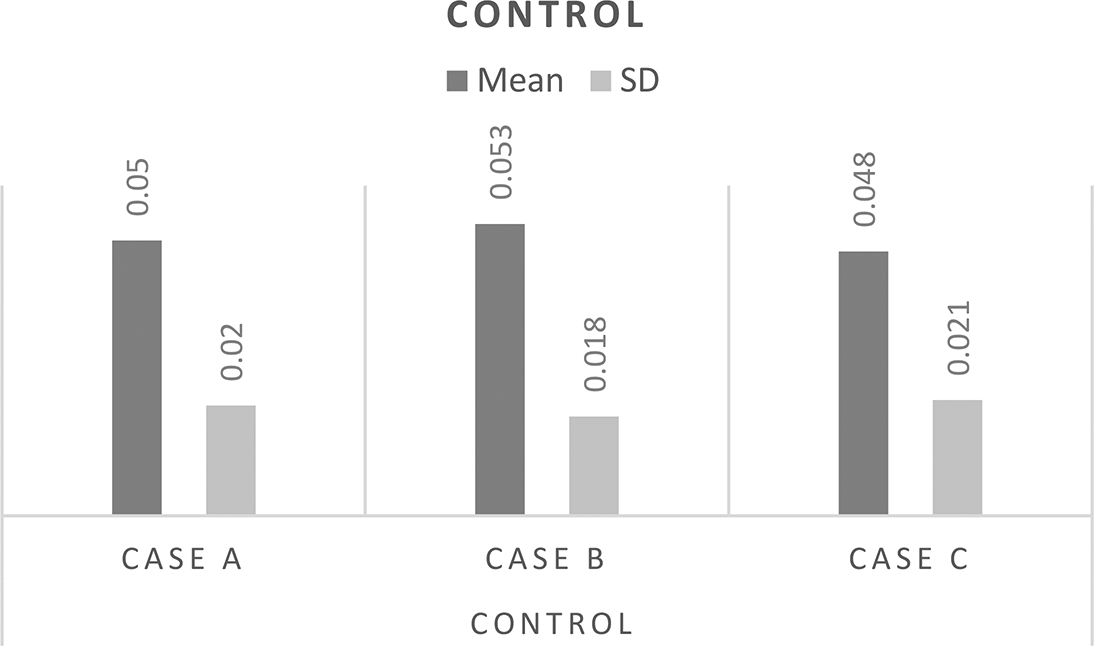
Control measure across the three emergency departments.
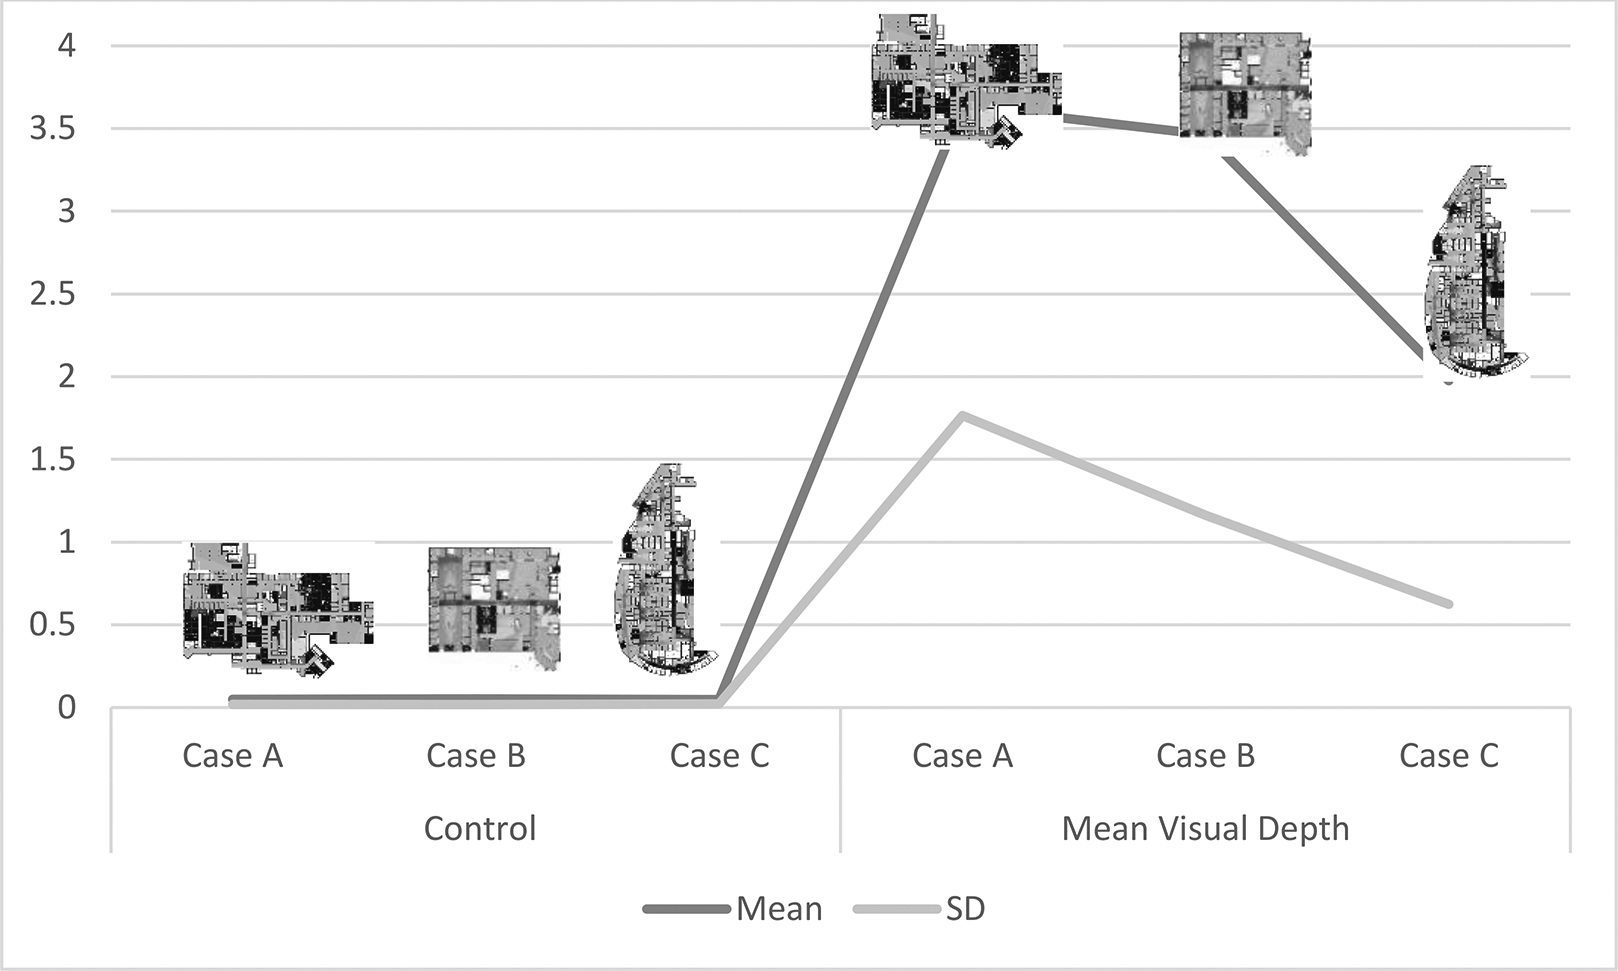
The layouts comparison based on control and mean visual depth values.
When the analysis was performed on the three layouts after excluding spaces not accessible to patients, such as the janitor’s room or the clean hold room, the researchers identified whether unconnected spaces across the layouts impacted the visual mean depth value. The results show an average mean visual depth of 4.36 for ED-A, 3.70 for ED-B, and 2.12 for ED-C. In comparison with the first analysis, the results suggest that the influence of the entirely separate spaces was downward, though not to a significant degree. Most pronounced in ED-A, the trend was less so in other layouts (see Figure 6).
The mean visual depth measure color scheme across the three emergency departments, from left to the right ED-A, B, and C.
Visibility Graph Analysis for Key Patient and Staff Locations
When the researchers examined the visibility measures for key patient and staff locations, the results showed that ED-A had a higher control value for key staff locations than the other two EDs. Furthermore, ED-B had higher controllability values for key patient locations than the others. It is worth noting that values above 0.5 are considered high. See Figure 7 for average measure values of control for stations and controllability for patient areas across three emergency departments.
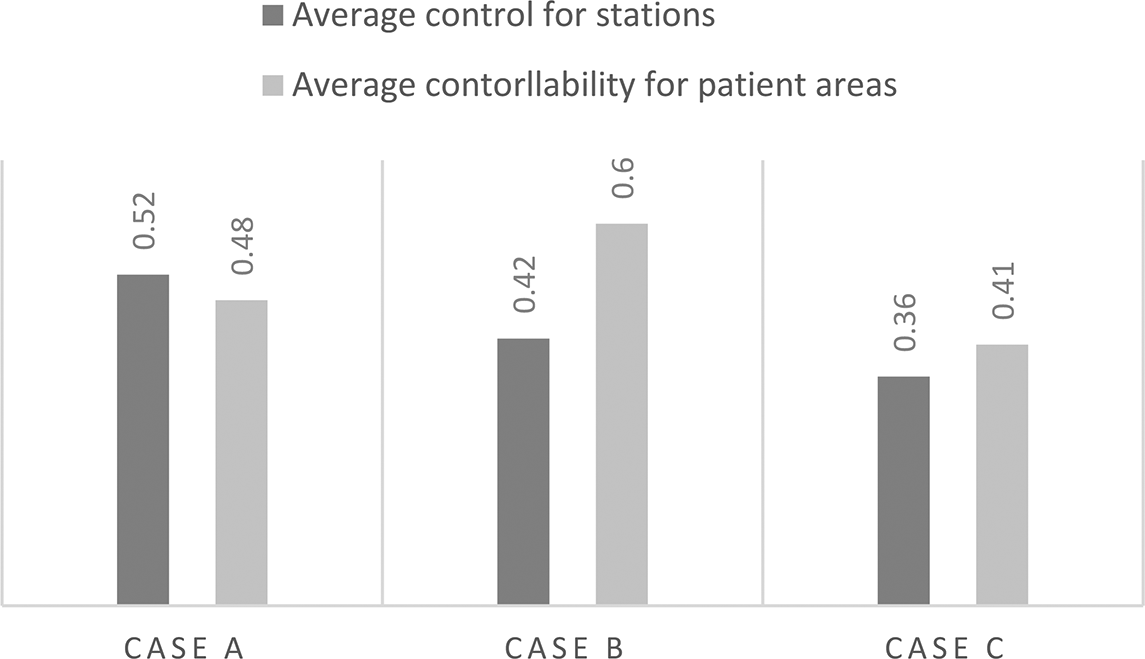
Illustrates the average measure values of control for stations and controllability for patient areas across three emergency departments.
Since previous research recommends improved visibility from key staff locations such as the nurse station or the security station, high control values and low controllability values within these areas would be preferred. The present study’s findings show that, in ED-A, control for the security station was high (0.7) while controllability was low (0.47). However, the ambulance entry had low controllability (0.32), which makes visual monitoring from the security station challenging. The results differed for ED-B, where the security station had a very low control (0.27) and high controllability (0.76). After further examination, these values were likely affected by the alcove-style recessed space of the security station. Additionally, the station did not have a direct line of sight to the main entrance of the ED—although there was one to the triage area. The main walking entrance showed a high controllability value (0.6) because of the glass doors exposing the vestibule space to the waiting area. In ED-C, the security station showed a low level of control (0.21) and a high level of controllability (0.7) with limited visibility onto the ambulance entrance (directed visibility was 0.23 and controllability was 0.7) (See Figure 8).
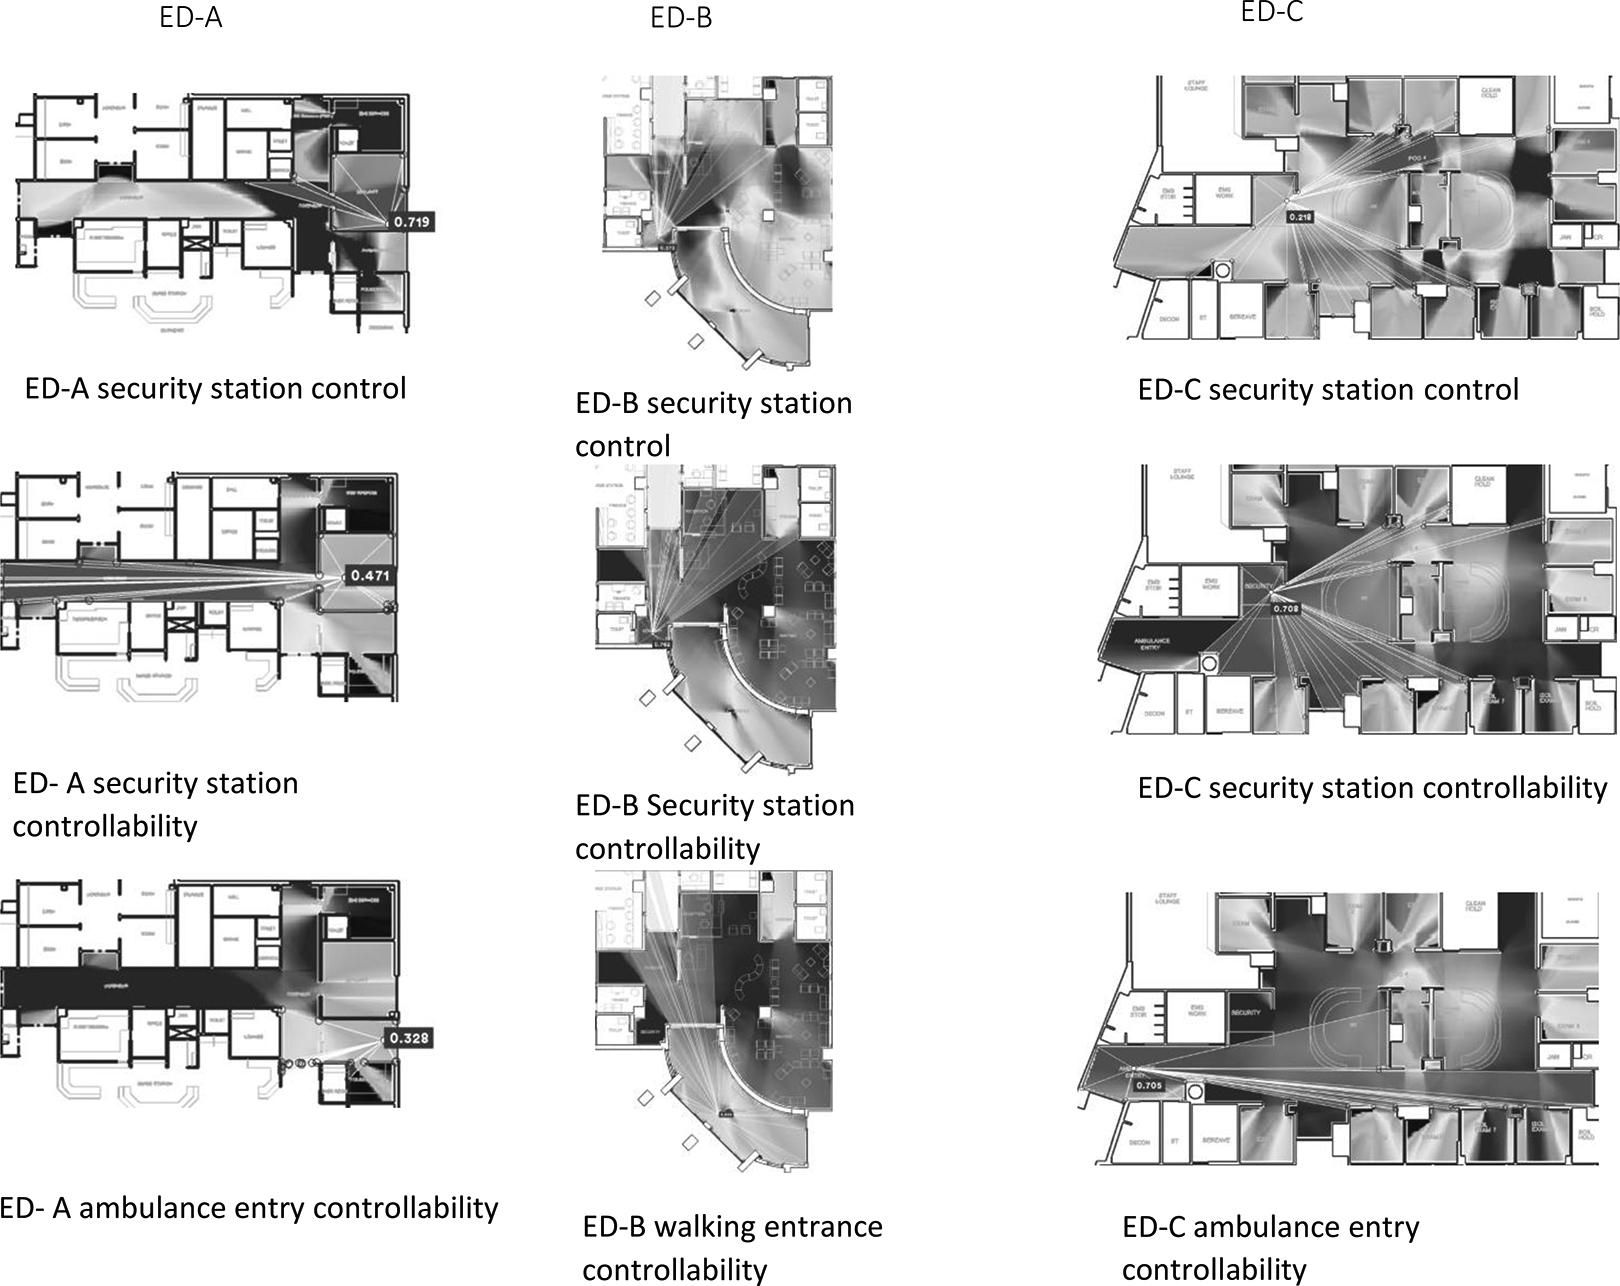
Security stations in ED-A, ED-B, and ED-C, from left to the right. The figures show control and controllability for the security stations, and controllability for the ambulance or walking entries that are supposed to be overlooked by security stations. ED = emergency department.
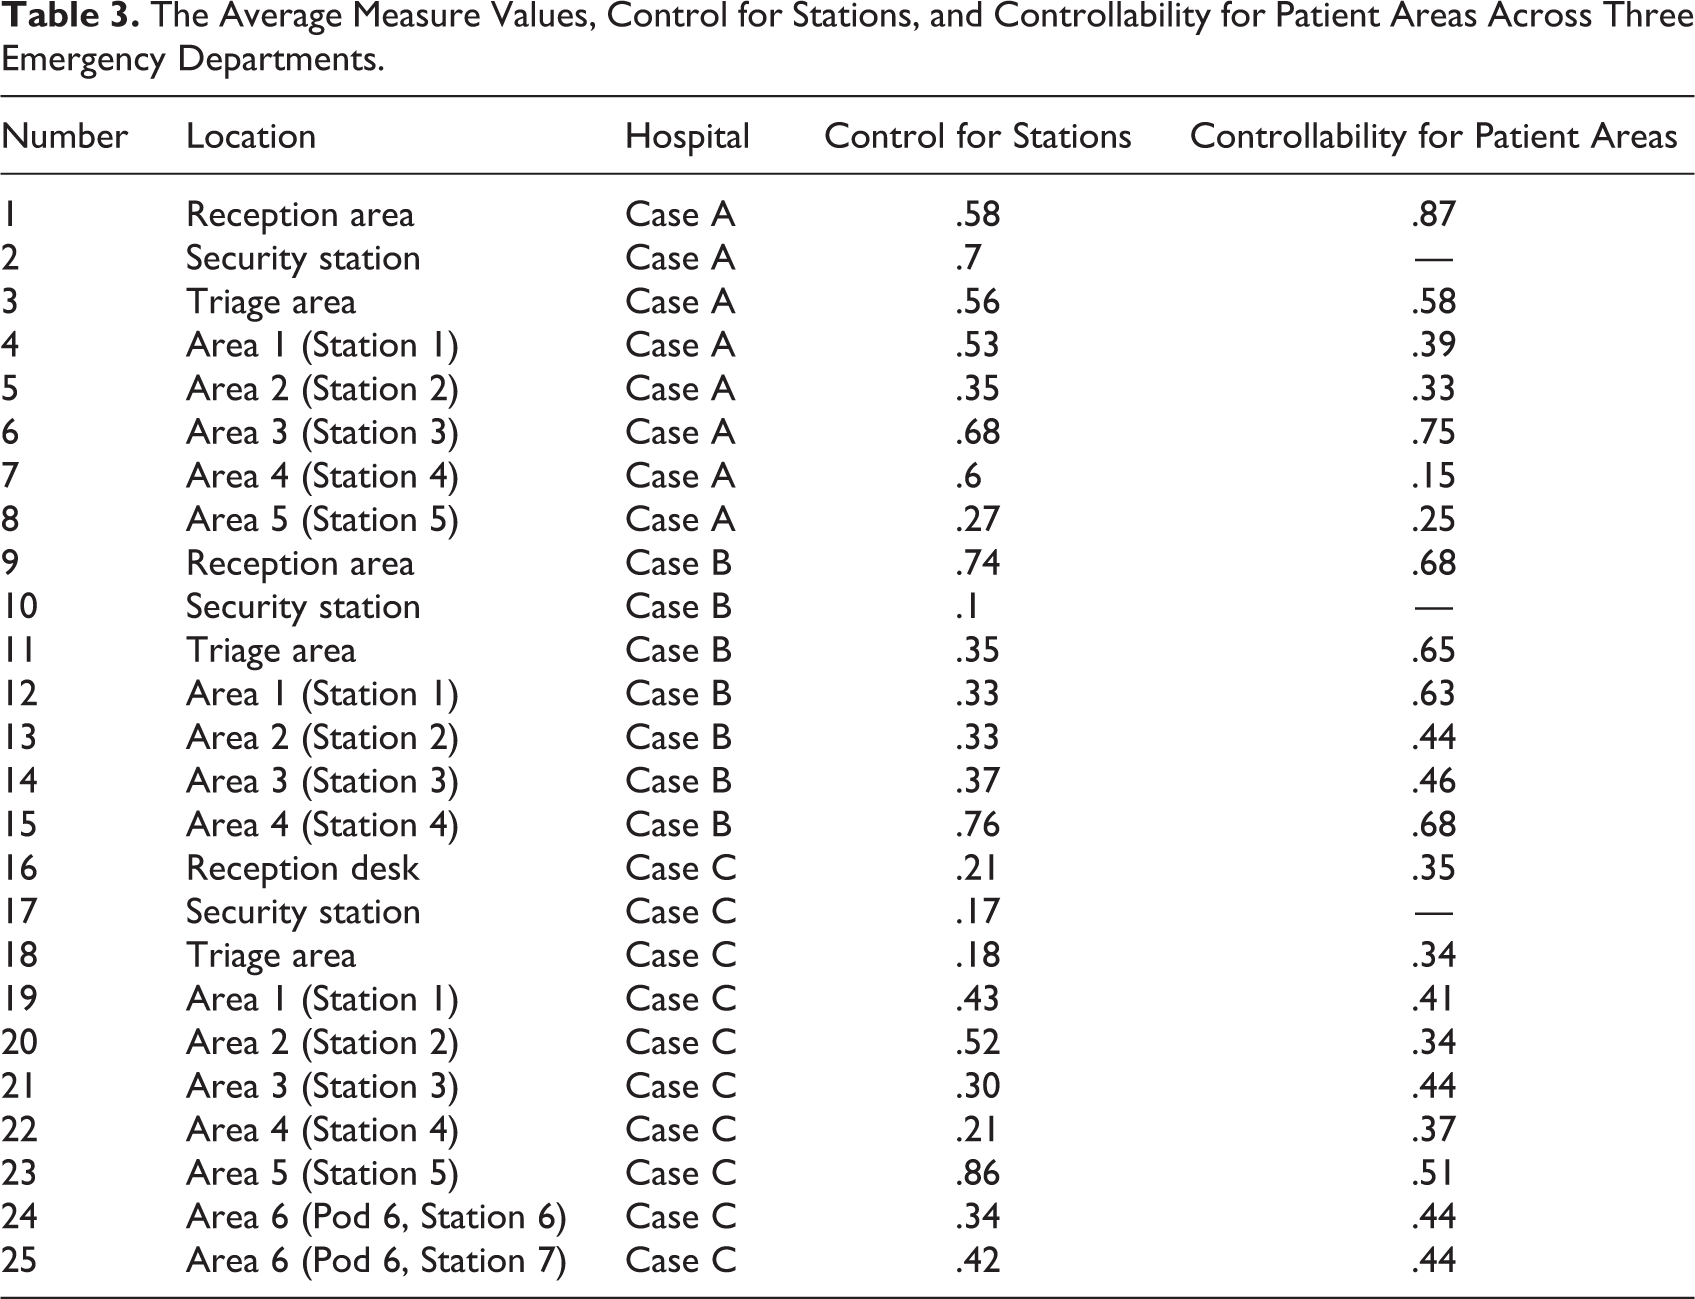
A further comparison across all key patient areas and staff areas was conducted. Table 3 highlights the areas with high control values for staff areas and high controllability values for patient areas. Three examples are also presented below to explain these values from an environmental design perspective.
The Average Measure Values, Control for Stations, and Controllability for Patient Areas Across Three Emergency Departments.
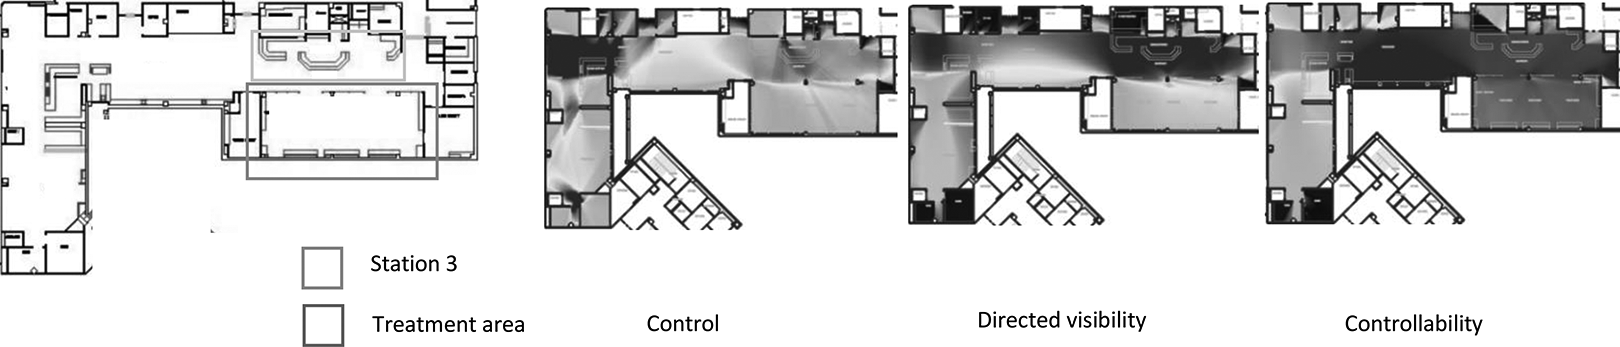
The first example was treatment Area 3 in ED-A (see Figure 9). It is in front of the nurse station with minimal occlusivity values. Treatment spaces were separated by curtains. The second example is the trauma center (Area 4) in ED-B (see Figure 10). Trauma rooms consisted of a racetrack and centralized station with two horseshoe-shaped desks. The trauma center’s two entrances and all patient areas enjoyed good levels of visibility from these desks. All patient rooms, except one resuscitation space, had double sliding glass doors that allowed visibility onto the patient area. The area is characterized as compact and smaller than other zones; it consisted of a few patient rooms. The third example was area 5 in ED-C (see Figure 11). This area can be described as a racetrack unit where patient rooms, supporting spaces, and the two north and south entrances were arranged around a central nurse station.
High control for nurse station and high controllability for patient treatment area were achieved in this zone, ED-A. In this case, treatment area was arranged in front of the nurse station with minimal occlusivity.Treatment spaces were separated by curtains. ED = emergency department.
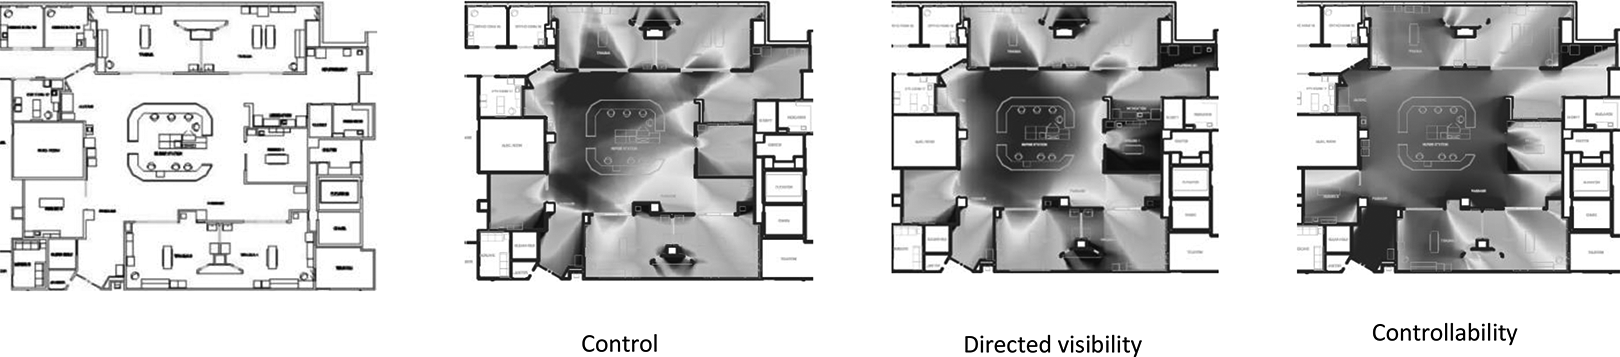
High control for nurse station and high controllability for patient treatment area were achieved in this zone in ED-B. In this case, there was a racetrack centralized station with two horseshoe desks, and the two entrances of and all patient areas were in good level of visibility from the desks. ED = emergency department.
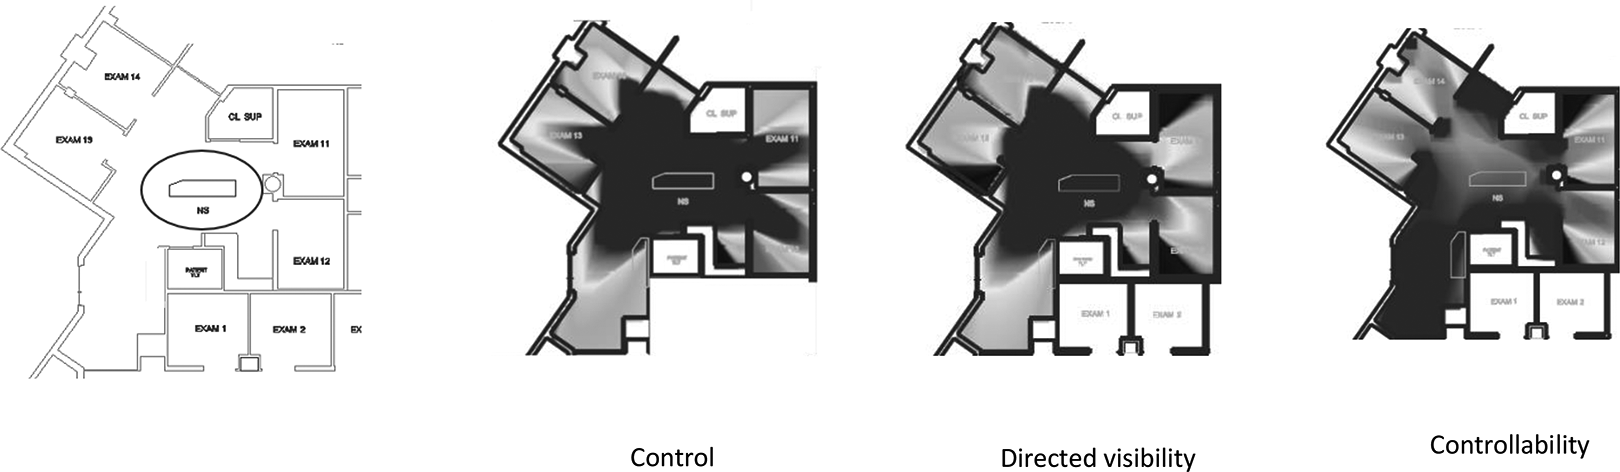
High control for nurse station and high controllability for patient treatment area were achieved in this zone in ED-C. This unit in Case C is a racetrack unit where patient rooms, supporting spaces, and the two entrances (on the north and south sides) are arranged around a central nurse station. ED = emergency department.
After examining the relevant measures for key patient and staff locations, the researchers experimented with three of these spaces by making changes to their layout. This exercise allowed them to identify the architectural features that can improve visibility and accessibility as recommended in the criminology literature.
For ED-A, the researchers modified the reception area by adding a solid wall between the reception area and the main corridor (see Figure 2, ED-A). The researchers also removed the columns from the reception area. Visibility measures before and after the modification were compared using the two-tailed independent sample t test, t (53,739.20) = −325.33, p < .05. In the modified layout, control (M = 0.87, SD = 0.19) became significantly higher than the original layout (M = 0.51, SD = 0.12). A similar t test, t (60,825.46) = −190.39, p < .05, was run for controllability. It was also significantly higher for the modified layout (M = 0.90, SD = 0.06) compared to the original layout (M = 0.70, SD = 0.23). An additional two-tailed paired sample t test for directed visibility showed that it was also significant, t (68,472.26) = −317.15, p < .05, such that the level of directed visibility was higher in the modified layout (M = 0.82, SD = 0.2) than the original layout (M = 0.40, SD = 0.18). There were increased values for all three metrics: control (0.58–0.94), controllability (0.87–0.91), and directed visibility (0.49–0.82). In the patient waiting area, controllability increased from 0.87 to 0.92.
For ED-B, the researchers modified the two exam/treatment areas (Core 1 and Core 2) by adding two solid walls between the two stations (see Figure 2, ED-B). The difference between the control measures was statistically significant, where Welch’s F(2, 118,910.03) = 87,917.21, p < .001. Post hoc comparison, using Dunnett T3 procedure, showed that the control was higher in Core 1 (M = 0.59, SE = .0007) than the original layout (M = 0.30, SE =.0002). Similarly, the contrast between Core 2 and the original layout was significantly different, such that the level of control in Core 2 (M = 0.45, SE = .005) was higher than in the original. Controllability was also significantly different, Welch’s F(2, 191,525.76) = 91,223.41, p < .001. Post hoc comparison, using the Dunnett T3 procedure, revealed that the controllability was higher in Core 1 (M = 0.75, SE = .0002) than in the original layout (M = 0.54, SE = .19). Similarly, the contrast between Core 2 and the original layout was significant, such that the level of controllability in Core 2 (M = 0.55, SE = .0007) was higher than the original. Also, the difference between the visibility measures was statistically significant, Welch’s F(2, 118,036.32) = 84,861.65, p < .001. Post hoc comparison, using Dunnett T3 procedure, revealed that visibility was higher in Core 1 (M = 0.49, SE = .0007) than the original layout (M = 0.17, SE = .0003). The contrast between Core 2 and the original layout was also significant; visibility in Core 2 (M = 0.25, SE = .0006) was higher than in the original.
Further observations of the region average measures showed an increase in all three numeric values. For Core 1, the mean control, controllability, and directed visibility increased from 0.3 to 0.62, 0.63 to 0.74, and 0.19 to 0.5, respectively. In the station area, the average values also increased for control (0.33–0.76), controllability (0.64–0.76), and directed visibility (0.25–0.68). For Core 2, the region average values also increased for control (0.3–0.45), controllability (0.5–0.54), and directed visibility (0.16–0.24). Furthermore, for the station, the region average values have also increased for control (0.33–0.57), controllability (0.70–0.74), and directed visibility (0.26–0.47). The average controllability for patient areas increased from 0.44 to 0.48.
Similarly, Pods 3 and 4 in ED-C were modified by adding two solid walls between the two areas to test the measure values in the new smaller pod sizes (see Figure 2, ED-C). Control, controllability, and directed visibility were compared in three layouts; that is, the original, Pod 3, and Pod 4. First, results revealed that the difference between control measures was statistically significant, Welch’s F(2, 59,454.68) = 31,325.89, p < .001. A post hoc comparison, using Dunnett T3 procedure, revealed that control was higher in Pod 3 (M = 0.40, SE = .0007) and Pod 4 (M = 0.36, SE = .0006) than the original layout (M = 0.23, SE = .0003). Second, the difference between controllability measures was statistically significant, Welch’s F(2, 71,951.90) = 6,564.05, p < .001. A post hoc comparison using Dunnett T3 procedure showed that controllability was higher in Pod 3 (M = 0.64, SE = .0006) and Pod 4 (M = 0.66, SE = .0008) than in the original layout (M = 0.56, SE = .0005). Third, the difference between the visibility measures was statistically significant, Welch’s F(2, 57,868.62) = 20,359.54, p < .001. A post hoc comparison using Dunnett T3 procedure revealed that the visibility was higher in Pod 3 (M = 0.27, SE = .0007) and Pod 4 (M = 0.25, SE = .0007) than the original layout (M = 0.14, SE = .0003).
Given these findings, the area of the unit and distance impacted control, controllability, and visibility measures in both pods. For Pod 3, there was an increase in control (0.24–0.41), controllability (0.61–0.64), and directed visibility (0.15––0.28) and an increase within the station in control (0.30–0.54), controllability (0.65–0.71), and directed visibility (0.22–0.41). The average controllability for the patient area increased from 0.55 to 0.63.
For Pod 4, there was an increase within the region in control (0.24–0.41), controllability (0.61–0.64), and directed visibility (0.15–0.28) and an increase within the station in control (0.21–0.41), controllability (0.62–0.76), and directed visibility (0.16–0.30). For the patient areas, the average controllability value increased from 0.37 to 0.53.
Discussion
The present study explored the feasibility of space syntax visibility-based analysis to measure the risk of patient aggression against healthcare providers in ED settings and opportunities to intervene. The study was guided by the rational choice theory, which states that certain qualities of an environment can influence decisions to commit an offense based on a cost/benefit analysis by the offender (Cornish & Clark, 1986; Newman, 1996). The decision to assault a healthcare provider may be influenced by a controlling agent’s intervention. In other words, exposure and accessibility to a controlling agent (e.g., security personnel or other hospital staff) may deter potential offenders from acting aggressively.
The study proposed a new method to assess the risk of assault due to the interaction of the victim and offender within a space that lacked supervision or guardianship. Criminologists argue that a natural conflict exists between social control agents (e.g., police officers and bartenders) and those needing control—for example, suspects and offenders—and that the conflict of divergent interests creates opportunities for aggression (R. Felson, 2006). Thus, criminologists frequently refer to environmental design strategies for increased supervision and guardianship (R. Felson, 2006).
The present study argues that healthcare design configurations can create an adequate level of natural surveillance and deter aggressive behaviors. A good physical environmental design protects healthcare providers by granting visibility to surrounding spaces. Space syntax measures of mean visual depth, control, controllability, directed visibility, and occlusivity help to identify risk-prone spaces and their vulnerability levels due to their accessibility and visibility. Specifically, we found that mean visual depth is linked to overall visual connectivity and the physical accessibility of network spaces across the layout, while control was linked to the visual access per zone (i.e., the ability to observe patient areas from staff locations). The study also found that controllability was linked to visual exposure per zone (i.e., the quality of patient areas exposed to staff locations).
Overall, the study’s results indicate that high control values within staff locations (visual access) do not necessarily mean that patient areas fall within the staff’s sightlines. Similarly, high levels of controllability within patient areas (visual exposure) do not mean that they were visible from staff locations. However, testing the three measures of control and directed visibility from staff locations and controllability from patient areas, in conjunction, may help to identify the vulnerability level of different spaces.
As shown by Koutsolampros et al. (2019), mean visual depth is a good movement predictor for accessibility and visibility. It is particularly important for locating security personnel because, depending on their level of accessibility, they may be able to intervene when issues arise. A lower level of the mean visual depth indicates less physically isolated spaces. In the present study, ED-C had a lower mean visual depth value compared to the other EDs, which indicates better connectivity of corridors and circulation spaces connecting different zones such as exam/treatment areas across the ED layout. A detailed observation of the three floor plans indicates that exam/treatment zones in ED-C were arranged parallel to each other, which influenced the overall connectivity at the system level. This may suggest that security personnel, for example, can quickly access different locations across the plan in ED-C compared to other cases. Although not directly linked to safety, the results align with previous research that linked connectivity and integration measures to better wayfinding in hospitals (Haq, 2003). This study suggests that a lower mean visual depth is also linked to an improved wayfinding experience for visitors unfamiliar with the area.
In ED-A, the layout had multiple corridors and zones clustered in different directions, which created lower visual and physical access at the system level. Previous studies show that clustered layouts featuring zones that are gathered/bunched in different directions have a higher mean visual depth compared to double linear layouts in hospitals where zones are arranged along parallel corridors (Geng et al., 2020). The layout of ED-B had a more compact arrangement of zones, which contributed to a lower mean visual depth compared to ED-A. To summarize, the difference in the mean visual depth among the three EDs is associated with space planning strategies such as a single corridor, double corridors (racetrack), triangular, radial/circular, and cluster unit design (Cai & Zimring, 2019; James & Tatton-Brown, 1986).
Technically, the mean visual depth measure includes all of the connected spaces at the global level. Therefore, rooms that are completely unattached, separated, and noncontiguous with the main circulation spaces may give false values because they are connected to themselves only and will have low mean visual depth. To ensure the reliability of the results, a second round of analysis was conducted for each plan after excluding all unconnected spaces. The average mean visual depth of all three increased, indicating the impact of the unconnected spaces. This influence was most prominent in ED-A, where there were more unconnected rooms with the main circulation spaces that justified the impact. The conclusion, therefore, is that unconnected spaces have a relatively low influence on how the overall spatial system operates.
McElhinney (2020) describes control as a measure that explains the visual linking dominance of any location; that is, the semi-local qualities impacted by immediate neighboring spaces and typically higher at junctions or where a point has visual access to several restricted visual fields (McElhinney, 2021). As a semi-local measure, control is affected by space planning and room clustering strategies in each zone or visual obstructions created by solid architectural features such as walls, columns, or above eye-level furniture. Therefore, it was not surprising that ED-C scored higher in connectivity at the system level—related to the mean visual depth—than at the subsystem level, for example, room clustering in each exam/treatment area did not significantly differ from the other two cases. The present study found that control was indeed higher at junctions as previously examined by McElhinney (2021).
Categorizing regions based on their level of measurements revealed similarities in their spatial configurations. First, in open layouts where stations were located on one side and patient spaces on the other, higher levels of control within stations and higher levels of controllability in patient areas were observed. Similarly, a balance was achieved in smaller and more compact configurations where all patient areas had good levels of visibility from the clinical stations (see trauma center in ED-B and exam Area 5 in ED-C). Second, in single corridor layouts where stations were arranged along the strategic spaces (i.e., triage rooms), the levels of measures were lower (see exam Area 5 in ED-A and the reception desk in ED-C). If a station was set toward the end of patient rooms, or on one side of the corridor, visibility was limited (see ED-A). These findings support those from earlier studies showing how a central corridor with patient rooms and offices on both sides and stations at the end of the corridor makes it difficult to supervise patient rooms (McPhaul et al., 2008). Third, we found that decentralized nurse stations between every two patient rooms in the exam/treatment area as proposed by Morelli (2007) had the highest control value in each zone. Additionally, this study showed that alcove-style spaces were associated with limited visibility of the surrounding areas. In ED-C for instance, the reception desk had a direct view of the entrance zone, but its visibility to the waiting spaces was limited because both the reception and waiting spaces were alcove style.
The result of modifying the layout by separating the two zones impacted the overall control and controllability of the entire region. The finding showed that they work better when separated. This may also imply that the size of the zone impacts staff awareness of activities in the surrounding environment. While the physical connectivity provides easier accessibility to the other side, it creates a larger and more complex environment for the staff working in each zone.
When exploring the relationship between occlusivity and control values, it was observed that small changes in the level of occlusivity created by architectural elements such as columns had a great impact on the level of the control measure. For example, when an isovist point at the station moved away from the column, the change in the level of occlusivity was minimal, but the revelation of the information through visual access resulted in an increase in the level of the control measure. This change in occlusivity occurred when staff passed the column located within the triage station. Therefore, the location of the column or any other type of visual obstruction is an important design consideration that impacts control levels.
Conclusion
Healthcare staff should have adequate levels of natural surveillance to monitor surrounding spaces. Although those working at clinical stations should be able to oversee and supervise patient spaces, the idea of clinician control entails a sense of territoriality and sets boundaries between staff and patients, which often limits easy access for patients (Platt et al., 2017). While staff need to observe, supervise and feel secure in hospital areas, patients and their companions need to communicate, verbally and visually, with staff. However, a high level of physical exposure and accessibility—that is, controllability—of staff locations may threaten their sense of territoriality and place employees at risk of patient/companion aggression. This study finds that it is necessary to analyze both control and controllability measures to achieve the desired outcomes. While the control measure at a clinical station is critical, the controllability measure is also important for maintaining the connection between care providers and patients/companions. It is worth noting that natural surveillance should not compromise patient privacy. Thus, building on the notion of autonomy (privacy) and security by Parmelee and Lawton (1990), Bosch and colleagues (2016) called for a balance between patient privacy and the need for high visibility of patient spaces by staff. According to Morelli (2007), it is in these spaces that conversations between patients and healthcare providers usually happen, indicating the priority of high controllability of patient rooms.
The present study shows that space syntax is useful for measuring the vulnerability level of healthcare settings and, if used appropriately, can help to identify the risk of and opportunities for Type II aggression. It shows that space syntax can be used in the various design phases to evaluate, test, and modify different layouts before being applied to healthcare settings. This should also help to reduce construction costs (Haq, 2003; Kim & Lee, 2010).
To be sure, a comprehensive examination of how design can help balance healthcare settings for patients and healthcare work calls for further investigation, not only of the layout and spatial configuration of the clinical areas but also to collect data through behavioral observation and surveys of staff and patients. This study acknowledges the need for methodologically rigorous, evidence-based studies involving human subjects to evaluate how the space syntax findings may relate to the theoretical constructs.
Limitations
The limitations of the present study primarily consist of a lack of on-site observations of staff behavior and staff surveys. Space syntax data, used in this study to investigate ED layouts, should be used along with observational data to ensure that the analysis aligns with the site observations. The present study recognizes that space syntax by itself cannot detect key spatial features that are not reflected in floor plans, but it nevertheless shows that a space-syntax analysis is a useful tool for measuring the vulnerability level of healthcare settings and can, if used appropriately, help to identify the risk of and opportunities for Type II aggression. In other words, we should use several measures in conjunction with each other and not in isolation. Although this research has been approved by institutional review board, due to Covid-19 and the difficulty of recruiting ED personnel for focus groups, it was unable to engage human participants. For this reason, the immediate plan of the researcher is to further develop this research using a comparative analysis of space syntax analysis findings and the perceptions of healthcare professionals. This will mean conducting a survey (focus group or interviews) with ED staff members (doctors and nurses). Additionally, data from this research should be useful for future studies once the preliminary hospital data are available.
Brantingham (2020) notes that because we cannot prevent aggressive behavior by using legal sanctions alone, we should always consider the environmental design. While design cannot prevent every hospital assault, a thoughtful design may be teamed with community cohesion to lessen violent incidents in hospital settings.
Implications for Practice
Architectural elements play a key feature in creating a sufficient amount of visual control from key staff areas that will potentially reduce risks of aggression and violence in healthcare settings.
A better visual connectivity is resulted from connectivity of circulations spaces and corridors that link different regions and zones across the entire layout.
Spatial configurations that create a sense of loops of circulation spaces, where zones are arranged along parallel corridors (lined up in one direction), impact the overall connectivity of spaces across the entire layout.
Floor plans featured with multiple corridors and zones clustered on different directions (i.e., not packed and orderly arranged) create a lower level of connectivity, resulting in poor visual and physical access across the entire layout.
Having visual access to other spaces from staff locations may not necessarily indicate that patient areas are in the sightline of the staff locations, or vice versa.
To identify the level of visual access and visual exposure of staff location and patient areas, the control and controllability measures should be examined separately in relation to each other.
Junctions, that is, intersections of corridors, may have the higher levels of visibility in each zone.
Open layouts where stations are located on one side and patient spaces on the other (with limited physical obstructions in between) will have higher levels of control for stations and controllability for patient areas.
A centralized zone where patient rooms are arranged around a central station and the entrances of the zone are in the sightline of the station, will have a high level of control from staff location.
Double sliding glass doors which allow visibility into patient rooms are recommended for risk prone areas such as triage rooms.
Smaller zones with the compact and simple space configurations may offer higher control over the patient areas.
Single corridor layouts, where stations are arranged along the strategic spaces (i.e., triage rooms), may result in lower control over these spaces.
Alcove-style spaces usually are associated with limited visibility to the surrounding areas.
Alcove style reception desks (or other workstations) arranged in line with the strategic spaces would get limited control, therefore, are not recommended.
Central corridor with patient rooms on both sides and station at the end of corridor will render it difficult to supervise patient rooms and alcoves.
In layouts where the two zones are separated in terms of the function but not completely apart physically where visually are obstructed to the other side, the overall control and controllability of the entire region will be impacted, that is, they work better apart.
The visual obstructions can be created by supporting spaces between the two stations, walls, and the overall distance.
The size of the zone may impact staff awareness of the surrounding environment.
While physical connectivity of zones provides easier accessibility to the other side, it creates larger and perhaps more complex environment for the staff working in each zone.
The larger and more complex environment can limit the visibility and consequently supervision over the entire connected region.
Supplemental Material
Supplemental Material, sj-pdf-1-her-10.1177_19375867231151225 - Using Space Syntax Analysis to Measure Patient Aggression Risk
Supplemental Material, sj-pdf-1-her-10.1177_19375867231151225 for Using Space Syntax Analysis to Measure Patient Aggression Risk by Soheyla MohammadiGorji, Linda Nubani, Sheila J. Bosch, Shabboo Valipoor and Sam McElhinney in HERD: Health Environments Research & Design Journal
Footnotes
Declaration of Conflicting Interests
The author(s) declared no potential conflicts of interest with respect to the research, authorship, and/or publication of this article.
Funding
The author(s) received no financial support for the research, authorship, and/or publication of this article.
Supplemental Material
Supplemental material for this article is available online.
References
Supplementary Material
Please find the following supplemental material available below.
For Open Access articles published under a Creative Commons License, all supplemental material carries the same license as the article it is associated with.
For non-Open Access articles published, all supplemental material carries a non-exclusive license, and permission requests for re-use of supplemental material or any part of supplemental material shall be sent directly to the copyright owner as specified in the copyright notice associated with the article.