
Abstract
Background. Criterion-related validity of a self-administered questionnaire listed as gold standard requires objective testing. The aim of this study was to analyze the Foot Health Status Questionnaire (FHSQ) using functional variable measures (dynamic plantar pressure and foot strength). Materials and methods. A total of 22 elderly healthy participants (13 women and 9 men) were screened by interview and physical examination for foot or gait abnormalities. Foot strength, footprint pressure, and foot health status were measured. Results. All the items of the FHSQ show significant correlation with functional variables, but general foot health shows the highest correlation with the 4 physical variables related to plantar pressure (R2 = 0.741), followed by foot pain (R2 = 0.652). Conclusion. A set of different, directly measured physical variables related to foot strength and plantar pressure significantly correlate with the FHSQ dimensions.
Keywords
“The assessment of functional variables is a basic requirement in clinical practice and research and is an important tool in managing health resources.”
Introduction
The structure and function of the foot significantly change with advancing age. The percentage of individuals aged 65 years and above suffering from foot problems is more than 40%.1-5 Older adults exhibit flatter feet; a reduced range of motion, tactile sensation, and strength; and a higher prevalence of foot deformity. In the examination of pressure patterns, older people show significant reductions in the magnitude of forces and pressures exerted by the heel, lateral forefoot, and hallux but greater relative duration of contact with the heel, midfoot, and metatarsophalangeal region. 6 The assessment of functional variables is a basic requirement in clinical practice and research and is an important tool in managing health resources. Questionnaires are a powerful tool to measure health and clinical outcomes.7,8 Patient-reported outcomes assist clinicians’ understanding of the effects of the disease on a patient’s capabilities, functioning, and symptoms. An effective, reliable, quick-to-achieve, and affordable tool is crucial in clinical practice, especially when the methods available are limited.
The Foot Health Status Questionnaire (FHSQ)9,10 measures the specific quality of life related to foot health. It is a tool that was designed and validated in Australia. The FHSQ can be considered a composite questionnaire because it has a section specific to the foot and a general health-related section analogous to the 36-Item Short-Form Health Survey. A study has analyzed its criterion validity, construct validity, and clinical utility of this instrument. 10
The validity of this tool has already been studied internally; its reliability, construct validity, and clinical utility are such that it can be considered the gold standard. 10 Nevertheless, external objective validity of the criteria should be sought as well as observing whether there is a correlation between perceived health status of the patient and an objective measurement of foot dynamics.
Thus, checking criterion-related validity or external validity of FHSQ domains as regards plantar pressure could justify the use of this questionnaire by clinicians and researchers. Knowledge of predictors may be important for planning (conservative) treatment aimed at improving foot health status.
The objective of this study is to define the external validity of the FHSQ using 2 objective measures of reference—the strength of the foot and plantar pressure. The hypothesis is that the results of this analysis will show the external criterion validity of this tool, emphasizing that this is a simple, cheap, and reliable tool that can be used by both clinicians and researchers.
Materials and Methods
A total of 22 elderly, healthy participants (13 women and 9 men) from Málaga, Torremolinos, and Benalmadena, Spain, were recruited from a physical activity program proposed by the Patronato Municipal de Deportes de Torremolinos, which included 3 sessions per week that lasted at least 1 year. Written consents were obtained from all participating patients after a verbal and written explanation of the project. All participants were screened by interview and physical examination for foot or gait abnormalities. They had no history of significant foot or lower-limb abnormalities (plantar hyperkeratosis and heloma durum, plantar fasciitis, nail pathology, leg/hip/knee pain, first metatarsophalangeal joint bunion formation, heloma molle, tarsalgia, capsulitis, interdigital neuroma, trauma, and scar tissue) 10 during the 12 months preceding the commencement of the study. Essentially, the external validity was calculated using data obtained from healthy people. Participants were excluded from the study if they had clinical signs of pes planus, pes cavus, hallux valgus, hallux limitus, or claw toes or if they had pain in any part of the foot at the time of the study. We measured qualitative variables related to the foot health status and quantitative variables related to foot strength and plantar pressures. The study was conducted in February 2012 in a Laboratory of the Health Physical Fitness Control Area of the Patronato Municipal de Deportes de Torremolinos, Malaga, Spain, with approval from the bioethics committee of the University of Malaga.
Quantitative Measures
Evaluation of foot strength using a dynamometer
The isotonic strength of different foot movements was determined by dynamometry. The test was developed in a controlled laboratory environment to avoid injury and was ceased immediately if the participants experienced pain. The strength of the dynamometer was increased gradually. The test was quantified by a PowerTrack JTECH medical dynamometer. The validity of this dynamometer has been demonstrated, with an intraclass correlation coefficient (ICC) ranging from 0.72 to 0.85. 11
The participant was positioned seated on a couch without the feet touching the floor. The examiner, on 1 side of the patient, placed 1 hand on the bottom part of 1 of the lower limbs to stabilize the limb. The transducer of the dynamometer was placed at the relevant foot to measure the different movements (adduction, abduction, dorsiflexion, plantarflexion, and hallux flexion). The test was performed 3 times in each participant, with a 2-minute break between sets. The highest result was recorded and used for data analysis
Evaluation of plantar pressures
The measuring system used was the BioFoot (IBV, Valencia, Spain) in-shoe system. This consisted of a pair of thin (0.7 mm), flexible, polyester insoles, each with 64 piezoelectric sensors 0.5 mm thick and 5 mm in diameter. The sensors were distributed in accordance with the foot physiology, in such a way that there was a greater density of sensors under bony areas where pressures tended to be higher, 12 particularly under the forefoot (see Figure 1). The insoles were available in different sizes, permitting a good match to the shoe interface. They were connected to an amplifier, which in turn was connected to a transmission module attached to the participant’s waist. Data were sent by digital telemetry from the amplifier to be logged onto a computer and then processed by software that showed the pressure, contact time, and pace parameters. The system used kilopascal units (1 kPa = 1/98 kg/cm2). The digital telemetry system had a range of 200 m, which permitted the participants to walk without restriction and measurements to be made on the sports field. Sampling rates were between 50 and 250 Hz. The ICCs of the BioFoot are between 0.76 and 0.96. 12
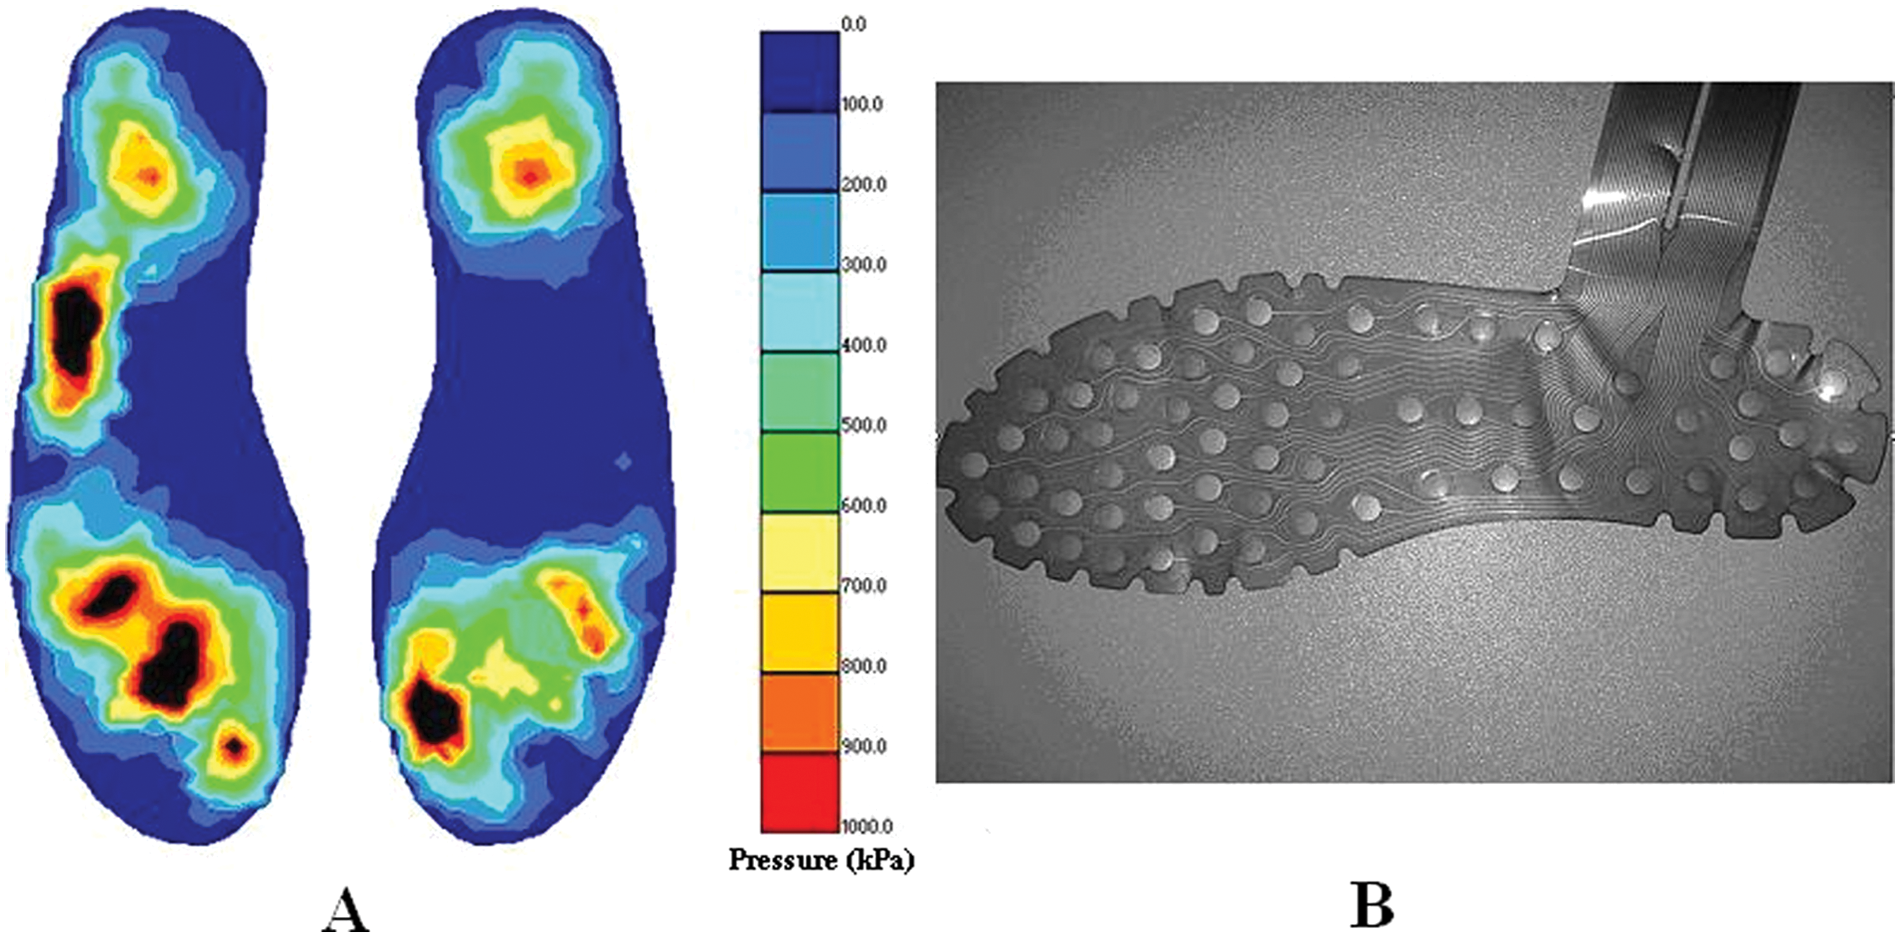
A. Example of Plantar Pressure Output in a Correctly Logged Trial. B. BioFoot Insoles, 64 Sensors.
To avoid differences in personal footwear, all participants wore appropriate sized shoes of the same brand during the data collection process. The shoes had a wide toe box, Velcro adjustment across the top, and a heel height of 2.5 cm. Measurements were taken in a 40-m long corridor, which permitted the participants to walk. The pressure insoles were placed inside the shoes at the shoe–foot interface, and the system’s connections were attached to the legs and waist. The participants tightened the shoes with the Velcro adjustment as they would normally and familiarized themselves with the testing procedure by walking at their own normal walking pace (90-110 steps/min) for 3 to 4 minutes. The software program was then used, and the insoles were reset following the manufacturer’s instructions. The trial began when the participants were in the middle of the corridor and had reached the selected pace (90 steps/min), avoiding the beginning and end of the walk. The participant had to walk for 20 s, at a pace of 90 steps/min without altering the direction of the walk. The test was performed 3 times, and the software automatically selected the best record from principal component analysis.
Qualitative Measures
Evaluation of foot health status
The Foot Health Status was measured using the FHSQ, a self-rated health status measure.10,13 The FHSQ comprises 3 main sections. Section 1 has 13 key questions (with Likert scale responses) spanning 4 hypothesized domains (subscales) of foot health: foot pain, foot function, footwear, and general foot health (GFH). For each of the 4 subscales, respondent scores are transformed, then summed, and finally converted into a scale from 0 (representing the poorest state of foot health) to a maximum score of 100 (signifying optimum foot health). Each of these 4 domains represents unique but related dimensions of foot health. The foot pain, foot function, and GFH subscales consider the presence or absence of a health status and points between these 2 extremes, whereas the footwear subscale is bipolar, meaning that this scale captures either positive or negative foot health states.
Section 2 has 20 questions that capture the general measures of health and are analogous to the well-known Short Form 36 (SF36) quality-of-life questionnaire. The SF36 was used by the Australian Bureau of Statistics in the 1995 National Health Survey.
Section 3 collects standard demographic data and variables like socioeconomic status, comorbidity, service utilization, and satisfaction in a format consistent with the Australian Bureau of Statistics data collection surveys. A computer program has been designed for use in conjunction with the FHSQ, which enables easy interpretation of responses by the simple coding of answers into the program.
The FHSQ has been previously validated (content, criterion, and construct validity) across a wide spectrum of pathologies, including skin, nail, and musculoskeletal disorders. It has a high test-retest reliability (ICCs ranging from 0.74 to 0.92) and a high degree of internal consistency (Cronbach’s a ranging from 0.85 to 0.88). 10
Data Analysis
To analyze the results, a database was created from the information gathered from the participants and the self-administered questionnaire (FHSQ). The analysis was performed to check the criterion validity of the domains of FHSQ with respect to plantar pressure and foot strength, observing correlations between the variables measured in the participants. Descriptive statistics were performed with measures of central tendency and dispersion of the variables studied. To find relationships among the variables, Pearson’s linear correlation was used with 95% confidence intervals and a multivariant correlation. The variables that have been correlated previously by other authors 14 (such as weight, maximum plantar pressure, or peak plantar pressure) were used as predictor variables.
For external criterion validity of the self-administered questionnaire, a multiple regression analysis was used to determine the level of contribution to the model by the variables. The dimensions of FHSQ (self-reported) were used as the dependent variables, and foot strength and plantar pressure (direct measures) were used as independent variables and expressed using the standardized coefficient β values from 0 to 1, representing the contribution to the statistical model. In the regression model, the coefficient β—standardized for each side—does not represent the variability of lateral and contralateral measures, if the contribution of each variable in the statistical model is considered.
Results
Preliminary Analyses
Descriptive statistics for each sample characteristic and foot health status are shown in Table 1. Foot strength and plantar pressure characteristics of the sample are shown in Table 2. Tables 1 and 2 show low variability in the anthropometric variables but high variability between participants for foot health status, foot strength, and plantar pressure. Pearson’s linear correlation results between the self-reported clinical variables and the directly measured physical variables are shown in Table 3. The clinical variable GFH in the FHSQ correlated the most with the 4 physical variables related to plantar pressure, followed by foot pain in the FHSQ. For the other 6 clinical variables in the FHSQ (foot function, foot wear, vigor, general health, social capacity, and physical activity), we found lower correlation values related to foot pressure and strength.
Anthropometrics and Foot Health Status Characteristics of the Sample (n = 22)
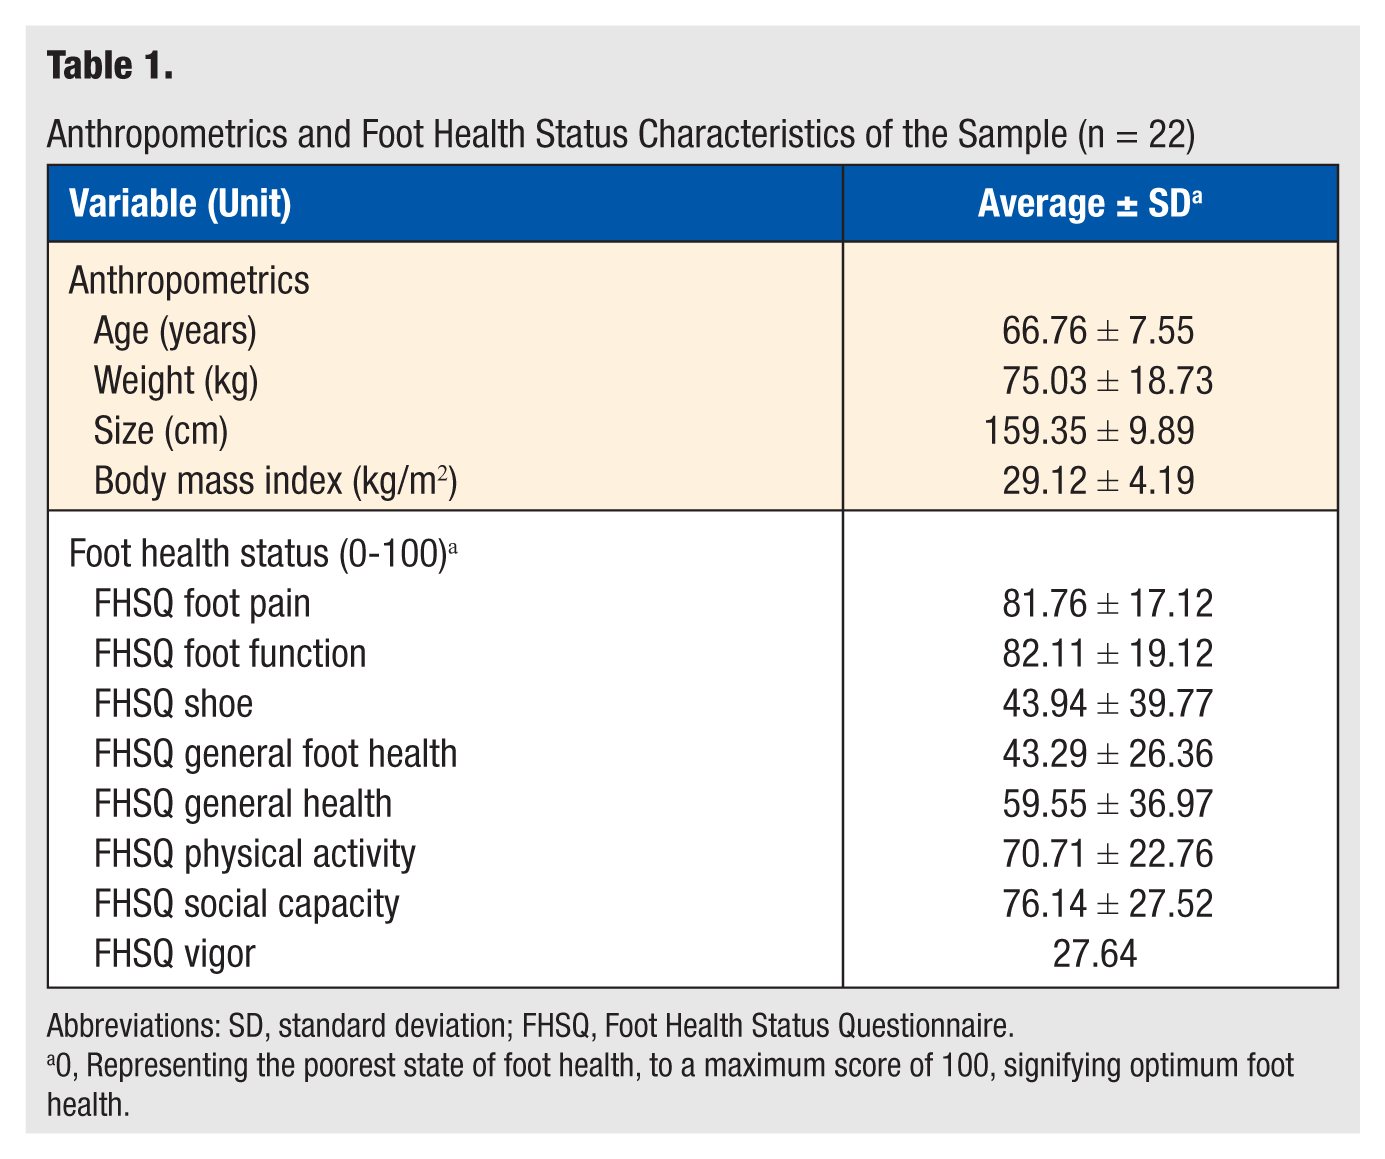
Abbreviations: SD, standard deviation; FHSQ, Foot Health Status Questionnaire.
0, Representing the poorest state of foot health, to a maximum score of 100, signifying optimum foot health.
Foot Strength and Plantar Pressure Characteristics of the Sample (n = 22)
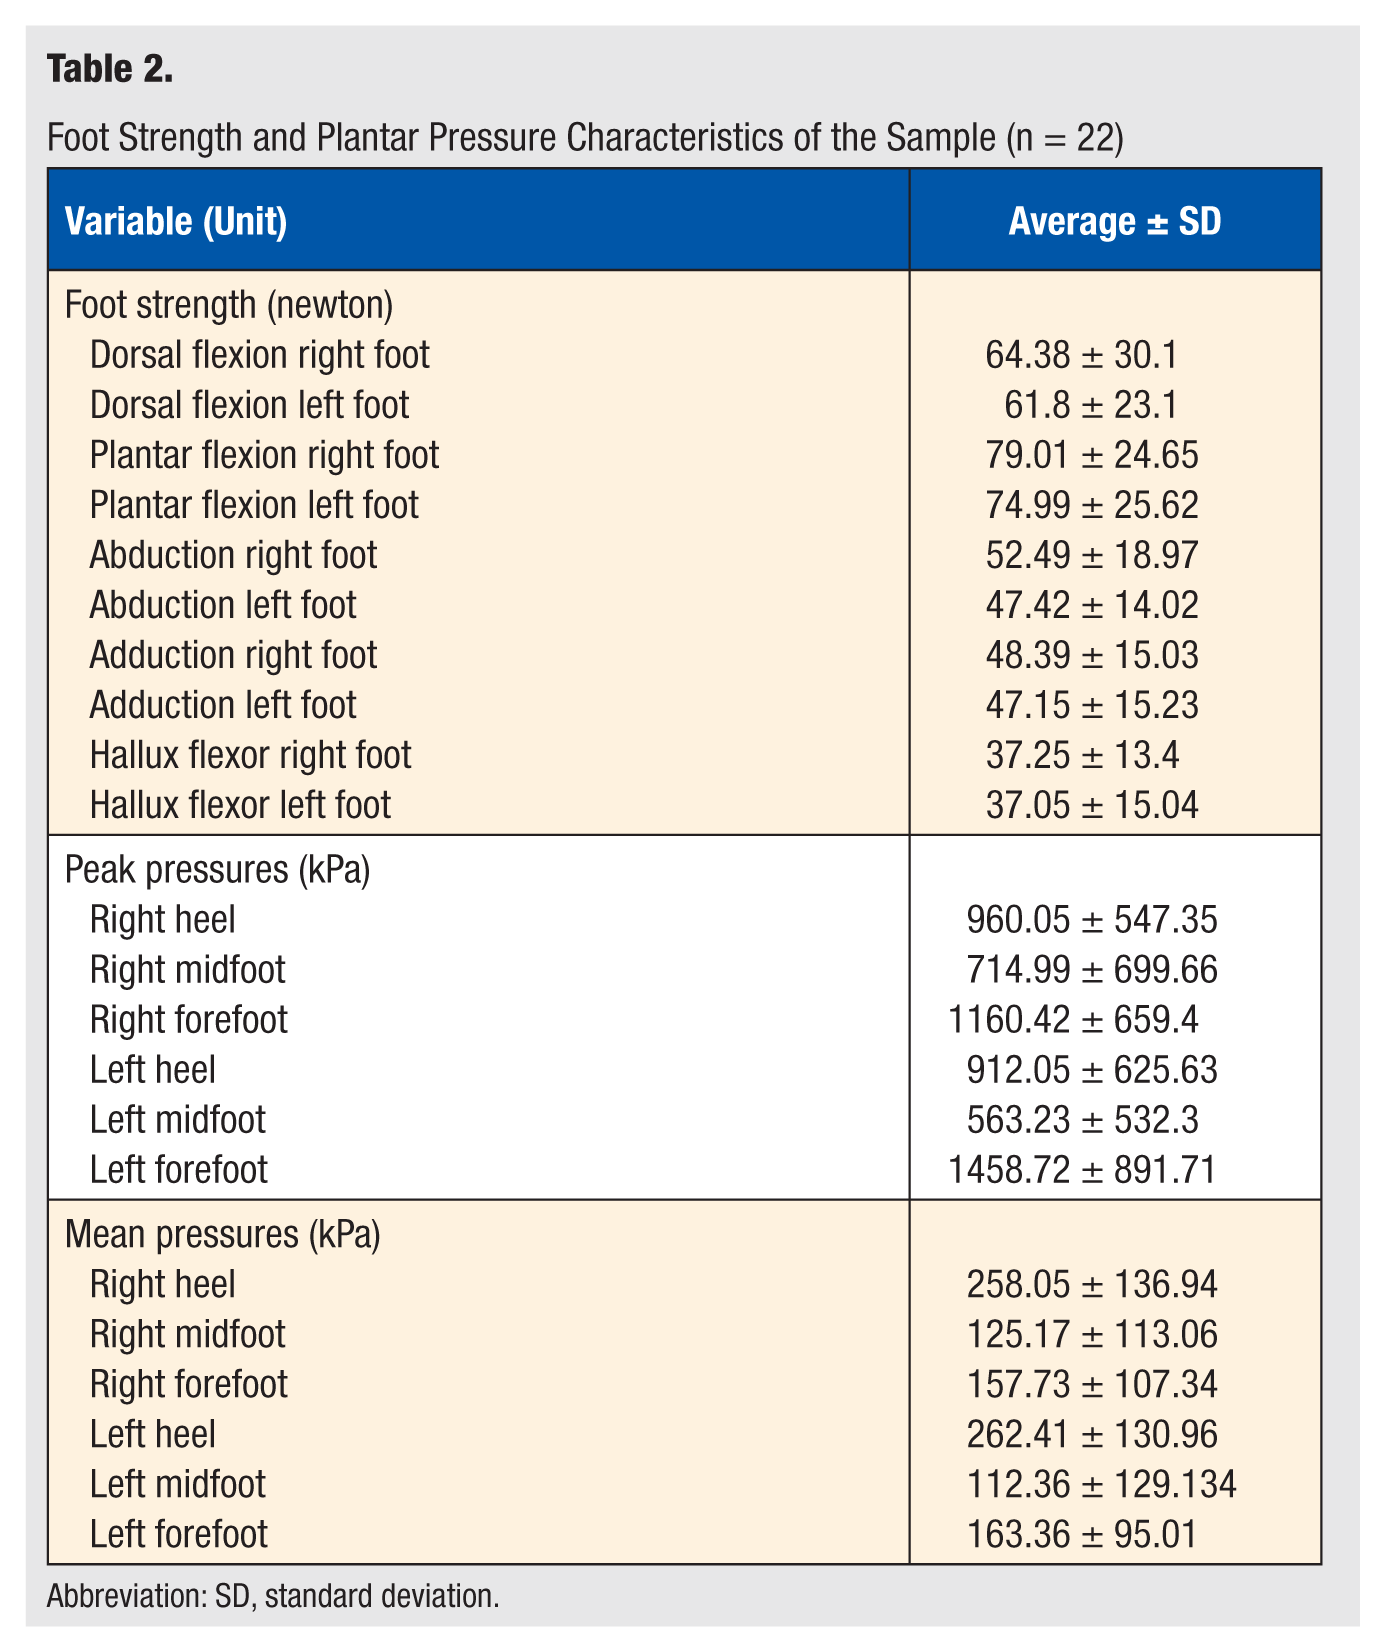
Abbreviation: SD, standard deviation.
Pearson Correlation Coefficient Between Clinical and Functional Variables
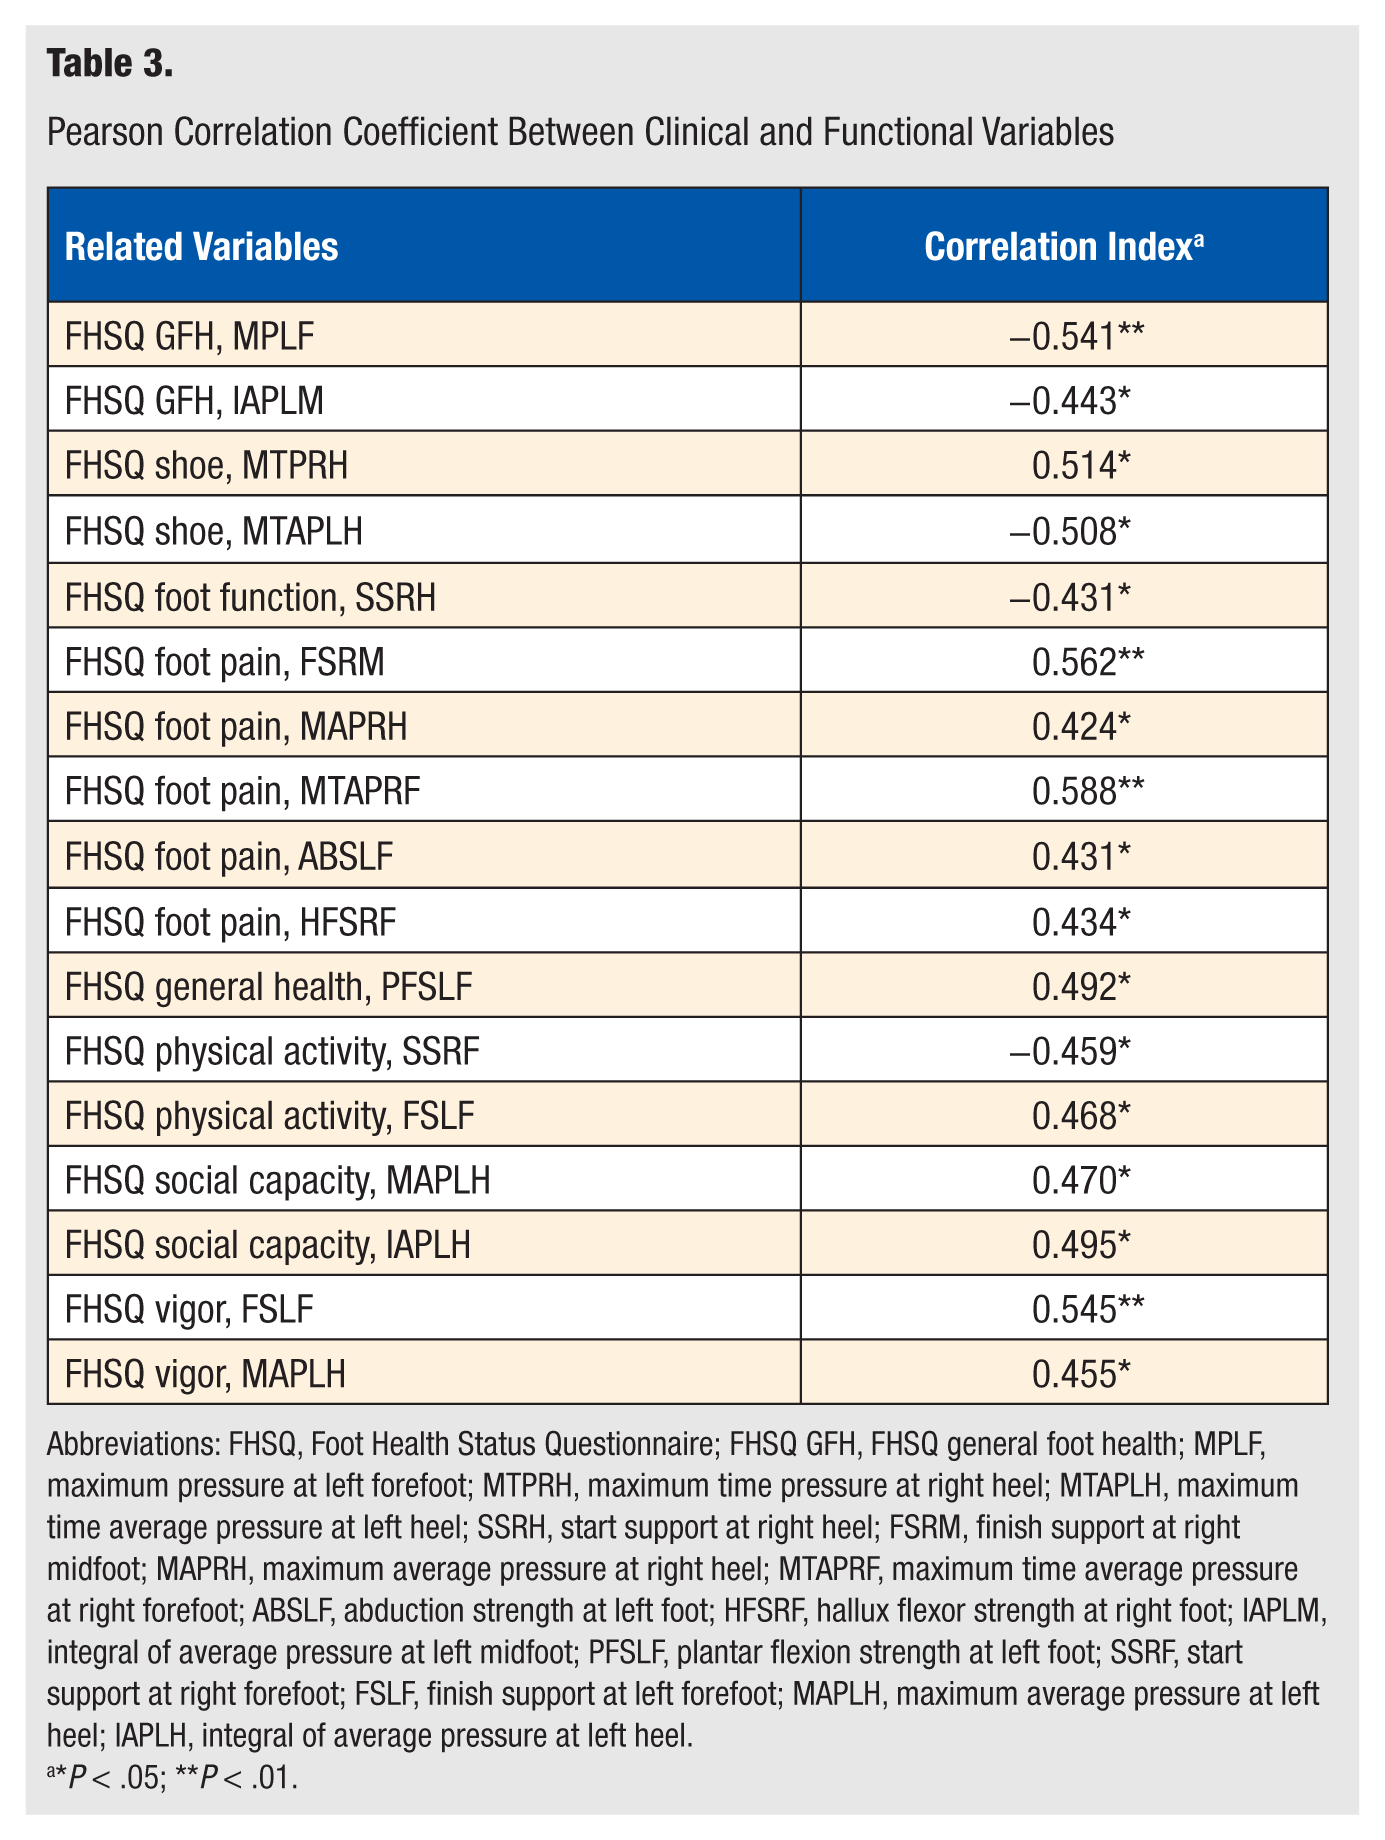
Abbreviations: FHSQ, Foot Health Status Questionnaire; FHSQ GFH, FHSQ general foot health; MPLF, maximum pressure at left forefoot; MTPRH, maximum time pressure at right heel; MTAPLH, maximum time average pressure at left heel; SSRH, start support at right heel; FSRM, finish support at right midfoot; MAPRH, maximum average pressure at right heel; MTAPRF, maximum time average pressure at right forefoot; ABSLF, abduction strength at left foot; HFSRF, hallux flexor strength at right foot; IAPLM, integral of average pressure at left midfoot; PFSLF, plantar flexion strength at left foot; SSRF, start support at right forefoot; FSLF, finish support at left forefoot; MAPLH, maximum average pressure at left heel; IAPLH, integral of average pressure at left heel.
*P < .05; **P < .01.
External Criterion Validity of the FHSQ
All variables of the FHSQ were significant when correlated with the dependent variables. The variables GFH, foot pain, and vigor showed a significantly higher correlation (P < .01) than the variables foot function, foot wear, physical activity, social capacity, and general health (P < .05; Table 3). These independent variables explained 74.1%, 65.2%, 64.9%, 62.1%, 50.4%, 63.2%, 60.2%, and 47.6% of the variance, respectively (see Table 4).
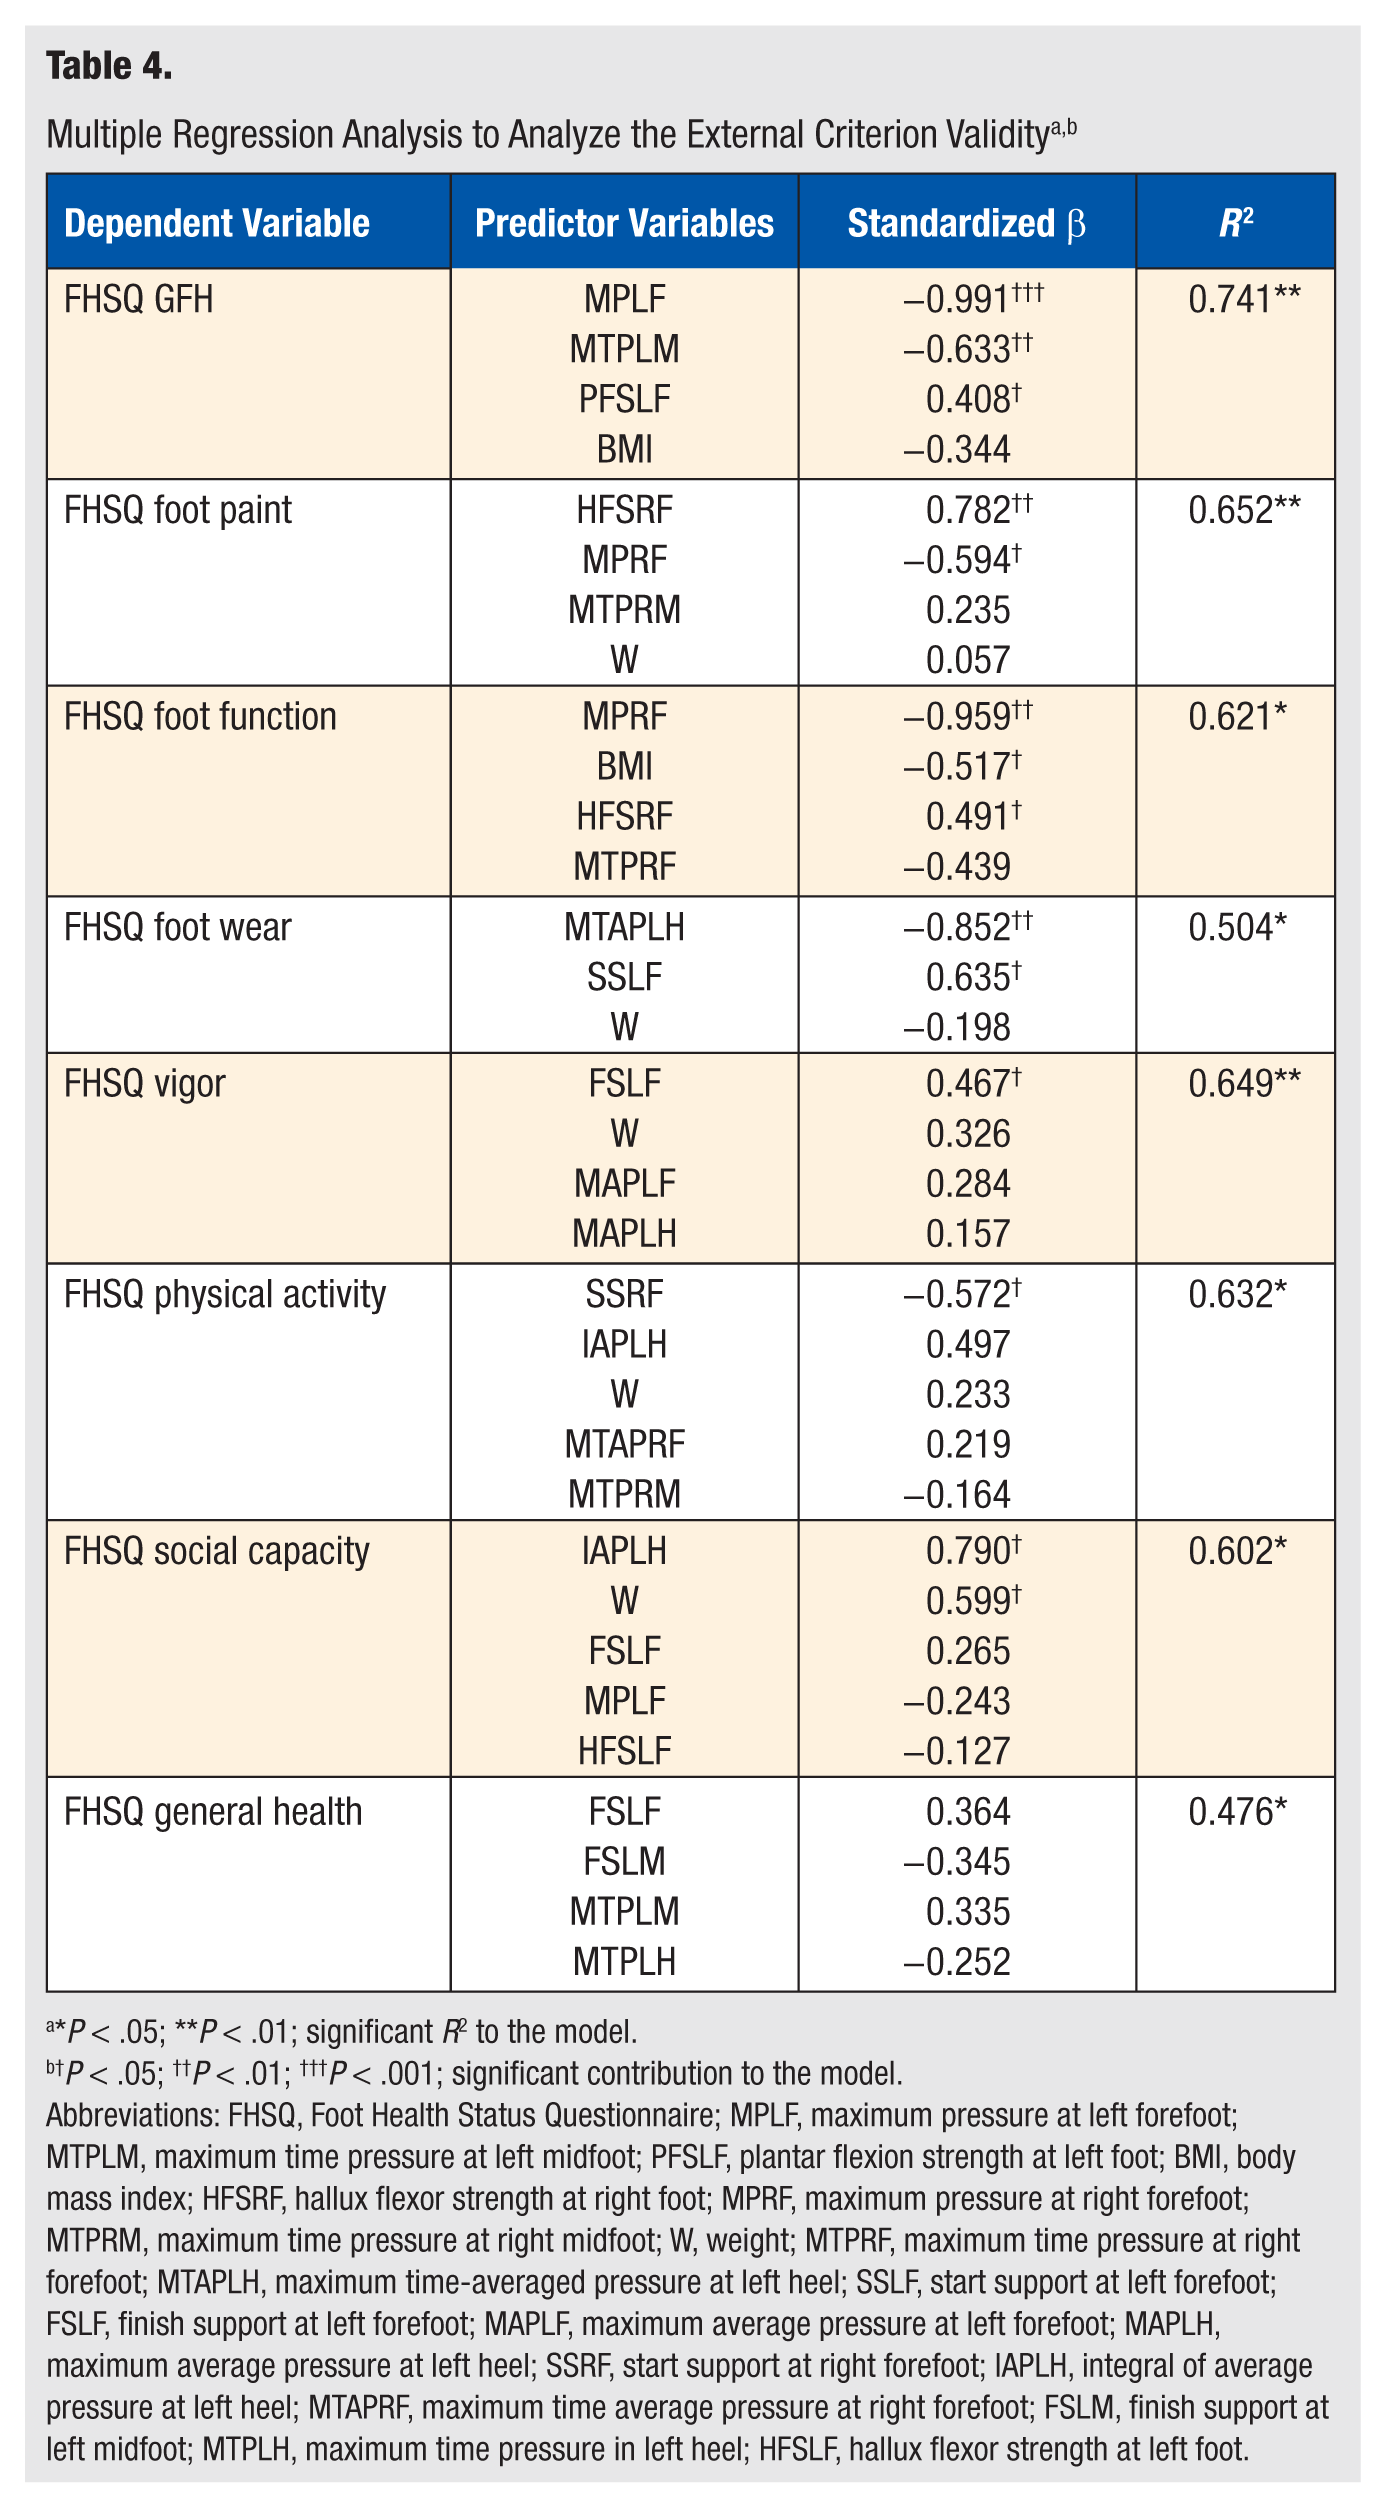
*P < .05; **P < .01; significant R2 to the model.
P < .05; ††P < .01; †††P < .001; significant contribution to the model.
Abbreviations: FHSQ, Foot Health Status Questionnaire; MPLF, maximum pressure at left forefoot; MTPLM, maximum time pressure at left midfoot; PFSLF, plantar flexion strength at left foot; BMI, body mass index; HFSRF, hallux flexor strength at right foot; MPRF, maximum pressure at right forefoot; MTPRM, maximum time pressure at right midfoot; W, weight; MTPRF, maximum time pressure at right forefoot; MTAPLH, maximum time-averaged pressure at left heel; SSLF, start support at left forefoot; FSLF, finish support at left forefoot; MAPLF, maximum average pressure at left forefoot; MAPLH, maximum average pressure at left heel; SSRF, start support at right forefoot; IAPLH, integral of average pressure at left heel; MTAPRF, maximum time average pressure at right forefoot; FSLM, finish support at left midfoot; MTPLH, maximum time pressure in left heel; HFSLF, hallux flexor strength at left foot.
In addition to the foot health status, the maximum pressure at the left forefoot showed the most significant standardized value of β for FHSQ GHF (standardized β = −0.991; P < .001). The maximum pressure time at the left midfoot gave the second highest significant value (standardized β = −0.633; P < .01). The strength variable was the least significant (standardized β = 0.408; P < .05).
For the FHSQ foot pain dimension, the highest significant β was seen for the hallux flexor strength of the right foot (standardized β = 0.782; P < .01); the other significant β value was seen for the maximum pressure of the right forefoot (standardized β = −0.549; P < .05).
For FHSQ foot function, the highest significant β value was provided by the maximum pressure of the right forefoot (standardized β = −0.959; P < .01), followed by the body mass index (BMI; standardized β = −0.517; P < .05). The lowest significant β value was given by the hallux flexor strength of the right foot (standardized β = 0.491; P < .05).
Regarding FHSQ foot wear (Table 4), the most significant β value was generated by the maximum time-averaged pressure at the left heel (standardized β = −0.852; P < .01) and the starting support at the left forefoot (standardized β = 0.635; P < .01). Figure 2 summarizes the mean plantar pressures and pressure values obtained from the 22 participants.
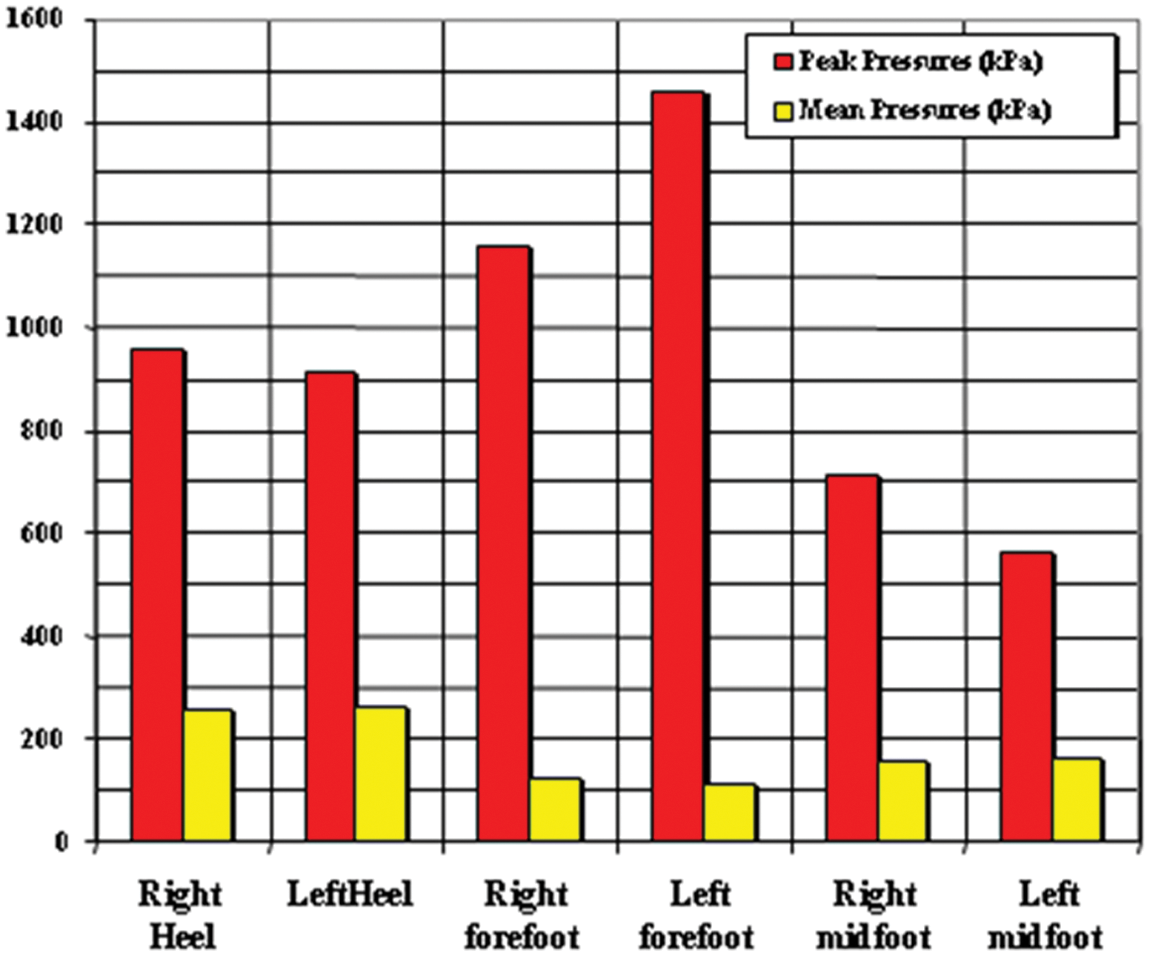
Pressure Image Obtained in 22 Healthy Participants.
Discussion
The main finding of this study was that a set of self-reported clinical variables could be explained through the different directly measured physical variables related to foot strength and plantar pressure. This finding confirms the external validity of the FHSQ criteria with respect to functional variable measures.
External Criterion Validity of the Domains of Strength and Plantar Pressure of the FHSQ
Although the link between functional variables and psychometric variables of the foot has often been mentioned, few studies have systematically investigated this relationship. To the best of our knowledge, this is the first study completed to establish external criterion validity between foot health status, foot strength, and plantar pressure in a group of older adults. Establishment of the aforementioned external validity makes it possible to detect directly measurable predictors of the self-reported clinical variables related to the FHSQ dimensions. Three recent studies provided a relationship between anatomy and/or function and foot-specific health-related quality of life.15-17 The first study, however, used the Manchester Foot Pain and Disability Index to demonstrate a relationship between hallux valgus and foot-specific health-related quality of life. The other 2 studies16,17 used the FHSQ for foot-specific and general health-related quality of life; they focussed on chronic plantar heel pain and hallux valgus and rigidus, respectively. They did not study the variables related to foot strength and plantar pressure together.
The findings of this study suggest that the maximum pressure at the forefoot correlates with the GFH, foot pain and foot function dimensions of the FHSQ. Regarding the relationship between foot pain and plantar pressure, many reports have studied this relationship in patients with pes cavus feet, 18 rheumatoid arthritis,19-22 osteoarthritis,23,24 and callused regions 25 ; however, no studies have identified the contribution of foot strength and plantar pressure to the foot health status.
According to our findings, the maximum pressure time at the midfoot correlates with GFH and contributes to 2 dimensions of the FHSQ. The fact that the participants had a significantly longer relative duration of contact of the midfoot and metatarsophalangeal regions has already been systematically investigated. 6
The present study suggests that the hallux flexor strength of the right foot relates to the foot pain and foot function dimensions of the FHSQ. The association between force, pressure, and the paper grip test indicates that plantar flexor strength may contribute to the stabilization role of the toes during the propulsive phase of gait. 26 The variable that could be more valuable in understanding the behavior of both maximum force and peak pressure is the paper grip test, a clinical measure of the plantar flexion strength of muscles acting on the hallux. 27 It appears that the contribution of these muscles to the stabilization of the toe may enhance the perception of foot pain while being involved in the proper functioning of the foot.
The present findings suggest that body weight and BMI can explain foot function and social capacity and contribute to 5 dimensions of the FHSQ. According to the results from our study and those of another study, 14 body weight could play an important, but not exclusive, role in regulating foot health status.
The strength of this study is that it demonstrated which were the main factors that influence foot health status, including maximum pressure and pressure time at the forefoot and midfoot, hallux flexor strength, and bodyweight or BMI. This is important because a large body weight or high BMI, low strength, and mismatches in plantar pressure are common in older adults. The greater duration and magnitude of pressure generated by a larger weight and lower foot strength could increase loading on the anatomical structures of the foot, which may, in turn, result in foot pain and a decrease in foot health status.
There are some limitations to this study. First, the sample size was modest, at 22 participants, though post hoc computations still achieved a statistical power of 95% (t critical = 1.72, with an a error .05 and a magnitude of relationship = 0.588 between FHSQ foot pain—maximal time-averaged pressure at the right forefoot, calculated as G 4 ). Second, the plantar pressure variables were measured in 3 regions only (forefoot, midfoot, and rearfoot), whereas according to the literature, the clinical determinants of plantar force and pressure during walking in older adults involve 7 regions: hallux, lesser toes, first metatarsophalangeal, second metatarsophalangeal, third to fifth metatarsophalangeal, midfoot, and heel. 14 Another limitation was the shoes and terrain, both of which affect plantar pressure in all areas of the foot, as well as the unmeasured ankle subtalus variation in the participants. In the present study, each participant used the same style of medical shoes and walked along a straight corridor, which eliminated terrain and shoe differences. This may affect the external validity of our results, lowering all the absolute values measured. Finally, the FHSQ was designed as a measurement instrument for outcome studies, where an intervention is provided and the outcome of interest is measured before and after administration of the intervention. 10 However, although designed as an outcome measurement instrument, it is reasonable to consider use of the FHSQ for other clinical applications, including the comparison of health-related quality of life for any condition affecting the feet (eg, the relationship between foot strength, plantar pressure, and foot health status in older adults). Randomized controlled trials should be performed to test the probable causal relationship between self-reported FHSQ clinical variables and directly measured foot strength and plantar pressure physical variables.
The clinical implication of this study relates to the variables identified as contributors to foot health status. Some of these identified variables are modifiable; thus, there is potential for interventions to selectively improve the foot health status. An appropriately designed training program can decrease body weight and increase lower-limb strength. 28 Plantar pressure redistribution via surgical techniques or conservative methods (including podiatric treatment, such as lesion debridement or orthotic treatment) can also remedy foot pain and reduce high pressure at specific locations of the foot.14,29 Providing interventions for older adults with a large body weight, foot pain, and high plantar pressure may also improve foot health status, possibly leading to a better general health status.
Footnotes
Acknowledgements
The authors would like to thank all of the participants. Lauren Kunden, Pod, MD contributed to the manuscript review from a native English speaker.
Conflicts of interest: The authors declare that they have no conflicts of interest.