
Abstract
Over the past 2 decades, several studies comparing intermediate- and long-term outcomes after total ankle replacement (TAR) versus ankle arthrodesis (AA) have reported differing rates of complications and outcomes. Recently, there has been a dramatic increase in patients undergoing TARs without any epidemiologic studies examining the short-term and perioperative complications. The purpose of this prognostic study was to compare perioperative outcomes after TAR and AA using data from the American College of Surgeons National Surgical Quality Improvement Program (NSQIP) database between 2012 and 2017. Patient data were collected from the NSQIP database for surgeries between January 2012 and December 2017 using Current Procedural Terminology codes 27700, 27702, 29899, and 27870. Patients were excluded if treated for fracture, infection, or revision procedures. The outcomes of interest were readmission and reoperation related to initial surgery, surgical site infections, and hospital length of stay. There were 1214 patients included—1027 (84.6%) TAR and 187 (15.4%) AA. The TAR patients were older, had a lower body mass index, and were less likely to have insulin-dependent diabetes. Readmission rate and length of stay was similar between groups. Multivariate regression revealed higher anesthesia severity scores (P = .0007), diabetes mellitus (P = .029), and AA (P = .049) had positive correlations with adverse outcomes. We report a lower complication rate with TAR than previously described. AA arthrodesis is associated with a higher risk of perioperative complications, including deep surgical site infections and reoperations. There were no differences between the 2 groups comparing superficial infection, wound dehiscence, or readmissions in the first 30 days.
Keywords
Over the past 2 decades, the number of total ankle replacement (TAR) cases has increased dramatically, thus the subject of outcomes after ankle arthrodesis (AA) versus TAR for treatment of ankle arthritis has been heavily studied. Retrospective studies have reported patients who undergo AA have had significantly more medical comorbidities, but result in similar patient reported outcomes.1-3 There are differing results regarding long-term complications with some evidence supporting lower rates of hospital readmission and periprosthetic joint infections for TAR, while others state the reoperation rates and major surgical complications for TAR are much higher.3,4 There have been few intermediate studies that show outcomes of TAR appear to be comparable to AA with regard to AOFAS (American Orthopaedic Foot and Ankle Society) ankle-hindfoot scores, implant survival rates, and revisions. 5 These studies have mostly included patients from the 1990s through 2011. 6 McGuire et al 7 in the 1980s put forth the idea TAR was beneficial for patients with severe rheumatologic disease or the elderly or debilitated who would put minimal stress on the implant. Over the past decade, many surgeons have expanded the indications for TAR from the previous recommendation to performing the procedure in younger, more active patients, and patients with increased deformity. Thus, the contemporary population undergoing TAR is likely substantially different from the populations studied previously.
Few studies compare short-term and perioperative outcomes of TAR versus AA. Most of the available literature centers around large database literature reviews that yield less than 10 articles per study. Despite this, few epidemiologic studies have been performed examining short-term outcomes after TAR and AA using a contemporary patient population. The purpose of the current study was to compare perioperative outcomes after TAR and AA using patient data from the American College of Surgeons National Surgical Quality Improvement Program (ACS-NSQIP) database between 2012 and 2017.
Methods
Study Design
Study exemption from the institutional review board was obtained prior to study initiation. Patient records from the ACS-NSQIP database were reviewed. The NSQIP database is a collection of patient records from over 680 participating hospitals across the United States. Each institution employs a trained data reviewer who randomly selects from a variety of surgical cases and uploads deidentified patient information and outcomes up to 30 days after surgery onto a Health Insurance Portability and Accountability Act (HIPAA) compliant web-based platform. The data are made available to investigators affiliated with participating hospitals. Cases included in the database are case-mix and risk adjusted. This method ensures that common surgical procedures with low-risk profiles do not comprise the vast majority of cases included in the database. Additionally, as morbidity and mortality risk profiles may differ from region to region, selected cases are risk adjusted.
Patient Selection and Exclusion Criteria
Patients treated with AA or total ankle replacement TAR between January 2012 and December 2017 were queried using Current Procedural Terminology (CPT) codes 27700, 27702, 29898, and 27870. Patients were grouped according to treatment condition. We excluded patients greater than 90 years of age, those that had a primary diagnosis of fracture or infection, and those undergoing revision or nonankle-related surgery. Out of 1704 initially queried patients, 1214 were included in the final study population. A total of 187 (15.4%) were in the AA group, and 1027 (84.6%) were in the TAR group. The NSQIP database does not include patients for whom the primary procedure CPT is 27870 (open ankle arthrodesis). Those patients that we identified had another procedure listed as primary, for example, gastrocnemius recession or tendoachilles lengthening, with AA listed as an additional procedure.
Patient Factors and Outcome Variables
The NSQIP database reports demographic information such as age, gender, weight, and height. Smoking history and preoperative functional status are also reported. Smoking history is defined as having smoked within a year prior to surgery. Functional status is divided into categories of “Independent,” “Partially Dependent,” and “Completely Dependent” function based on the patient’s ability to perform activities of daily living such as clothing, bathing, and toileting at their peak physical function during the 30 days prior to admission.
A variety of existing medical conditions present at the time of admission were included in the analysis, for example, hypertension, impaired coagulation, diabetes mellitus, renal failure requiring dialysis, and chronic corticosteroid therapy. Diabetes mellitus is further divided into categories “Insulin,” “Non-Insulin,” and “None” according to glycemic control. The NSQIP database does not provide serum glucose or glycated hemoglobin (HbA1C) values. Included relevant laboratory values are the following: serum blood urea nitrogen (BUN), creatinine, white blood cell count, hematocrit, and platelet count. Treatment variables such as hospital setting (inpatient vs. outpatient), duration of surgery, duration of hospital stay, and American Society of Anesthesiologists (ASA) classification were available.
A priori, the primary outcome of interest was the presence of a complication during the immediate 30 day postoperative period. These included surgical site complication, length of stay, unplanned readmission, and unplanned reoperation. Superficial infection, deep infection and wound dehiscence were categorized as surgical site complications. The NSQIP database indicates whether unplanned readmissions and reoperations were related to the index surgery. Instances of readmission or reoperation not labeled as related to the primary surgery were not regarded as complications.
Statistical Analysis
Descriptive statistics for patient factors were reported using median values and 25th to 75th interquartile range (IQR) for continuous variables and frequency and percentage for categorical variables. Comparison of variables between patients with AA and TAR were performed using Student t test or Mann-Whitney U test for continuous variables and χ2 test of independence and Fisher exact test for categorical variables as appropriate. Initial P values were adjusted using Benjamini-Hochberg false discovery rate for multiple comparisons to minimize type I error. 8 The set α value was .05 as the threshold for statistical significance.
Results
There were 1462 patients with a diagnosis of ankle arthritis identified between 2012 and 2017. Of these, 246 patients were excluded due to trauma, fracture, infection, nonfoot- or nonankle-related conditions or due to revision procedures. This left 1216 patients available for inclusion in the study. Of these patients, 1027 (84.6%) underwent TAR while 187 (15.4%) underwent AA.
Patient Characteristics
The median age was 63 years for patients undergoing either procedure. Patients who underwent TAR were significantly older (median 64 years, IQR 57-61) compared with patients undergoing AA (median 57 years, IQR 46-66) (P < .00001). The majority of patients undergoing both procedures were male, nonsmokers. The AA group had a significantly higher body mass index than the TAR group (33.6 vs 31.1 kg/m2) (P < .0001) (Table 1).
Comparison of Patient Demographics and Comorbidities Between Patients Treated With Total Ankle Arthroplasty or Ankle Arthrodesis.
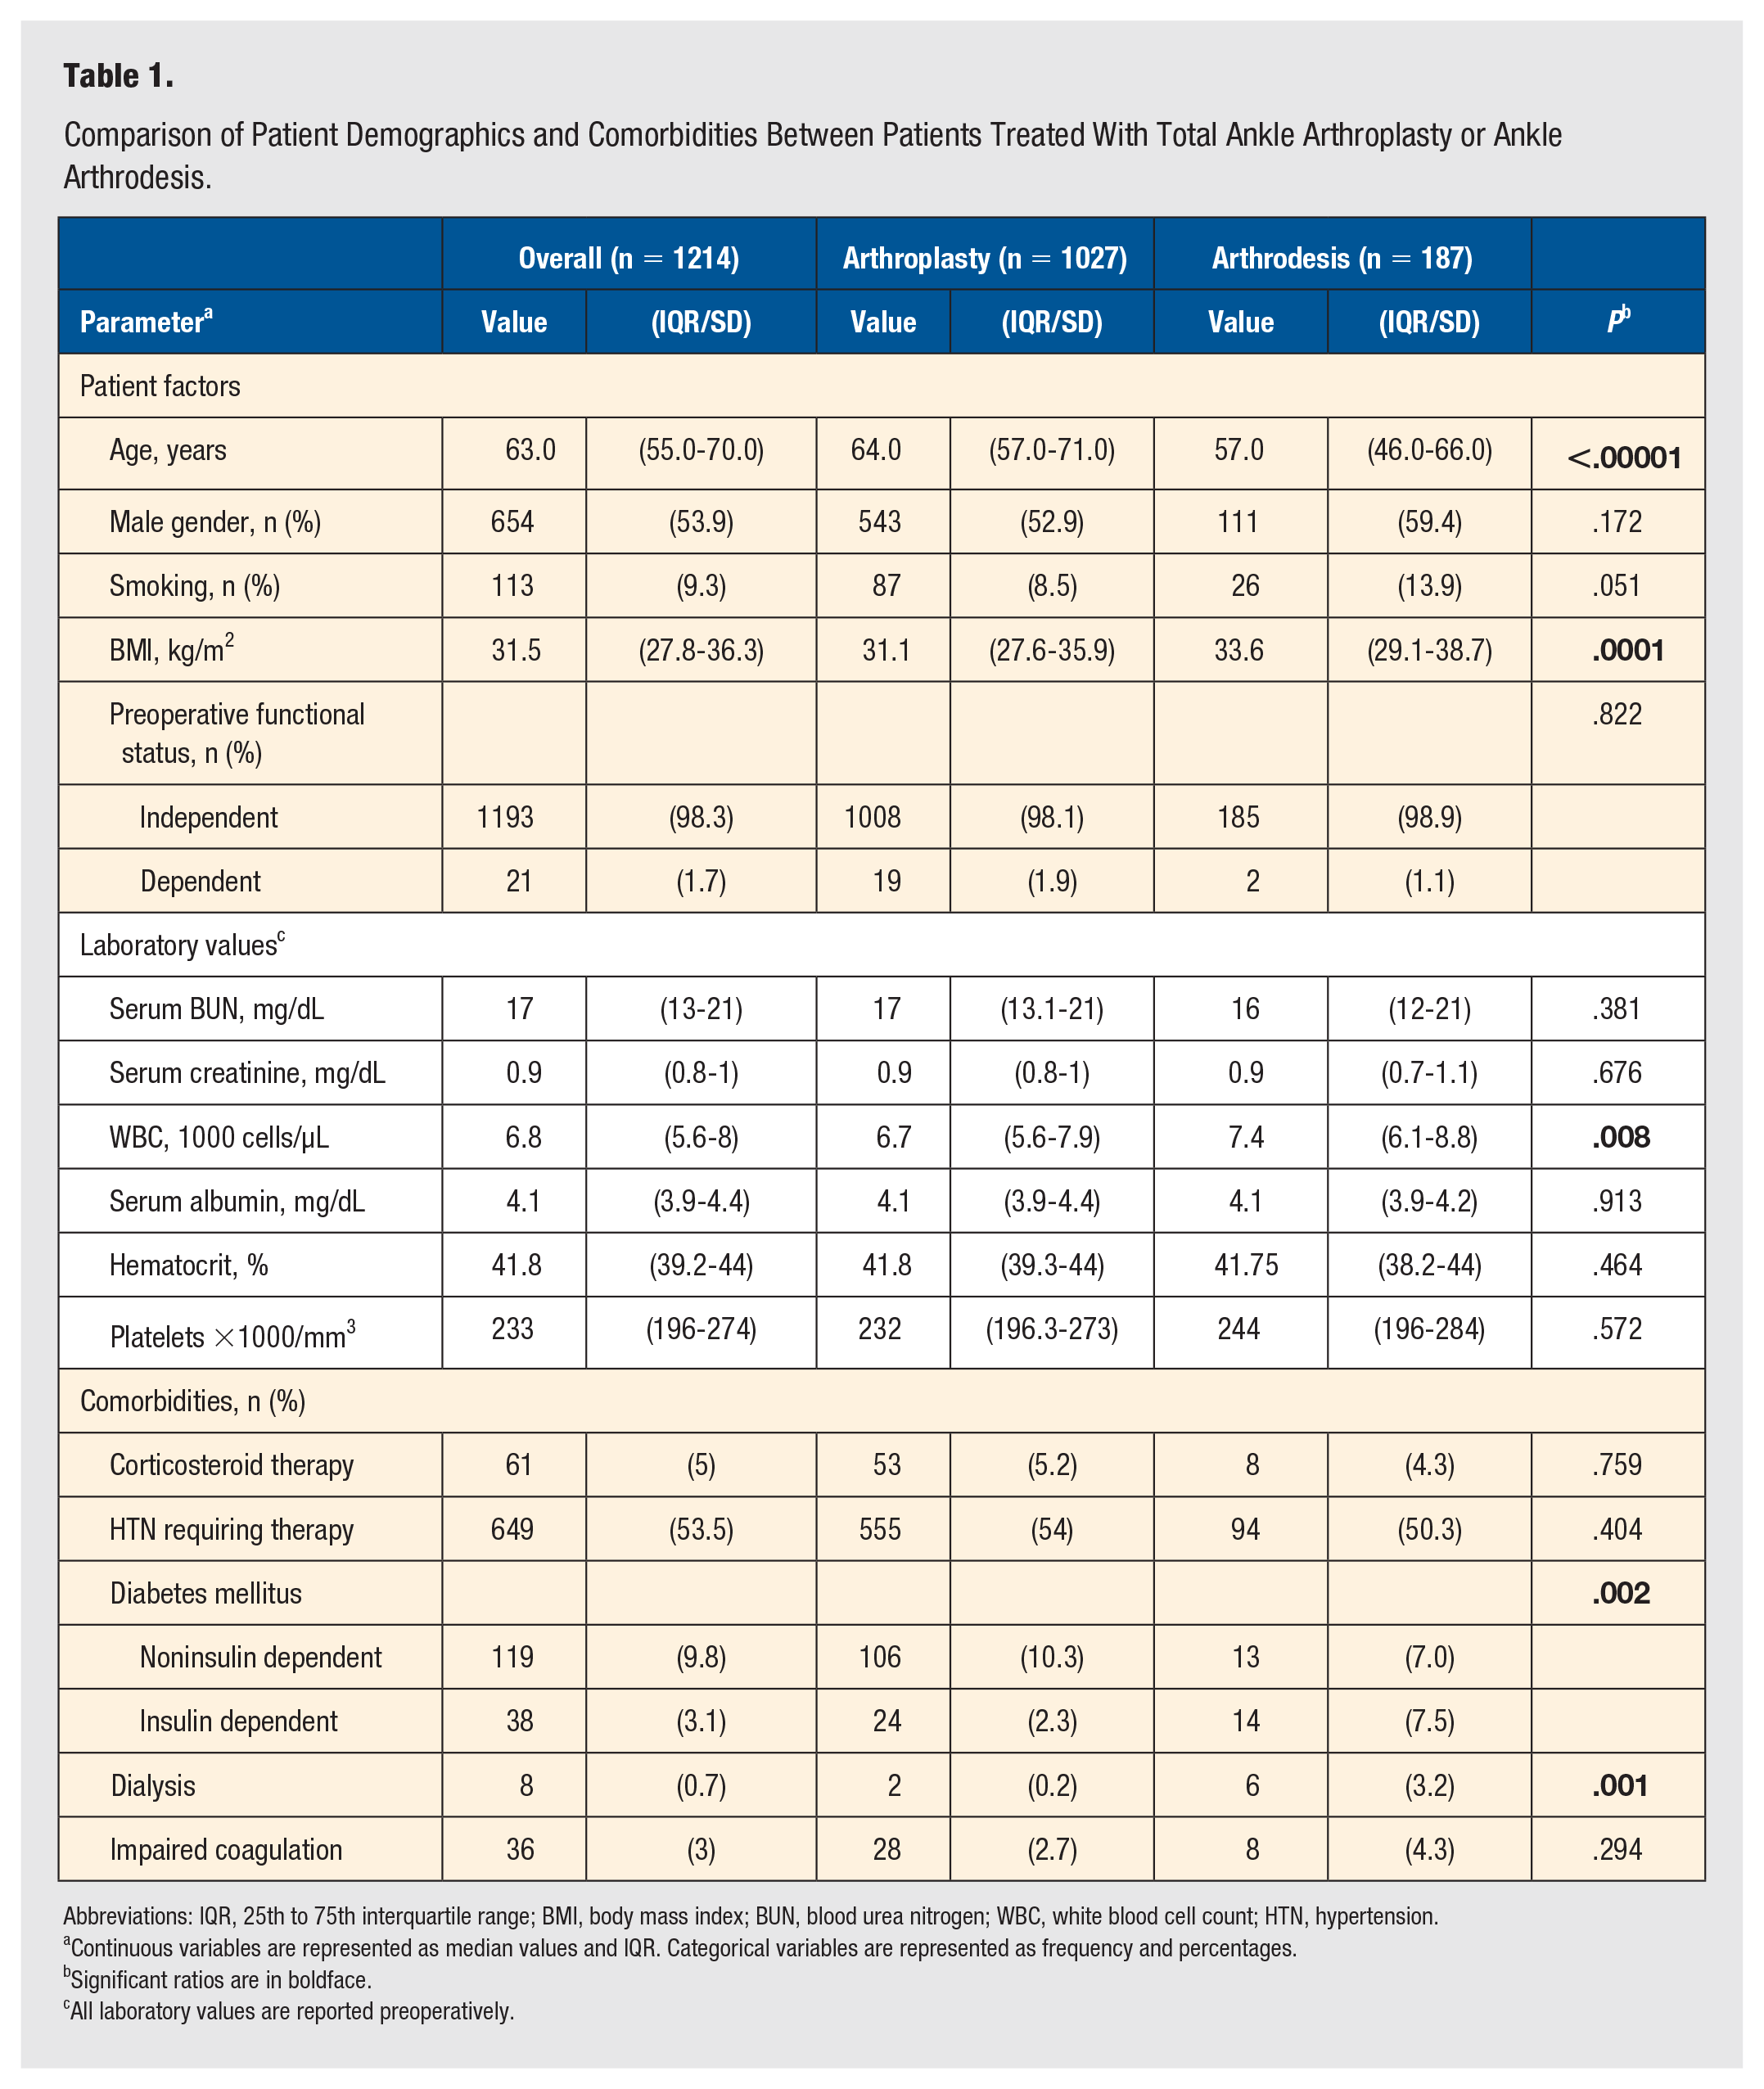
Abbreviations: IQR, 25th to 75th interquartile range; BMI, body mass index; BUN, blood urea nitrogen; WBC, white blood cell count; HTN, hypertension.
Continuous variables are represented as median values and IQR. Categorical variables are represented as frequency and percentages.
Significant ratios are in boldface.
All laboratory values are reported preoperatively.
Laboratory Values
Laboratory values that were assessed included: serum blood urea nitrogen (BUN), serum creatinine, white blood cell count (WBC), serum albumin, hematocrit, and platelets. All values were reported preoperatively. The average values of these lab parameters were only statistically significant for the WBC group. The AA group had a statistically significantly higher WBC than the patients who underwent TAR (P = .008) (Table 1).
Comorbidities
Comorbidities assessed at the time of the operation included: corticosteroid therapy, hypertension requiring therapy, diabetes, dialysis, and impaired coagulation. The diabetic group was further subdivided into noninsulin-dependent diabetes (NIDDM) and insulin-dependent diabetes (IDDM). There were statistically significant differences in the number of patients who had diabetes and dialysis within the 2 operative groups. There were significantly more patients who had diabetes in the AA group than in the TAR group (P = 0.002). There were also more patients who had NIDDM than IDDM in the TAR group (10.3% vs 2.3%). The AA group had a similar number of patients with each type of diabetes (7.0% vs 7.5%). There were significantly fewer patients in the TAR group who required dialysis than in the AA group (0.2% vs 3.2%) (P = .001) (Table 1).
Intraoperative Factors
Significantly more TAR patients were treated in an inpatient setting than the AA group (84.1% vs 54.5%) (P < .00001). The duration of the procedure did not differ significantly between the TAR and AA groups (142 vs 135 minutes) (P = .297). The ASA classification differed significantly, with less patients in the TAR group being class IV-V compared with the AA group (1.2% vs 4.8%) (P < .003) (Table 2).
Comparison of Intraoperative and Clinical Outcomes Between Patients Treated With Total Ankle Arthroplasty or Ankle Arthrodesis.
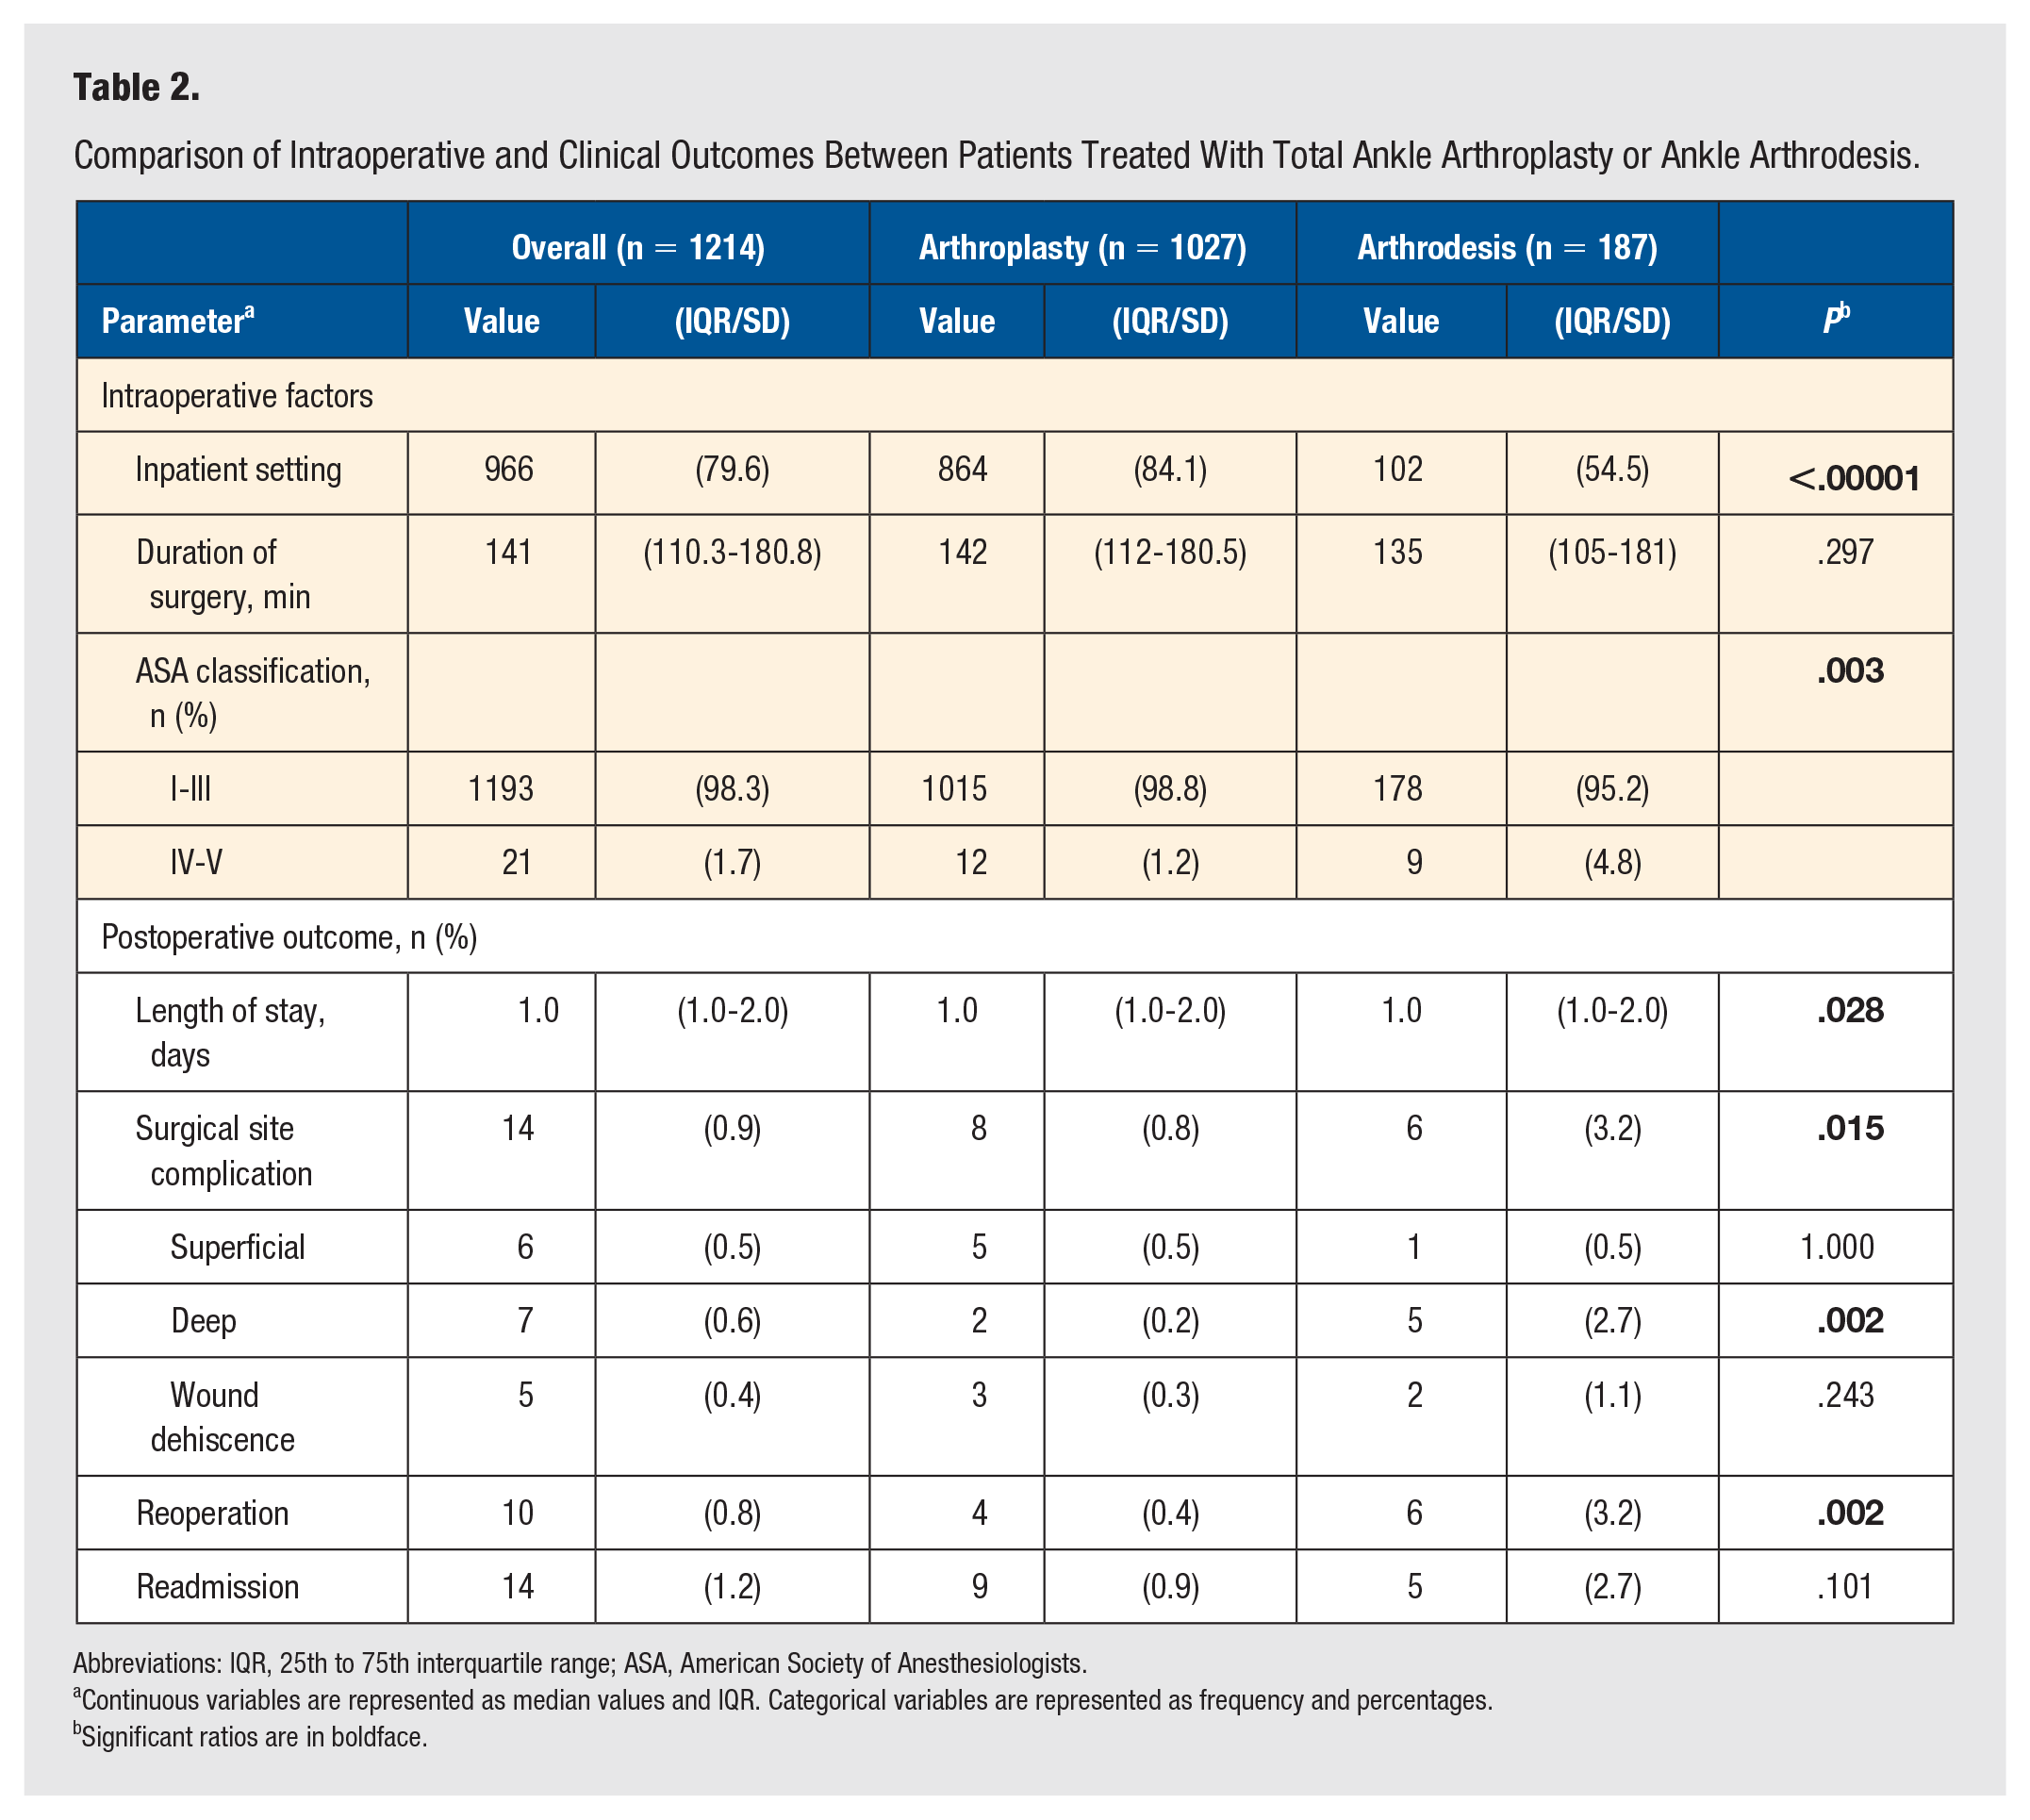
Abbreviations: IQR, 25th to 75th interquartile range; ASA, American Society of Anesthesiologists.
Continuous variables are represented as median values and IQR. Categorical variables are represented as frequency and percentages.
Significant ratios are in boldface.
Postoperative Outcomes
The length of hospital stay was found to be similar between the 2 groups (P = .028). There were less surgical site complications in the TAR group than the AA group (0.8% vs 3.2%) (P < .015). This was further broken down into superficial infection, deep infection, and wound dehiscence. There were no differences between the 2 groups comparing superficial infection and wound dehiscence. There was a significant difference in deep surgical site infections, with fewer patients having a deep infection in the TAR group (0.2% vs 2.7%) (P < .002). The TAR group also had significantly fewer reoperations during the first 30 days than the AA group (0.4% vs 3.2%) (P < .002). There were no significant differences for the 2 groups for readmission rates in the first 30 days. Multivariate regression revealed that higher anesthesia risk category (ASA) (P = .0007), diabetes mellitus (P = .029), and AA (P = .049) had positive correlations with adverse outcomes.
Discussion
This study reports patient demographics and 30-day complication rates using a contemporary database of patients undergoing TAR and AA between 2012 and 2017. Previous studies of intermediate- or long-term complications predominantly include patients who underwent surgery before 2011. As recent technological advances have been made and surgical techniques have evolved, it is important to examine more recent results. Previously reported high complication rates with TAR compared with AA may be biased and poor results may be attributed to outdated techniques, implants, or lack of surgeon experience. While the ideal treatment for end stage ankle arthritis remains an area of debate, there has been over a 1000% increase in TAR from 1991 to 2010. 1 The increased numbers for TAR is likely multifactorial improvements in implant design, instrumentation, and increased exposure during training are several factors that may have led to the increased utilization. Additionally, surgeon experience with TAR has increased over the past decade. Many surgeons are now considering TAR for a wider range of patients with ankle arthritis, including younger patients and those with larger preoperative deformities.
Our findings are concordant with those reported by Stavrakis et al 4 demonstrating lower reoperation rates and surgical site complications for patients undergoing TAR during the first 30 days. These 2 factors are likely linked in that a higher complication rate will often lend itself to an unplanned return to the operating room. It is also not surprising that readmission rates increase with deep infection, as deep infections may require more complex care. Similarly, Jiang et al 6 reported on 15 252 patients in the National Inpatient Sample database treated from 2002 to 2011. They found patients with TAR had a lower risk of blood transfusion, non–home discharge, and overall complication rate when compared with AA. 6 Their reported in-hospital complication rates of 3.7% and 6.0% for TAR and AA, respectively, are higher than we identified in our contemporary population, which suggests a trend toward lower complications for both procedures. 6 AA appears to be independently associated with higher perioperative complications when compared with TAR, which is consistent with previous reports. Although complications were rare among both groups, patients with diabetes or a higher ASA score were found to have more adverse outcomes. Interestingly, patients with diabetes had fewer adverse outcomes with TAR than AA (3.8% vs 7.4%), and this difference was even greater in patients who had insulin dependent diabetes (4.3% vs 13.3%). It is possible that selection bias accounts for this, as patients with complicated diabetes (neuropathy) likely underwent AA rather than TAR. It has been well established that neuropathy itself increases the risk for postoperative surgical complications. 9 In a more recent study, Ross et al 10 compared AA and TAR cohorts for management of primary osteoarthritis in patients treated between 2010 and 2019 using the PearlDiver database. The authors compared 1136 cases of AA and 548 cases of TAR and found increased joint-related complications, including need for hardware removal, periprosthetic fractures, and need for additional corrective surgery at 90 days, 1 year, and 2 years postoperatively in the AA cohort. 10 In a recent prospective multi-center cohort study, investigators studied 414 patients who underwent TAR and compared outcomes with 103 patients who underwent AA between 2012 and 2015 with follow-up up to 2 years. 11 The authors found that both groups reported significant improvement in functional outcomes at all time points but improvement in physical function was reported to be significantly higher in the TAR group compared to the AA group at 2 years. 11 A higher prevalence of minor revisions, defined as procedures not requiring implant removal or non-weightbearing status, were noted in the AA group (12.6% vs 4.1%). 11 However, no significant differences in ankle-specific adverse events at were noted after controlling for age, body mass index, sex, and Functional Comorbidity Index. 11
There are several limitations to our study. The retrospective design and use of a large database introduces potential bias and concerns about the quality of the data. Information regarding preoperative deformity, prior surgical interventions, type of implant, and the surgical approach were unavailable. Additionally, the NSQIP database selection criteria excludes procedures that list AA as the primary procedure, so it is greatly underrepresented in our sample. The patients who underwent AA in our study had a concomitant procedure, for example, tendoachilles lengthening, listed as the primary procedure and AA listed as a secondary procedure. It is unclear why AA was not included under primary procedures by NSQIP. This may be due to the nature of the case-mix and risk adjustment performed on the database or the manner in which these procedures are coded into the database. Regardless, the relative lack of AA cases included in our study represents one of major limitations of this study. In addition, due to the nature of the selection by NSQIP, there is likely selection bias that cannot be fully described in the current study. Surgeons considering AA versus TAR likely take into consideration each patient’s comorbidities and choose one procedure over the other based on patient factors. As this study was not randomized, it is possible that certain patient factors are linked with AA and TAR. Despite these limitations, we still consider this to be a representative sample for the purpose of comparison due to the NSQIP case-mix and risk profile matching. Another major limitation is that fact that NSQIP tracks patients only for 30 days, and we acknowledge that no conclusions are able to be drawn beyond the 30-day perioperative window. The 30-day period is a measure of quality that is utilized by ACS-NSQIP as, in general, most complications of surgery, including specialties outside of orthopaedic surgery, occur within the first 30 days of surgery. However, this 30-day postoperative period as a measure of quality does not fully capture events specific to orthopaedic surgery such as nonunion and implant failure. Further long-term comparative studies are needed to examine contemporary patients and report outcomes such as patient satisfaction, complications, reoperation rates, and conversion procedures between the 2 groups.
To the best of our knowledge, this study is the first to use the NSQIP database and focus on the perioperative short-term outcomes of TAR and AA over the past decade. Despite the limitations, we were able to discern a lower perioperative complication rate for TAR compared with AA. This overall higher rate of complications in the AA group may be attributed to a higher proportion of diabetes in this group. Additionally, the AA group had higher rate of IDDM and dialysis-dependent patients, which increases the ASA class rank of the patients. However, as AA procedures are typically done in the outpatient setting, AA procedures done as inpatients in the current study likely reflect a higher burden of comorbidities that may have skewed outcomes in favor of TAR. As such, it is a strong possibility that our results reflect that complications after inpatient AA is greater than inpatient TAR. Amongst these comorbidities, patients with end-stage renal disease (ESRD) have a higher rate of complications and ESRD is associated with high rates of neuropathy, peripheral vascular disease, and poor wound healing. 9 Careful patient selection, specifically in the setting of diabetes mellitus or a high ASA score is recommended as these are directly related to adverse outcomes. In conclusion, this information adds to the growing amount of literature regarding the gold standard treatment for ankle arthritis.
Footnotes
Declaration of Conflicting Interests
The author(s) declared no potential conflicts of interest with respect to the research, authorship, and/or publication of this article.
Funding
The author(s) received no financial support for the research, authorship, and/or publication of this article.
Ethical Approval
Not applicable, because this article does not contain any studies with human or animal subjects.
Informed Consent
Not applicable, because this article does not contain any studies with human or animal subjects.
Trial Registration
Not applicable, because this article does not contain any clinical trials.