
Abstract
Introduction
This study analyzes the incidence rate and median workdays missed due to foot and ankle injuries across age groups, sexes, and industries.
Methods
Workplace injury data from 2003 to 2019 were obtained using the Nonfatal Cases Involving Day Away from Work: Selected Characteristics database provided by the Bureau of Labor Statistics (BLS). The data were grouped by injury location (ie, foot, ankle), injury type (ie, fracture, sprain), and industry, and reported with injury incidence rates and median workdays missed.
Results
The incidence rate of foot and ankle injuries significantly decreased from 2003 to 2019 (P < .001). With increasing age, the incidence rate of foot and ankle injuries decreased (P < .001) and median workdays missed increased (P < .001). Men had significantly higher rates of foot and ankle injuries (P < .001). Agriculture, forestry, fishing, and hunting (foot=10.23%, ankle=10.41%); construction (foot=8.14%, ankle=8.68%); and transportation and warehousing (foot=11.06%, ankle=13.80%) industries had the highest injury incidence rates. Transportation and warehousing (foot=16.8 days, ankle=16.3 days), mining (foot=44.9 days, ankle=17.1 days), and utilities (foot=26.7 days, ankle=24.4 days) industries had the highest median workdays missed.
Conclusion
Increased incidence and severity of workplace foot and ankle injuries are associated with male sex and heavy labor industries. Age was positively associated with severity and negatively associated with incidence of workplace ankle injuries.
Levels of Evidence:
Level III, Retrospective cohort study
. . . the incidence of foot and ankle injuries at work has statistically significantly decreased over time, but the median days missed from work has not changed. It also identified important trends regarding differences in age, sex, and occupation.”
Introduction
Workplace foot and ankle injuries produce a sizeable impact on economic productivity.1-3 Injuries inhibiting the worker’s ability to mobilize in their job environment can result in days missed from work, especially if no suitable reassignment can be found. The Bureau of Labor Statistics (BLS) reports a decreasing trend in overall workplace injuries for the past 2 decades; however, there were still more than 2.7 million nonfatal workplace injuries resulting in lost workdays, 89 000 of which were foot and ankle injuries in 2020 alone. 1 In 2020, the median days missed from work for all body part injuries for all private industry occupations was 12 days. 1 In years past, the medical costs and indirect economic losses associated with workplace injuries have been estimated to average more than $20 000 per case, with an overall cost of nearly $60 billion annually in direct compensation.2,3 While actual total costs, both direct and indirect, can only be extrapolated and estimated, this creates a strain on societal resources. Similarly, a significant financial burden doubtlessly falls on employers and workers alike.
Different industries experience the effects of foot and ankle workplace injuries differently. For instance, jobs in sectors such as construction or agriculture place workers in contact with heavy machinery or in environments where falls or accidents occur more frequently. 4 In addition, these vocations often provide few options for return to work in a limited capacity, often forcing employees to miss more time from work when injuries do happen. The limiting nature of foot and ankle injuries following injury creates a unique labor effect pattern across different industries.
Recently, studies have sought to identify patient-specific factors and medical comorbidities that impact health outcomes following workplace injuries.5-7 However, collection, consolidation, and analysis of demographic and industry-specific data related to foot and ankle injuries have not been performed on a national level. The purpose of this study is to examine and report the rates of occurrence and duration of direct work-related impact of foot and ankle injuries across US industries using the BLS database. Differences in incidence rates and median days missed associated with demographics and economic sector were highlighted. We hypothesize that there will be an increase in the incidence rate of foot and ankle injuries over time, but that median days missed will remain the same. Second, we hypothesize that men, as compared with women, will sustain more workplace foot and ankle injuries, and have higher median days missed from work. Finally, we hypothesize there will be an increase in workplace foot and ankle injuries with increasing age.
Methods
Workplace injury data were obtained from the BLS Workplace Injuries and Illnesses website through the Nonfatal Cases Involving Day Away from Work: Selected Characteristics database. This database is created from the Survey of Occupational Injuries and Illnesses (SOII), which is a program that publishes national- and state-level data on nonfatal workplace injuries and illnesses. Cases included in the SOII include work-related injuries and illnesses in which workers required medical care that was more extensive than first aid. These cases are reported by companies in the private sector, as well as by state and local governments in the public sector. Subjects included in this study worked for establishments in the private industry in the United States, were age 16 years or older, and were considered employed if they worked for any duration between 2011 and 2019. Data were obtained and grouped by injury location (ie, all parts of body, ankle, and foot), injury type (ie, all injury types, fractures, and sprains/strains), and industry. Subgroup data were identified under each major qualifier for industry, sex, and age. The injury incidence rates (available from 2003 to 2019) and median workdays missed (available from 2011 to 2019) for each major group were reported. Incidence rates reported represent the number of injuries and illnesses per 10 000 full-time workers and were calculated as (N/EH) × 20 000 000, where N=number of injuries and illnesses, EH=total hours worked by all employees during the calendar year, and 20 000 000=base for 10 000 equivalent full-time workers (working 40 hours per week, 50 weeks per year).
Pearson’s correlation was used to analyze the change in injury incidence rate and median days missed from work. One-way analysis of variance (ANOVA) was used to identify the highest rates of incidence and most median days missed from work across different industries for age, sex, and field of work. Two-way ANOVA was used to determine the interaction effect between injury location and demographic factors on incidence rates and median workdays missed. The injury incidence rates and median days missed from work data provided by the database used in this study are aggregate data. Because individual data were not provided for the workers, the data were weighted based on the total number of workers present within each category. An alpha of .05 defined significance for all tests.
Results
Between 2003 and 2019, there was a strong, statistically significant decrease in the incidence rate for both foot and ankle injuries (r=−0.842, P < .001), with foot injuries decreasing from 6.4 to 4.6 injuries per 10 000 workers per year and ankle injuries from 7.8 to 4.7. This corresponds to a decrease in the total number of foot injuries from 56 370 to 47 160 (16.3%), and a decrease in total number of ankle injuries from 68 000 to 48 410 (28.8%). Similarly, there was a reduction in the total number of nonfatal workplace injuries from 4.4 million in 2003 to 2.7 million in 2020. 8
Whereas the incidence rate of ankle injuries was consistently higher over this period, the incidence rate of foot and ankle injuries remains relatively stable between 2012 and 2019 (Figure 1). No statistical difference was found regarding mean number of workdays missed for foot and ankle injuries over time (r=0.103, P = .685), which spanned 7 to 10 days and 8 to 11 days, respectively.
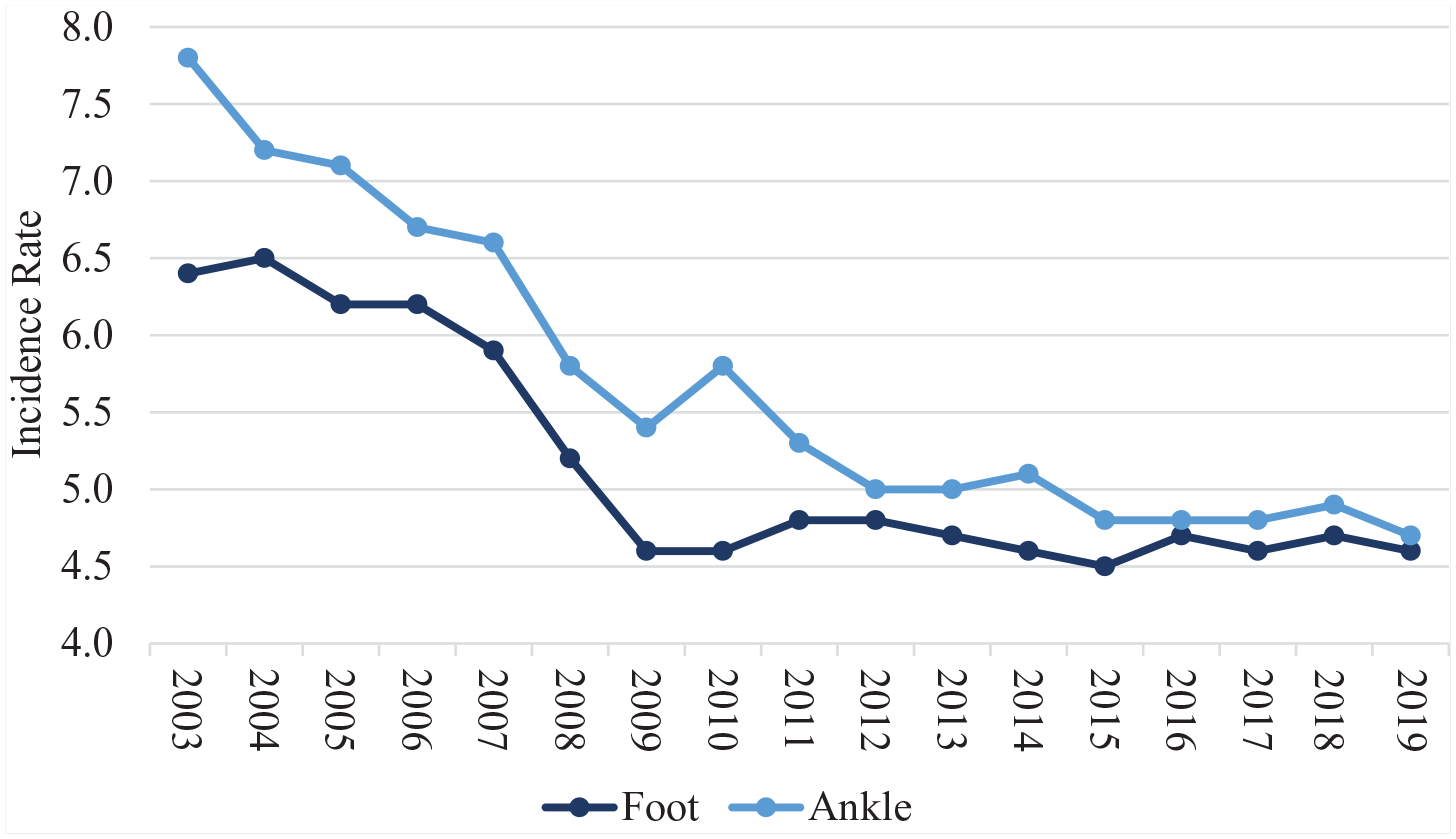
Incidence rates of foot and ankle injuries from 2003 to 2019. Between 2003 and 2019 there has been a strong, significant decrease in the incidence rate for both foot and ankle injuries (r=−0.842, P < .001). Incidence rate represents the number of injuries and illnesses per 10 000 full-time workers and was calculated as (N/EH) × 20 000 000, where N=number of injuries and illnesses and EH=total hours worked by all employees during the calendar year; 20 000 000=base for 10 000 equivalent full-time workers (working 40 hours per week, 50 weeks per year).
Examining incidence rates, it was found that men had a statistically significantly higher risk of sustaining foot (men=5.31, women=3.80) and ankle (men=4.96, women=4.88) injuries than women (P < .001) when measured as injuries per 10 000 workers per year (Figure 2). Furthermore, the effect of sex on incidence rate depends on the injured body part (P < .001), with the incidence of foot injuries being greater in men than ankle injuries. Not only do men have a higher incidence of these injuries, but data suggest that men also miss significantly more days of work for foot and ankle injuries than women (P < .001). The average median days missed for foot injuries was 10.78 days for men versus 6.44 days for women; for ankle injuries, men missed 11.11 days versus 7.67 days for women. There was also a trend of more days missed due to ankle injuries than foot injuries, with a mean of 9.39 days missed for ankle injuries and 8.61 days missed for foot injuries, but with the given sample size, statistical significance could not be established (P = .062; Figure 3).
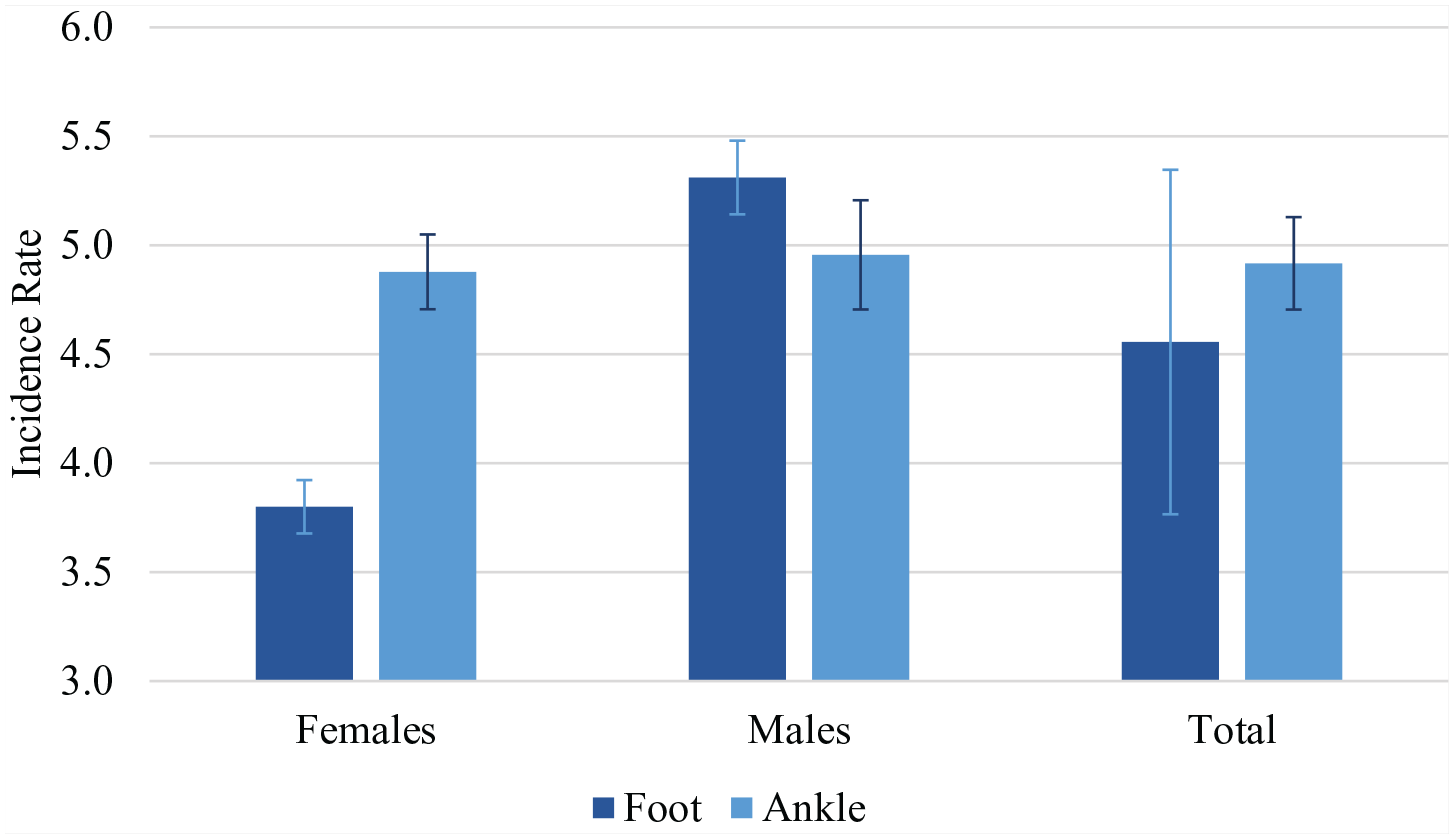
Sex differences in incidence rates of foot and ankle injuries. Men have a significantly higher risk of sustaining foot and ankle injuries than women (P < .001). Incidence rate represents the number of injuries and illnesses per 10 000 full-time workers and was calculated as (N/EH) × 20 000 000, where N=number of injuries and illnesses and EH=total hours worked by all employees during the calendar year; 20 000 000=base for 10 000 equivalent full-time workers (working 40 hours per week, 50 weeks per year).
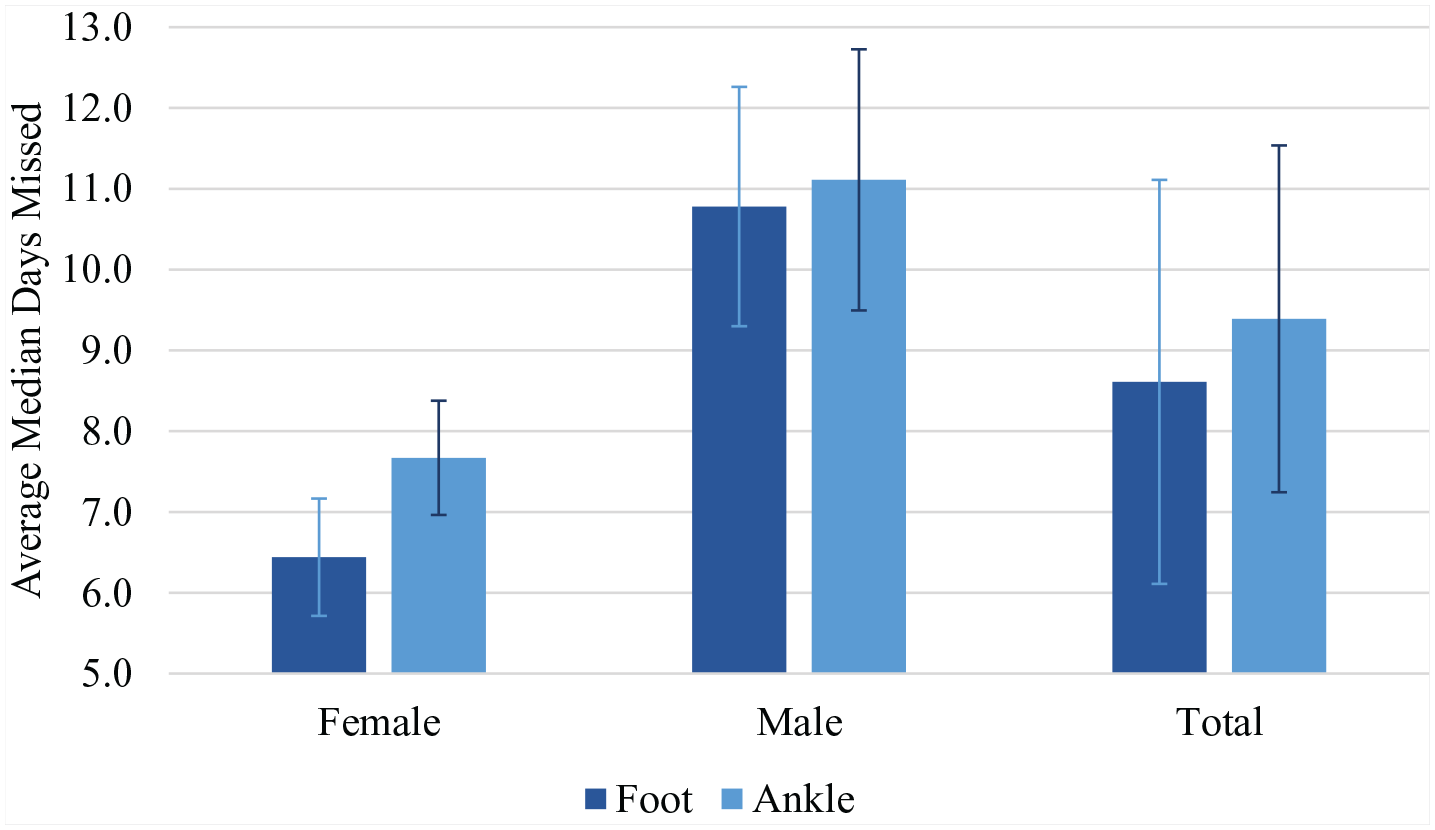
Sex differences in average median days missed from work for foot and ankle injuries. Men miss significantly more days from work for foot and ankle injuries than women (P < .001).
The incidence of foot and ankle injuries decreases with age (P < .001). For foot injuries, the incidence rate decreased from 8.82 at 16 to 19 years to 3.09 at 65+ years (R2=0.804). For those same age groups, ankle injuries decreased from 7.42 to 3.03 (R2=0.954). However, within the age groups ranging from 25 to 64 years, the incidence of both foot and ankle injuries remains relatively stable (Figure 4). Although the incidence rate of foot and ankle injuries decreases with age, the number of days missed from work for these injuries has a positive relationship with age (P < .001). Between the age ranges of 16 to 19 years and 65+ years, the average number of median workdays missed for foot injuries increased from 4.56 days to 21.56 days (R2=0.926), while ankle injuries increased from 5.11 days to 11.87 days (R2=0.941; Figure 5). These results for both incidence rate and days missed from work are similar to the trends seen in all injured body parts. Between the age ranges of 16 to 19 years and 65+ years, the incidence rate decreased from 107.60 to 86.60 (P < .001), whereas the average number of median workdays missed for all injured body parts increased from 4.00 days to 15.44 days (P < .001).
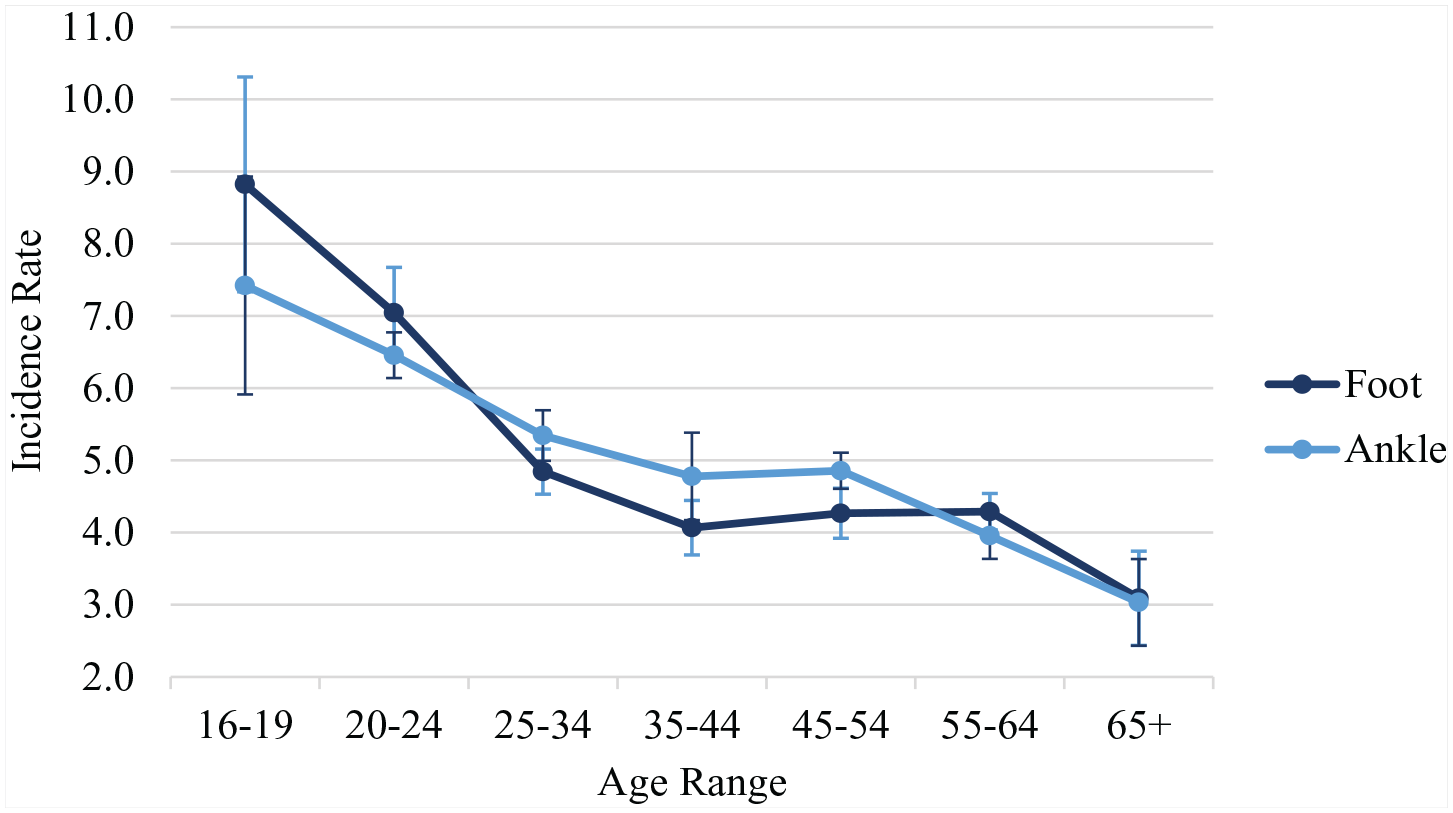
Age differences in incidence rates of foot and ankle injuries. The incidence of foot and ankle injuries decreases with age (P < .001). Incidence rate represents the number of injuries and illnesses per 10 000 full-time workers and was calculated as (N/EH) × 20 000 000, where N=number of injuries and illnesses and EH=total hours worked by all employees during the calendar year; 20 000 000=base for 10 000 equivalent full-time workers (working 40 hours per week, 50 weeks per year).
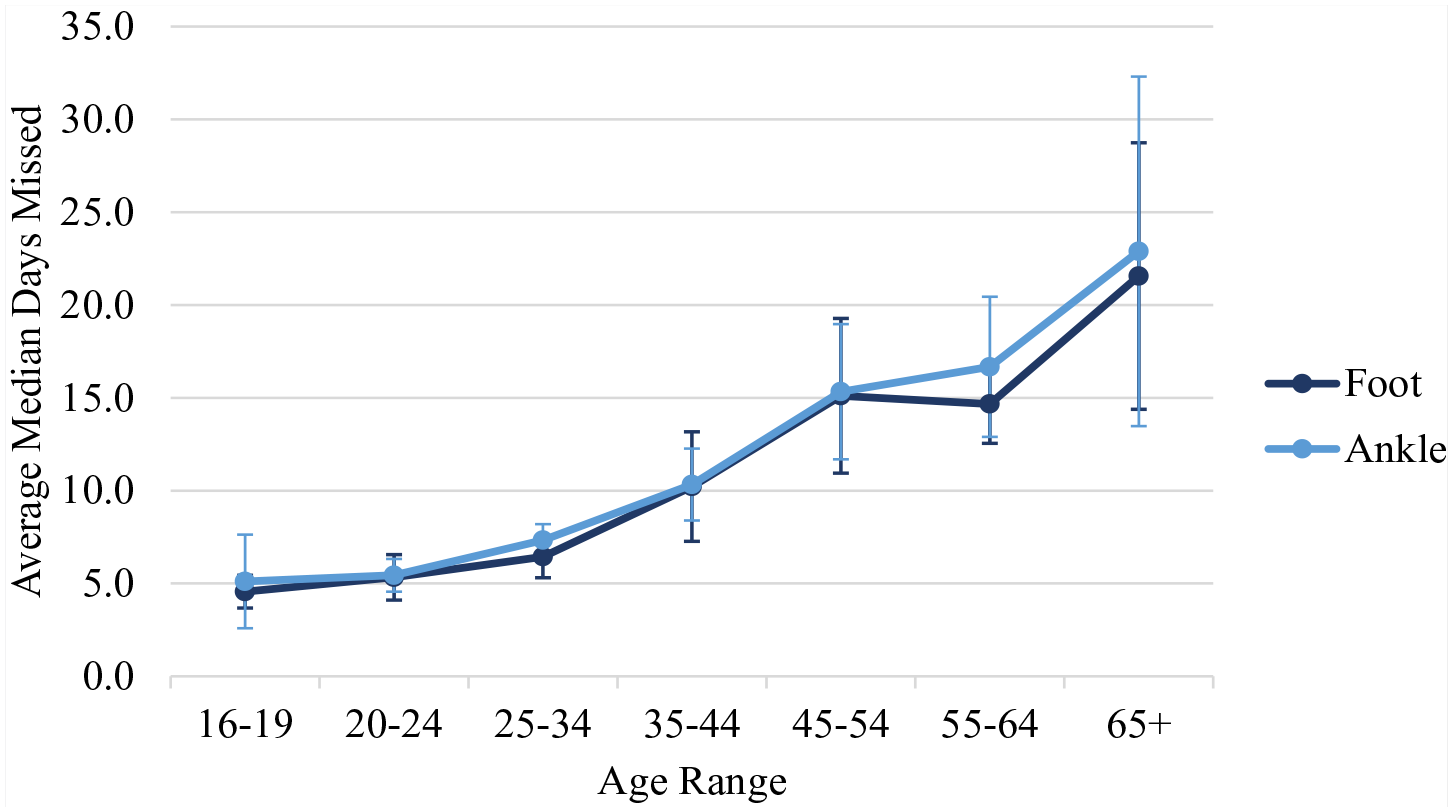
Age differences in average median days missed from work for foot and ankle injuries. The number of days missed from work for these injuries has a positive relationship with age (P < .001).
As compared with more sedentary industries (eg, accommodation and food services, education and health services, and leisure and hospitality), heavy labor occupations in agriculture, forestry, fishing, and hunting (foot=10.23, ankle=10.41); construction (foot=8.14, ankle=8.68); and transportation and warehousing (foot=11.06, ankle=13.80) have higher incidence rates of foot and ankle injuries (Table 1). Of those industries, only the transportation and warehousing industry (foot=16.8 days, ankle=16.3 days), along with other heavy labor occupations in mining (foot=44.9 days, ankle=17.1 days) and utilities (foot=26.7 days, ankle=24.4 days), is among the top 5 industries with the highest reported median workdays missed (Table 2).
Industry Differences in Incidence Rates of Foot and Ankle Injuries.
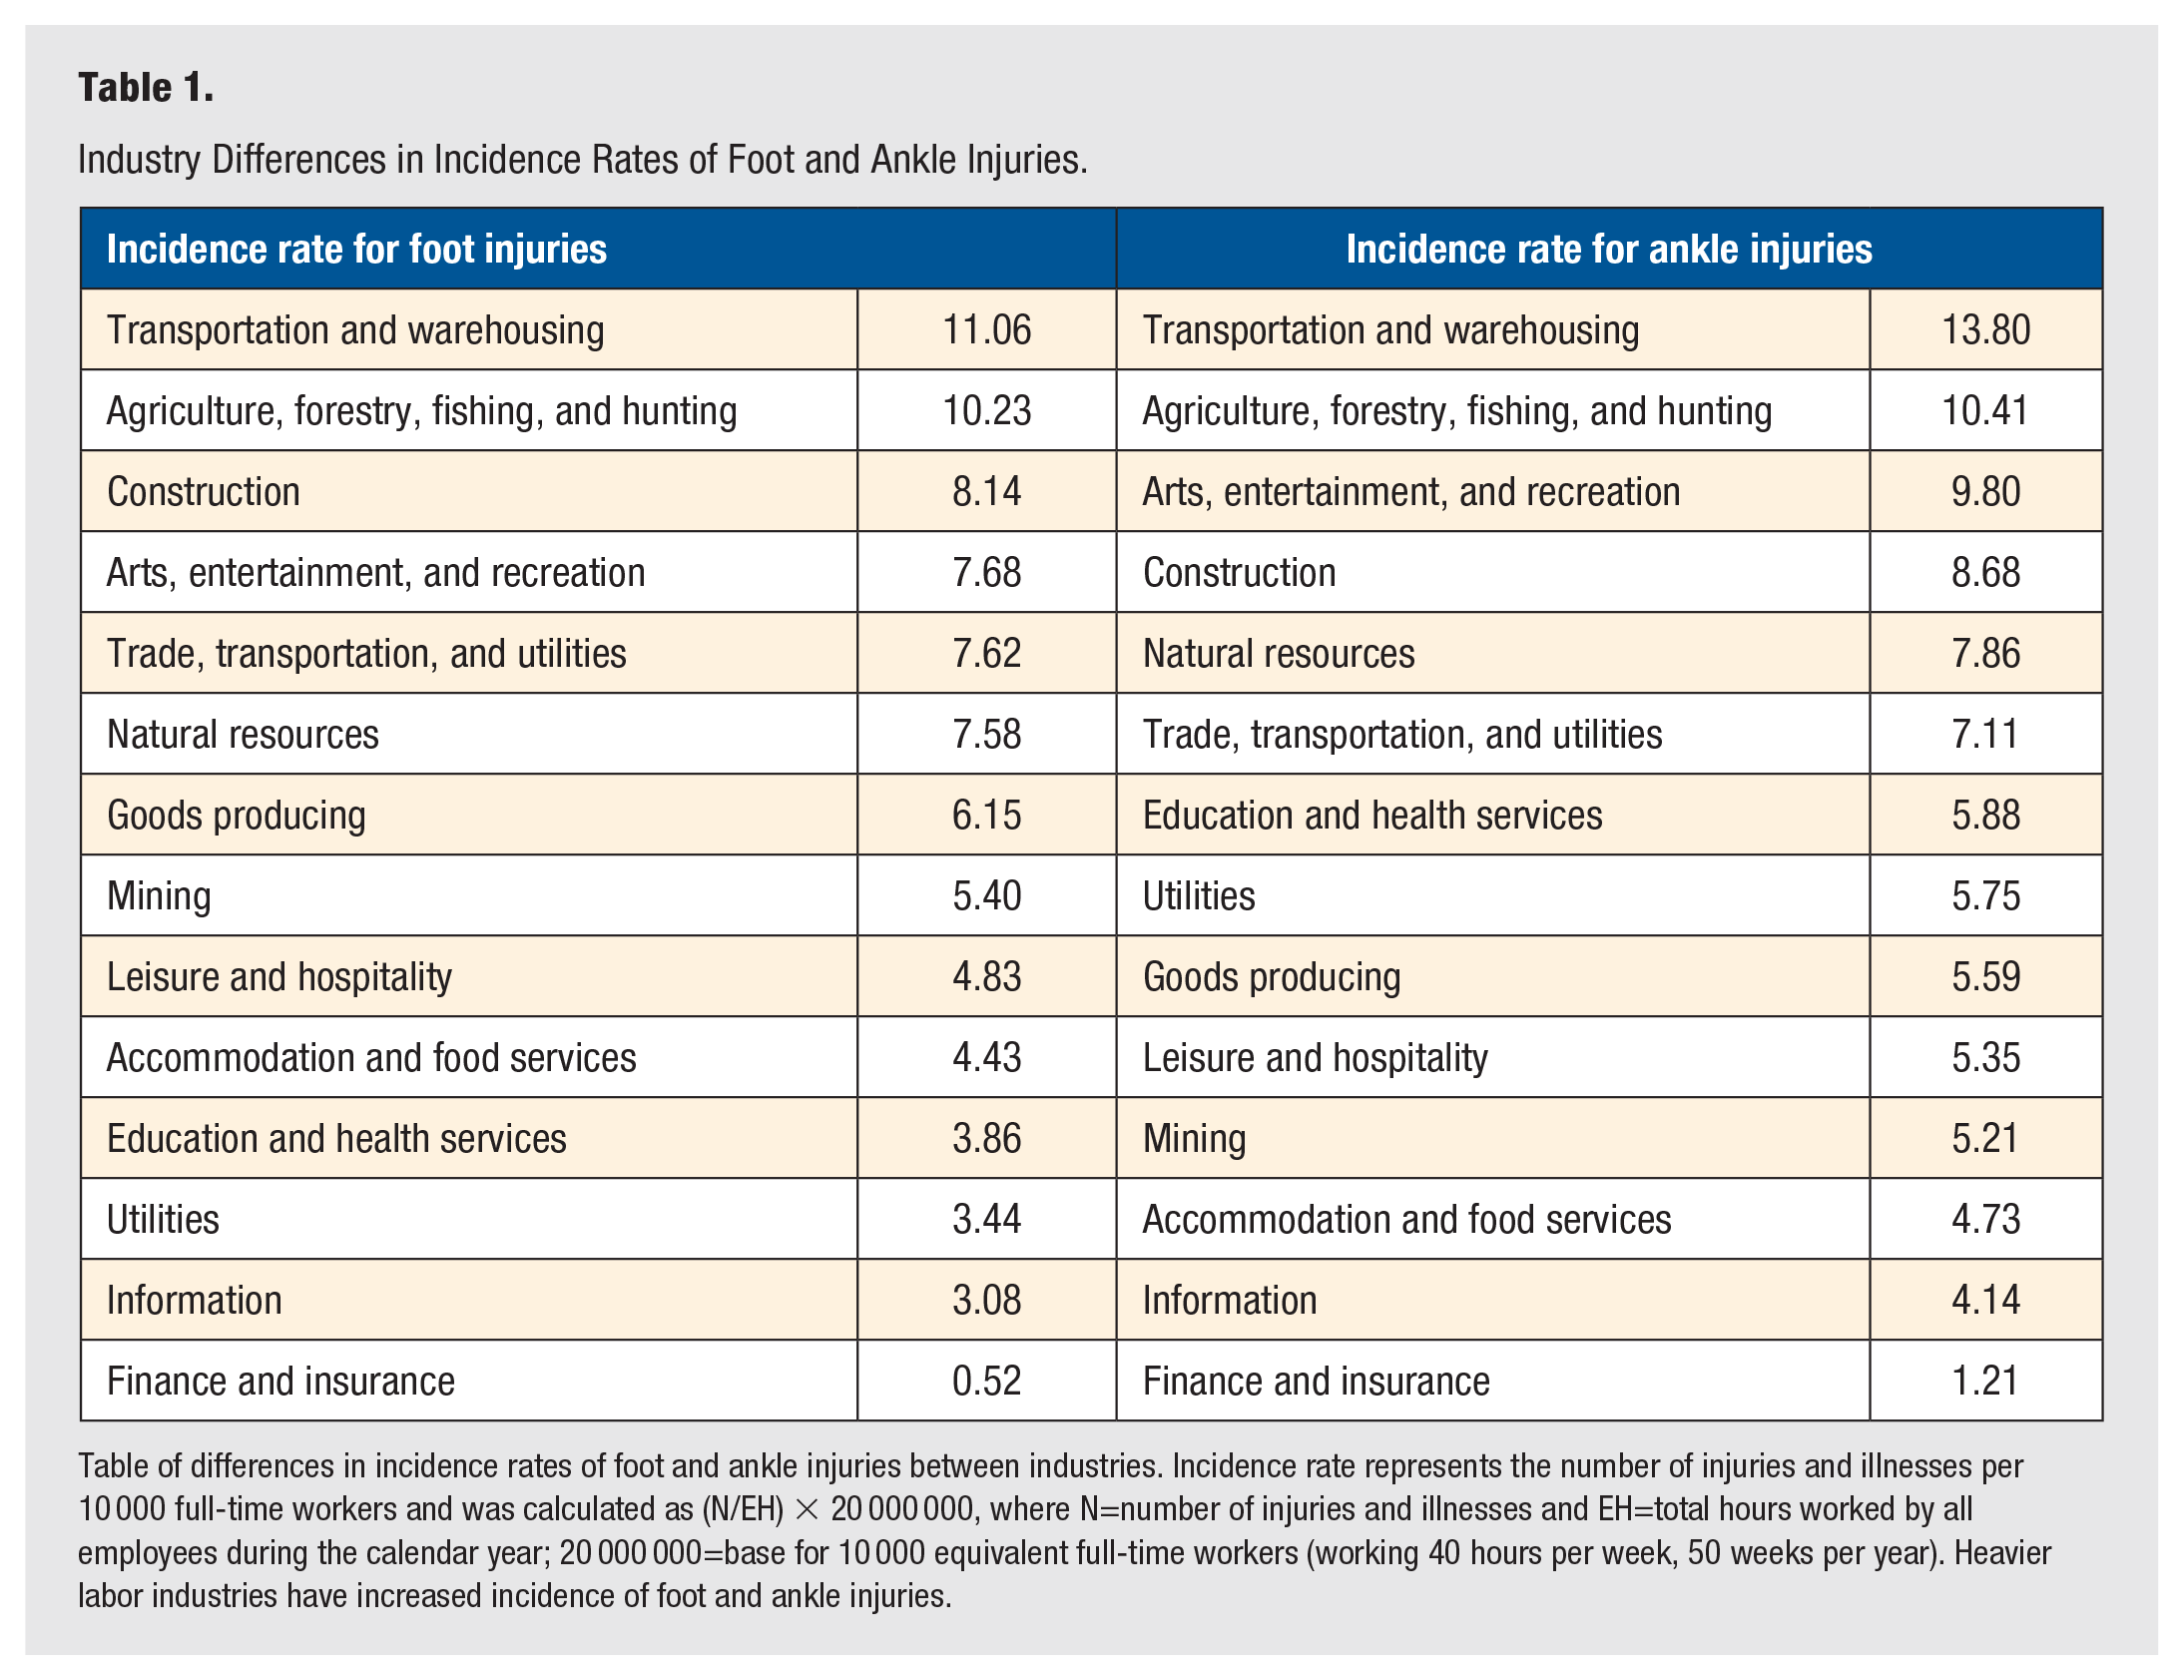
Table of differences in incidence rates of foot and ankle injuries between industries. Incidence rate represents the number of injuries and illnesses per 10 000 full-time workers and was calculated as (N/EH) × 20 000 000, where N=number of injuries and illnesses and EH=total hours worked by all employees during the calendar year; 20 000 000=base for 10 000 equivalent full-time workers (working 40 hours per week, 50 weeks per year). Heavier labor industries have increased incidence of foot and ankle injuries.
Industry Differences in Average Median Days Missed From Work for Foot and Ankle Injuries.
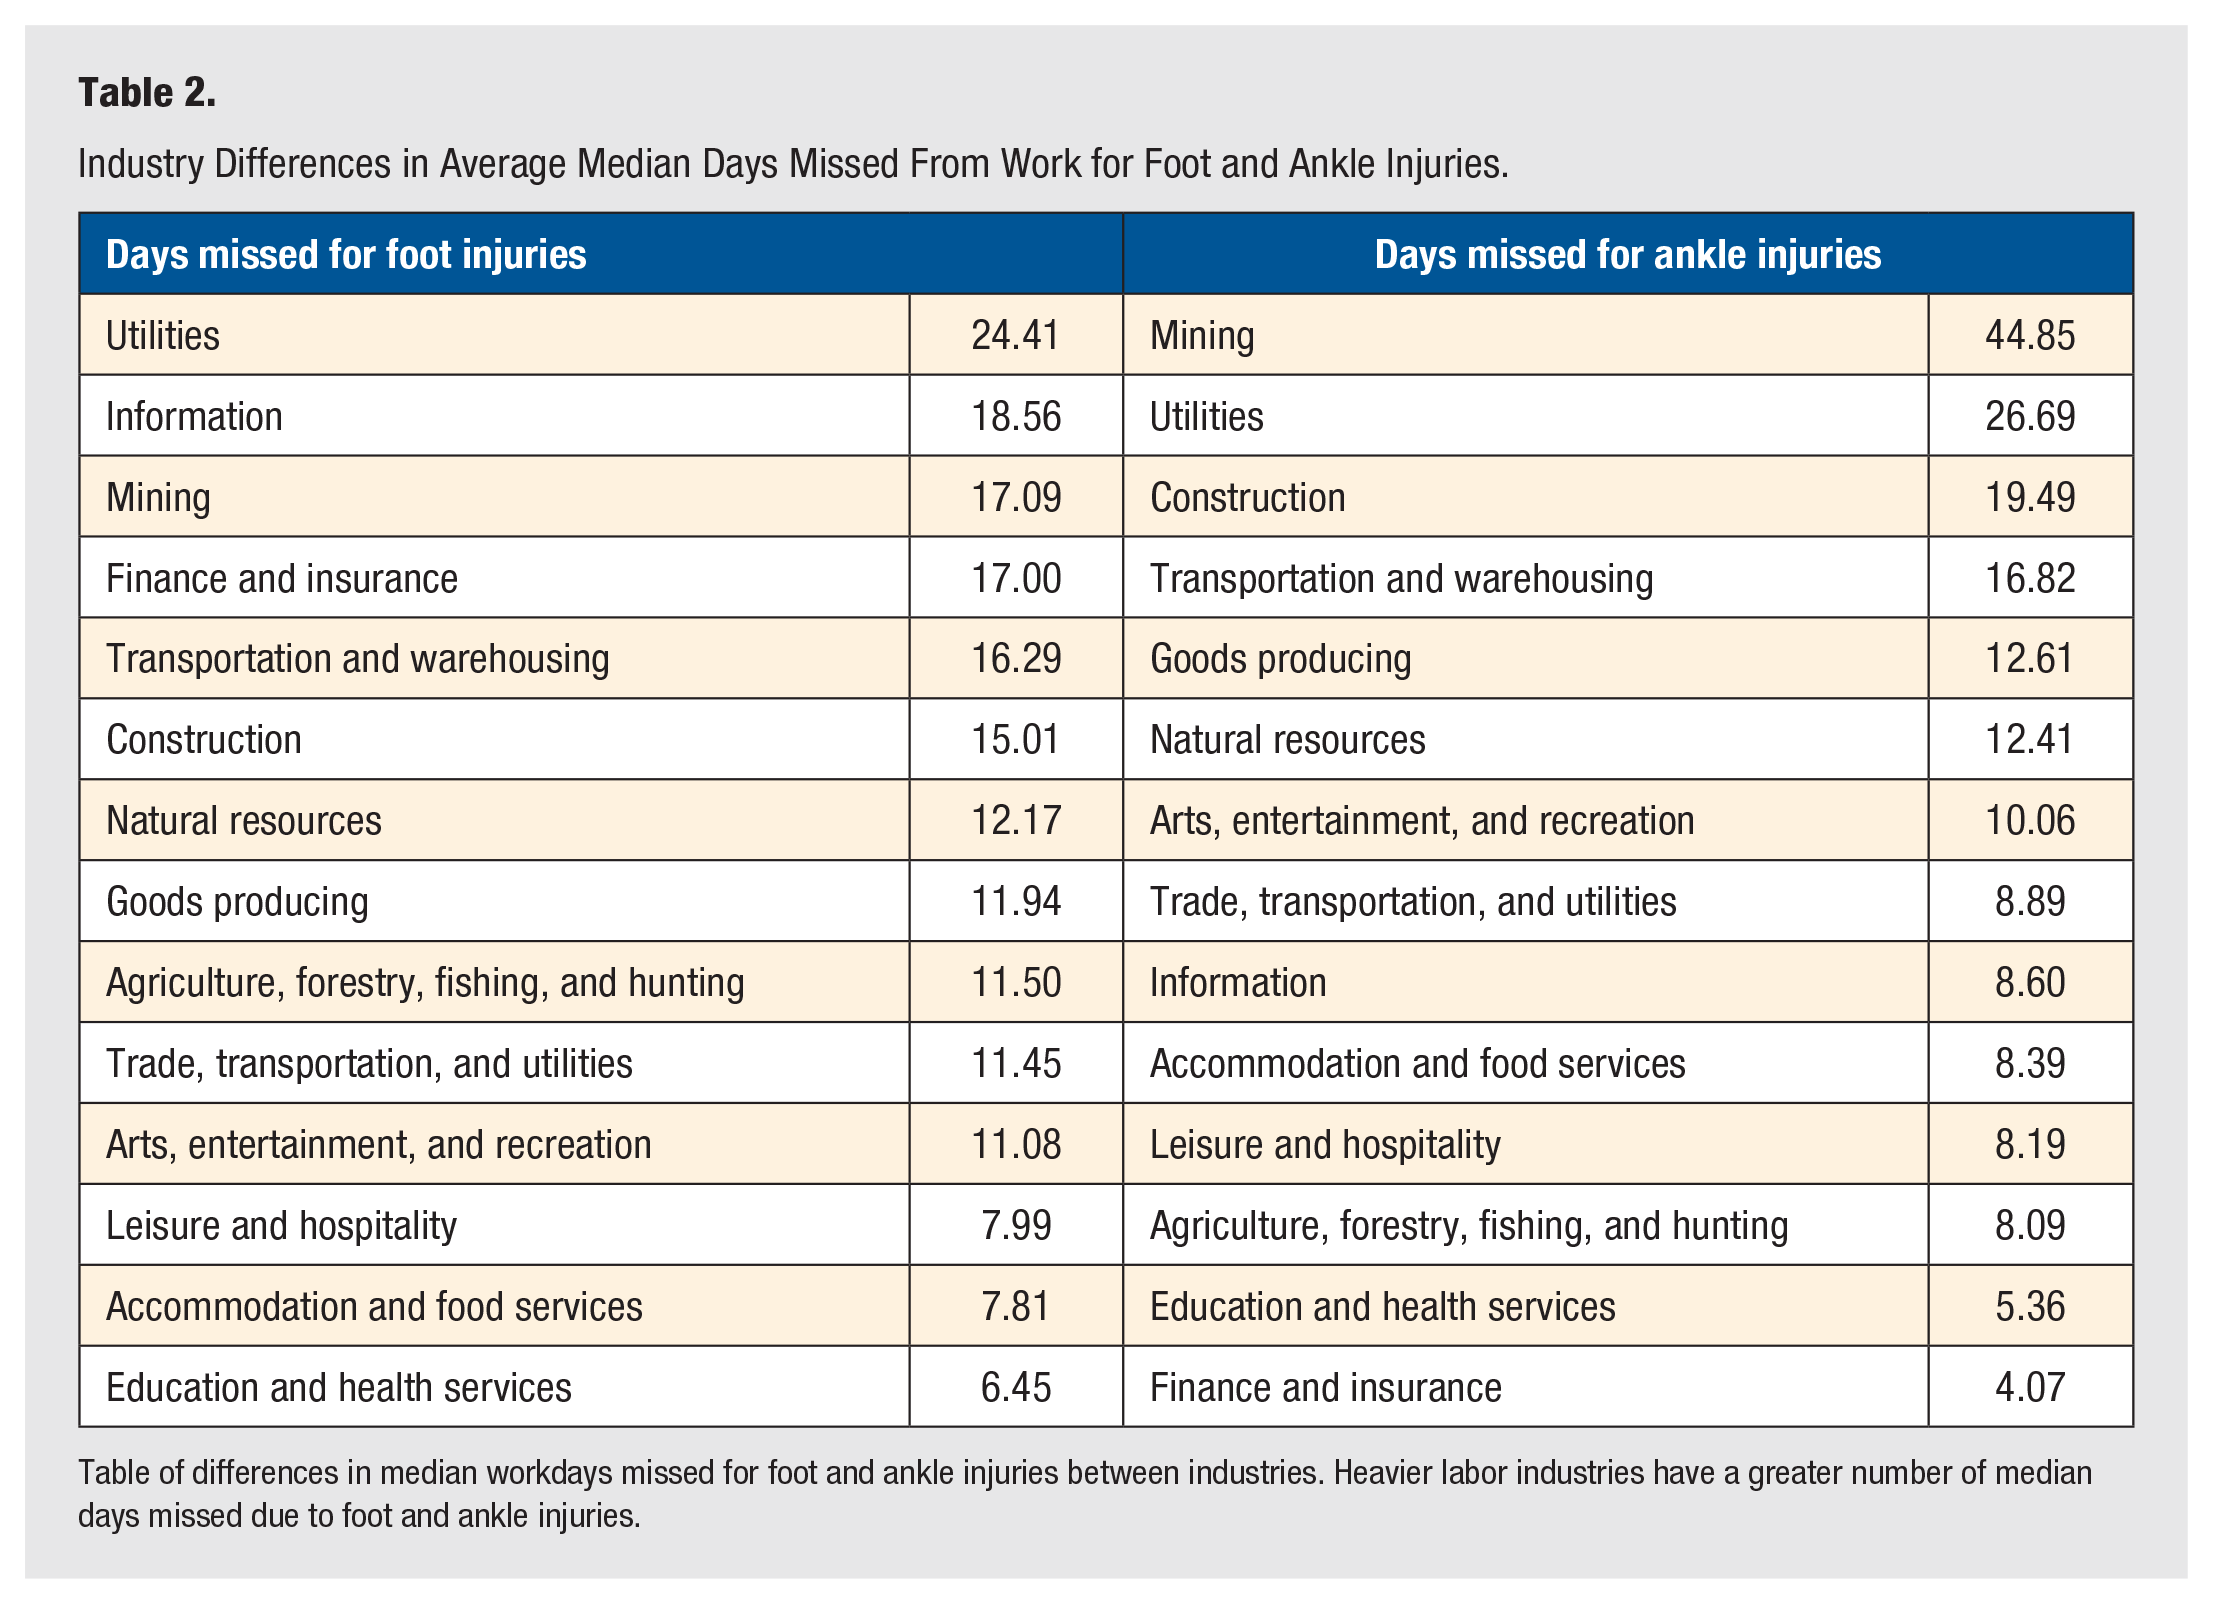
Table of differences in median workdays missed for foot and ankle injuries between industries. Heavier labor industries have a greater number of median days missed due to foot and ankle injuries.
Discussion
A part of our hypothesis was disproved as we found that, between 2003 and 2019, the incidence rates of foot and ankle injuries significantly decreased. However, as hypothesized, days missed from work remained largely stable between 2011 and 2019. These findings reflect the overall trend in workplace injuries, with a reduction in total number of nonfatal workplace injuries from 4.4 million in 2003 to 2.7 million in 2020. 8 This trend has been attributed to the Occupational Safety and Health Administration (OSHA) and their regulations regarding workplace safety measures. 8 The OSHA performs inspections and gives citations and penalties to disincentivize business from allowing unsafe workplace conditions. 9 In addition, as of 2017, they have implemented new rules requiring that companies submit detailed annual reports of workplace injuries and illnesses, and anti-retaliation provisions. 10 Taken together, these data suggest that workers experience less overall foot and ankle injuries, but that the severity of the injuries, at least as measured by missed days from work, has not changed.
Regarding sex, our study found that, on average, men consistently experienced 1% to 2% more injuries and missed 3 to 4 more days of work per injury than women, which is an exaggeration of the general trend seen with all other body part injuries presented in BLS data. 1 Prior studies investigating trends in workplace injuries related to sex have been mixed. Several studies have found higher risk for injury in women compared with men in heavy labor industries, such as smelting and fabrication, and heavy manufacturing environments.11-13 In contrast, Islam et al 14 investigated injury and illness rates among West Virginia Workers Compensation claims in each specific industry class and found that women had more than a 2-fold decreased overall risk of injuries and illnesses. This trend was noted in all industries except service and agricultural sectors. Our study’s results may differ because we did not categorize BLS sex statistics by industry-specific injuries. Certain sectors might have higher injury rates for women, not evident in the overall data. Further works investigating specific industry-related sex differences in injury rates would be beneficial, given the increasing number of women in the workforce. 15 Currently, most exposure limits and workstation designs are geared toward the average male physical capacity, suggesting that women may be at a greater risk of sustaining certain injuries depending on their industry. 14 Men and women face different elements of occupational safety and health hazards and further data regarding sex-specific details will help in understanding health and safety gaps between male and female workers.
Our data suggest that the incidence rate of foot and ankle injuries decreased with increasing age, which is consistent with other studies investigating the correlation between age and workplace injuries.16-18 This observation has been attributed to less experience and training, accompanied by an increased level of impulsiveness and carelessness, among younger workers. 19 This finding stresses the importance of sufficient training and interventions geared toward younger workers to maintain safe working conditions. Conversely, some of these studies found that the above trend changes after age 65 years, at which point these workers experience higher rates of injury.16,18,20 Studies attribute the increase in injuries after age 65 years to changes in physical health such as decreased aerobic capacity, 21 muscle strength, 22 and bone density. 23 A possible explanation for the difference in injury rates for workers above age 65 years in foot and ankle injuries, when compared with other injuries, is that injuries in older workers are usually the result of trips, falls, and slips versus contact injuries in younger workers. 16 Falls, slips, and trips may result in injury more often to other body parts, such as hips, knees, and upper extremities, than to feet and ankles.
Unlike the relationship between age and injury rates, median days missed per foot and ankle injury increased with age, with oldest workers missing approximately 4.5 times more workdays than the youngest workers for both foot and ankle injuries. Recent data reviewed by Coate also noted that older workers missed more days from work than younger workers, and attributed this to longer recovery times. 16 Schwatka et al 18 found that the severity of injury in older workers was greater than in younger workers, which is consistent with another study that found that older workers experience a higher number of fatal injuries than younger workers. 17 Although our findings are consistent with these prior studies, the disparity in days missed was slightly higher than expected, based on the average of all other bodily injuries, in which the oldest workers missed 3.8 times as many workdays as the youngest workers. 1 This would indicate that, although foot and ankle injuries are less frequent in older workers, this age group may experience more severe injuries with longer recovery times.
Incidence rates for foot and ankle injuries were highest among the agriculture, forestry, fishing, and hunting; construction; and transportation and warehousing occupations. These were largely expected findings, considering that the nature of these workplace environments involve close interaction with heavy machinery and more physical/manual labor, which increases the risk of acute trauma. Similarly, the occupations with the highest median days missed due to foot and ankle injuries were found in sectors requiring mobilization on uneven surfaces and scaling ladders, such as mining, transportation and warehousing, and utility work. These results are important to consider for both employers and workers in these industries, and physicians treating patients with work injuries at these types of locations.
This is the first article to our knowledge to investigate the incidence rates of foot and ankle injuries among different industries and investigate trends among worker demographics. This article identifies which workers are at greatest risk of sustaining foot and ankle injuries, which can help employers target interventions to reduce injury rates in the workplace. It is important for employers and policymakers to monitor work and health conditions and incorporate safety measures to ensure that task requirements do not exceed their employees’ capacities. In addition, this article highlights the significant impact foot and ankle injuries can have on days missed from work and wages lost, stressing the importance of minimizing these injuries. These data can also assist in estimating how long an employer can expect a worker to be out of work based on age, sex, and industry.
Limitations
We acknowledge the limitations of this study, which include the use of reported and calculated data provided by the BLS, which are collected by the SOII. The SOII is a survey that is sent out to employers requesting data from their OSHA logs regarding workplace injuries and illnesses annually. 24 These data are limited like any large data set by the accuracy and validity of the data reported and entered into the data set, which does limit the analysis that can be performed. In addition, data provided by the SOII does not indicate the treatment payer for injuries examined in this study. Moreover, the data provided by the BLS does not provide specificity around type or location of injury beyond the generalized “foot” or “ankle” location. Data collected regarding sex was not broken down by industry and, thus, may not reflect trends within specific industries. In addition, there is significant industry crossover within the large categories defined by the BLS, making strict differentiation and definition of occupation difficult.
Conclusion
This study identified a few key trends, most importantly that the incidence of foot and ankle injuries at work has statistically significantly decreased over time, but the median days missed from work has not changed. It also identified important trends regarding differences in age, sex, and occupation. These data are very important to both different industries/employers to understand the effect of workplace regulation, which appears to decrease the incidence of injuries, as well as physicians treating patients with work-related injuries. These data will be very valuable to help counsel patients and employers about how much time a patient may be expected to miss from work in various fields. Looking ahead, this study can better identify industries that require additional safeguards and form a basis for further studies in the future.
Footnotes
Declaration of Conflicting Interests
The author(s) declared the following potential conflicts of interest with respect to the research, authorship, and/or publication of this article: DJS receives research support from Arthrex and Paragon 28. CEG receives research support from Wright Medical Technology and is a paid consultant for Medshape, Novastep, and Paragon 28.
Funding
The author(s) received no financial support for the research, authorship, and/or publication of this article.
Ethical Approval
Not applicable.
Informed Consent
Not applicable.
Trial Registration
Not applicable.