
Abstract
This study addressed the relationship between the innovativeness of hotels and their profitability. The authors propose that innovativeness and the visibility of the benefits to customers from innovative activities both serve as endogenous variables. Competitive market advantage, sales growth, and capacity utilization serve as mediators. Both key informants and financial statements provided data for a sample of 298 hotels. The results show that the relationship between innovativeness and profitability is positive and fully mediated.
Keywords
For many decades, innovativeness has been viewed as vital for the growth of economies and the performance of individual businesses. Despite this broadly accepted logic and the many practices intended to encourage innovativeness (e.g., copyrights and patents, new product and process development), the literature reports that relationships between innovativeness and profits are often weak and occasionally nonexistent (Rubera and Kirca 2012). Indeed, a meta-analysis of more than ninety such studies by Szymanski, Kroff, and Troy (2007, 48) concluded that there was not enough evidence to claim that innovativeness is a driver of success “on a per se basis.” Such results imply that innovativeness may not matter as much as has often been presumed.
However, the hospitality industry views innovativeness as important. Investors bring entirely new hotels into the market regularly, and many existing hotels compete by introducing new service concepts. For instance, Hossain, Kumar, and Kumar (2010) recently chronicled the success of a number of innovations employed by existing U.S. and Canadian hotels, including new restaurant concepts, spas, and wireless connectivity. Clearly, behavior in the hospitality industry reflects a belief that success is related to innovativeness in service offerings. However, research studies of the hospitality industry also report that the relationship between innovativeness and profits is weak. For instance, the hospitality studies summarized in Exhibit 1 report values for relationships that range from non-significant (no relationship) to a .42 correlation (Tajeddini and Trueman 2012) with most of the significant correlations falling in the range between .17 (Tajeddini 2010) and .23 (Zhou, Brown, and Dev 2009). Unfortunately, it is quite possible that the evidence regarding the innovativeness–profitability relationship is actually weaker than what is reported because many studies that do not find significant results are never reported in the literature (the classic “file drawer problem”).
Innovativeness–Performance Research Related to Hospitality Businesses.
Note. SEM = structural equation modeling.
We believe that theoretical and methodological reasons may contribute to the weak results, and we have addressed some of those issues in this study. Our objective in this research is to sharpen understanding of influences on the innovativeness–profitability relationship. The discussion below first addresses some theoretical issues that may be influential, and then proceeds to definitional and methodological issues.
Background and Conceptual Framework
Theoretical Issues
A possible explanation for the weak innovativeness–profitability relationship is rooted in the theories that were employed for research. Many theories posit only direct relationships. However, it is possible that the influence of innovativeness is mediated through other aspects of a business (Hult, Hurley, and Knight 2004; Szymanski, Kroff, and Troy 2007). That is, innovations may be strictly sources of costs for businesses until reactions occur from other factors that yield benefits such as volume increases and cost reductions (Theoharakis and Hooley 2008). Accordingly, we sought a mediated conceptual framework as a basis for developing our model. The “service profit chain” framework (Heskett et al. 1994) and the “resource-advantage” (RA) theory (Hunt and Morgan 2005) are examples of such frameworks. For instance, the RA theory posits that businesses’ markets mediate the relationships between the resources that businesses employ and their performance (Hunt and Duhan 2002). However, given that mediated models can be ineffective if the choice of mediators is not appropriate, we propose that customer market response will prove to be an effective mediator. As an example, for small hotels, the creation and management of a new website can be a relatively expensive undertaking, but the response of customer markets can make such an expense a good investment in the long run. Another potential explanation for the weak relationships is that some catalyst or moderator may be missing from models that were employed. There is an old saying (sometimes attributed to Ralph Waldo Emerson) that if you build a better mousetrap, the world will beat a path to your door. But unless the world knows about your mousetrap, it does not matter how much better it is. So we propose that visibility of the customer benefits from innovativeness will be an effective moderator in this model, which is summarized in Exhibit 2.

Conceptual model of direct effects.
The unit of analysis for this research is the hotel (rather than an individual innovation or an entire hotel chain). Hotel innovativeness and the visibility of the customer benefits from innovative efforts are endogenous variables, which influence market advantage both directly and interactively (a moderated effect). Market advantage influences profitability both directly and indirectly through two internal mediators: sales growth and capacity utilization. The next section of this article presents a discussion of the definitions for each of these constructs and the logic of their relationships, in the form of research propositions.
Definitional Issues
There is great diversity among the definitions of constructs employed for the innovativeness–profitability relationship. This diversity contains three common areas of interpretational ambiguity that may contribute to the weak results (Garcia and Calantone 2002). The first is inconsistent units of analysis, which occurs when the units of analysis for constructs are inconsistent within a particular study (intra-model comparisons). For instance, if a study relates the innovativeness of an individual service to the overall profitability of a multifaceted firm, there can be difficulties in separating the influence of one particular innovative service from many other influences on profits (Calantone, Chan, and Cui 2006; Garcia and Calantone 2002). This is also true with intra-model comparisons of influences such as human resource factors (e.g., Chang, Gong, and Shum 2011), chain membership (e.g., Orfila-Sintes, Crespi-Cladera, and Martínez-Ros 2005; Vila, Enz, and Costa 2012), corporate versus independent hotels (Ottenbacher, Shaw, and Lockwood 2006), and internal or external to a firm (e.g., López-Fernández, Serrano-Bedia, and Gómez-López 2011). If the research objective is to assess the influence of innovative behavior on hotel-level profitability, then it is appropriate to define innovative behavior (innovativeness) at the hotel level. For instance, concepts such as innovative hotel “team culture” (Hu, Horng, and Sun 2009) or “service culture” (Chen 2011) are consistent with hotel-level innovativeness.
The second area of ambiguity is incremental significance. Constructs may be defined in ways that produce increments of the construct’s dimension that are too small to have much impact on other variables in the model. So something may be classified as “innovative” when the difference between “innovative” and “not innovative” falls below the market’s threshold of just-noticeable-differences, resulting in little or no impact on other variables in the model (Thölke, Hultink, and Robben 2001). Thus, an innovation might be new in an absolute sense but not noticeably new to customers (such threshold effects also occur in other aspects of market behavior such as advertising and pricing responses).
The third area of ambiguity is the context of comparison. Measures of a defined construct are comparisons to something within a particular context. For instance, innovativeness is sometimes defined as the degree of “newness” to a firm (Chang, Gong, and Shum 2011; Ordanini and Parasuraman 2011; Sandvik and Sandvik 2003), to an industry, to specific customers, or to a particular market (e.g., Booz and Hamilton 1968; Cooper and Edgett 1996; Danneels and Kleinschmidt 2001; Kleinschmidt and Cooper 1991; Olson, Orville, and Ruekert 1995). Likewise, profits or sales are sometimes defined as a comparison to profit or sales goals (Tajeddini 2010), to assets, to investments, or to capacity (e.g., return on assets [ROA], return on investment [ROI], occupancy rates; Agarwal, Erramilli, and Dev 2003; Orfila-Sintes and Mattsson 2009; Tajeddini 2010) rather than in absolute amounts. Unfortunately, differences in such contextual comparisons mean that any particular thing or activity may or may not be “innovative” or “profitable” depending on the basis of comparison.
This wide variety of definitions reflects a richness that is natural in the diverse arena of the hospitality industry. However, it does make developing a common body of knowledge about the hospitality innovativeness–profitability relationship more challenging. Thus, it is important that we explicitly define the constructs to clearly (1) assess the content validity of our measures, (2) communicate the results of our research, and (3) allow others to assess the comparability of the study results to other studies.
Defining Innovativeness
Innovativeness often holds a special place in our hearts because it is easily associated with dramatic inventions and wonderful entrepreneurial success stories. However, in a review of innovativeness literature, Garcia and Calantone (2002, 112) point out that differences and ambiguities among definitions reduce the generalizability of reports in this field, which “creates distinctive, unique studies that never achieve the status of ‘research.’” Given the ambiguity about exactly what qualifies as “innovative,” how does one decide which approach is best?
An interesting study by Geroski and Machin (1992, 80) provides some valuable insight into this question. Their study of 539 U.K. manufacturing firms found that innovations were positively related to profits and sales, but the positive effects were “transitory, lasting only as long as the innovating firm is able to maintain a proprietary control” of the innovations. In other words, if and when the innovativeness of specific goods or services provides an advantage, it is only temporary. Therefore, it is the innovativeness of the business that really matters in the long run. This insight is particularly important in the hospitality and other service industries where innovations may be easily copied (Cooper and de Brentani 1991; de Brentani 2001; Song, Di Benedetto, and Zhao 1999; Sundbo 1997; Verma et al. 2008). Since hotels primarily offer services, they are more dependent on continuous innovation to maintain the superiority of their market offerings (Nijssen et al. 2006, 1). Indeed, in a study of hospitality industry best practices, Dube et al. (2000, 1) comment that “Perhaps the real challenge of innovation is to continue innovating.” Also, as Verma et al. (2008, 12) suggest, “Innovation often stems from efforts for continuous improvement.” Focusing on the business as the unit of analysis and also on innovativeness as a characteristic of a business largely reduces the problems related to (1) comparing individual services in specific markets, (2) making only incremental innovations (not noticeable differences), and (3) focusing on comparable units of analysis (e.g., firm innovativeness and firm performance). We chose this approach by defining innovativeness as the extent of a business’s creative behavior applied to the development of customer services, including comparisons to its competitors.
Defining Visibility of Customer Benefits
A challenge to the success of the innovativeness of services is the transformation of innovative benefits to something that customers recognize (Gounaris and Koritos 2012). Literature on services emphasizes the use of visible cues to help overcome the abstractness of most services (Berry 1980) and help affect consumer attitude and behavior (Baker, Grewal, and Parasuraman 1994; Bitner 1992; Zeithaml 1988). Indeed, one of the biggest challenges for the hotel industry today is “tangiblizing the intangible hotel experience,” thus making it more visible (Berry 1986; Kayaman and Arasli 2007; Levitt 1981). For instance, the use of computerized presentations of hotel rooms (including 360-degree views online) makes the information about hotel standards and new features more visible to potential and actual customers.
Since services are experience products, potential customers who perceive risk in an innovative service may rely on the visibility of benefits to help them judge that risk (Gounaris and Koritos 2012). Perceived risk is important in the hotel industry because often innovative activities occur “backstage,” where they are not visible to customers (Xie, Bagozzi, and Troye 2008). The lack of visibility for some hotel innovations may be another reason for the weak and inconsistent innovativeness–profitability relationships reported in the literature. In addition, some highly visible aspects of hotels (e.g., property location and size) may not reflect the innovativeness of the hotel’s services.
As one might expect, the concept of visibility (observability) has long been an integral part of theories related to innovativeness. As a result, there are well-understood definitions available from the literature. For instance, Rogers (2003, 258) defines observability as “the degree to which the results of an innovation are visible to others.” Plouffe, Vandenbosch, and Hulland (2001, 68) define visibility as “the degree to which the unique features and benefits of an innovation are readily discerned by the potential adopter.” Thus, the degree of visibility (noticeability of differences) is an important characteristic of this concept. The visibility of hotel innovativeness efforts may be greater when the efforts are applied to services such as the accessibility of outlets or Wi-Fi for mobile devices. They may be less visible to customers when they are applied to improvements in energy management systems within a hotel or modifications in human resource management practices. Accordingly, we draw on these definitions and perspectives to define the visibility of customer benefits as the extent to which customers can discern the usefulness of innovation benefits.
Defining Market Advantage
A service encounter is “a package of service benefits” (Krakhmal 2012, 198). Both psychologists (e.g., Fishbein 1967) and economists (e.g., Lancaster 1966) have also indicated that customers perceive products and services as having several attributes and that they react to them as bundles or packages of benefits. The value of a particular package is a result of service attributes that are beneficial to the customer (Meyers-Levy and Malaviya 1999). We can define the market advantage offered by a particular package in terms of many characteristics. These include quality (Zeithaml 2000), perceived value (Zeithaml 1988), customer satisfaction (Anderson, Fornell, and Lehmann 1994), product superiority (Cooper and Kleinschmidt 1987; Langerak, Hultink, and Robben 2004), and product (or service) innovativeness (Li and Calantone 1998). Johnson, Nader, and Fornell (1996) indicate that these definitions are theoretically and empirically related to one another, which is consistent with the notion of a package of benefits. Verma, Thompson, and Louviere (1999) identified the following broad types of hotel attributes used by customers to choose hotels: hotel type, price, loyalty or frequent-user programs, dining options, office facilities and technology options, and hotel amenities. Regardless of how a seller achieves market advantage (the particular “package of benefits” employed), ultimately, advantage requires better and more distinctive benefits for its customers (Calantone, Chan, and Cui 2006; Slater and Narver 2000). This implies two important dimensions of market advantage. The first is the extent to which customer preferences are satisfied (providing utility to customers), and the second is the extent to which the market offering is different from that of competitors (providing advantage to the seller). Thus, we borrow from Cooper (1994, 61) and define market advantage as the degree to which a business’s market offering “provides unique and superior benefits not available from competitors.”
Influences on Market Advantage
Innovativeness can positively influence market advantage in a number of ways. Zhou and Nakamoto (2007) suggest that innovative features of a market offering tend to receive better evaluations, regardless of whether consumers have experience with the product category. By continually offering novel and different features in the marketplace, innovativeness provides reasons for customers to purchase and repeat their purchase (Carpenter, Glazer, and Nakamoto 1994; Langerak, Hultink, and Robben 2004). Innovativeness may also simplify purchase decisions by providing greater perceived value (Sorescu, Chandy, and Prabhu 2003), thus providing a basis for customer loyalty (Boyle 2007). Tornatzky and Klein (1982) found that perceived innovativeness was consistently among the most important predictors of adoption. As both customers’ preferences and competitive offerings in markets change, a business will not be able to provide superior market advantage without being continually innovative (Cooper 1994; Dickson 1992; Moorman 1995). Consequently, we propose that innovativeness will positively affect a hotel’s market advantage.
While innovativeness by itself can be a powerful tool for competing in markets (Dahl, Chattopadhyay, and Gorn 1999; Kleinschmidt and Cooper 1991) that is also true for visibility. For instance, Wei (2001) studied the adoption of cellular phones in Hong Kong and found that only observability (visibility) had a significant impact on the likelihood of adoption. Campbell and Cooper (1999, 510) propose that advantage is gained by “offering new, important, and visible benefits to customers when compared to competitive solutions.” Talke and O’Connor (2011) found a number of types of information sought by consumers during innovation evaluation and adoption, including “usability information,” which incorporates relative product advantage and observability. Moreau, Lehmann, and Markman (2001, 16) found that if the customers are “novices,” they tend to rely on “visible product attributes” in adoption decisions. Indeed, consumer research has shown that mere exposure to objects (creating greater awareness) is sufficient to change an individual’s attitude (positively) toward those objects (Zajonc and Markus 1982). Accordingly, we expect that visibility will promote market advantage.
The second type of relationship in this model is the moderated relationship or interaction between innovativeness and visibility as they influence market advantage. The literature regarding this interaction is not entirely consistent. On the one hand, the adoption-of-innovations literature indicates that when innovations are more visible, they are more likely to be adopted (e.g., Gatignon and Robertson 1985; Moore and Benbasat 1991; Rogers 2003; Tornatzky and Klein 1982). Wang and Ahmed (2004) found that these two influences (innovativeness and visibility) are often inextricably intertwined. The logic behind this relationship is that visibility increases the likelihood of exposure to an innovation, which “makes the given stimulus accessible to the individuals’ perception” (Zajonc 1968, 1). For retailers of services such as hotels, the physical environment of consumption plays an important role in what customers notice and how they evaluate their service experiences (Baker, Berry, and Parasuraman 1988; Baker, Grewal, and Voss 2002; Bitner 1992; Darden and Babin 1994; Sherman, Mathur, and Smith 1997; Zeithaml 1981). In addition, the visible portions of the service environment provide indicators of service quality that are often used by customers to judge the invisible (unobservable) portions of the services (Bitner 1992; Kramer et al. 2012). Hartline, Maxham, and McKee (2000, 41) indicate that in the services environment, “customer contact employees are often the only representation of the service firm that is visible to the customer.” Therefore, customer contact employees are often inseparable from the product offering and are directly responsible for delivering quality service (Parasuraman, Zeithaml, and Berry 1985).
On the other hand, some literature has found that the interaction between innovativeness and visibility is not influential. In meta-analysis of the research on the relationship between perceptions of innovation characteristics and adoption, Tornatzky and Klein (1982, 38) concluded that the effects of observability and trialability on the likelihood of adoption were weak and that “it is unclear whether observability per se is being assessed, or observability of cost, compatibility, effects, etc.” Thus, observability and trialability are often avoided in many studies (e.g., Moreau, Lehmann, and Markman 2001; Sääksjärvi and Samiee 2011). However, because so much hotel innovativeness is not visible to customers (backstage activities), we believe that the interaction of innovativeness and the visibility of benefits is indeed important in the hotel context. Therefore, we have included this interactive relationship in the model.
In summary, we offer the following propositions regarding the influence of innovativeness and visibility on market advantage for hotels.
Defining Sales Growth
An increase in the total level of sales (units or revenue) over a specific period of time is the definition of sales growth that we have selected. In stable markets, sales growth positively correlates with market share and other constructs often used to define performance. However, regardless of changes in market share position, sales growth typically indicates an increase in a business’s economic health. Growth provides a larger base of resources with which a business can pursue activities to improve market and profit positions. Growth in sales also signals to investors, customers, and employees that the firm is effective in its markets.
Defining Capacity Utilization
The percentage of capacity that is used is an indication of efficiency in managing a firm’s assets, and it may be the best indicator of the overall position and health of businesses (Capon, Farley, and Hoenig 1990; O’Neill and Mattila 2006). This is particularly true for businesses with relatively high investments in fixed capacities such as in many hospitality firms (Rushmore 1997). Capacity utilization captures both the decisions about what level of capacity to provide (e.g., hotel size, number of rooms to keep ready) and the success of efforts to sell the available capacity. The gaps between capacity and demand are inefficiencies reflecting missed forecasts of demand or missed targets for capacity availability. However, sometimes underutilization is intentional because a hotel manager may wish to keep some reserve capacity available for higher paying customers (Cross, Higbie, and Cross 2009). We define capacity utilization as the proportion of the total goods and services a hotel could offer to sell that it actually does sell.
Defining Profitability
The ultimate performance measure for private businesses is profitability. Without long-run profitability, a business is simply eroding its investment base. Due to its importance, profitability concepts are employed in many areas of business research. For instance, they are employed in hospitality research (e.g., O’Neill and Mattila 2006; Skalpe and Sandvik 2002; Smith 2011; Woodsworth and Mandelbaum 2010) and strategy research (e.g., Venkatraman and Vasudevan 1986). In addition, definitions of profitability may be expressed in absolute terms (monetary profits) or in comparisons and ratios. For instance, profitability might be compared to active costs (e.g., gross margins, net margins), to specific activities within the hotel (e.g., return on sales (ROS), return on value added, return relative to past performance, return on various aspects of the business), to the capital provided to the firm (e.g., return on equity, assets, debt, total investments), to stock prices across time (Nicolau and Santa-Maria 2013), or to factors in the business environment such as profits before or after taxes, profits relative to competitors, or profits relative to industry averages (e.g., Tajeddini and Trueman 2012). We broadly define profitability as the ratio of returns to identifiable assets and sales in percent. Our specific measures of profitability are presented in the method section.
Influences on Profitability
As noted above, there are many influences on profitability. The body of research on the effects of product or market advantage on business performance provides mixed findings (see Zeithaml 2000 for an overview). Some studies have found negative effects (e.g., Morgan and Vorhies 2001) and others positive effects (e.g., Henard and Szymanski 2001; Langerak, Hultink, and Robben 2004; Song and Montoya-Weiss 2001). In this model, we propose multiple paths for the influence of innovativeness on profitability. All of the paths go through market advantage and diverge after that. The first path from market advantage is directly to profitability. This path reflects the aggregation of benefits (influences on both revenues and cost reductions) to the hotel from its market position. We expect that relationship to be positive, and we offer the following proposition:
The second path to profitability includes sales growth as a mediator (in addition to market advantage). When a firm’s market offering has an advantage in terms of customers’ benefits, it influences perceptions of value (Gatignon and Xuereb 1997). When customers find such market offerings, they “are likely to buy more frequently and in greater volume and purchase other goods and services offered by the firm” (Anderson, Fornell, and Lehmann 1994, 55), thus increasing sales through volume growth. However, customers may also be less sensitive to price (Teas and Agarwal 2000), thus providing an opportunity for increasing sales through premium pricing (e.g., Oliver 1997). Either of these approaches will be positively influenced by market advantage and positively related to profitability (e.g., Capon, Farley, and Hoenig 1990; Cronin and Page 1988; Narver, Jacobson, and Slater 1993; O’Neill and Mattila 2006). We expect that market advantage positively influences levels of sales, which in turn positively influence profits.
The third path also has an additional mediator: capacity utilization. Market advantage may be used by a hotel to increase the volume of customers, and even if the monetary sales level does not change significantly, this would improve capacity utilization and increase a hotel’s ability to gain scale economies and cover fixed costs. It would also have a positive influence on profitability. Thus, we offer the following research propositions.
Method
Context
The hotel industry has some significant advantages as a context for this research. First, hotels sell directly to consumers who are thoroughly engaged in the consumption of those services. A customer’s overall assessment of a hotel is a mix of experiences and specific features. As a result, customers are likely to experience and react to innovative attributes of hotel offerings. Second, hotels provide an effective context in which to employ efficiency concepts such as capacity utilization, given the difficulty in altering hotels’ capacity. This avoids the confounding effects of capacity changes within a given financial reporting period.
We studied the Norwegian hotel market, which offers a number of additional advantages. First, it encompasses a diversity of markets (e.g., business vs. tourist, diverse price ranges). Second, hotels in this market have a history of high levels of cooperation with researchers. Third, there are excellent secondary data sources about the businesses in this market from which to draw additional data regarding the hotels.
Controls
Customers are attracted to positive benefit-to-price ratios or “value” (Zeithaml 1988). This is especially true in the hotel industry where dynamic pricing is commonly practiced and where many customers frequently perform value assessments. Value also takes competitor prices as reference points (relative value) when the same or similar levels of attributes are offered (Gatignon and Xuereb 1997). Therefore, cost leadership and differentiation strategies employed by the businesses (Porter 1980) were used as controls (Sandvik and Sandvik 2003). Similarly, hotel chain membership has been found to significantly influence financial performance (e.g., Baum and Greve 2012; López-Fernández, Serrano-Bedia, and Gómez-López 2011; Martínez-Ros and Orfila-Sintes 2009; O’Neill and Mattila 2006), which does not reflect the innovativeness of an individual hotel business. Consequently, data on chain membership were collected to use as an additional control.
Measures
We adapted the measures employed in this study for language, culture, and industry context through discussions with experts in the Norwegian hotel market. In addition, we consulted with people who were representative of the informants in the study regarding these adaptations in this empirical setting. A comprehensive and iterative process (including translation and back translation) was employed with these experts, and it produced measures with satisfactory face and content validity. The constructs in this model are: the innovativeness of the hotel business, the visibility of customer benefits, market advantage, capacity utilization, sales growth, and profitability. In addition, we included three control variables: differentiation strategy, cost leadership strategy, and hotel chain membership. The items chosen for collecting data are presented in the appendix.
Innovativeness items were adapted from a scale developed by Deshpandé, Farley, and Webster (1993). As a part of the process described above, we modified the items to fit the Norwegian hotel context. Also, since the model for this research is centered on the markets as a mediator, we modified items to reflect the comparisons to competitors and recent innovative intensity. Items from Cooper’s (1994) product superiority scale were adapted to measure market advantage and the visibility of customer benefits. These employed a 5-point Likert-type scale, ranging from “strongly disagree” to “strongly agree.” Average room occupancy rate for the year was used as the measure of capacity utilization. This is a standard hotel industry measure that is regularly calculated and used by hotel managers.
Sales growth and profitability were each measured both subjectively and objectively. This is similar to the approach used by Pereira-Moliner, Claver-Cortés, and Molina-Azorín (2010, 516), who used objective and “perceptual” measures of performance. We employed two measures for profitability in this study because the use of subjective measures of performance may be another explanation for the weak innovativeness–performance relationships (Henard and Szymanski 2001). Szymanski, Kroff, and Troy (2007) comment that subjective assessments are likely to be less accurate because of demand artifacts and escalation of commitment effects, creating the possibility that subjective assessments will be upwardly biased. Dess and Robinson (1984) agree and argue that objective measures are preferred. However, Venkatraman and Vasudevan (1986) found that subjective measures are somewhat more valid. We decided to collect and employ both subjective and objective assessments for the test of this model.
The objective measures of profitability and sales growth were obtained from annual reports. Sales growth is measured using the percentage change in sales from the previous year. The profitability measures used are ROA and two forms of ROS. ROA is net profit before taxes plus interest payments divided by the total assets of a firm. ROA is an important performance measure in marketing and management (e.g., Jacobson 1992), but it has two disadvantages. First, ROA inflates when a firm’s investments depreciate (e.g., hotel facilities), while new investments (which may reflect innovations) deflate ROA. Second, the concept of an asset may not capture the value of other aspects of a business (Buzzell and Gale 1987).
ROS is an activity-based (rather than investment-based) measure of profits that avoids the sensitivity to depreciation that is inherent with ROA (Buzzell and Gale 1987). The two forms of ROS we used are operating profit margin and net profit margin. Operating profit margin is the cash flow from a firm’s operations available to cover costs of investments, debt, loan repayment, and dividends. It is the profit from operations expressed as a percentage of sales. Net profit margin is similar to operating profit margin, but it is calculated after taxes have been paid. Net profit margin is the amount available for equity accumulation or dividend payments. Since there is considerable conceptual overlap among these three measures, they are treated as reflective indicators of hotel profitability. There are two advantages to this approach. First, it creates a more robust form of profitability since both activity-based and investment-based dimensions are included. Second, the resulting profitability measure is unidimensional.
We followed the approach of Narver and Slater (1990) and used a subjective comparison of profitability to the businesses’ most important competitors. The comparison ranged from “poorer profitability” to “greater profitability” on a 5-point scale. Similarly, subjective sales growth ranged from “lower sales growth” to “greater sales growth” on a 5-point scale. We adapted a scale from Nayyar (1993) to measure the competitive strategies of the hotels. Differentiation strategy refers to product flexibility, reputation, premium product quality, and extensive customer service within the business. Overall cost leadership refers to the firm’s costs indexed by those of competitors. The respondents scored each item on a 5-point scale, ranging from “strongly disagree” to “strongly agree.” Chain membership is a simple yes or no dichotomy.
Data Collection
The data were collected using telephone interviews with hotel general managers and audited financial statements of the business for the year of the survey. The sample frame was a combination of the Dun and Bradstreet’s Corporation Database 1 for Norwegian hotels and the directory “Hotels in Norway.” 2 The resulting list contained 594 hotels. The annual reports for those businesses provided the objective data on profitability and sales growth. The hotel managers served as key informants for the subjective measures because of their superior access to information about all aspects of the businesses’ activities. A recent meta-analysis by Homburg et al. (2012, 13) concluded that general managers are excellent key informants: “Informants in high hierarchical positions and with longer tenure are more reliable.” This is particularly efficient in small and medium-size businesses such as hotels. The general managers provided information about innovativeness, visibility, market advantage, capacity utilization, and subjective assessments of profitability. A leading market research company in Norway collected the telephone interview data. No incentives were offered for participation, and the hotel managers were assured that the information they provided would remain confidential.
Analysis Procedures
The data were analyzed using structural equation modeling (SEM). SEM procedures involve a number of steps that are broadly grouped into those related to assessing the quality of the construct measures (validity and reliability) and those used to explicitly test the propositions from a specific model. In addition, SEM allows investigation of indirect effects of a construct through other constructs and comparisons of one form of a model with other (rival) forms.
Results
The Sample
This study employed a sample of 298 responses from the Norwegian hotel market, which was a response rate of 50 percent and provides a good representation of the Norwegian hotel industry. This market has some distinctive characteristics to consider regarding the non-respondents. For instance, given the importance of both grand scenic tourism and ski tourism in Norway, it is not surprising that (1) most hotels in this sample are not in metropolitan areas (78% non-metro), (2) few of them are large (an average of 32 full-time employees with a standard deviation of 47), and (3) nearly 20 percent of them are seasonal (open for an average of seven months per year). There was a lower response rate among hotels with only a few employees. Accordingly, small hotels are perhaps inadequately represented in this study. A more detailed follow-up of a subsample of 44 non-respondents found that they were typically hotels where the hotel manager was not available or did not want to participate. Some reasons given for non-participation included not giving priority to such studies, not feeling that they were able to give the time needed to respond, or the questions were of little relevance to them. This is also evident when comparing the sales levels for the 298 respondents to those for the full sampling frame. Therefore, there is a possibility of a bias in this sample toward the medium-size hotels that are open year-around. Smaller hotels are more likely to be seasonal. The average occupancy rate among the respondents is 55 percent, and approximately 51 percent of them are affiliated with a hotel chain.
Data Analysis
Measurement assessment
We used the two-step approach suggested by J. C. Anderson and Gerbing (1988), which includes validating the measurement model before testing the hypothesized model. We used LISREL 8.8 and performed confirmatory factor analysis to validate the measures using procedures recommended by Hinkin (1998). The initial analysis resulted in the exclusion of one scale item each for differentiation strategy, innovativeness, and visibility, and three items for market advantage. The remaining items provide a good representation of the constructs. The final measurement model has a chi-square of 72.48 with 59 degrees of freedom (p = .11), non-normed fit index (NNFI) = .98, comparative fit index (CFI) = .99, and root mean square error approximation (RMSEA) = .024, p(close fit) = .99. The three latter fit indices are all greater than the suggested cutoffs for good model fit (Hu and Bentler 1999), and the unidimensionality of the measures is satisfactory. Exhibit 3 presents the results for the full measurement model.
Confirmatory Factor Analysis (CFA) Results for the Full Measurement Model.
Item numbers refers to the item list in the Appendix.
Standardized coefficients.
We used the procedure suggested by Fornell and Larcker (1981) to assess discriminant validity. Composite reliability for each construct should be greater than the variance shared between that construct and the other constructs in the model (i.e., the squared correlation between constructs). None of the squared correlations for each construct is higher than the composite reliability for the particular construct (Exhibit 4). Accordingly, discriminant validity is satisfactory for all constructs. Item reliability assessments (Exhibit 3) and those for composite reliability (convergent construct validity, Exhibit 4) are satisfactory (Bagozzi and Yi 1988).
Correlation Matrix. a
The diagonal contains the composite reliability of the latent constructs that estimate the structural model.
p < .05. **p < .01.
Model test with objective financial performance
Exhibits 4 and 5 present the correlation matrix and the results from the tests of the null hypotheses using the objective performance measures. We treated the controls as exogenous variables that were free to co-vary with other latent variables in the model. As suggested by Marsh, Wen, and Hau (2006), we applied the efficient and robust unconstrained approach in SEM to test the interaction effects. This involved mean-centering of all exogenous indicators, including the indicators being used to compute interaction terms. The fit of the structural model is good, and the model shows a satisfactory ability to reproduce the observed variance–covariance matrix of the sample. The chi-square is 103.20 with 75 degrees of freedom (p = .017). The RMSEA value is .032, which is below .05, the cutoff for close fit (p = .96). The NNFI (.96) and CFI (.98) values meet the requirements for good fit suggested by Hu and Bentler (1999).
Structural Model Estimation Results: Direct Effects.
p < .05. **p < .01.
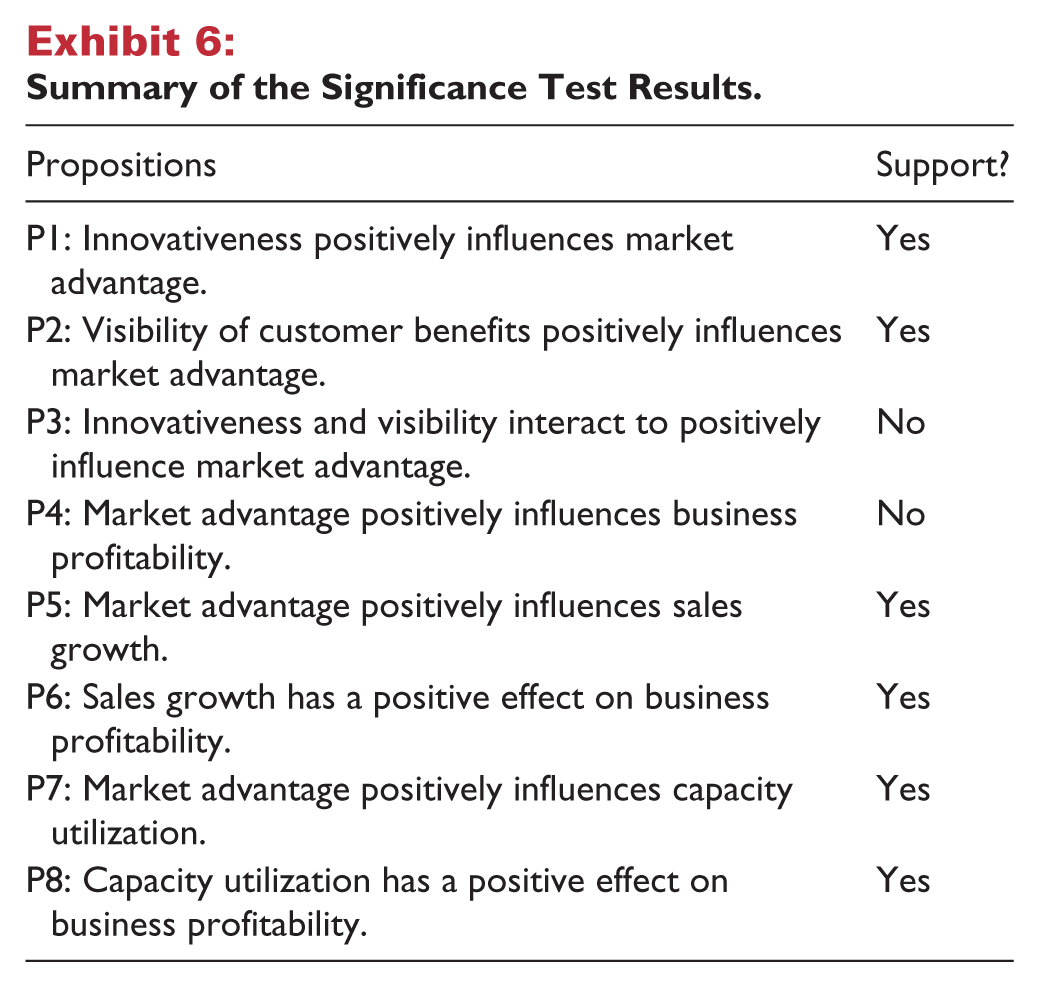
The model proposes that innovativeness and visibility have positive influences on market advantage. The results indicate that the direct effects are significant (ξ = .45, p < .01 for innovativeness and ξ = .16, p < .01 for visibility), while the interactive effect between innovativeness and visibility on market advantage is not significant (ξ = −.01). These results support P1 and P2 but not P3. Market advantage does not have a significant direct effect on profitability (ξ = −.03), thus providing no support for P4. However, market advantage does directly affect sales growth (ξ = .27, p < .01), and sales growth directly influences profitability (ξ = .30, p < .01), supporting P5 and P6. The model also proposes that market advantage has a positive influence on capacity utilization, which in turn has a positive influence on profitability. Market advantage is significantly related to capacity utilization (ξ = .34, p < .01), which is related to profitability (ξ = .33, p < .01), supporting P7 and P8.
Model test against rival structure
Although the proposed model fit well, we tested a rival model that included a direct path from innovativeness to profitability. This is a more saturated model, and in absolute terms, more saturated models will always fit better than restricted models (Anderson and Gerbing 1988). So, as expected, the rival had a slightly better fit (χ2 = 98.09, df = 72, p = .022). However, the model comparison (see Exhibit 5) results in a chi-square difference (5.11, df = 3) that is not significant (p = .16). Thus, the proposed model is preferred because it is more parsimonious.
Model test using subjective performance measures
The correlations between the objective and subjective measures of sales growth and profitability are positive and significant (see Exhibit 4). We substituted the subjective measures to perform an additional test of the conceptual model. The results of that test were nearly identical to the results with the objective measures. The two models had the same significant direct and indirect paths. Exhibit 6 summarizes the results of these tests of the propositions.
Summary of the Significance Test Results.
Discussion
The use of mediators in this investigation was effective. The direct correlation between hotel innovativeness and profitability is essentially zero, as shown in Exhibit 4. Yet the indirect effect of innovativeness on profitability is significant, as shown in Exhibit 7. This is an example of full mediation with market advantage, sales growth, and capacity utilization serving as mediators. Therefore, the general conclusion of this study regarding the innovativeness–profitability relationship is a qualified confirmation of the importance of innovativeness for hotel financial success. The qualification in this study is that the relationship is mediated and does not exist directly. Clearly, if only the direct relationship between innovativeness and profitability had been considered, then this study could have concluded (like many others) that the innovativeness–profitability relationship is not significant. So from a researcher’s perspective, we recommend the use of appropriate mediators when investigating the relationship between innovativeness and performance.
Structural Model Estimation Results: Indirect Effects.
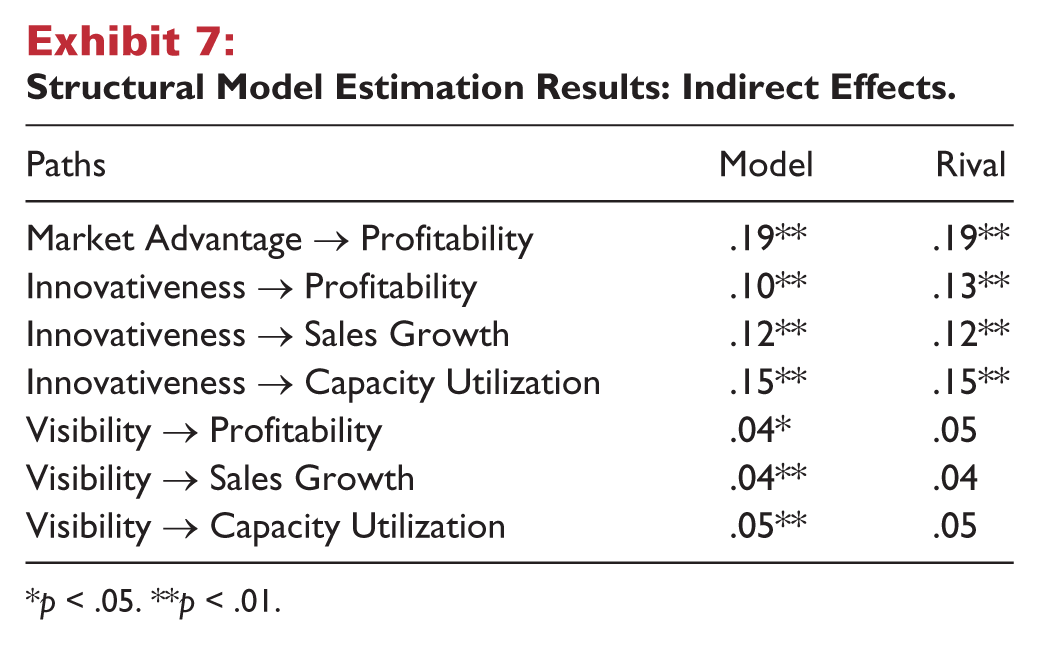
p < .05. **p < .01.
In contrast to the effective use of the mediators, the use of the visibility of customer benefits as a moderator of innovativeness was not effective. A potential explanation for this result may be found in the differences between “search” and “experience” services (Zeithaml 1988). In the case of experience services, innovations may become apparent (visible) only as a part of the consumption, thus limiting the influence of visibility on the likelihood of a customer choosing to experience the innovative service in the first place (the interactive effect). If so, then we are more likely to see a significant direct effect of visibility (which did occur) but not an indirect effect. In the case of shopping services, the visibility of the benefits to customers is more likely to influence the decision to try a service (Rogers 2003), and thus is more likely to have an interactive effect with innovativeness.
It is possible to assess the use of objective versus subjective measures of performance since we used both in this study. There are few studies that utilize both objective and subjective measures (e.g., Pereira-Moliner, Claver-Cortés, and Molina-Azorín 2010; Sandvik and Sandvik 2003; Sorescu and Spanjol 2008). The objective measure of profitability employed here is a combination of indicators that minimized measurement biases (e.g., Buzzell and Gale 1987; Jacobson 1992). In this study, the correlations between the objective and subjective measures are positive, and the tests of the model using each of them produced essentially the same results. This adds little to the debate over which approach is better. However, using both in this study does enhance the validity of both the measures and the results of the model.
Managerial Implications
Hotel managers should encourage innovativeness in their organizations. To do so, they should start with an understanding of their organization’s culture. Two important dimensions of organizational culture that are related to innovativeness have been identified (Deshpandé, Farley, and Webster 1993; Valencia, Valle, and Jimenez 2010). The first dimension is a flexible orientation versus a control or stability orientation, and the second dimension is an external orientation versus an internal orientation. Four types of organizational culture have been defined by these two dimensions. These are “Ad hocracy” (externally oriented and flexible), Market (externally oriented and stable), Clan (internally oriented and flexible), and Hierarchy (internally oriented and stable). Valencia, Valle, and Jimenez (2010) report that ad hocracies foster innovativeness, but hierarchies discourage it. After identifying where the hotel’s organization stands on these dimensions, managers could employ efforts to move the culture in a direction toward ad hocracy and away from hierarchy. Managers should also direct innovative activities toward market advantage because that will in turn influence performance. Advantage, growth, and capacity utilization are useful for monitoring the indirect effect of innovativeness on profitability.
An extensive review of the literature by Damanpour (1991) found that differences between goods and services contexts were important to understanding the role of innovativeness within firms. Since the market offerings of hotels are almost purely services, this distinction is a particularly important issue. Chief among the reasons for this importance is the fact that service innovations are more difficult to protect through patents or other forms of intellectual property (Agarwal, Erramilli, and Dev 2003; Atuahene-Gima 1996; Geroski and Machin 1992), and as a result, the advantages of most innovations for hotels tend to be comparatively short-lived (Cooper and de Brentani 1991; de Brentani 2001; Song, Di Benedetto, and Zhao 1999; Storey and Easingwood 1998; Sundbo 1997). This means that hotels are more dependent on continuous innovation (innovativeness) to maintain the superiority of their market offerings than businesses whose market offerings are primarily goods (Nijssen et al. 2006).
A customer’s overall assessment of a hotel is a package of benefits with specific features (e.g., dining, room interior, room view, and front desk service) as well as the presence or absence of other features (e.g., spa, fitness center, free car parking, airport shuttle, in-room connectivity, trendy restaurant, and smooth check-in and check-out). As a result, innovativeness must be developed for a variety of activities and that may take time to establish and improve. When a hotel launches a new market offering, a number of marketplace changes may occur. For example, (1) competitors may decide to launch new offerings of their own, which increases consumer choice; (2) new information technologies may become available that enable competitors to introduce technologically innovative offerings with enhanced features (e.g., using mobile phones to enter hotel room); and (3) economic conditions may change that influence consumers’ buying behaviors. As a result, market offerings often face environments that differ considerably from those that existed during their development and launch (Buganza and Verganti 2006). As Verganti and Buganza (2005, 224) emphasize,
competitive advantage seems to be built not only on the ability to design a new service but also (and often even more importantly) on the ability to redesign and to adapt a service according to contextual changes and technical opportunities after it has been first released on the market.
Therefore, continuous innovation (i.e., the ability to quickly adapt and redesign market offerings in response to marketplace changes) is an important capability for organizations (Buganza and Verganti 2006). When hotels fail to rapidly respond to changes in the external environment, they leave competitive openings that can be exploited by rivals.
The process of developing innovations has been studied (e.g., Cooper and Kleinschmidt 1987; Sengupta and Dev 2011; Song and Parry 1997a, 1997b) and could be adapted to provide a valuable understanding of the innovativeness capability. Innovativeness capability consists of opportunity analysis, technical development, market offering testing, and commercialization (Enz 2008; Sandvik, Arnett, and Sandvik 2011). It requires the development of the hotel’s capacity and competence to perform each of these proficient stages. Since most hotels are different regarding organization, human capital, and market segments they serve and services that they sell, it takes time to learn what types of innovativeness capabilities work best for each hotel. Therefore, it is likely that those hotels that are innovative before innovation is obviously required will be better at developing a market advantage over time. Hotels that wait until their market advantage declines may not have the capital, flexibility, or time to make significant investments in innovativeness capabilities (new resources and processes) unless they have immediate payoffs.
Since many innovations are not visible and may not provide obvious responses directly from customers, it may be tempting for management to emphasize front-stage (more visible) innovativeness at the expense of backstage conceptual and process-type innovativeness. This could be a mistake. As Hertog, Gallouj, and Segers (2011, 1443) recommended, management practices should “more explicitly address and facilitate these broader types of innovations.” Modern marketing opens up a great variety of options to literally visualize innovations. First, hotels increasingly use videos and pictures online to effectively capture customer experiences of new market offerings. Second, digital Customer Relationship Management (CRM) systems enable numerous possibilities to design “programs” for the preferences and purchase likelihood of different segments. These programs can be more comprehensive in their descriptions of, for example, a new men’s spa therapy, sashimi tartar menu, kitchen tours, or a rooftop bar compared to the more general hotel information that is applicable for mass communication. Third, affiliate marketing and co-marketing are also means to reach particular segments and to more easily facilitate appropriate consumer learning about the innovation (e.g., hotels’ use of brands, such as Gordon Ramsay at Paris Las Vegas, and entire hotel concepts, such as Armani hotels), as well as joint events that use hotel’s innovative facilities and concepts (e.g., film set). Fourth, customers’ increasing use of online word of mouth contributes to the communication of new hotel offers and features through channels such as YouTube, Trip Advisor, Facebook, and Twitter. Hotels’ management of word of mouth is important to creating buzz about and credibility for innovations. Hotels display great variety in how they communicate their innovations. We believe that significant and continuous efforts to visualize and present new market offerings will pay off in the marketplace. Thus, a commercialization plan for each innovation is crucial to generate sufficient revenue for success.
Limitations and Future Research
In this study, we attempted to address some of the methodological and theoretical issues that influence the reported relationship between innovativeness and profitability by (1) choosing definitions that have consistent units of analysis, (2) adopting a theoretical framework consistent with a mediated innovativeness–performance relationship, and (3) using both objective and subjective measures of profitability. In addition, since there may be substantial differences in the nature of the relationships within various markets, the use of a single market in this study provided a natural control on some of the potential sources of noise and bias. For instance, the businesses in the same market are more likely to be competitors with one another, and so their responses regarding resources and market positions are more likely to be comparable (e.g., indications of “high” performance in one industry might be considered “moderate” or even “low” in another).
However, since all research is conducted in some specific contexts, that leaves any study with a number of limitations regarding the generalizability of its results. In this study, the most obvious follow-up is to test this model in other contexts. For instance, studies could be done in more macro contexts, such as additional country markets or even multi-country markets, to explore contexts that differ due to a variety of issues such as regulatory environment. Also, more micro contexts could be explored such as business or tourism segments of hotel markets. Alternatively, an investigation of “utilitarian” hotels (perhaps those serving airports or hospitals) versus “destination” hotels (those that are attractions themselves, e.g., lodges in national parks or hotels within major tourist attractions such as Disney resorts, Las Vegas, Norwegian fjords, and perhaps even cruise ships) would be appropriate. Such hotel markets provide contrasts in shopping behaviors that reflect differences in the basic nature of those segments. In addition, a variety of other businesses in these sectors that are similar in many ways to hotels could also be important contexts to investigate. For instance, many hospitality businesses have product offerings that also combine tangible and intangible services and innovations that can quickly be copied.
Another valuable follow-up would be to investigate the potential of lagged effects. Such effects have been found in studies of customer satisfaction and profitability(Anderson, Fornell, and Lehmann 1994; Skalpe and Sandvik 2002). If there are significant lagged effects, then the influence of innovativeness could be spread across time, diluting the impact of innovations in any particular time frame (Cho and Pucik 2005). A major concern is that studies that include a series of steps (mediated relationships) can fall prey to domino effects in which the last domino falls outside of the time frame of the study.
RevPAR and other measures of performance could be included and applied within each year of a study. Additional measures that could be included are average room rates or revenue related to restaurants, gift shops, bars, and other hospitality services. One could also include revenue per guest that takes into account the revenue optimization of the entire hotel business (e.g., room rates may reflect differences in the strategy for optimizing revenue across seasons or types of guests). These additional concepts may require modifications of the relationships within the model tested here. Nonetheless, they provide opportunities for a richer and more complete understanding of the mediated system of relationships behind the profitability of hotel businesses.
Footnotes
Appendix
Acknowledgements
The authors thank the Editor, Professor J. Bruce Tracey and the three anonymous reviewers for their helpful and constructive comments and suggestions for improving this article.
Declaration of Conflicting Interests
The author(s) declared no potential conflicts of interest with respect to the research, authorship, or publication of this article.
Funding
The author(s) disclosed receipt of the following financial support for the research, authorship, or publication of this article: The research was financed by the Norwegian Research Council (research grant #227026/O50).
a
Delete item as a result of the measurement validation procedure.