
Abstract
Accounting earnings are used extensively in the lodging industry for the purposes of incentive contracting, credit assessment, and valuation but we know little about the attributes of lodging properties’ accounting earnings and their determinants. Two important attributes of accounting earnings are persistence and predictability, which have been identified as key components of sustainable earnings. In this study, we examine a sample for lodging properties over a lengthy time-period to investigate the property-specific determinants of the persistence and predictability of lodging properties’ earnings. We find that barriers to entry, measured by the relative amount of marketing expenditures, have a positive impact on these earnings attributes. We also find that revenue diversification has a positive effect on these attributes, presumably through its impact on earnings stability. Finally, we find that resource rigidity, as measured by operating leverage and labor intensity, have a consistent dampening impact on persistence and predictability.
Introduction
Although accounting earnings are used extensively in the lodging industry for the purposes of incentive contracting, debt assessment, and valuation, little is known about the attributes of lodging properties’ accounting earnings. One objective of accounting information in the lodging industry is to provide owners and other investors with information to enable them to make optimal capital allocation decisions. Earnings representative of operations is a key objective of financial reporting in that it can improve the decision making of these constituents. In addition, earnings are important in debt contracts, management decisions, management compensation arrangements, and by outsiders such as asset managers in evaluating the company’s managers.
Two important attributes of accounting earnings are persistence and predictability. Earnings persistence addresses the enduring nature of an accounting earnings number. Earnings persistence measures the extent to which current earnings persist or recur in the future. High persistence indicates a sustainable earnings generation process that is particularly valued by investors. Persistent earnings are earnings that are expected to reoccur, thus persistence is viewed as a desirable characteristic of an earnings number. Earnings predictability addresses the ability of earnings to predict itself. Predictability is a desirable attribute of accounting earnings as it can aid in forecasting activities and as such increases the precision of earnings forecasts.
Both of these attributes are partially determined by the strategic positioning and operating decisions of management. Using a sample of lodging properties over a lengthy time period, this study empirically investigates the determinants of the persistence and predictability of the operating earnings of lodging companies. We find that operating costs structure, diversification and market positioning through differentiation have a significant impact on these earning attributes.
Background on Drivers of Earnings Persistence and Predictability
Earnings Attributes
Earnings persistence is generally defined as the degree of the first-order auto-correlation in a time series of earnings numbers. Earnings persistence is a desirable attribute because it is indicative of earnings that are sustainable. For instance, a recent study of CFOs documented that sustainable and repeatable earnings are the most dominant and common concept of high quality earnings (Dichev, Graham, Harvey, & Rajgopal, 2013). Realizations from a persistent earnings series are readily usable for valuation (Schipper & Vincent, 2003) and have been shown to result in a lower cost of equity (Francis, LaFond, Olsson, & Schipper, 2004). Moreover, persistence has been shown to be associated with larger investor responses to reported earnings (Kormendi & Lipe, 1987), suggesting that persistent earnings have significant information content. Earnings persistence is also related to management compensation practices. For instance, Baber, Kang, and Kumar (1998) found that in a cross-sectional analysis of compensation paid to CEOs that the sensitivity of compensation to earnings varied directly with earnings persistence. Earnings predictability addresses the ability of earnings to predict itself. Earnings predictability is also a desirable attribute of accounting earnings as it aids in forecasting activities, a critical aspect of valuation. Together, persistence and predictability are indicative of earnings that are sustainable (Barton, Hansen, & Pownall, 2010).
Relevance of Earnings Attributes to Lodging Property Stakeholders
The accounting studies cited above principally focus on the earnings attributes of the net income of publicly traded companies. 1 In the lodging industry, there are a number of income measures at the property level that are of interest to the property’s stakeholders. Because gross operating profit is used extensively to determine the incentive portion of a management fee, understanding its attributes would be useful in determining the weight to place on this measure for purposes of incentive contracting. Asset managers, who are responsible for assessing operations, may prefer to focus on income after the payment of a management fee, typically defined as income before nonoperating income and expenses, in assessing the performance of property management. Finally, potential credit and equity investors will focus more on earnings before interest, taxes, depreciation and amortization (EBITDA), or EBITDA less a furniture and fixture reserve, in determining investment worthiness and a reasonable cost of capital. Thus, understanding the attributes of a variety of property-level income measures, and their determinants, is useful to the industry.
Determinants of Earnings Attributes
Prior studies in economics and accounting have documented a number of factors that are related to a firm’s earnings persistence and predictability. Nevertheless, at the current time there is no underlying framework for understanding the economic drivers of earnings properties (Frankel & Litov, 2009). While this study does not propose a specific framework, we discuss and examine the impact of business cycle sensitivity, barriers to entry, stability, and resource flexibility on these earnings attributes. In this manner, we hope to further our understanding of the key determinants of persistence and predictability in the lodging industry.
Business Cycle Sensitivity and Earnings Attributes
The degree of variability in consumption patterns has a large impact on the recurring nature of expenditures for a product, and thus the degree to which expenditures are discretionary should affect the sustainability of earnings. Lev (1983) was one of the first in the accounting literature to examine factors driving earnings attributes. He documented that firms in industries selling durables goods had less persistent earnings than firms in industries selling nondurable goods or services. Baginski, Lorek, Willinger, and Branson (1999) also investigated the link between durable goods and earnings characteristics. Using higher-ordered time series models, Baginski et al. (1999) found that firms in industries with nondurable products had more persistent earnings that firms in industries selling nondurables. In both of these studies, the focus was on industry differences.
Because many expenditures for lodging properties are discretionary, the lodging industry is highly sensitive to economic conditions. For instance, Wheaton and Rossoff (1998) documented that demand in the lodging industry is highly sensitive to business activity. The cyclical demand for lodging properties likely induces a large transitory element into the operating earnings of properties that could cause their earnings to exhibit frequent changes. This could lead to largely uncorrelated earnings over time that would reduce earnings persistence and predictability. This suggests that the industry as a whole may have less persistent earnings that other industries that are not dependent on discretionary expenditures. Within the lodging industry, however, properties face differing degrees of business cycle impact based on their clientele. We expect that properties that are dependent on travel will exhibit greater sensitivity to business conditions. Therefore, the persistence and predictability of earnings for those lodging properties that are highly sensitive to the business cycle should be lower than those properties that are less affected by varying business conditions.
Barriers to Entry Through Differentiation and Earnings Attributes
Early research by Stigler (1963) related the degree of an industry’s concentration to the stability of accounting returns and found that the industry pattern of returns was extremely stable through time in concentrated industries. In fact, the persistence differences in returns between firms in highly concentrated industries versus those in industries with low concentration became more noticeable 2 or 3 years out. Gort and Singamsetti (1976) confirmed Stigler’s finding by examining accounting returns for more than 500 manufacturers. They found that, although firms in concentrated industries did not have either higher levels of returns, or more variable returns, than firms in industries with little concentration, their accounting returns were more persistent than those in less concentrated industries. While market concentration and barriers to entry are closely related, Bain (1956) documented that barriers to entry was the primary explanatory of high returns. Mann (1966) confirmed Bain’s findings by examining return on equity measures for 30 industries a decade later. By restricting entry, firms are able to retain abnormally high profits. Lev (1983) used barriers to entry in place of industry concentration as a determinant of persistence and found that firms in industries that were deemed to have high barriers to entry exhibited more persistent earnings than firms with low entry barriers. Waring (1996) examined the persistence of firms’ annual earnings using industry metrics and found that the skill level of employees, unionization, and switching costs, in addition to more traditional measures of barriers to entry, were positively related to persistence.
The early industrial economics literature discusses four sources of barriers to entry: economies of scale, product differentiation, absolute cost advantages, and capital costs. The competitive strategy literature suggests that it is a firm’s business strategy, in addition to industry characteristics, that determines the persistence of profits. That is, while many of these barriers to entry are at the industry level, firms’ strategies also play an important role. For instance, the competitive strategy literature (Grant, 2008; Porter, 1980) argues that pursing a product differentiation strategy helps firm retain a long-run competitive advantage. A differentiation strategy erects competitive barriers as it tends to result in a price premium as the power of buyers is reduced due to the lack of product substitutability (D. Miller, 1988). Using a variety of annual earnings persistence measures Baginski et al. (1999) found that the higher-order ARIMA models document a positive association between barriers to entry, measured at the firm level as the sum of advertising and research and development over sales and earnings persistence. Francis et al. (2004) and Banker, Mashruwala, and Tripathy (2014b) among others, also find a positive link between percent of revenues spent on advertising and research and earnings attributes.
Stability of Earnings and Earnings Attributes
Because earnings volatility captures the effects of unavoidable economic conditions and random shocks, firms that operate in environments subject to these random economic events are likely to have less stable earnings and less predictable earnings (Dichev & Tang, 2009). Studies, such as Dichev and Tang (2009), and Frankel and Litov (2009), find a strong negative relationship between earnings volatility and earnings attributes. Two factors believed to be positively related to earnings stability are size and diversification. These factors are discussed directly below.
Frankel and Litov (2009) write that firm size has longed been linked with earnings variability. For instance, Scherer and Ross (1990) wrote that smaller companies tend to exhibit a greater variability of profitability through time than larger companies. They suggest one possible reason for this is that size could be related to monopoly power stemming from economies of scale or industry concentration. Whittington (1980) conjectured that large firms might be more diversified, which would lead to their having relatively stable profitability through time. He also noted that large firms tend to be more bureaucratic; more often managerially controlled which could lead to a policy of risk-aversion. Closely related to this concept, Watts and Zimmerman (1978) conjectured that the political cost of government intervention may moderate the investment risk-taking of large firms. Studies, such as Whittington (1980) and Dichev and Tang (2009), document a modest positive relationship between size and earnings volatility. The stable pattern of large firms relative to smaller ones might be manifested in a higher serial correlation in and predictability of the earnings of large firms. However, the results are mixed. Lev (1983) and Baginski, Lorek, and Willinger (1993) did not find size, as measured by total sales, to be related to earnings persistence. However, studies such as Francis et al. (2004) and Frankel and Litov (2009) did find a positive relationship between size and earnings attributes.
One key reason provided in the literature why size may be related to earnings stability is that many large firms are likely to be more diversified than small firms. For instance, Lev (1983) writes that large size seems to add an unexpected degree of intertemporal stability, probably resulting from diversifying into largely uncorrelated operations, which is typical of many large firms. Whittington (1980) and Frankel and Litov (2009) also argue that one reason why large firms may have more stable earnings is due to diversification. Research has also related measures of diversification to earnings volatility. J. C. Miller and Pras (1980) find that both size, measured by total assets, and diversification are positively related to earning stability. Whereas, J. C. Miller and Pras (1980) found international diversification was more strongly related to stability than product line diversification, Kim, Kim, and Pantzalis (2001) found product line diversification was more strongly related to earnings stability than international diversification.
Resource Flexibility and Earnings Attributes
Resource flexibility refers to the ability to firms to adjust resources to changes in demand. As resources become less flexible, or more rigid, firms have more difficulty matching committed resources to demand, especially in the short term. Holzhacker, Krishnan, and Mahlendorf (2015) note that a firm with a less flexible cost structure, which implies a lower change in cost for a change in quantity, imposes risk on the firm. Relative to a firm with a more elastic cost structure, a decrease in demand will have more negative profit impact on a firm, because a smaller proportion of costs will decrease with a decrease in quantity. Thus, earnings variability is positively related to a firm’s cost rigidity.
Operating leverage refers to the relative proportion of fixed costs to total costs in a firm’s cost structure. Given demand fluctuations, the higher the operating leverage, the larger the volatility of earnings. Having high operating leverage in the face of varying demand will cause disruptions in an earnings series that might be reflected in a low or no degree of serial correlation in the series. While there are a number of factors that determine the cost behavior of a particular resource, such the form of outsourcing and lease contracts, rents, and royalties, we are not aware of any results relating a complete measure of operating leverage to earning’s attributes. Rather, most research has limited their analysis of operating leverage impacts to measures of capital intensity. Lev (1983) found that one measure of resource flexibility, capital intensity measured as depreciation expense divided by sales, was negatively related to earnings persistence, but not earning variability, suggesting that firms with low resource flexibility have less persistent earnings than firms with high resource flexibility. However, Baginski et al. (1999) did not find such relation in their study. Using net property and equipment as a percent of assets as a measure of capital intensity, Francis et al. (2004) document that capital intensity was negatively related to both earnings persistence and predictability.
Some resources, such as lump sum rents, are costly to adjust in the short run and therefore are committed, causing fixed costs. Other resources, such as direct materials, can be adjusted quickly, giving rise to variable costs. Thus, whether a cost is fixed or variable depends on the level of adjustment costs for the underlying resource (Banker, Byzalov, & Plehn-Dujowich, 2014a). However, cost adjustments are not necessarily symmetric, particularly in the case of labor. When managers adjust labor resources, they have to incur adjustment costs such as hiring and firing costs. The sticky costs literature speculates that adjustment costs have a large impact on cost behavior, particularly with respect labor (Banker, Byzalov, & Chen, 2013). Due to labor regulations and other labor adjustment costs, labor-intensive firms are subject to high labor adjustment costs, which makes it particularly difficult to cut down on labor resources in periods of slow economic activity. Thus, it is expected that labor resources have a negative effect on the flexibility of resources.
Method
The main objective of the empirical analysis in this article is to determine the determinants of earning persistence and predictability. The data used in this study are detailed property-level annual operating information for lodging units. This information is supplied by the hotel division of CBRE (formerly PKF). The hotel division of CBRE has been collecting year-end operating statements from thousands of hotels across the United States since 1936. Their database is the oldest and most comprehensive source of hotel financial information in the United States. CBRE provided the annual year-end data for each property from their database for each year from 1997 to 2015. Since new hotels open every year, and others close, the number of hotels in our sample varies by year. To calculate the earnings attributes we required a minimum of 10 sequential observations of earnings, operating costs, and revenues. These criteria limited our sample to 2,444 properties. Our total final sample size was 31,194 property-year observations over the 19-year study period. These data are particularly valuable because they have been compiled using a uniform measurement system to facilitate across-firm comparison on key income and expense categories.
Empirical Model of Persistence and Predictability
All of the key variables used in the study are defined in Appendix 1. Following Francis et al. (2004) and Barton et al. (2010), among others, we estimate persistence as the slope coefficient θ1i from the first-order autoregressive model of current earnings on lag earnings:

The subscripts i and t denote property and year, respectively. Values of θ1i close to one indicate high persistence, while values close to 0 indicate very transitory performance or low persistence. Following Barton et al. (2010) our proxy for a performance measure’s predictability is the adjusted R2 from the first-order autoregressive model shown in the equation above. Larger values of this metric imply more predictable future earnings. In this formulation, persistence will have a direct impact on earnings predictability. The model’s parameters are estimated using three different earnings measures from the 11th edition of Uniform System of Accounts for the Lodging Industry (USALI 11th): gross operating profit, gross operating profit less management fee, and EBITDA. Appendix 2 illustrates the differences in the three earnings numbers.
An alternative approach to measuring persistence would be to use a cross-sectional approach. The cross-sectional approach pools firm-year observations within a given year, and perhaps across years also, to estimate a single persistence parameter using all available firms in the analysis. Call, Hewitt, Shevlin, and Yohn (2016) note that using this latter estimation approach, the persistence parameter captures the average of the underlying firm-specific persistence parameters. This approach usually assumes—implicitly or otherwise—that the inferences stemming from cross-sectional estimation extend to firm-specific estimation. With this cross-sectional approach, predictors are then crossed with lagged earnings to measure their directional effect. We reject this approach as cross-sectional and firm-specific estimation procedures generally do not lead to the same inferences (Teets & Wasley, 1996). Because we are interested in how property specific characteristics impact firm specific persistence and predictability, we restrict our analysis to estimating earnings attributes using the model (1) above.
Determinants of Earning Attributes
As discussed above, the drivers of earnings attributes in this study are related to business cycle sensitivity, barriers to entry through differentiation, earnings stability, and resource flexibility. Specific construction of these determinants is discussed directly below.
Business cycle sensitivity measures. We construct two measures of a property’s sensitivity to business cycles. One measure of business cycle sensitivity is constructed as the responsiveness of the property’s revenues to changes in the general economy. We measure this variable, GDP SENSITIVITY, as the slope coefficient, β1i, from a regression of logged changes in total revenue for property i on logged changes in gross domestic profit:
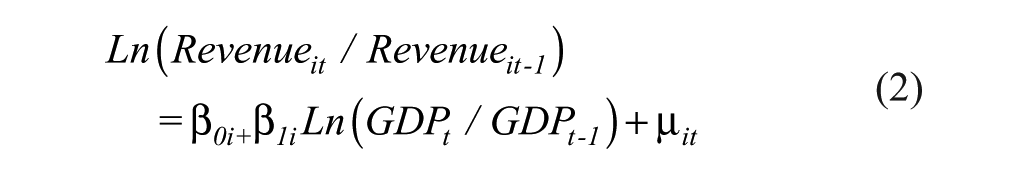
The parameters are estimated for each firm using a time series of observations from the same time interval that is used for estimating the earnings attributes. Properties that are highly sensitive to changes in the general economy should have high measures of β1 whereas properties with low sensitivity to the economy should have low measures. Convention and conference hotels are also sensitive to business travel. Thus, we also include an indicator variable, denoted as CONFERENCE, that takes on the value one if the property is a convention hotel.
Barriers to Entry Through Differentiation
Properties that create a barrier to entry through differentiation should have higher persistence and predictability than those that do not. Somewhat similar to other studies in accounting, we measure differentiation, denoted DIFFERENTIATION, as total marketing expenses less both total marketing compensation and franchise royalty payments. Marketing compensation and franchise royalty payments are excluded to obtain a measure of marketing expense that best captures investment in advertising and reservation systems. 2 As DIFFERENTIATION increases, earnings persistence and predictability should as well.
Stability of Earnings
Properties with more stable earnings are expected to have more persistence and predictable earnings. We use two variables cited in the literature as relating to stability: size and diversification. Size is measured using the number of rooms at the property, and is denoted SIZE. As SIZE increases, we expect earnings to be more stable, leading to higher persistence and predictability. We also expect stability to increase with the diversification of the revenue stream at a property. We construct a measure of the diversification of a property’s revenue, denoted DIVERSIFICATION, by computing a Herfindahl index by subtracting from one the sum of the squared value of each revenue source divided by total revenue. Firms with diversified revenue streams should have higher persistence and predictability than those that do not.
Resource Flexibility
Firms that have difficulty adjusting their resources quickly in response to changes in business activity should have less persistent and predictable earnings. One traditional way to measure resource flexibility is using the firm’s operating cost structure. Firms with a relatively high proportion of fixed costs in their cost structure have high operating leverage. Higher operating leverage indicates that the firm would not be able to adjust resources quickly to changes in activity. We do not have direct measure of operating leverage, as firms do not disclose the behavior of their costs. Following the literature (Banker et al., 2014a) we measure a firm’s sensitivity of operating costs changes to revenue changes using the following model:
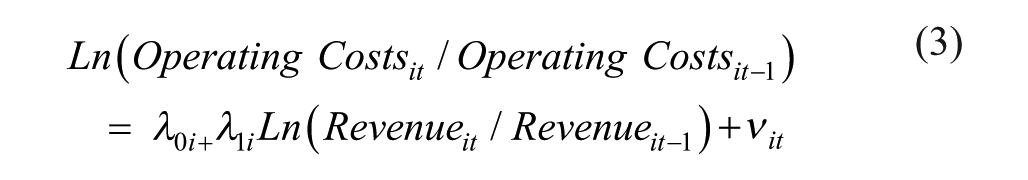
To estimate the parameters in the model, we restrict the estimated coefficient in the property specific model to be between zero and one. The slope λ1, can be interpreted as the ratio of marginal cost to average cost, and if total costs are linear in volume it is also interpreted as the ratio of variable costs to total costs (Banker, Byzalov, & Plehn-Dujowich, 2014; Kallapur & Eldenburg, 2005). In both cases, a greater slope b corresponds to a less rigid short-run cost structure, in which costs change to a greater extent for the same contemporaneous change in sales. Lambda one approximates the portion of variable costs relative to total costs. Firms with a high degree of variable costs should have a λ1 close to one, whereas firms with a high degree of fixed costs should have a λ1 close to zero. Thus we define operating leverage, OPERATING LEVERAGE, as 1-λ1. We expect as operating leverage increases persistence and predictability will decrease.
Labor also has a direct impact on resource flexibility. While over long intervals properties can adjust their workforce for changes in activity, over short intervals this is more difficult. Moreover, two factors making the labor force costs sticky are labor regulations and labor termination costs. Therefore, we also include total labor costs as a percent of revenues, denoted as LABOR INTENSITY, as a measure of resource flexibility. It is expected that as LABOR INTENSITY increases, earnings persistence and predictability decrease.
Table 1 summarizes our expectations concerning the impacts of the independent variables on earnings attributes. As business cyclicality, as measured by CONFERENCE and GDP SENSITIVITY increase, earnings attributes should decrease. As DIFFERENTIATION increases so should persistence and predictability. The same expectation holds for the stability as measured by SIZE and DIVERSIFICATION. Finally, as resource rigidity increases, as measured by LABOR INTENSITY and OPERATING LEVERAGE, persistence and predictability should decrease.
Expected Relationship Between Predictors and Earnings Attributes.
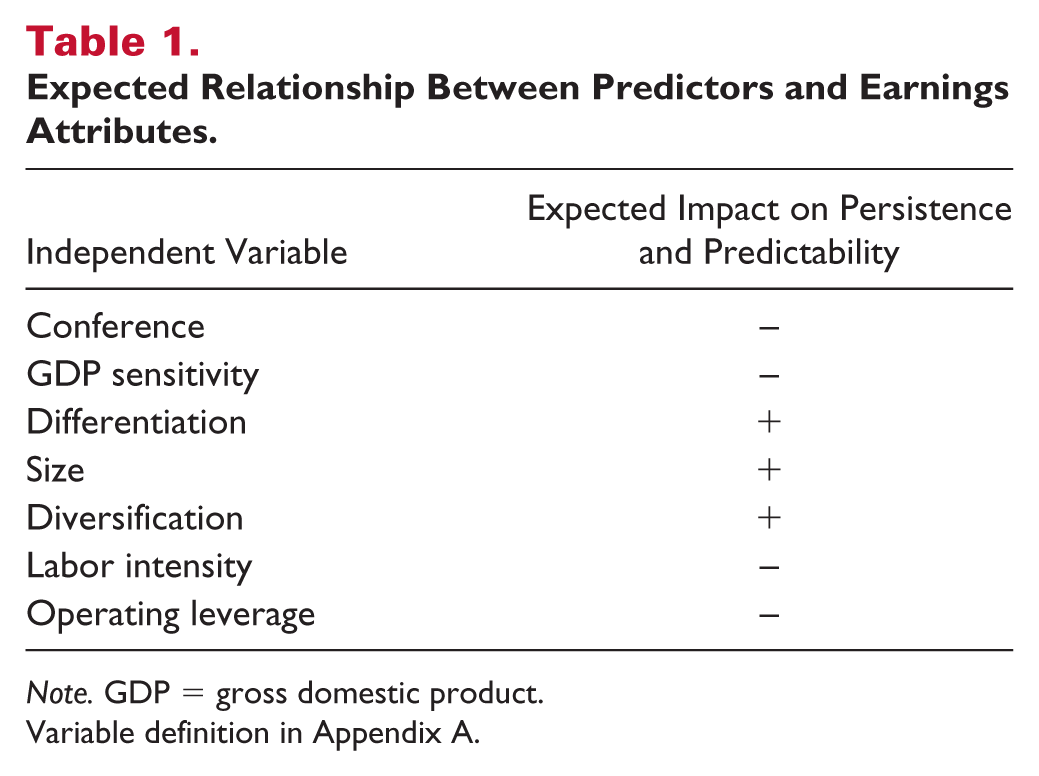
Note. GDP = gross domestic product.
Variable definition in Appendix A.
Results
Preliminaries
Summary univariate statistics for the key variables in the study are provided in Table 2. The average first-order property-level PERSISTENCE is 0.656 when using Income before Nonoperating Income and Expenses as the measure of income. This number can be compared to an the average company level amount of 0.482 reported in Francis et al. (2004) that used earning per share as the earnings measure. Barton et al. (2010) report persistence measures on income metrics ranging from 0.44 based on net income to 0.66 based on EBITDA. The average first-order PREDICTABILITY of 0.444 revealed in Table 2 is quite similar to Barton et al.’s (2010) average of 0.36 (0.43) using operating income (EBITDA). The mean GDP SENSITIVITY of 3.043 indicates that the average property’s revenues vary in percentage terms at about three times the rate of GDP percentage variation. The median DIVERSIFICATION measure indicates that most properties have one primary source of revenues, as a property with a single source of revenues would have a DIVERSIFICATION measure of zero. Interestingly, the mean OPERATING LEVERAGE amount indicates about 52% of a property’s operating costs are fixed. With the exception of CONFERENCE and DIVERSIFICATION, the distribution of each variable seems reasonably symmetric.
Univariate Statistics.
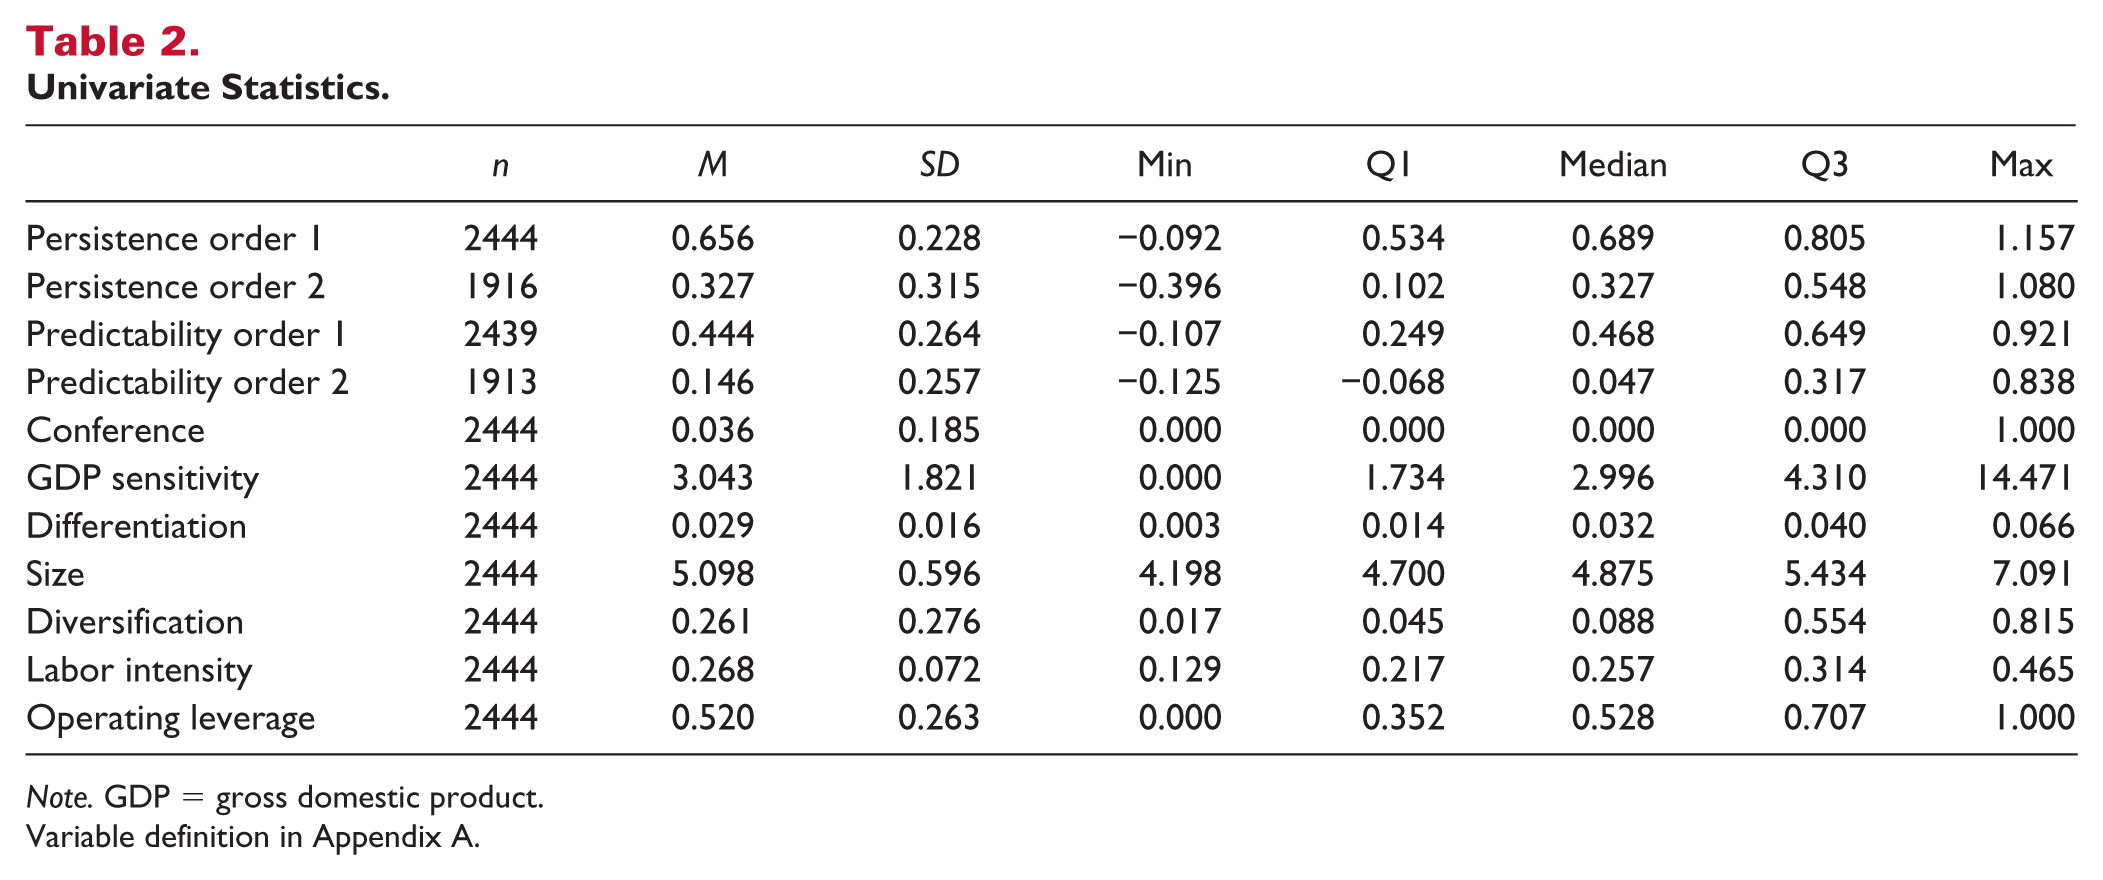
Note. GDP = gross domestic product.
Variable definition in Appendix A.
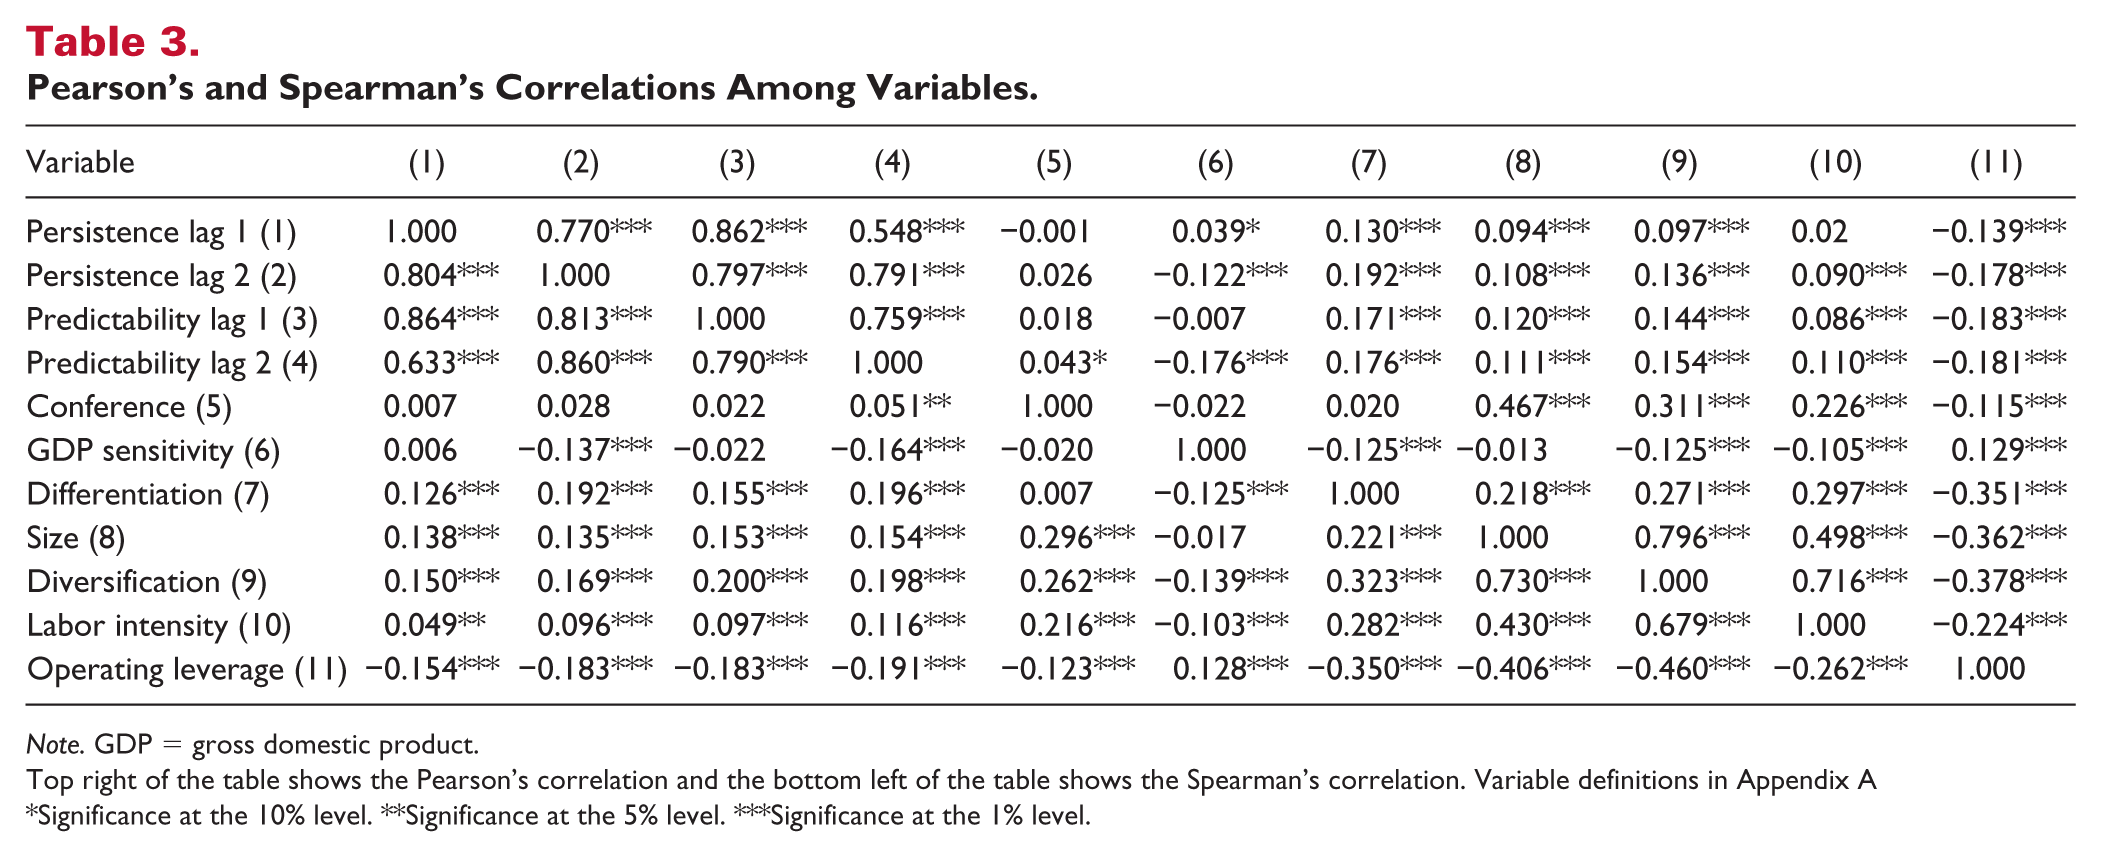
Pairwise correlations of the variables are reported in Table 3. Spearman correlations are displayed below the diagonal, and Pearson above. Glancing down columns 1 and 2 it is evident that for both lags PERSISTENCE and PREDICTABILTY are highly correlated. This is consistent with the finding in Barton et al. (2010) that both earnings attributes load on one factor that they claim is indicative of sustainable earnings. The correlations also reveal that are number of the determinants are related to PERSISTENCE in the direction that is expected. Moreover, some predictors are more strongly associated with second-order metrics for PERSISTENCE and PREDICTABILTY, than with the first-order measure, most notably, DIVERSIFICATION and OPERATING LEVERAGE. Because many of the predictors are correlated, the incremental impact of predictor on persistence and predictability is unclear. Note, for instance, that SIZE is closely related to DIVERSIFICATION and LABOR INTENSITY. Moreover, OPERATING LEVERAGE is negatively related to many of the other predictors.
Pearson’s and Spearman’s Correlations Among Variables.
Note. GDP = gross domestic product.
Top right of the table shows the Pearson’s correlation and the bottom left of the table shows the Spearman’s correlation. Variable definitions in Appendix A
Significance at the 10% level. **Significance at the 5% level. ***Significance at the 1% level.
Regression Results
To examine the impact of the predictors on earnings persistence and predictability, we use the following cross-sectional ordinary least squares (OLS) regression to estimate the parameters of the model. We then assess the significance of the estimated parameters with robust OLS standard errors. The estimated model for any earnings attribute (EA) is,
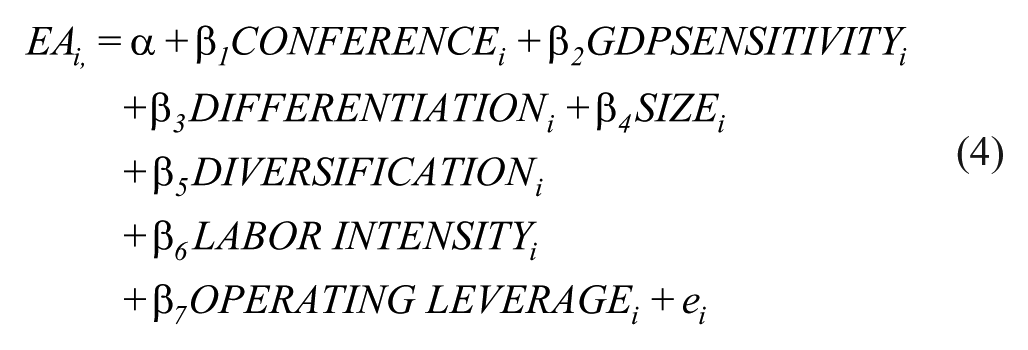
To insure that the parameter estimates are not determined by a few influential observations, we exclude observations that exceed three or more of the cutoffs identified in Belsley, Kuh, and Welsch (2005). The estimated parameters are displayed in Table 4.
Regression Results Relating Determinants to Earnings Attributes (Earnings = Income Before Nonoperating Income and Expenses).
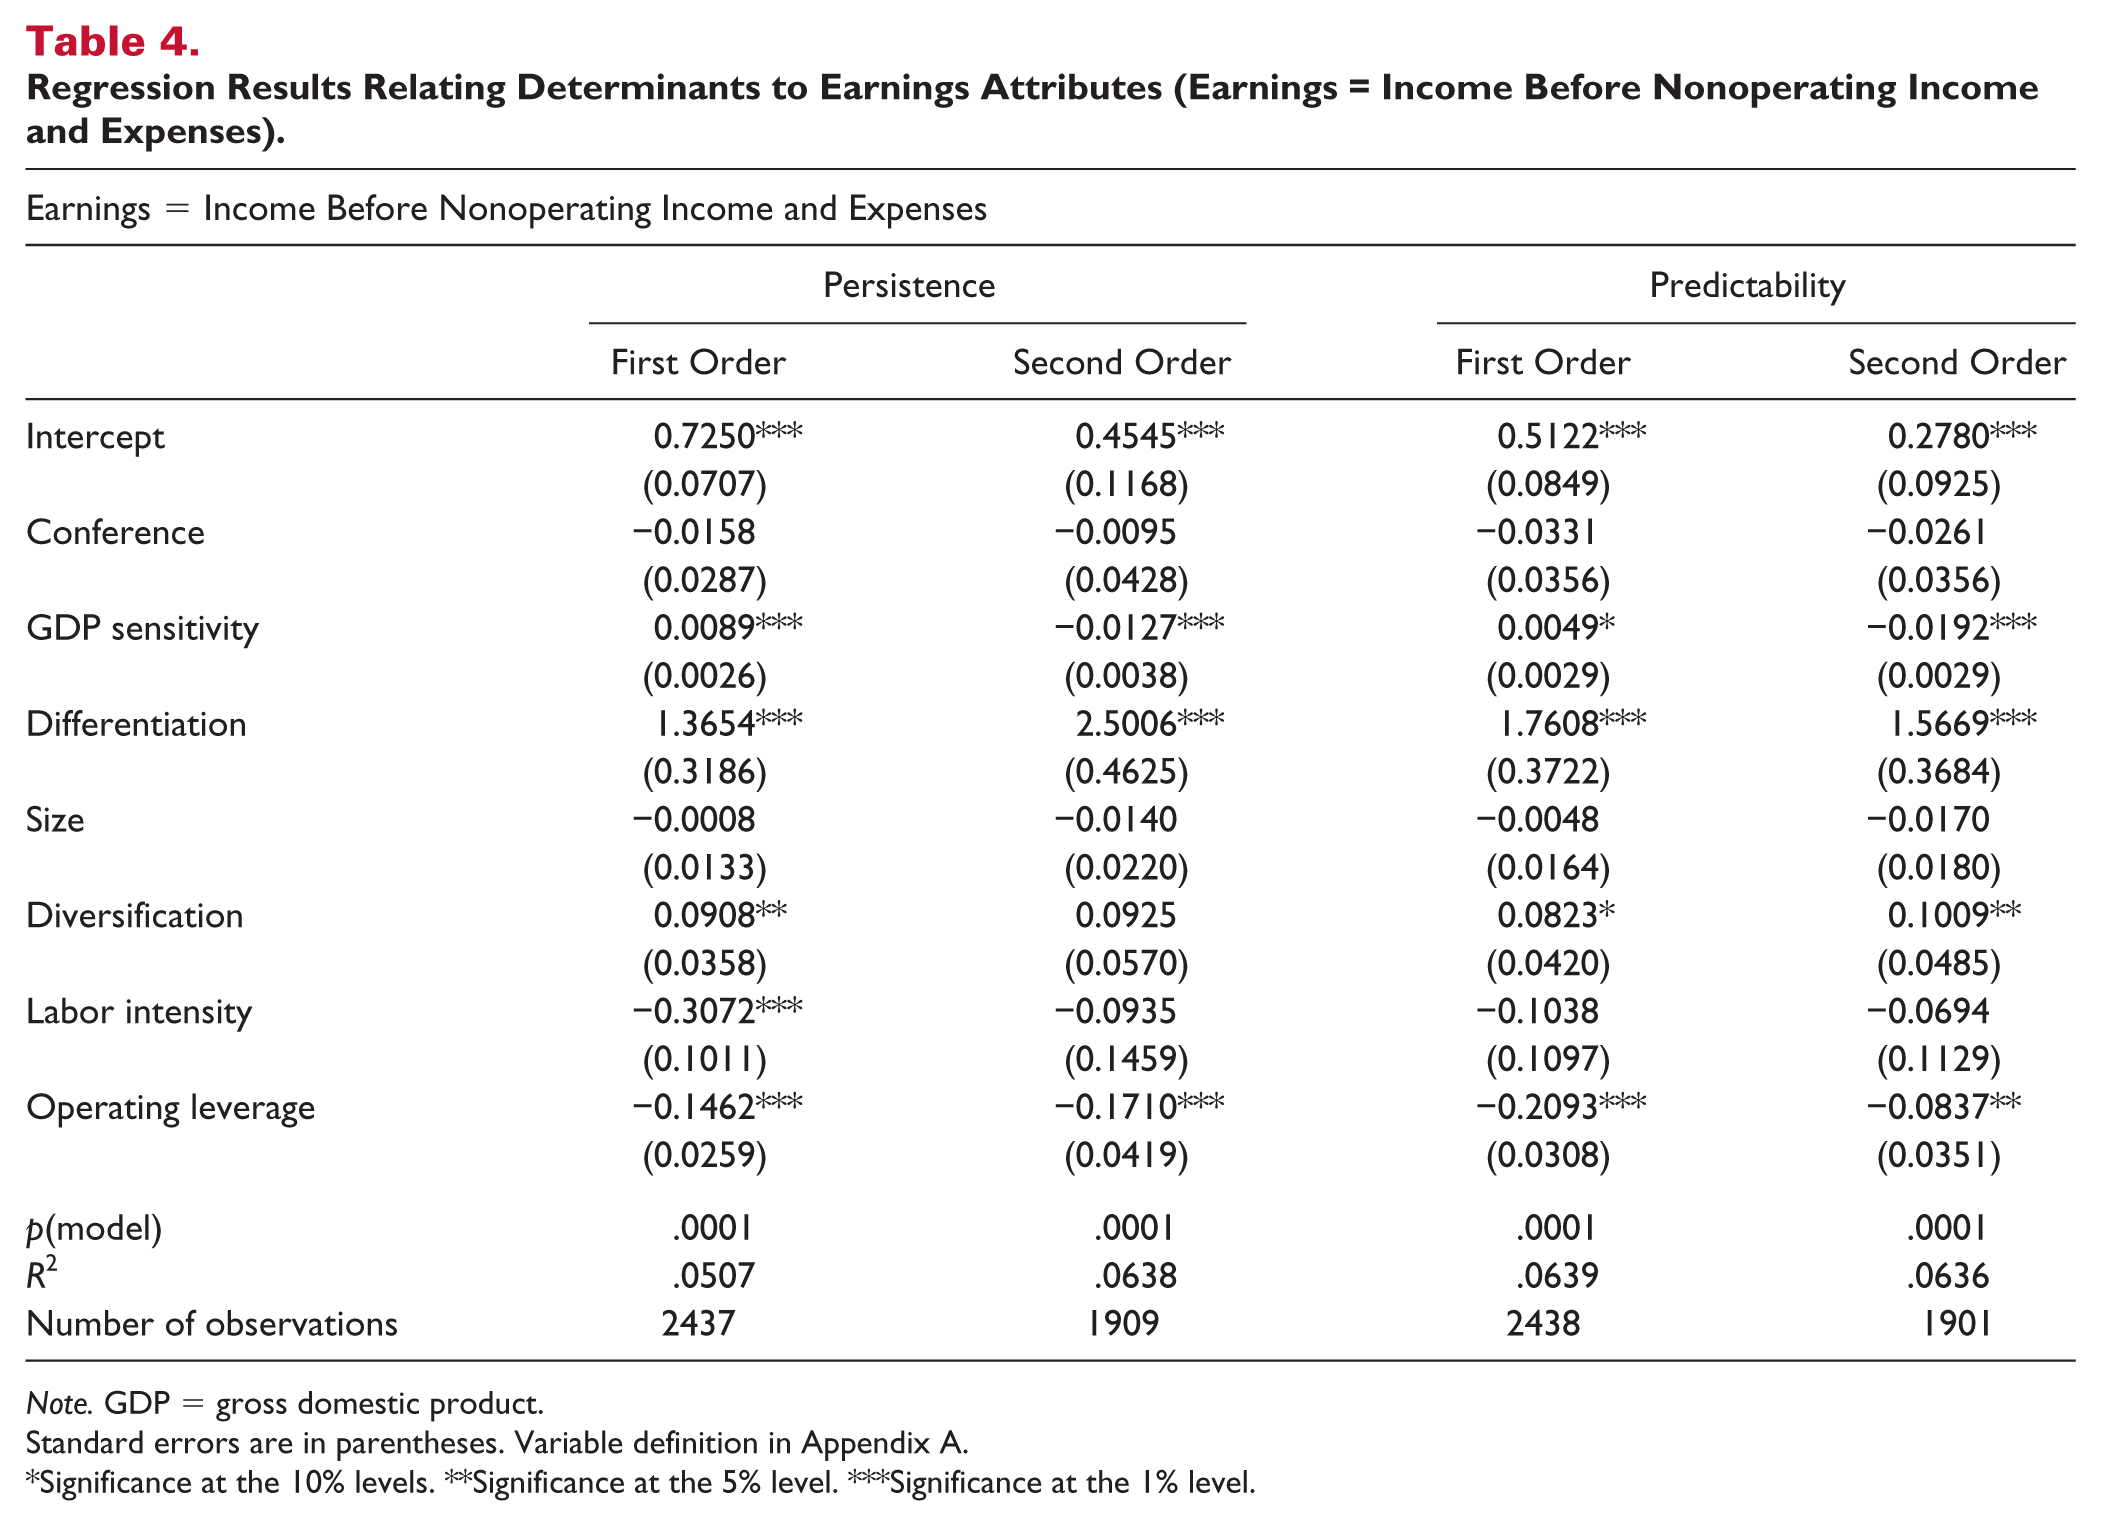
Note. GDP = gross domestic product.
Standard errors are in parentheses. Variable definition in Appendix A.
Significance at the 10% levels. **Significance at the 5% level. ***Significance at the 1% level.
With respect to business cycle sensitivity, we find little relation between earnings attributes and CONFERENCE. However, the earnings attributes are related to GDP SENSITIVITY. The first-order earnings attributes are positively impacted by GDP SENSIVITITY, which is counter to our expectations. The second-order impacts are negative, which is more in line with our expectations. Barriers to entry as measured by DIFFERENTIATION have a strong positive impact on all earnings attributes. Moreover, the impact is even greater for the second-order measure of persistence. With respect to the stability of earnings measures, there is little relation between property size, SIZE, and earnings attributes. However, DIVERSIFICATION is positively related to the earnings attributes and significantly so in most of the models. Finally, the earnings attributes are significantly affected by the flexibility of resources. As LABOR INTENSITY increases, earnings attributes decrease, but only significantly so in the first-order persistence model. However, OPERATING LEVERAGE has a strong and significantly negative impact on all of the earnings attributes.
Sensitivity of Results to Alternative Measures of Earnings and Other Determinants
While operating income before nonoperating income and expenses is believed to be the best measure of operating earnings for a property, we also examine the relation between the determinants and two alternative measures of property-level earnings, gross operating profit, and EBITDA. Gross operating profit is a traditional measure of profitability, and only differs from our primary measure due to management fees. Gross operating profit is often used as an input in the incentive component of the management fee, and would be equal to our primary measure in the absence of a management contract. EBITDA, however, is a primary measure used in property valuation and credit assessment, as it is computed after taking into account noncontrollable, but cash related, expenses such as rent, property tax and insurance.
The results for these measures are reported in Table 5 for gross operating profit and Table 6 for EBITDA. Because most of the results are similar to those reported in Table 4, we only focus on the primary differences. One of the differences is that SIZE is significantly negatively related to the EBITDA earnings attributes. Therefore, rather than property size positively affecting persistence and predictability after controlling for other predictors, it has a surprising negative effect. LABOR INTENSITY also has a significant negative effect on EBITDA persistence, even in the second-order estimated model. Finally, OPERATING LEVERAGE has a significant but smaller effect on EBITDA earnings attributes than it had on the other earnings numbers, namely gross operating profit and income before nonoperating income and expense.
Regression Results Relating Determinants to Earnings Attributes (Earnings = Gross Operating Profit).

Notes. GDP = gross domestic product.
Standard errors are in parentheses. Variable definition in Appendix A.
Significance at the 10% levels. **Significance at the 5% levels. ***Significance at the 1% levels.
Regression Results Relating Determinants to Earnings Attributes (Earnings = EBITDA).
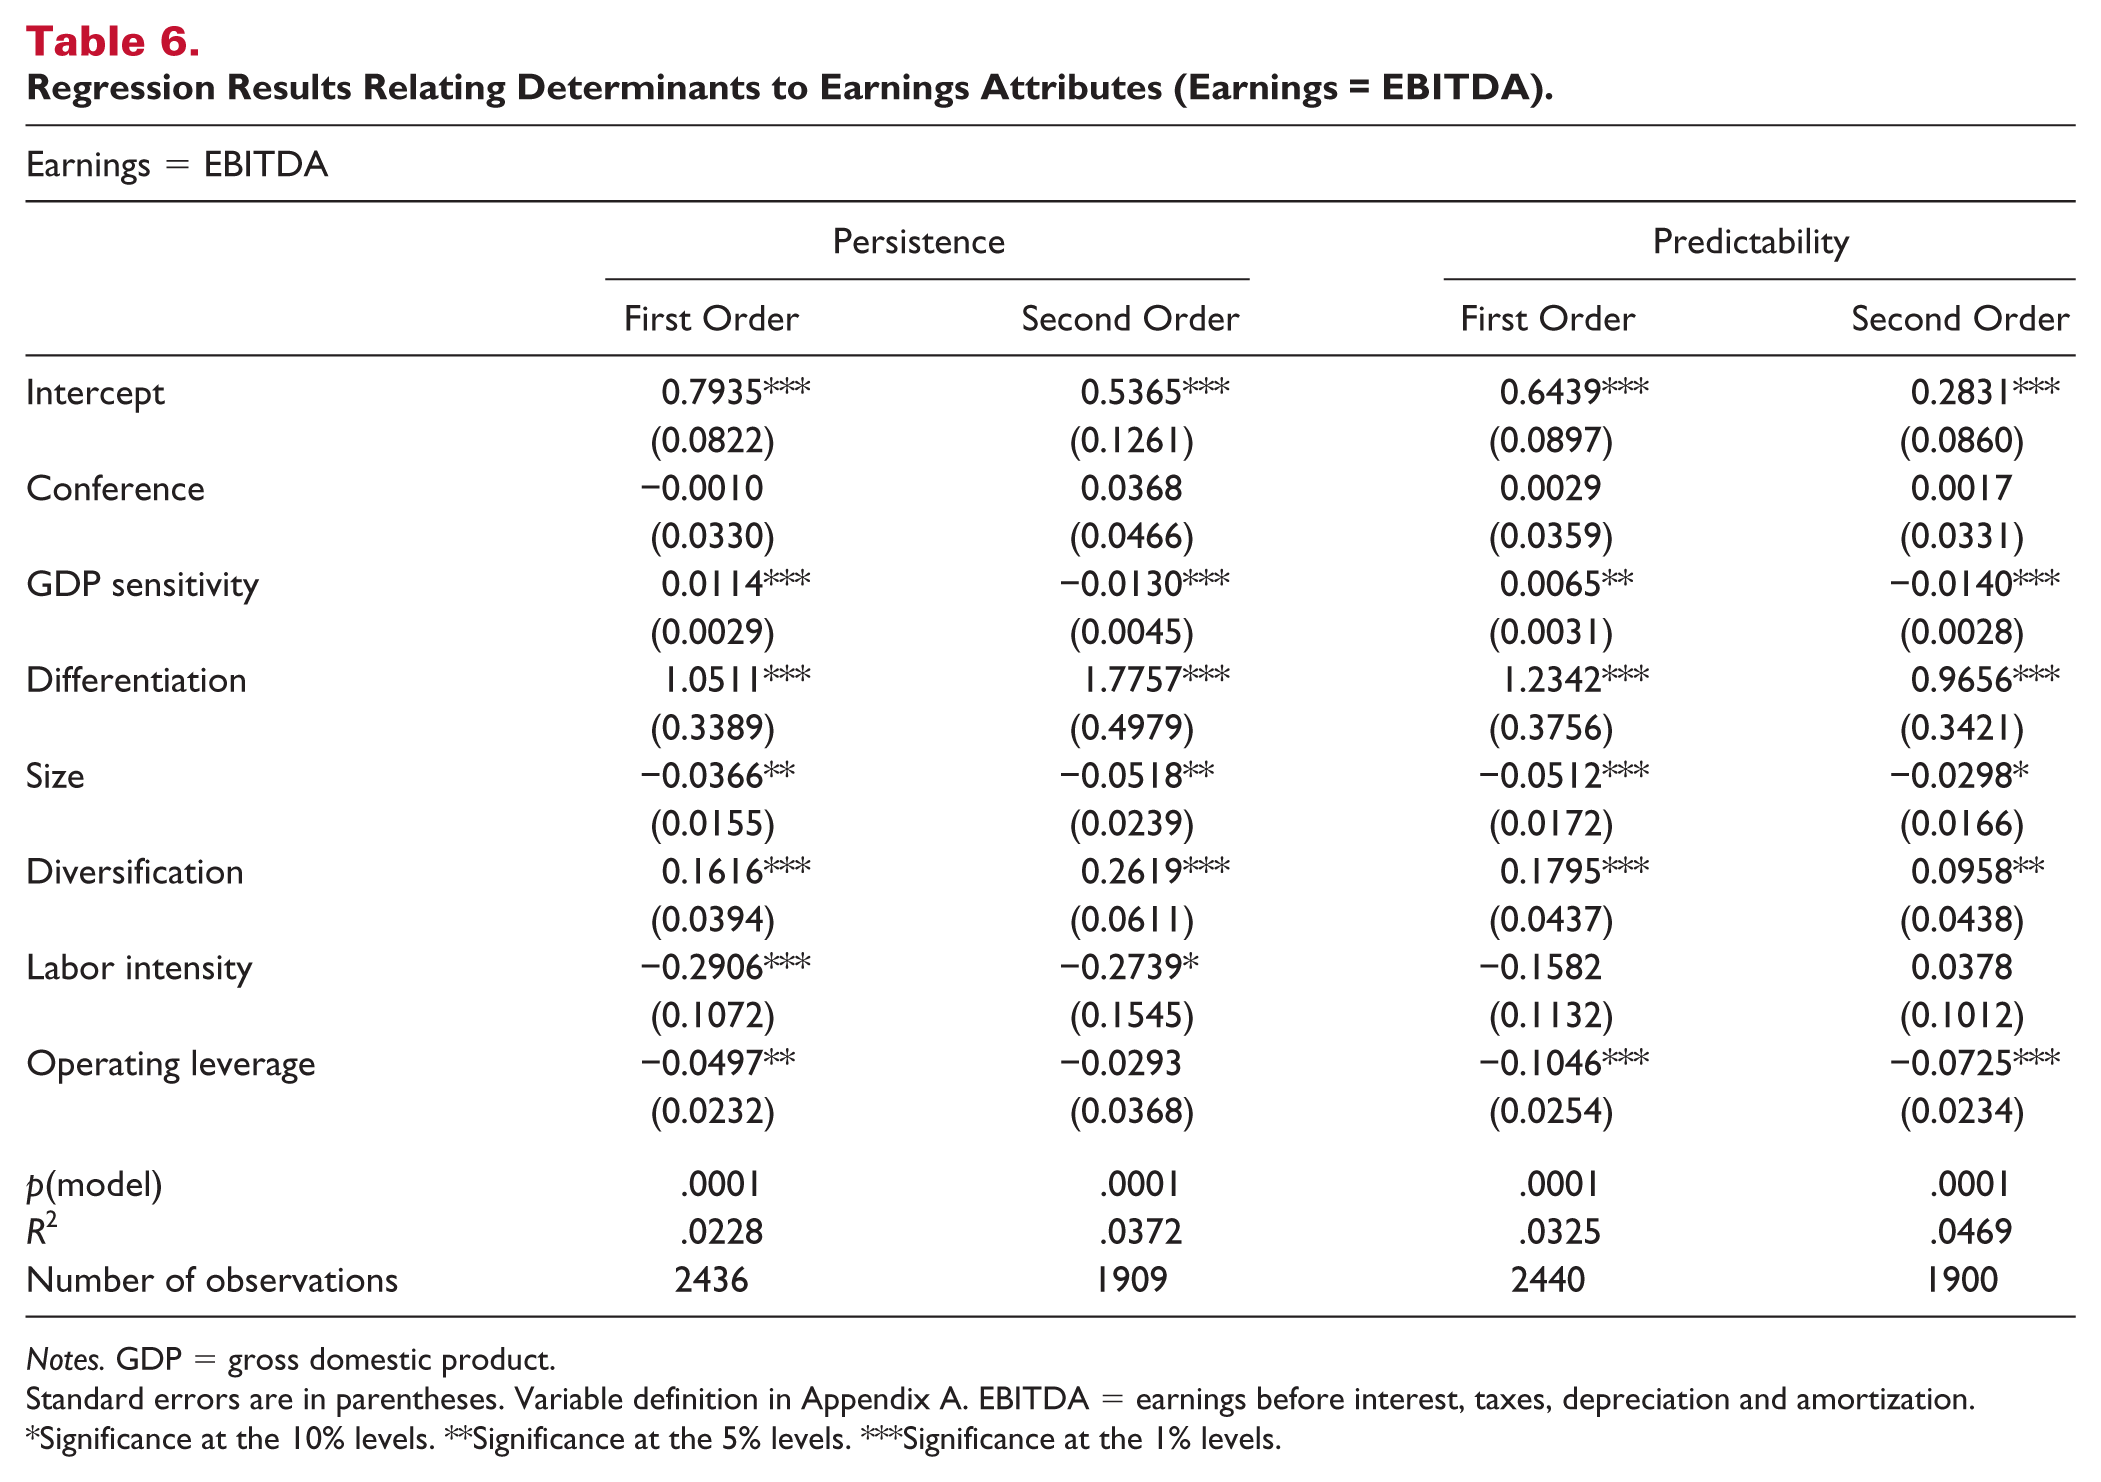
Notes. GDP = gross domestic product.
Standard errors are in parentheses. Variable definition in Appendix A. EBITDA = earnings before interest, taxes, depreciation and amortization.
Significance at the 10% levels. **Significance at the 5% levels. ***Significance at the 1% levels.
We also examined the impact of other determinants on the earnings attributes. The literature has generally found that firms with a loss have significantly lower persistence and predictability. About 1% of our sample observations experienced losses, and removing them had little effect on our results. We also controlled for economic segment by examining the impact of average daily rate and wealth demographics, measured by a location’s per capita income, and found little difference.
Summary of Empirical Findings
The results indication a number of property-level factors impact the earnings attributes of persistence and predictability. Similar to many prior findings in accounting at the firm level, we find that properties that differentiate their property have higher earnings persistence and predictability than those that do not. Moreover, the impact of differentiation on earnings persistence is not limited to 1 year, the positive impact remains at least over a 2-year period. This latter finding is similar to a number of studies such as Lev (1983) and Banker, Mashruwala, and Tripathy (2014b) that find that the differentiation impacts on earnings properties extend to multiple years, a finding first reported in Stigler (1963).
Another principal finding concerns the impact of stability on the earnings attributes. The results indicate that property size has little impact on the properties of earnings measured in this article, except for the negative impact of size on EBITDA earnings attributes. This finding is consistent with the accounting literature that finds no impact of size [Baginski et al., 1999; Lev, 1983]but not with the findings of a positive impact [Baginski et al., 1993, Francis et al., 2004, Frankel & Litov, 2009]. We do find a positive relation between revenue diversification, another measure of stability, and earnings persistence and predictability. We are not aware of any prior literature relating this measure to the earnings attributes measured in this article.
Perhaps the most interesting findings relate to resource flexibility. Prior studies in accounting have related capital intensity to earnings attributes at the corporate level. These studies generally document a positive link between measures of capital intensity, such as depreciation expense to revenue (Baginski et al., 1999; Lev, 1983) or net property and equipment to assets (Francis et al., 2004), and earnings persistence or predictability. In the current study, the earnings numbers we are examining are not directly affected by depreciation expense, as we are focusing on operating earnings at the property level before depreciation. Thus, we use different measures of resource flexibility: a direct measure of operating leverage and an employment intensity measure. We find a strong relation between operating leverage and the earnings attributes. Both persistence and predictability are significantly negatively related to operating leverage. Labor intensity also dampens persistence and predictability, but is only significant for the first-order persistence measure. We are unaware of any studies relating these determinants to persistence and predictability.
Finally, we find no consistent relationship relation between property-specific earnings attributes and business cyclicality. Business properties have little relation to earnings attributes. Perhaps more surprising, property’s sensitivity to business activity as measured by GDP sensitivity, alternates from significantly positive to significantly negative over the two different time lags.
Caveats
Our study is not without limitations. One issue concerns the period used to measure both the earnings attributes and the determinants. In our study, both sets of measures are from the same period, thus it is possible some underlying events is driving both sets of measures. While this is similar to many of the studies in accounting, an alternative approach would be to measure the determinants in an earlier period. This, however, would require a rather lengthy measurement period, and an assumption that the property does not change any processes between the two periods. One possible way around this would be to measure the determinants in the first stage, and then conduct a cross-sectional analysis in the second stage to limit the chance of properties changing their processes. However, as we mentioned above, cross-sectional and firm-specific estimation procedures generally do not lead to the same inferences (Teets & Wasley, 1996).
A second issue concerns reverse causality. In this article, we treat the property’s cost structure, differentiation strategy and earnings stability as being exogenously determined. It is possible that firms determine their cost structure, as well as degree of differentiation and stability, in light of their desired earning persistence and predictability. We view this possibility as a rich avenue for future research. With respect to resource flexibility, the accounting literature is just beginning to understand how firms determine their cost structures (Banker, Byzalov, & Plehn-Dujowich, 2014a; Holzhacker et al., 2015).
Concluding Comments
Although accounting earnings are used extensively in the lodging industry for the purposes of incentive contracting, credit assessment and valuation, we know little about the attributes of lodging properties’ accounting earnings and their determinants. Two important attributes of accounting earnings are persistence and predictability, which together Barton et al. (2010) identify as key components of sustainable earnings. In this study, we examine a sample for lodging properties over a lengthy time period to investigate the property-specific determinants of the persistence and predictability of lodging properties’ earnings. We find that barriers to entry, measured by the relative amount of marketing expenditures, have a positive impact on these earnings attributes. We also find that revenue diversification has a positive effect on these attributes, presumably through its impact on earnings stability. Finally, we find that resource rigidity, as measured by operating leverage and labor intensity, had a consistent dampening impact on persistence and predictability.
Footnotes
Appendix
Our principal results, which are presented in Table 4, use Income Before Nonoperating Income and Expenses as the annual earnings measure to estimate persistence and predictability. We also report results using Gross Operating Profit, and alternatively, EBITDA, as the annual earnings measure in Table 5 and Table 6.
Declaration of Conflicting Interests
The author(s) declared no potential conflicts of interest with respect to the research, authorship, or publication of this article.
Funding
The author(s) received no financial support for the research, authorship, or publication of this article.