
Abstract
Due to service product characteristics and a mix of complex sales, it is crucial for hotel firms to efficiently design limited physical spaces that serve multiple purposes to optimize revenue and maximize profit. Since luxury hotel properties have different operation strategies than limited-service hotels, their operational efficiency should be a reference during strategic decision-making processes. Primary research purpose is to identify the most efficient operation model for luxury hotel properties. The study computed operation efficiency scores using the data envelopment analysis approach to rank the property efficiency of 37 fully equipped luxury hotels in the United States. Each property can utilize slack analysis to discover a strategic benchmarking company (best efficient frontier) and intuitive strategic recommendations and gain superior input and output productivity. Tobit model analysis provides supplemental understandings regarding the additional operational factors impacting luxury hotel properties’ efficiency score variations. Operating efficiency was found to be achieved by multiple operating inputs and influenced by relative price, fixed costs, and management systems. Theoretical comprehensiveness of luxury service mix has been empirically tested by highlighting efficiency as a key measure. In addition, RevPAR’s ratio on TRevPAR further highlights the importance for luxury hotels to increase non-room sales and revenues to accomplish efficiency.
Keywords
Introduction
Even amid the worldwide COVID-19 pandemic, the global luxury hotel market is expected to reach US$209.3 billion by 2027 by developing at a compound annual growth rate of 2.6% between 2020 and 2027 (Research and Markets, 2020). Luxury hotels have unique operational characteristics, including higher staff–customer ratios, customized person-to-person interactions, and diverse amenities and service products within limited spaces and floorplans (Chathoth, 2007). To be successful in the current competitive hospitality market and enhance hotel performance, luxury hotels must increase operational efficiency and offer profitable services (Research and Markets, 2020).
Since total sales and revenues earned from the sale of goods, products, and merchandise are indicators of business success, multiple approaches to maximize them within business operations have been widely tested. For example, sales mix is a critical business success factor and a fundamental component of hospitality industry marketing plans (Quain, 1992; Thielin, 2020). Sales mix is the relative proportion of sold hotel products or services (Quain, 1992), and since hotel products or services maintain varying degrees of profitability, it is an essential consideration. Moreover, profitability is a significant proxy of overall business operations productivity and efficiency (Higuerey et al., 2020; Rosario & Chavali, 2019) because productivity and efficiency levels differ based on the provided service sales mix. Thus, efficient operation protocols are crucial for firms to maximize profits. However, scant research explores how luxury hotel companies’ sales mix diverges from non-luxury hotel firms in terms of revenue optimization and profit maximization.
To study luxury hotel business efficiency and profitability, the Expectation–Confirmation Theory (ECT), which predicts the trajectory of various guest expectations on luxury options, can properly analyze consumer satisfaction and their (re)visit intention (e.g., Knutson et al., 1993; Walls et al., 2011). Guests form initial expectations about luxury hotel products or services prior to the visit or purchase (Wiedmann et al., 2009). Previous literature found that such expectations can stem from many causes, including an individuals’ previous purchases and visiting experiences, motivation and desire for the purchase, attitude to a particular product or service, and detailed information about products or services from personal and commercial communications (Hossain & Quaddus, 2012). The information available regarding luxury hotel products and services’ differentiates guests’ basic expectations of quality, type, and anticipated price range (Valvi & West, 2013; Walls et al., 2011).
According to Resource-Based Theory (Wernerfelt, 1984), a firm’s unique resources can provide competitive advantages. Under this perspective, management often analyzes optimum sales mix because it directly affects the company’s breakeven point and profitability. Depending on the sales mix or the ratio of low-cost products to high-cost products carried by a business, the breakeven point may be high or low. However, low-cost services and high-cost services cannot be physically defined since service products (e.g., hotel services) are not tangible forms of inventory.
Due to service products’ perishability and intangibility, sales mix optimization for revenue management is critical for business efficiency. However, bias exists for hotels that simultaneously offer physical products (rooms) and service products toward room-based revenue management strategies (Zheng & Forgacs, 2017). Therefore, hotels must refine these traditional approaches to prioritize hotels’ profitability and business efficiency according to customers’ preferences during their stay (Collins & Parsa, 2006; Hung et al., 2010). Although revenue optimization is a key priority for hotels, room-centric revenue management is insufficient to achieve financial goals based on customer-driven market trends, demand-driven pricing strategies, and sales mix design (Zheng & Forgacs, 2017). Given that hotel firms must ensure profitability and efficiency, this study focuses on two different approaches for performance measures.
Market segmentation is an essential component to designing a hotel firm’s sales mix. Different target customers have distinct sets of needs and desires; hence, firms that target a specific market segment must maximize resource utility with the most efficient business model to provide customers’ best value. The foundation of business characteristics is also an important consideration during sales mix development. In terms of operational attributes, luxury hotels have higher staff–customer ratios, diverse amenities and service products, and customized person-to-person interactions compared to non-luxury hotels (Chathoth, 2007). Therefore, full-service hotel guests value amenity and feature heterogeneity during a stay, whereas limited-service hotel guests are more sensitive toward room prices (Tanford et al., 2012).
Efficiently designing limited physical spaces that hosts multiple revenue generating units and functions for revenue optimization and profit maximization is crucial for hotel properties. Therefore, Given that luxury hotel guests expect high-quality services with various amenities and service products, luxury hotels must have different operational efficiency strategies than limited-service hotels (Tanford et al., 2012). Luxury hotel efficiency is a critical strategic component to gain a competitive market advantage, and the measure of efficiency assesses the hotel firm’s ability to attain output(s) (e.g., sales revenue and profitability) with the minimum level of inputs (e.g., cost and expense). For example, designing limited physical spaces to provide multiple optimized revenue-generating units and functions can impact profit maximization. Therefore, hotel firms should augment the functional capabilities of the property’s spatial resources (e.g., rooms, common spaces, F&B outlets, and spas). Since efficiency is an operational maximization measure of utility for each resource and enables hotel firms to generate optimal business performance, it should be a reference point in decision-making, the basis of any improvement, and the benchmark for resource allocation.
Benchmarking against the best performers in the same hotel market segment provides valuable intel to improve effectiveness. Performance evaluation is another essential feedback loop to gain a competitive advantage in the global market (Cooper et al., 2000). Revenue per Available Room (RevPAR) is a widely acknowledged standard performance measure for hotel firms (S. Lee et al., 2019). The emphasis on hotel room division as the primary revenue source makes RevPAR the most relevant property-level performance measure across all types of hotels. However, RevPAR is not a perfect measure to indicate business efficiency and profitability. Prior studies (e.g., Brown & Dev, 1999; S. Lee et al., 2019; Schwartz et al., 2017) argued the RevPAR’s inadequacies and necessitated accurate performance measures to determine profitability and efficiency for the lodging business. Studies should simultaneously consider sales revenues, costs, and expenses to ascertain profitability and efficiency. Property-level business efficiency should entail a holistic analysis that includes multiple revenue sources, and RevPAR ignores these other revenue sources, such as the costs and expenses associated with sales. Since luxury hotel firms rely on numerous revenue sources beyond room sales (Maier & Roberts, 2018), performance measurements should consider every revenue-generating sales unit’s margin contributions. Therefore, focusing solely on room revenue does not comprehensively provide analysis concerning a hotel property’s profitability and operational efficiency.
Appraising a luxury hotel firm’s unique sales mix will fill these research gaps and provide proper financial performance measures. Therefore, this study’s primary purpose is to identify the most efficient luxury hotel property operation models. To do so, examining optimal business models based on profitability and productivity is paramount for determining proper efficiency measures. In addition, performance evaluation and benchmarking positive business models establish luxury hotel redesign and improvement measures for market competition. Efficiency is a central term in assessing and measuring performance, and it is a necessary condition for the organization’s competitive advantage. To fulfill these research gaps, this study’s objectives are to determine (a) how luxury hotel properties determine their comparative operational efficiency, (b) how they utilize operational efficiency information to establish an ideal benchmarking business model, and (c) what operational factors affect luxury hotel efficiency scores.
This exploratory study proposes that data envelopment analysis (DEA) is a valuable tool for measuring luxury hotel firms’ efficiency and identifying inefficiency causes. Therefore, the study employed DEA with robust regression analysis to find the optimal benchmark business model in the luxury hotel market. A performance summary publication is possible after measuring multiple inputs and outputs with proportional improvements in all performance dimensions and comparing each decision-making unit (luxury hotel firms) with an efficient frontier (leading competitive performer), which ultimately helps firms strategize business operations (Lado-Sestayo & Fernández-Castro, 2019). Based on these objectives, this study will provide practical implications for luxury hotel firms’ marketing strategies.
Literature Review and Research Background
Luxury Services in the Lodging Industry
According to Cornell (2002), luxury is difficult to define clearly. Luxury’s nebulous definition occurs because the concept carries personalized interpretations (Wiedmann et al., 2009). Marketers use the word luxury to persuade consumers to purchase particular product tiers at premium prices (Yang & Mattila, 2016). Veblen (1899) argues that people purchase expensive (e.g., luxury) products to show their financial power and obtain social status. Recent luxury studies extended this view by identifying other values. For instance, Vigneron and Johnson (2004) proposed five factors (e.g., perceived extended self, perceived hedonism, perceived conspicuousness, perceived uniqueness, and perceived quality) to explain a luxury customer’s decision-making process. These five perception factors indicate that the luxury market depends on the feelings, subjective experiences, and perceptions of customers who experience the concept of luxury (Wiedmann et al., 2009). In addition, an individual’s attitude toward the notion of luxury and luxury brands may vary significantly (Dubois et al., 2001). Hence, luxury hotels should develop their variety of services and products by relying on a thorough understanding of customer perspectives and needs.
The hospitality industry defines luxury hotel services as high quality, expensive, and non-essential products and services; these hospitality experiences appear rare, exclusive, prestigious, authentic, and offer high levels of symbolic and emotional/hedonic values (Tynan et al., 2010). Consequently, the concept of luxury and the luxury market are highly dynamic. Because customers have increasing demands, conceptual changes are transitory, rather than static, and constantly move (Strehlau, 2013). Ultimately, luxury customers believe that excellence, creativity, and exclusivity are critical factors in the luxury hotel segment (Cristini et al., 2017). Thus, luxury hotels must provide added value to constitute luxury and various opportunities beyond room accommodations (Bernstein, 1999) if a luxury hotel wants to maximize revenues and remain in the luxury segment. However, multiple luxury hotel dimensions may create poor, unoptimized competitive conditions (Anderson et al., 2000). In addition, a high level of market competition necessitates marketing and management strategies that focus on profitability and efficiency (Deng et al., 2019). However, prior luxury research focused on identifying luxury consumption behavior antecedents without empirical testing (Yang & Mattila, 2016). Therefore, the intense competition among luxury hotel brands is related to comprehensive products and services (Pohland & Kesgin, 2018).
According to resource-based theory (Wernerfelt, 1984), resources provide organizations with opportunities to develop a competitive edge. Resources and capabilities are the foundation of long-term strategic assets in competitive business industries (Grant, 1991). Specifically, resource-based theory highlights that resources provide organizations with beneficial opportunities to develop competitive market advantages (Wernerfelt, 1984). In the hotel industry, additional resources (e.g., spa, golf club, aesthetic) creates added value for customers, which may increase revenue. For example, service diversification and additional resources (e.g., spa, golf club, aesthetic) increase profits and market shares (Chen & Chang, 2012), yield stable returns (M. J. Lee & Jang, 2007), and improve performance (Pandya & Rao, 1998).
Carefully planned strategies and specified approaches are still needed depending on the hotel segment, especially in diversified luxury hotels (Bowman, 1980; Kim et al., 2020). Kim et al. (2020) analyzed 700 properties across the nation to affirm the operational differences between luxury and non-luxury hotel properties regarding (a) classic lodging performance metrics (occupancy, ADR, RevPAR, and total revenue per available room [TRevPAR]), (b) room revenue percentage from total revenues, (c) sales mix with six different revenue sources (rooms, food, beverage, golf, spa, others), and (d) RevPAR to TRevPAR rate. The study includes 276 properties in the luxury hotel category, and it concludes that luxury hotels have more revenue sources than non-luxury hotels. Moreover, luxury hotels generate 35% of their total revenue from non-room sectors, whereas non-luxury hotels achieve 95% of their total revenue from room sales. Revenue ratios from five different sources (room, food, beverage, spa, and others except for golf) and total revenue significantly differ between luxury hotels and non-luxury hotels. These results indicate that luxury hotels need sophisticated revenue management strategies to reflect their characteristics. In particular, luxury hotels should establish revenue management to oversee multiple revenue sources and find the most efficient, optimized, and profitable mix to maximize revenue (Kim et al., 2020).
Performance Measures in the Lodging Industry
Previous hospitality literature focused on hotel revenue management measures to enhance financial performance, including pricing strategy, demand forecasting, inventory allocation, technical or managerial practices, and impact factors of hotel revenue management (Xu et al., 2019). Well-organized hotel revenue management positively impacts financial performance, strengthens customer relationships, and optimizes operations (Altin et al., 2017). Table 1 shows that financial performance plays a critical role in evaluating a hotel’s revenue management.
Review of Lodging Industry Performance Measures.
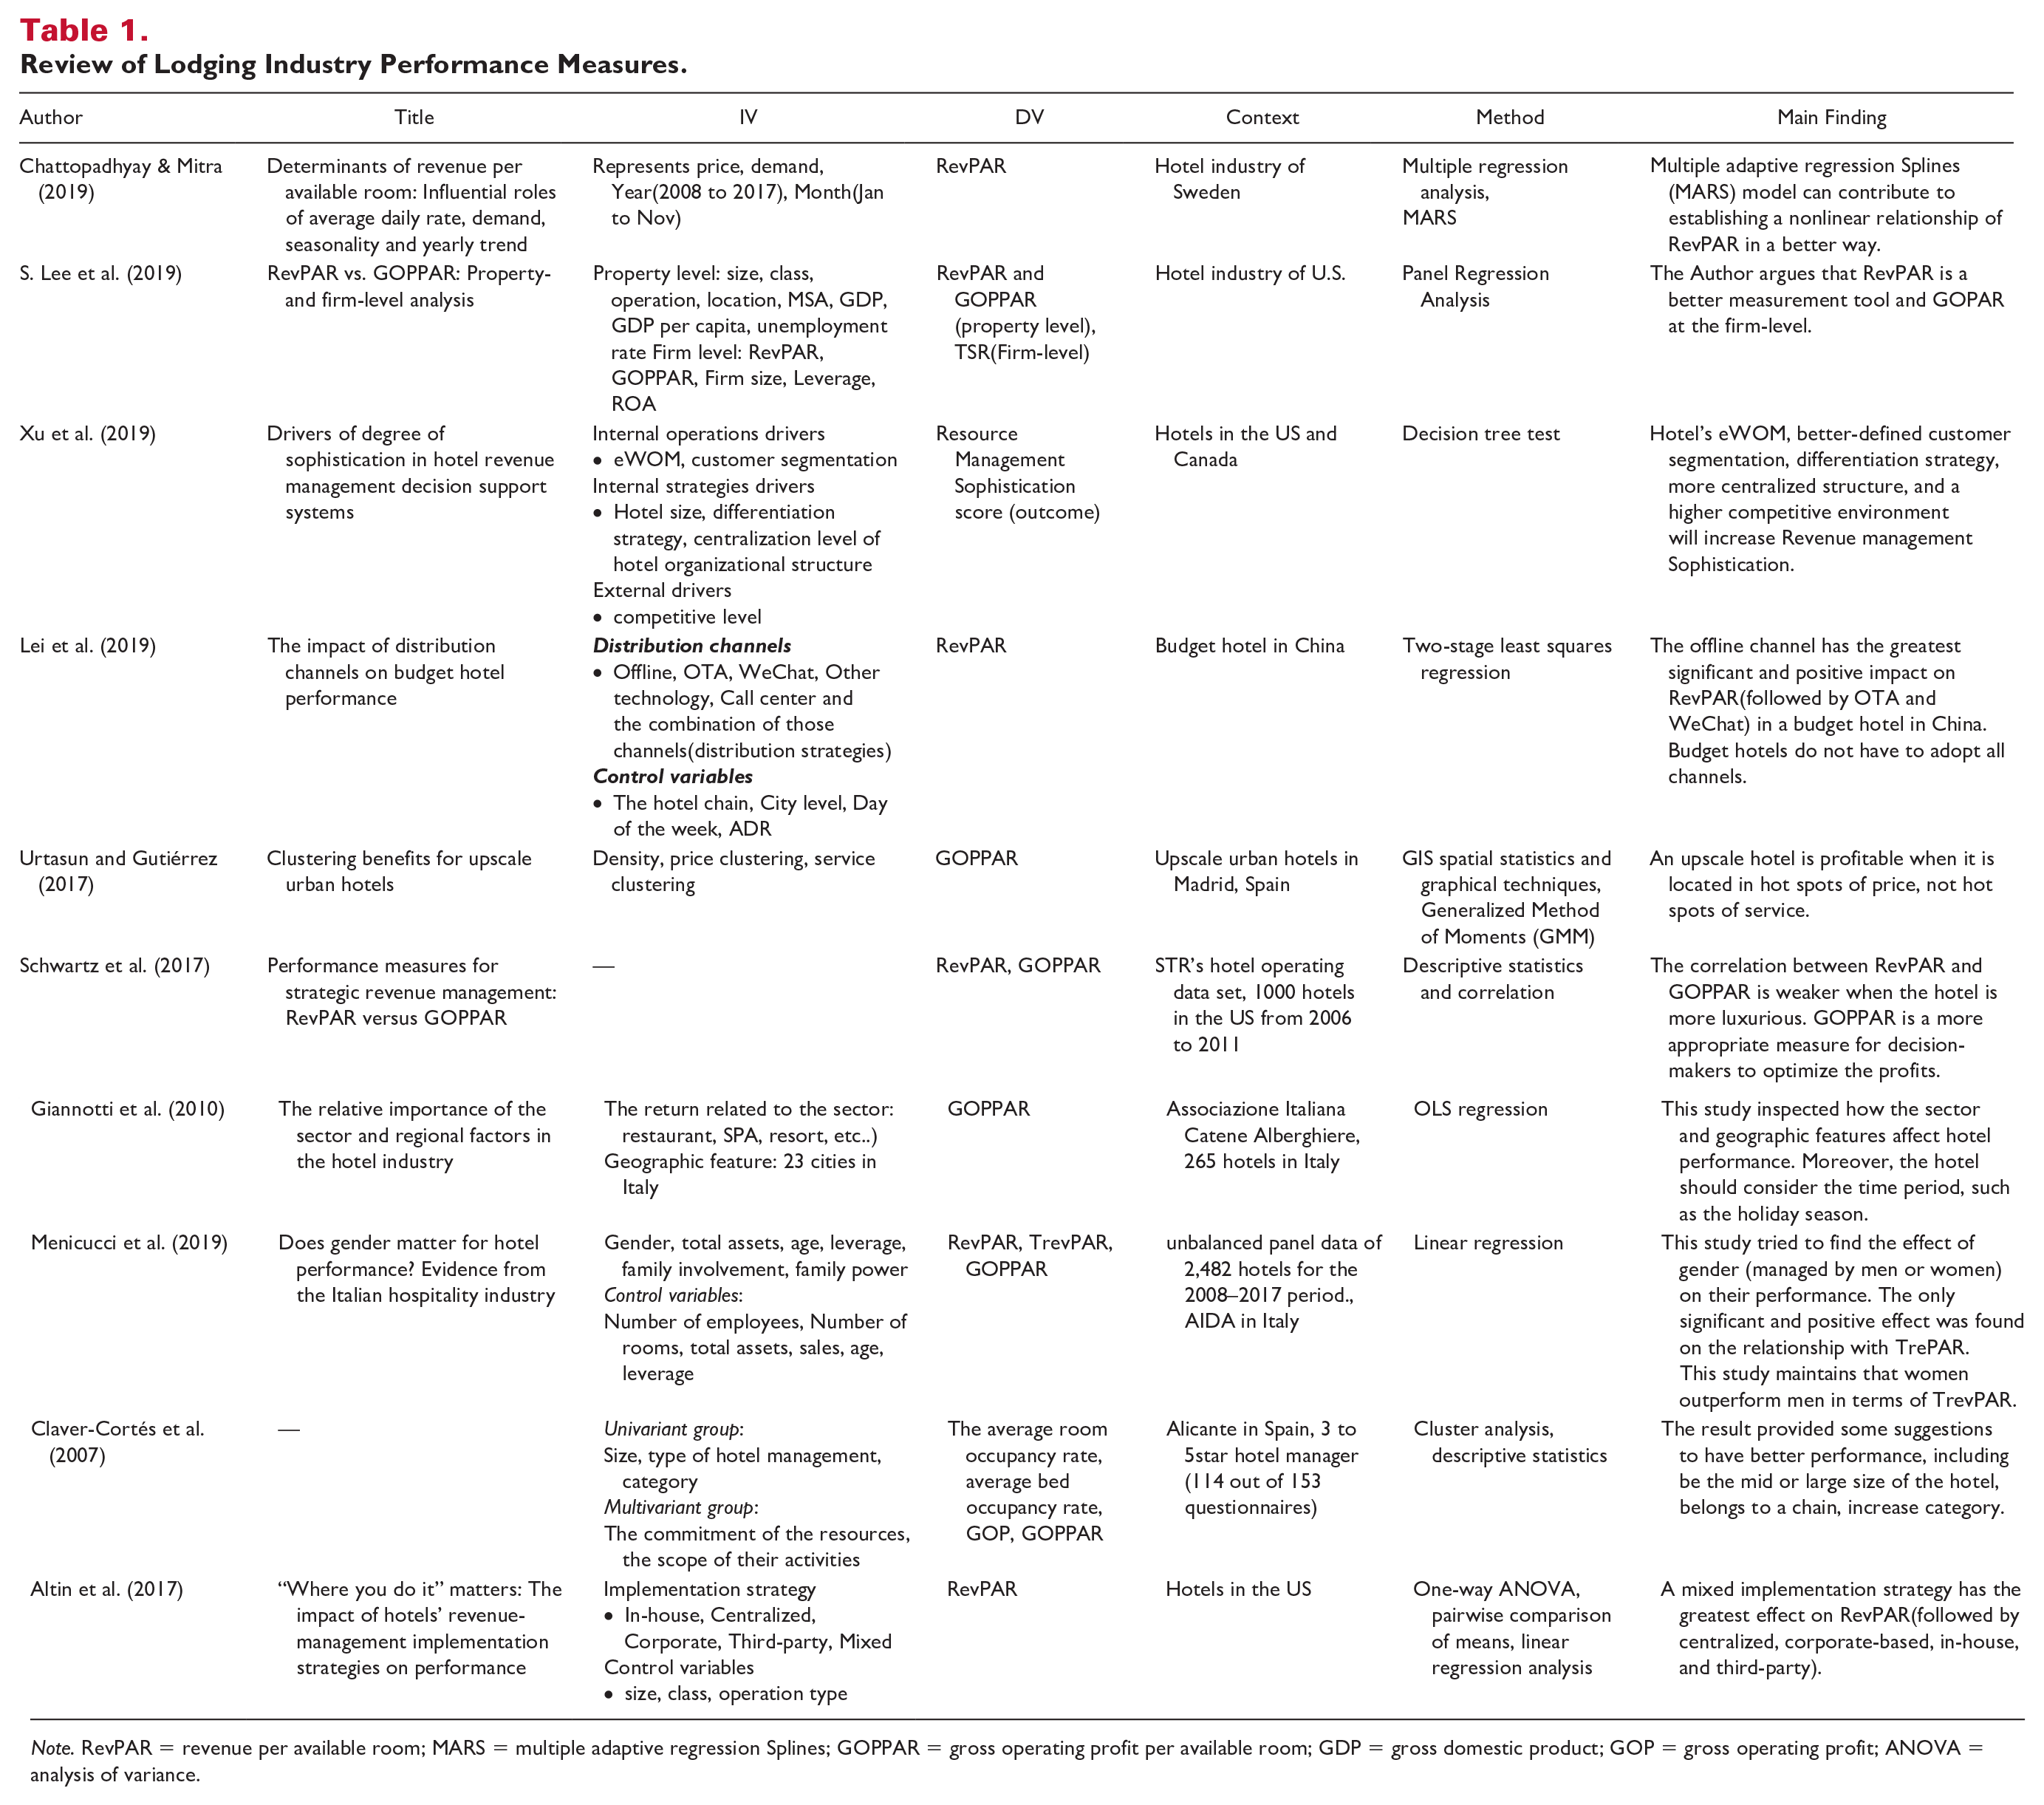
Note. RevPAR = revenue per available room; MARS = multiple adaptive regression Splines; GOPPAR = gross operating profit per available room; GDP = gross domestic product; GOP = gross operating profit; ANOVA = analysis of variance.
Descriptive Statistics.
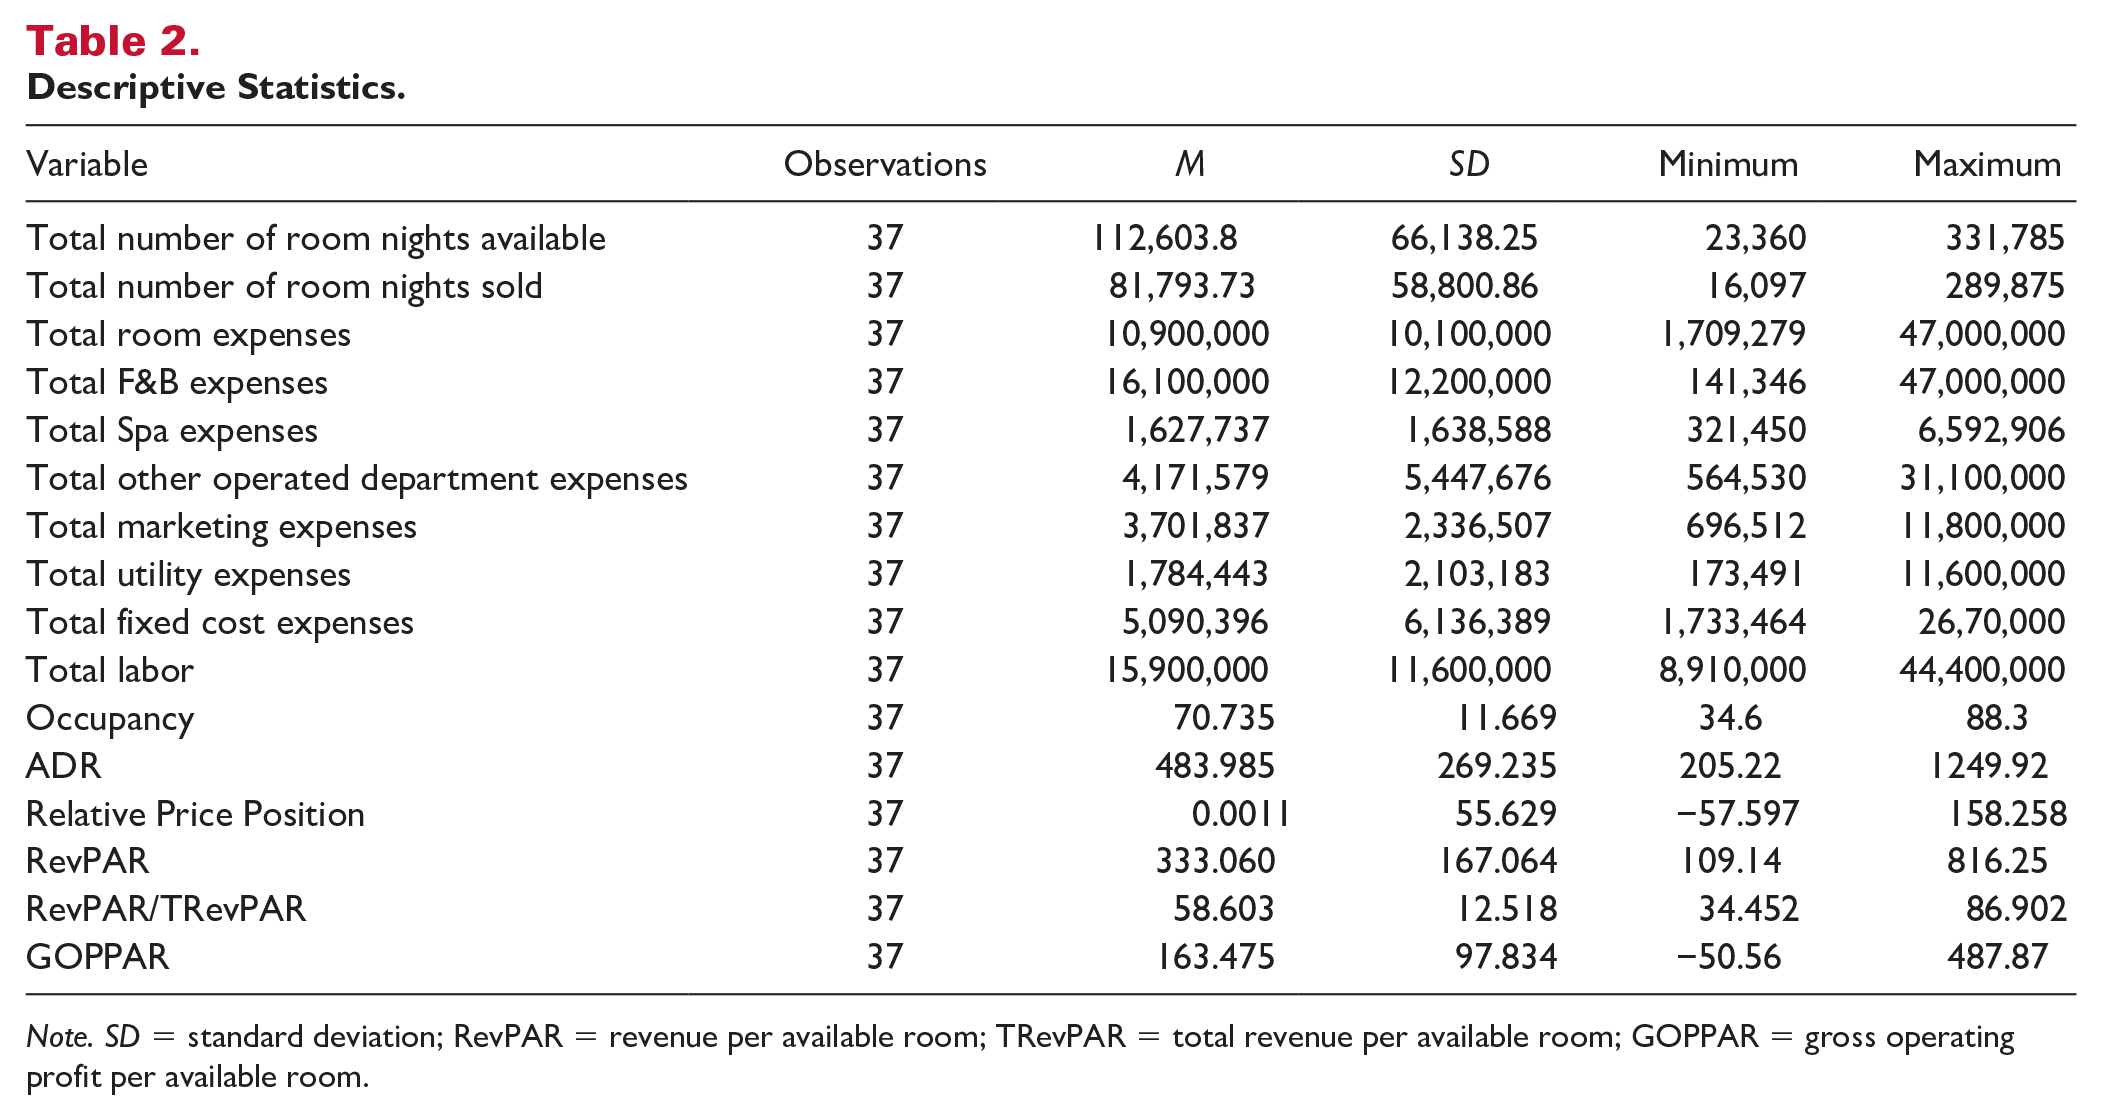
Note. SD = standard deviation; RevPAR = revenue per available room; TRevPAR = total revenue per available room; GOPPAR = gross operating profit per available room.
Performance measures have been developed with hotels’ revenue management practices to optimize financial performance (Schwartz et al., 2017). RevPAR has been used as the performance measurement standard, emphasizing rooms as a key revenue source for all hotel segments (Lei et al., 2019). However, academia and industry have realized the downside of RevPAR; it does not sufficiently reflect hotels’ expenses and other revenues generated outside the room department (Brown & Dev, 1999). Table 1 shows that recent hotel revenue management studies have used multiple performance measurements, including RevPAR, TrevPAR, gross operating profit (GOP), and gross operating profit per available room (GOPPAR).
Performance evaluation plays a critical role in ensuring hotel firms’ performance and competitive advantage in the global market (Cooper et al., 2000). For example, RevPAR is a widely acknowledged hotel performance standard measure (Altin et al., 2017; Chattopadhyay & Mitra, 2019). However, some RM studies (e.g., Brown & Dev, 1999; S. Lee et al., 2019; Schwartz et al., 2017) argued the inappropriateness of RevPAR and the need for a new, precise, and sophisticated performance measure to determine profitability and efficiency in the lodging industry. Although sales revenues, costs and expenses, and other revenue sources should be considered simultaneously to capture profitability and efficiency, efforts to provide a holistic approach in hospitality RM literature are limited. More importantly, luxury hotel firms included multiple revenue sources other than room sales. Since luxury hotels rely on non-room sales compared to non-luxury hotels, they should consider each sales unit’s different costs and expenses and their comprehensive financial performance evaluations (Maier & Roberts, 2018; Rogers, 2019). Thus, RevPAR may be unsuitable because RevPAR ignores supplementary revenue sources and costs and expenses associated with sales. Focusing on room revenue alone does not provide a comprehensive profitability analysis of a property and how efficiently hotel firms operate their business for profitability.
Operation Efficiency in Luxury Hotels
Efficiency is the economic term determined by the ratio of outputs (e.g., products, revenue) to inputs (e.g., machine, employees, wages, hours, costs, and expenses; Jarzębowski, 2014). Two scopes can determine efficiency: an output-oriented approach (maximizing outputs under a given input condition) and an input-oriented approach (minimizing inputs under a given output condition) (Akridge, 1989). Although the concept of efficiency is the core of economics in all industries (Leibenstein, 1966), demand and market fluctuations make precise evaluations of efficiency in the hospitality industry a challenge. For example, past studies used various parameters to calculate technical efficiency as input units, such as restaurant size, type, location, revenue per available seat, and sales cost in the restaurant setting (Mhlanga, 2018). In a similar vein, Corne (2015) utilized occupancy rate, RevPAR, and hotel categories with an output-oriented approach to evaluate the efficiency in the tourism industry.
The hotel industry and academia have evaluated hotels’ performance using revenue-oriented measures, such as RevPAR, TRevPAR, and GOP (Ben Aissa & Goaied, 2016). However, different hotel properties have unique operational characteristics; hence, their profitability and productivity should be defined accordingly (O’Neill & Mattila, 2006). Efficiency, which involves productivity and profitability, should be considered the primary strategic performance measure in the competitive lodging industry segment (Barros, 2005).
The hotel industry has been evaluating efficiency performance by considering various factors, such as number of complaints, check-in and check-out quality, number of hotels, number of rooms, number of full-time employees, total floor area, operating expenses, age of the hotel, franchising costs, and rankings (Brown & Ragsdale, 2002; Hwang & Chang, 2003; Perrigot et al., 2009). The hotel industry has employed further efforts to find the optimal efficiency through various inputs and outputs. Luxury hotel properties need an integrated interpretation by aggregating multiple inputs and outputs from diverse revenue sources to define operational efficiency values (Barros, 2005). Previous studies focused on inputs and their impacts on financial performance (e.g., total number of rooms, employees, marketing activity, CSR expenses). Other researchers considered outputs and competitive market advantage (e.g., profitability, firm value, brand reputation). Studies also used a dual approach with input and output values toward efficiency in the hotel industry to measure technical efficiency (Font et al., 2011), cost efficiency (Hu et al., 2009), comparative efficiency (Min et al., 2008), and operational efficiency (Manasakis et al., 2013; Xu & Chi, 2017). However, according to the literature review, comprehensive application of luxury hotel operation characteristics with multiple inputs and outputs are limited. Hence, strategic efficiency improvements are yet to be seen.
Although luxury hotels can separately interpret productivity and profitability throughout each revenue source, hotels should find the integrated efficiency standard according to varying contributions of each input and the endogenous operational characteristics of luxury hotel properties (Chakraborty et al., 2004).
Data Envelopment Analysis (DEA)
Multiple performance measures are paramount to computing the complex operational efficiency of luxury hotels. For example, a hotel with outstanding profit margin levels does not necessarily mean that the hotel efficiently utilizes its resources, nor does it reduce operating costs to increase its profit margin. DEA was employed to integrate multiple performance measures to operational efficiency estimation (Charnes et al., 1978), and it computes the efficiencies of decision-making units (DMUs) with multiple inputs and outputs. The non-parametric DEA frontier analysis method enables efficiency assessment during multi-output scenarios, which applies to luxury hotel operations and management. Each DMU (luxury hotel property in this study) has different levels of inputs and outputs in business operations. DEA attempts to determine the efficiency of luxury hotels and the inefficiency of other less-efficient properties.
In this attempt, DEA methodologically allows having DMUs as alternatives and DEA inputs and outputs as two sets of performance criteria. Inputs (to be minimized) and outputs (to be maximized) reflect pivotal profitability and productivity measures related to luxury hotel business characteristics.
This approach enables identifying a “best-practice frontier” for comparing a given competitive set and provides specific improvement targets (Min et al., 2008). In benchmarking, efficient DMUs, as defined by DEA, do not necessarily form a “production frontier” but rather lead to a “best-practice frontier” according to efficiency (Ruiz & Sirvent, 2019).
Benchmarking is the process of comparing one’s business processes and performance metrics with best performers in the industry or best practices from other industries (Invernizzi et al., 2018). DEA provides pivotal benchmarking references for luxury hotel operations and management, where a selection of set of measures benchmarks service operations’ performance in luxury hotel properties (Min et al., 2008; Movahedi et al., 2019). Using the DEA approach could establish the efficient frontier consisting of the best performing DMUs, which serves as a guide for DMU managers to improve business efficiency. Any DMU attains full (100%) efficiency if none of its metrics can be improved without worsening others. The relative efficiency of a DMU is rated fully (100%) efficient if the performance of other DMUs does not indicate some of its metrics can be improved without worsening others (Charnes et al., 1978).
Methodology
Research Design
This study is composed of three analytic approaches that provide luxury hotels with strategic suggestions for efficient operations leading to improved financial performance. To capture hotel profitability methods and indicated improvement needs in hotel operations, it is critical to correctly identify internal factors (inputs and outputs) and the business environment’s target characteristics. To better understand luxury hotels’ operating efficiency standards and to make pragmatic strategic suggestions to those tasked with efficiency improvements, this study employed (a) data envelopment analysis to determine efficiency scores, (b) slack analysis to specify efficiency improvements by benchmarking efficient frontiers for each input and output, and (c) Tobit regression analysis to explain which factors, other than DEA input variables, affect the hotels’ efficiency scores in the competitive set. Employing three analysis stages goes beyond listing efficient frontier as a benchmarking company for each input and output; it comprehensively analyzes external factors that affect efficiency scores and highlights specific consultations for improving efficiency scores.
Data Envelopment Analysis
A two-stage analysis approach and the Tobit model were employed in DEA to compute the efficiency score with efficiency rankings and slacks and to find and examine possible operational factors that affect efficiency scores. First, the study used DEA to measure the comparative operation efficiency of 37 luxury hotel properties in the US relative to their key competitors. DEA uses linear programming methods to compute a frontier by decision-making units (DMUs) and measures their efficiency correlating to the estimated frontier (Callen, 1991). A DMU is efficient if its efficiency score is one and its inefficiency score is less than one. The DEA model can determine a set of properties in the efficient frontier. This set of properties represents best practices by examining whether a DMU does not produce enough outputs given the input resources (output-oriented) or whether a DMU uses too many inputs to produce the current output levels (input-oriented) (Thanassoulis, 2001). Empirical results suggest that a higher input level for the same output level or a lower output level for the same input level are key business inefficiency characteristics.
Technical efficiency (TE) refers to the efficiency score with the constant returns-to-scale (CRS) assumption. TE implies a proportional increase in the outputs resulted from the increase in the inputs for all DMUs (Hu et al., 2009). On the other hand, the pure technical efficiency (PTE) model is based on variable returns-to-scale (VRS), which assumes a firm’s scale evaluates efficiency so that the effect of increased inputs and the outputs varies among the DMUs (Banker, 1984). Therefore, the PTE measure captures inefficiencies caused by managerial underperformance (Manasakis et al., 2013). There are two different returns-to-scale regions: increasing returns-to-scale (IRS) and decreasing returns-to-scale (DRS). DMU in either IRS or DRS region can improve efficiency by increasing or decreasing its productivity by its scale, which is scale efficiency (SE). SE evaluates efficiency of a DMU operations size. DMU in the IRS region can increase its output more than proportionally increase its inputs. When DMU is in DRS, output increases are proportionally less than input increases (Neves & Lourenço, 2009).
Based on a linear program, maximize efficiency score


where E m is technical efficiency of the mth decision-making unit (DMU), Yjm is the jth output of mth decision-making unit (DMU), Vjm is the weight of jth output of mth decision-making unit (DMU), Xim is the ith input of mth decision-making unit (DMU), Uim is the weight of ith input of mth decision-making unit (DMU), and Vjm, Uim ≥ 0; i=1,2, …, I; j=1,2, …, J.
TE under the CRS assumption is decomposed into PTE and SE under the VRS condition, which allows for CRS, DRS, and IRS regions. This study calculated VRS efficiency scores employing Baker, Charnes, and Cooper’s (BCC) model (Pulina et al., 2010).
PTE model is

such that Y

where λ ≥ 0; θm is free or constrained;

where Y is the vector of outputs of all DMU, Ym is the output of the mth DMU, θ is the efficiency score, dual variable corresponding to the equality constraint that normalizes the weighted sum of inputs. λ is the dual corresponding to the other inequality constraint of the primal (CCR approach), the first constraint has m constraints, one for each input, the second constraint has m constraints, one for each output.
The convex combination requires that the sum of these n lambdas equals one. The right-hand side is one of the n DMUs under evaluation. Minimizing the input resources available to the virtual DMUs is the first step. If θ = 1, the virtual DMUs require as much input as real DMUs under evaluation. If θ < 1, the virtual DMUs require less input to obtain the output level achieved by the real DMUs under evaluation, which represents inefficiency. From this DEA approach, the slack analysis could suggest DMUs’ improvement (Barros, 2005). The ultimate goal of each suggestion should be the best efficient frontier. Input and output slacks of operationally inefficient luxury hotel properties provide valuable information regarding strategic recommendations to achieve the best operational efficiency. This slack analysis offers the input and output slacks derived from the technical efficiency score (CCR). When the efficiency score is one and the slack value is zero, the DMU can be identified as a DEA efficient frontier. However, DEA weak efficiency can be defined by the efficiency score of one, but the slack value of non-zero, which warrants improvement.
Data and Model Inputs and Outputs
Careful identification of inputs and outputs based on industry operation characteristics is pivotal to DEA, and luxury hotel operations classify inputs and outputs as performance measures. Outputs are the business outcome performances that reflect strategic business goals so that operations should maximize outputs (profit and revenues, sales units). However, inputs are resources that should generate sales and revenues from the luxury hotel operations to achieve strategic business goals and, therefore, should be minimized (Neves & Lourenço, 2009).
The study conducted a thorough review of previous literature in revenue management, operations, strategic management, and productivity and efficiency to select proper inputs and outputs for luxury hotel properties’ operation efficiency. This study mainly used Smith Travel Research (STR) Fanatical information from profitability reports consisting of monthly hotel-level performance data. A total of 37 fully equipped luxury hotels (STR class code 1) that are geographically dispersed over the states were analyzed for efficiency measures. This dataset provides multiple performance and profitability indexes of hotel operation and management and delineates the number of rooms, regional location, location type, and hotel category. For DEA approach purposes, the study selected only luxury hotels to fulfill the luxury hotel industry’s homogeneous characteristics, including similar revenue-generating departments (inputs) and available information about their financial performance (outputs). From the thorough review and data availability, the study identified seven operational inputs: total number of room nights available, total room expenses, total F&B expenses, total spa expenses, total marketing expenses, total utility expenses, and total wages. Outputs are gross operating profits per available room and occupancy rates. Golany and Roll (1989) established a rule of thumb that the number of units should be at least twice the number of inputs and outputs considered. Hence, this study includes seven inputs and two outputs, so the minimum total number of DMUs should be no less than 18, allowing some discriminatory power to exist in the model. A total of 37 DMUs are sufficient for efficiency computation with a total of nine variables to avoid DEA over-fit problems (Drake & Howcroft, 1994). This study successfully secured the sound number of DMUs (37 total) for DEA.
Tobit Analysis
Business characteristics are the most important factors that affect productivity and efficiency. Differences in operational characteristics in a luxury hotel business may affect hotel performance and efficiency. Therefore, determining which hotel operation characteristics influence variations in operational efficiency across luxury hotel properties is essential. Tobit regression analysis uses efficiency scores as the dependent variable for the possible operational factors. The Tobit model identifies operational factors associated with the relative efficiency score of luxury hotel properties. In addition, Tobit regression analysis estimates the relationship between efficiency scores and luxury hotel business characteristics that are unrelated to the inputs used in the VRS model:
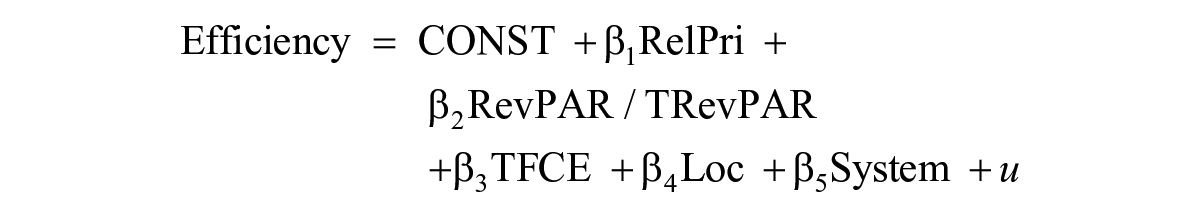
where RelPri is the relative price position, RevPAR/TRevPAR is the ratio of revenue per available rooms to total revenue per available rooms that represent operational characteristic regarding room revenue dependency, TFCE is the total fixed costs expense, Loc is the Location (“0” if an urban hotel, “1” if a resort), System is the management system (“0” if a chain hotel, “1” if an independent hotel), and u is the error.
Studies have widely acknowledged the impacts of ADR positioning and pricing strategies on hotels’ financial performance (e.g., Alam et al., 2001). To accurately reflect market competition and characteristics, this study employed relative price positions. Relative price position represents a measure of the mean ADR attained by a hotel relative to the competitive set and was computed for each hotel in the sample as the average of the annual ADR percentage difference from the competitive set (Noone et al., 2013). The relative price position of hotel ADR is in a positive linear relationship with hotel firms’ financial performance as a price premium (e.g., Enz & Canina, 2010) or price discount (e.g., Noone et al., 2013). Relative price positions can be calculated by:
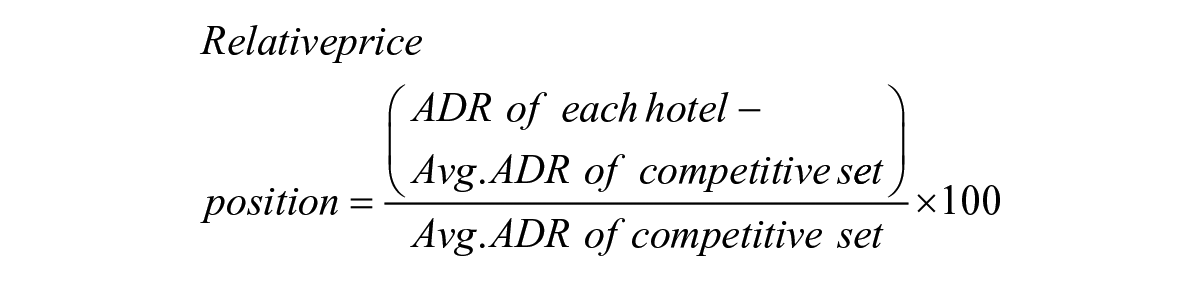
The average ADR of the competitive set in this study is US$483.98.
Results and Discussion
DEA results with slack analysis and the Tobit model provide remarkable implications, and this section includes results and interpretations followed by discussion, respectively.
DEA Results and Discussion
DEA’s main purpose is to first determine the best efficient DMU and then calculate the efficiency of other DMUs relative to this frontier. The models used in this study measure relative efficiency based on the output-oriented model, which provides sound assumptions for Tobit model estimation.
Table 3 shows 37 luxury hotel properties analyzed to measure relative operational efficiency according to the best efficient frontier determined by seven inputs and three outputs. First, this analysis computed the technical efficiency score of all DMUs, which measures the productivity of a firm established by its input/output conversion process and its operations’ size and scale. In addition, pure technical efficiency measures productivity from managerial efficiency in organizing inputs. Finally, the scale efficiency index that represents the ratio of CCR with the BCC index is reported.
DEA Results.
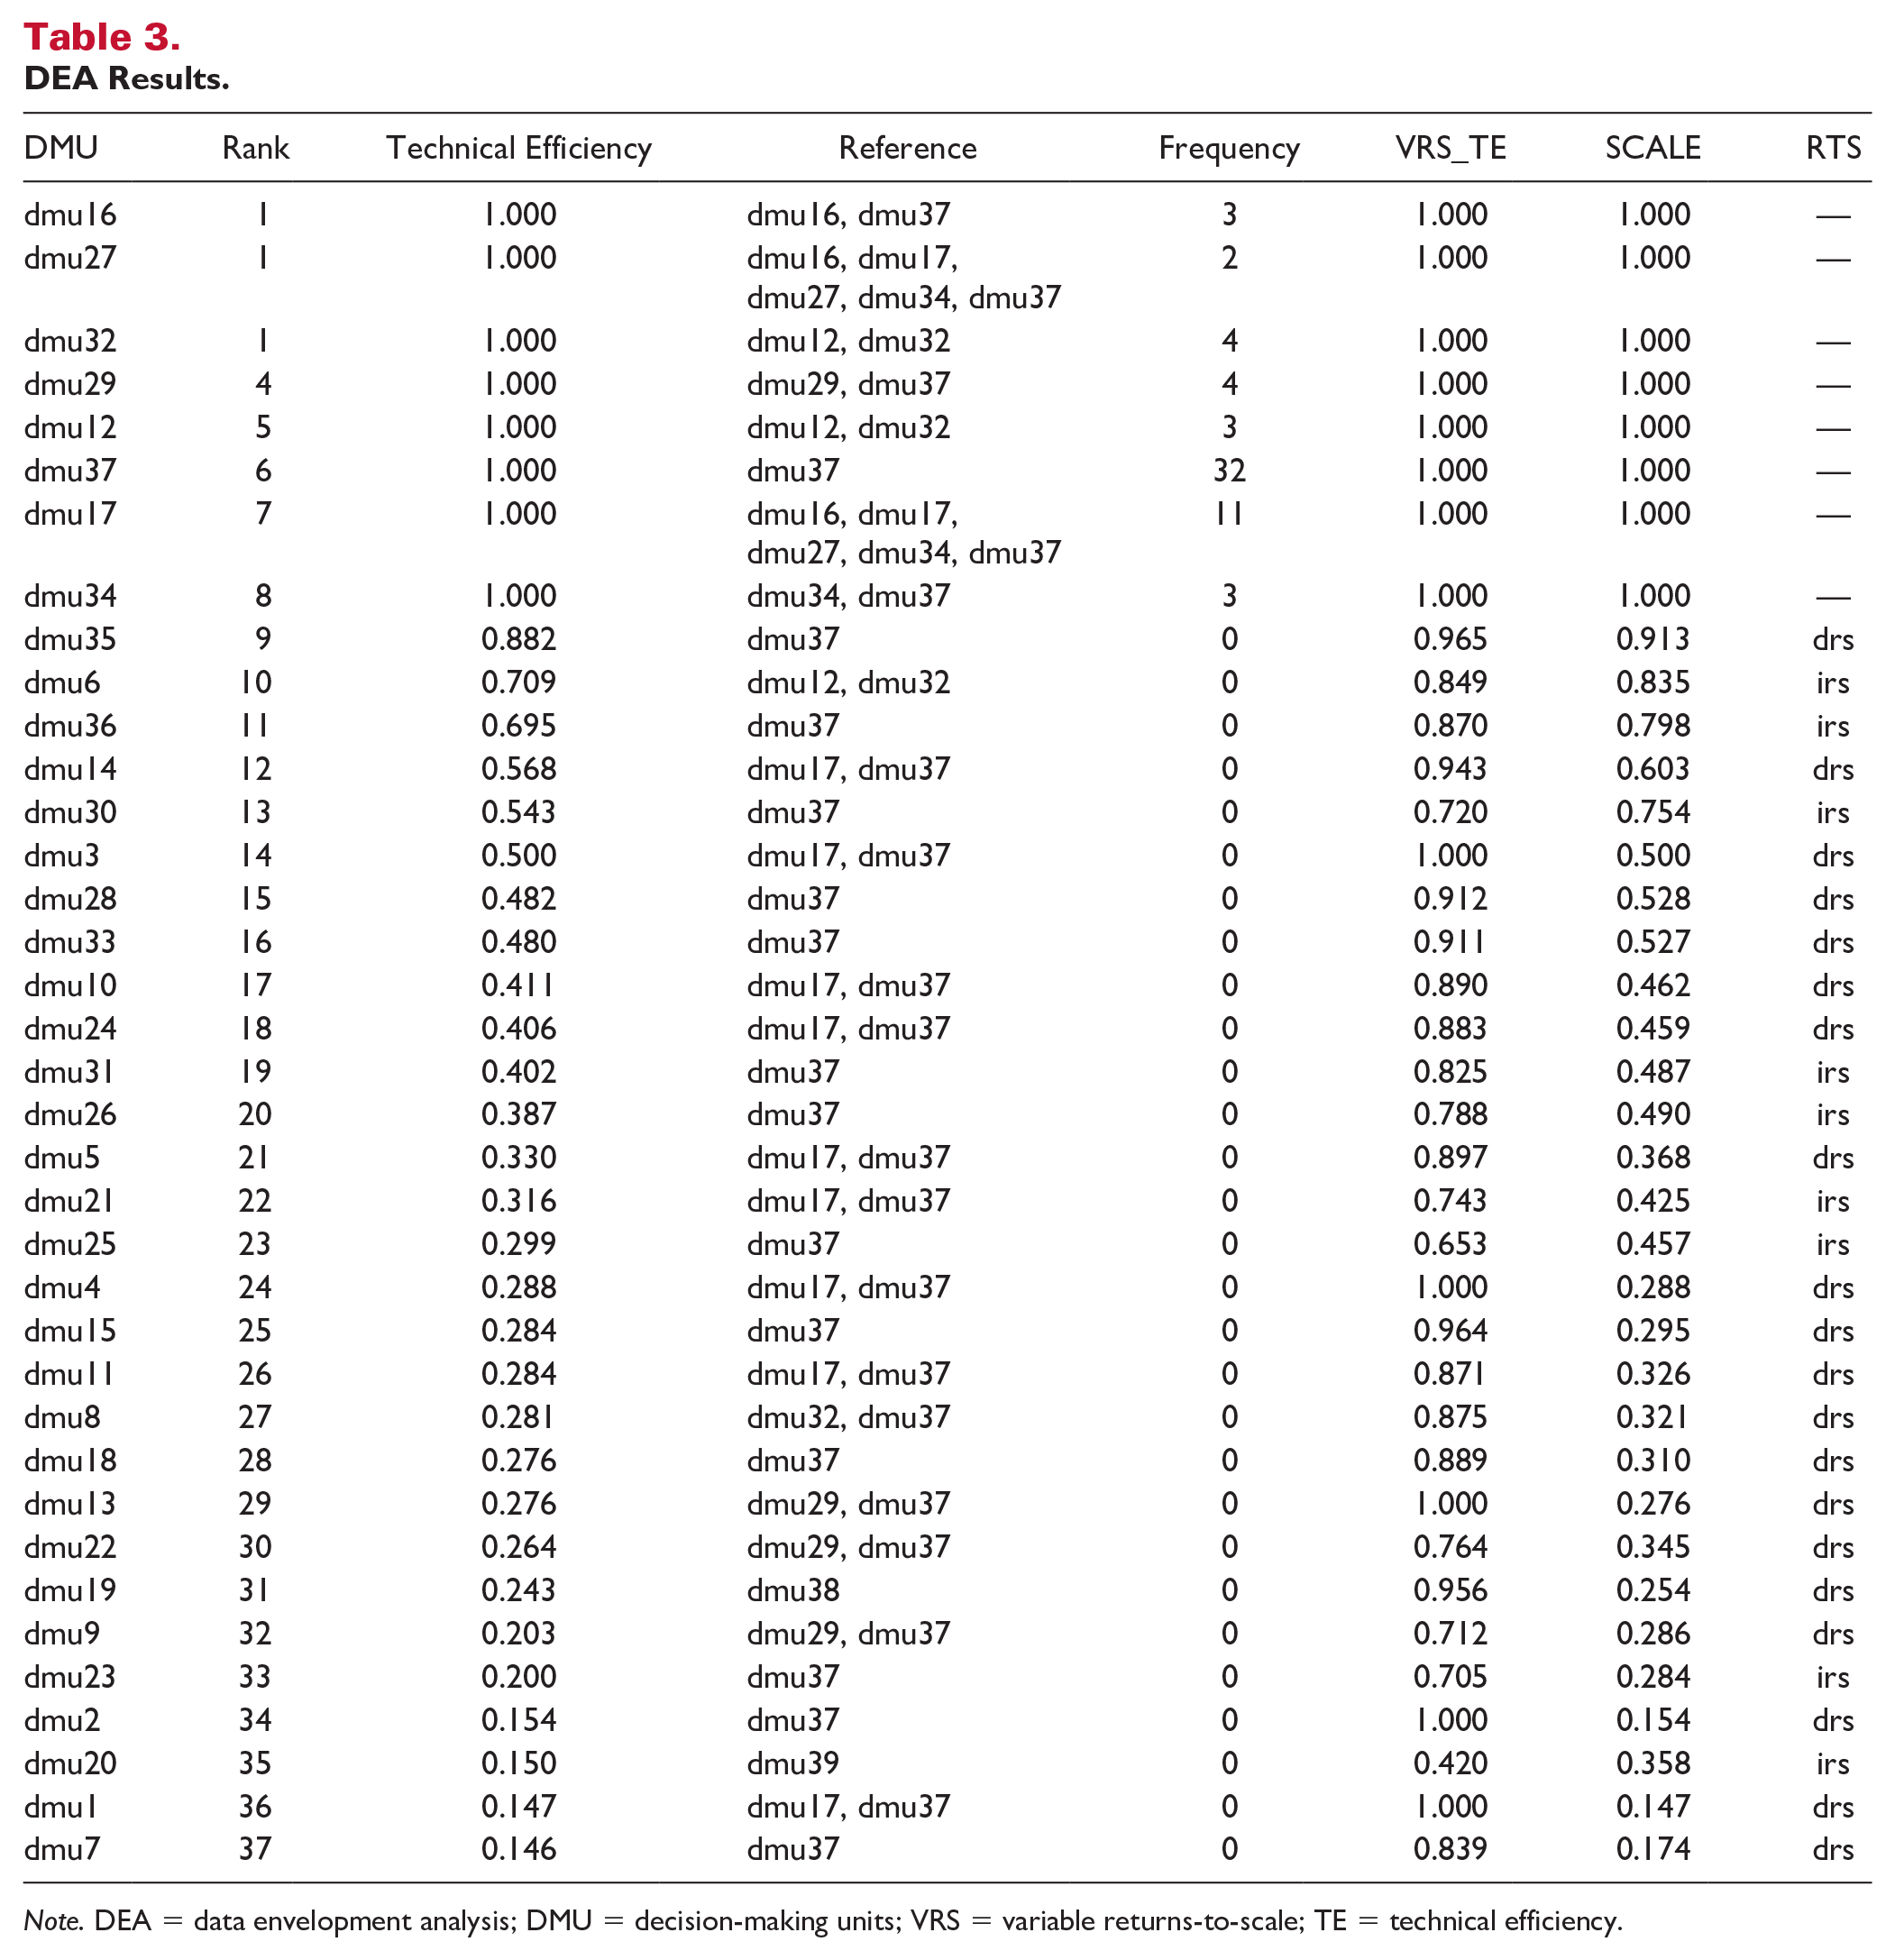
Note. DEA = data envelopment analysis; DMU = decision-making units; VRS = variable returns-to-scale; TE = technical efficiency.
This study ranked each luxury hotel property according to its efficiency scores. In this table, the efficient frontier is demarcated by eight properties, which have a technical efficiency score equal to one. The remaining luxury hotel properties have a lower efficiency level depending on their distance from the efficient frontier (TE=1). The mean value of the technical efficiency index for 37 luxury hotel properties is 0.503, which suggests that luxury hotel properties reduce their consumption of inputs by 49% to reach the frontier and thus achieve efficient operation performance. As an example, DMU 14 has an efficiency value of 0.568, indicating an overuse of inputs. This result suggests that reducing input by more than 40% throughout the operation is recommended to be an efficient frontier. For comparison, DMU 14 can take hotel firms in its reference group as strategic consultation (DMU 17, DMU 37). Such reference hotel properties are efficient properties that achieve a level of output similar to that of DMU 14 with fewer inputs.
The study then employed the VRS model for computation of technical and cost efficiency scores using DEA. According to the inputs and outputs used in the DEA, luxury hotel properties that show the most efficient use of inputs in generating outputs are the most efficient properties (technical efficient frontier). The VRS approach determined the percentage share of companies characterized by decreasing returns to scale (DRS), increasing returns to scale (IRS), and constant returns to scale (CRS). Grounded by the conducted analysis (Table 3), DRS characterizes the majority of the companies (20/37) operating in the luxury hotel sector. Hence, the empirical results concerning the collective luxury hotel properties group suggest that the primary source of hotels’ inefficiency is the input–output configuration and the size of operations, not their management teams’ performance of input organization in the production process.
This finding can be discussed with a case of inefficiency. DMU 3 has an efficiency value of 0.500, indicating an overuse of inputs. Reducing input by more than 45% is recommended to approach the efficient frontier. Benchmarking properties could be selected by DMU 3 from the reference group, which is composed of efficient hotels (DMU 17, DMU 37) that achieve a level of output similar to that of DMU 3 with fewer inputs (better efficiency). This hotel also falls under DRS. Thus, an increase in inputs will increase outputs less proportionally. Not increasing inefficient inputs for output maximization is ideal but retaining the current input level and managing the input-output conversion process is advisable to enable a property to optimize outputs efficiently.
Unlike DMU 3, DMU 13 has a poor efficiency value of 0.276, indicating an overuse of inputs. Hence, reducing inputs of the business operation up to 75% achieves operational efficiency. Strategic benchmarking properties are suggested as a reference group, including DMU 29 and DMU 37, which more efficiently generate a similar size of outputs from a smaller size of inputs than what DMU 13 yields. Unlike the previous DRS region case, this hotel falls under IRS, indicating an increase in inputs will increase its outputs more proportionally. Thus, DMU 13 can strategically increase as many inputs as possible to maximize the input utility in the output maximization approach.
Slack Analysis Results and Discussion
After computing efficiency scores of each DMU, the study performed slack analysis to provide useful information on luxury hotels’ operational efficiency obtained from DEA findings. Slack analysis enables DMUs to make substantial and practical improvements through insightful recommendations throughout the strategic decision-making process. Specific adjustments for the inefficient DMUs denoted by the slack values can solidify outputs and inputs, allowing them to join the efficient frontier. Table 4 reports all slacks of inputs and outputs.
Slacks Analysis Results.
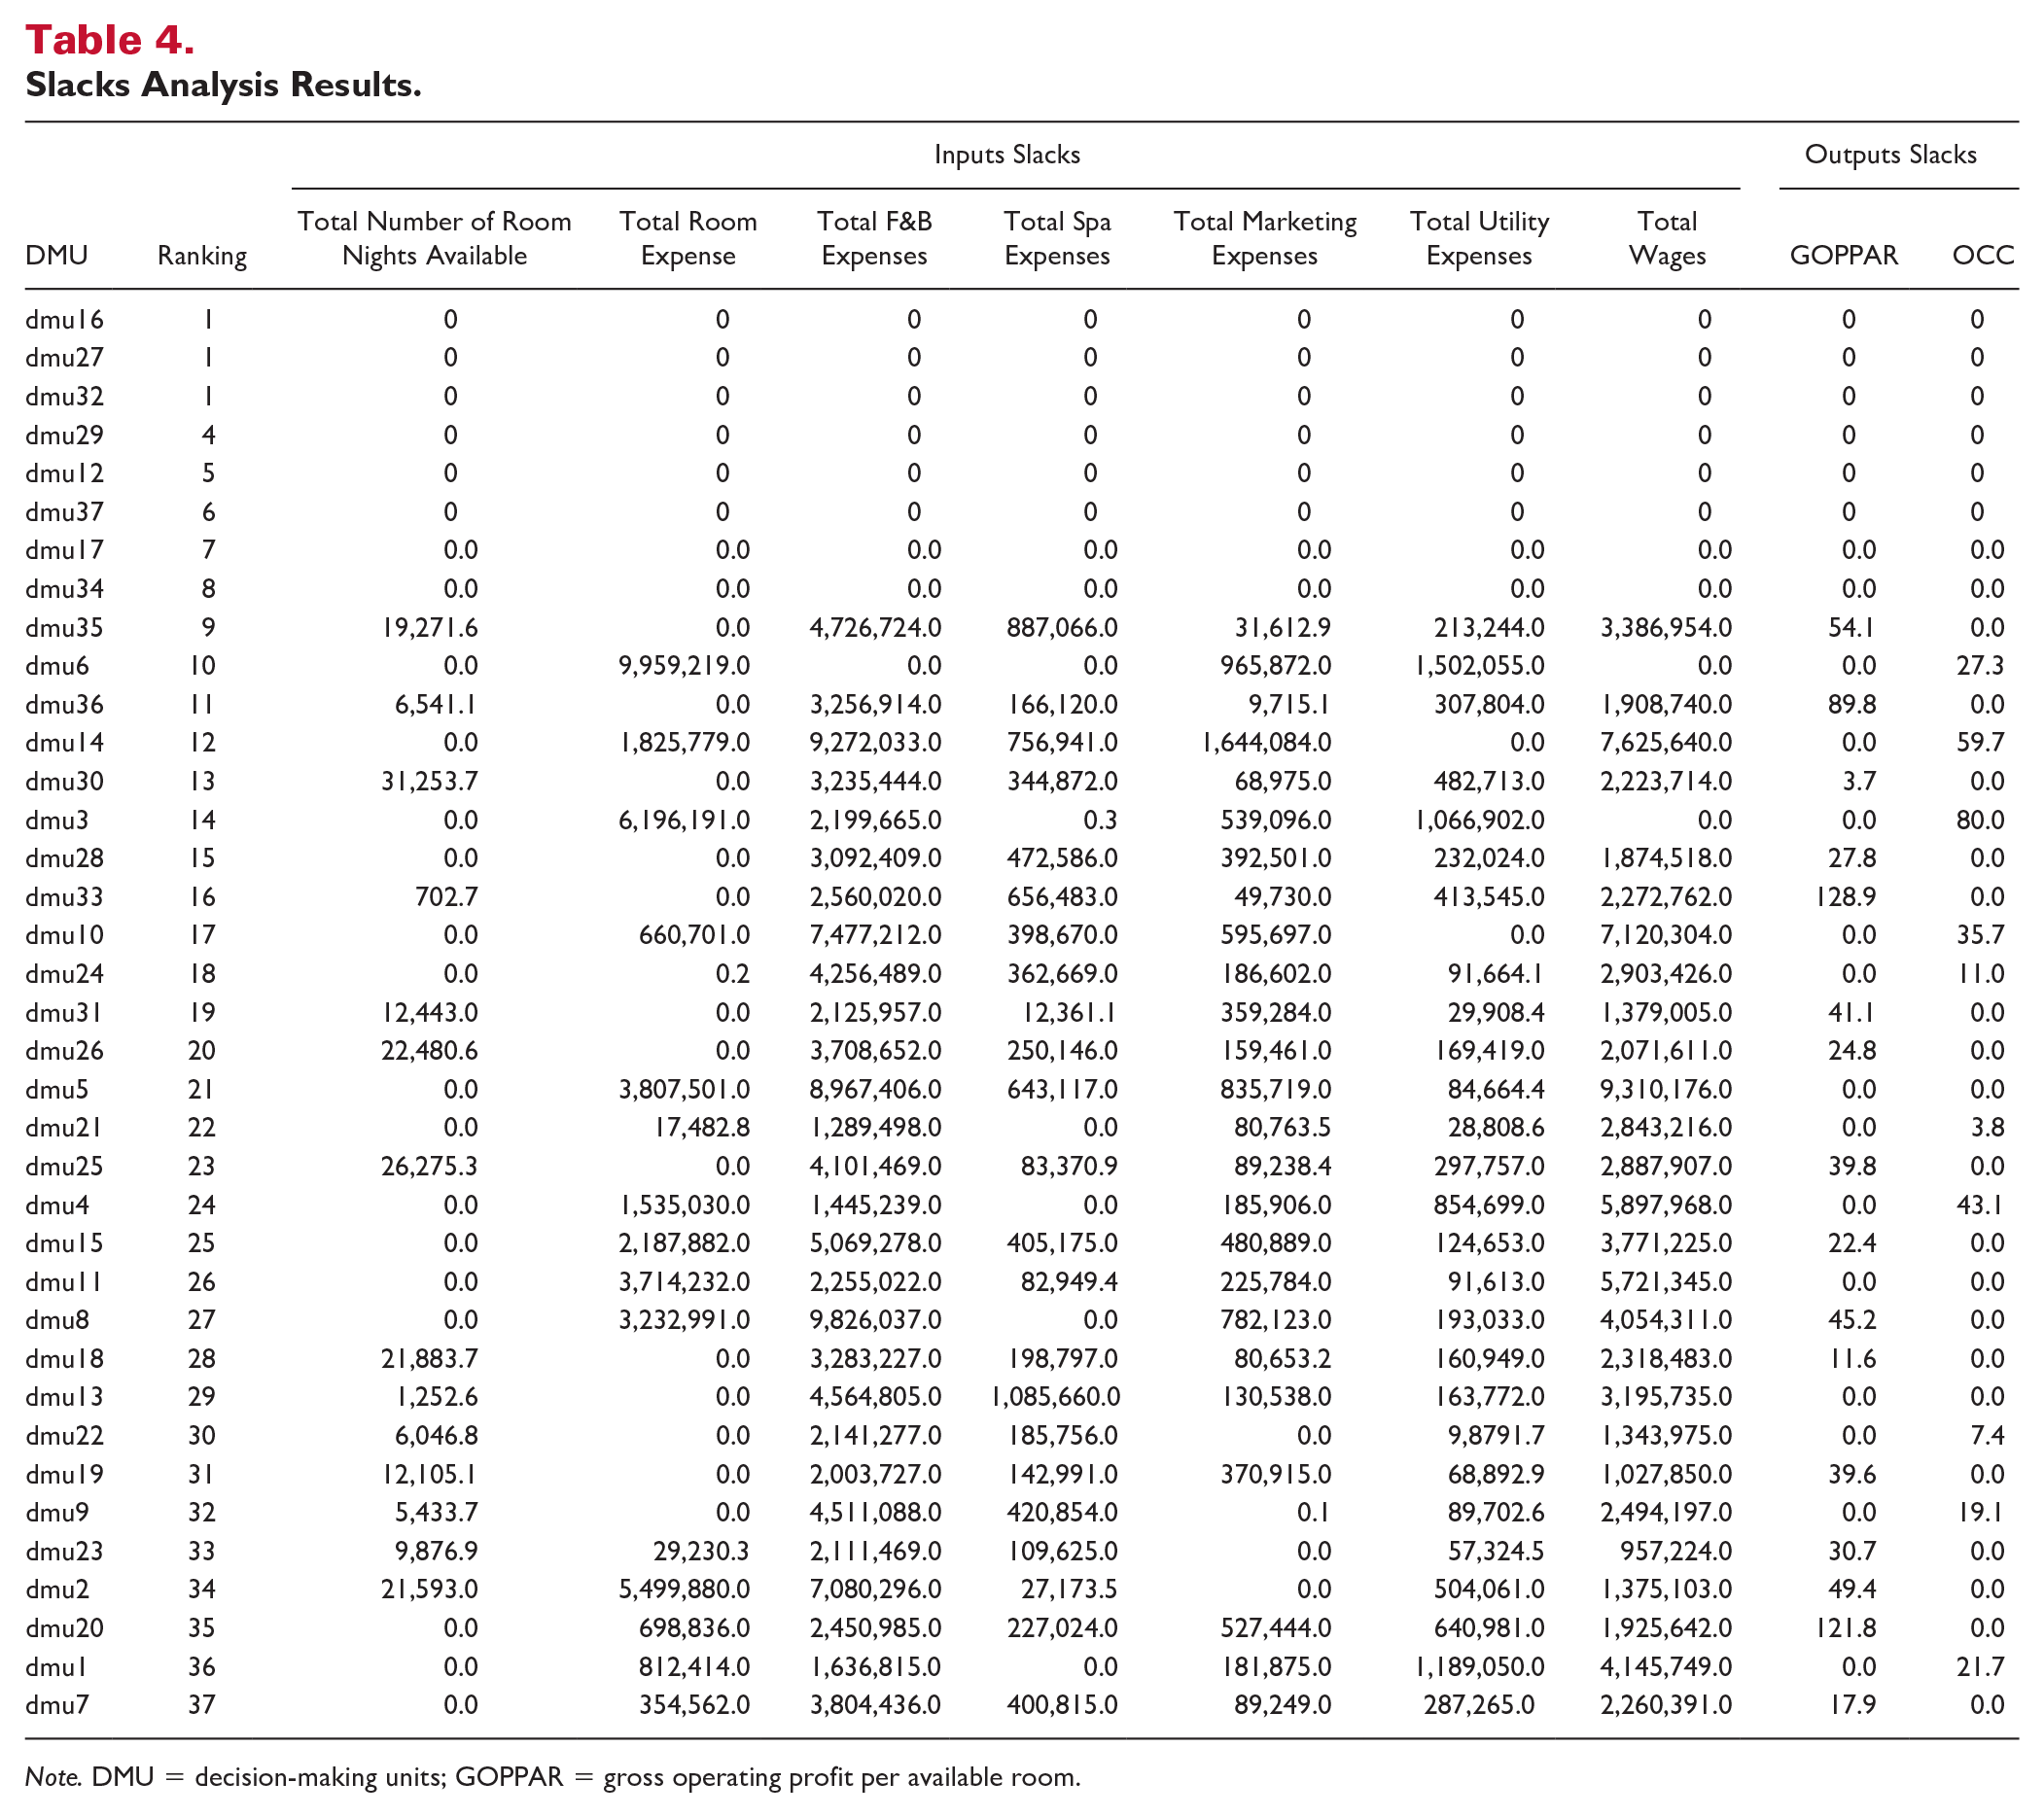
Note. DMU = decision-making units; GOPPAR = gross operating profit per available room.
The slack analysis results instruct each DMU on achieving the most efficient operation strategies (efficiency score = 1) by pinpointing areas for improvement in the operation. Also, slack values of outputs represent business goals from input area adjustments.
The VRS model for DMU 3, θ = 1, λ DMU 3 = 1, and λj = 0 (j ≠ DMU 3), indicates that DMU 3 is on the frontier. However, DMU 3 can still reduce its total room expenses, total F&B expenses, total marketing expenses, and total utility expenses. Table 3 shows that 14 luxury hotel properties have non-zero slacks in input of “total number of room nights available,” 15 in “total room expenses,” 28 in “total F&B expenses,” 23 in “total spa expenses,” 25 in “total marketing expenses,” 27 in “total utility expenses,” and 27 in “total wages.” Among output slacks, 16 DMUs have non-zero slacks regarding GOPPAR and 10 DMUs regarding occupancy rate.
The relative severity of the input variables’ non-zero slacks suggests that hotels can increase their efficiency and project themselves onto the efficient frontier, mainly through reductions in the inputs they use. For example, DMU 8 has a poor efficiency score (0.281); hence, this property should make a strategic decision to improve operational efficiency. The slack analysis results indicate that DMU8 decided to reduce US$3,232,991 in total room expenses, US$9,826,037 in total F&B expenses, US$782,123 in total marketing expenses, US$193,033 in total utility expenses, and US$4,054,311 input to increase GOPPAR by US$45. This decision could serve as a strategic direction for performance improvement based on efficiency. As suggested, DMU 32 and DMU 37 could be a benchmarking efficient frontier. Derived from suggested reference group properties from the DEA efficiency value, slacks of each input and output values provide guidance to achieve the best efficient frontier for luxury hotel property operations.
Tobit Regression Model Results and Discussion
Table 5 lists the estimated results of the Tobit regression. The Tobit model is predominantly used to identify factors associated with comparative luxury hotel properties’ efficiency scores. To explain the variation in performance measures, a set of independent variables including other operational factors (relative price position, RevPAR/TRevPAR rate, total fixed costs, location, and operation system) were tested.
Tobit Regression Analysis Results.
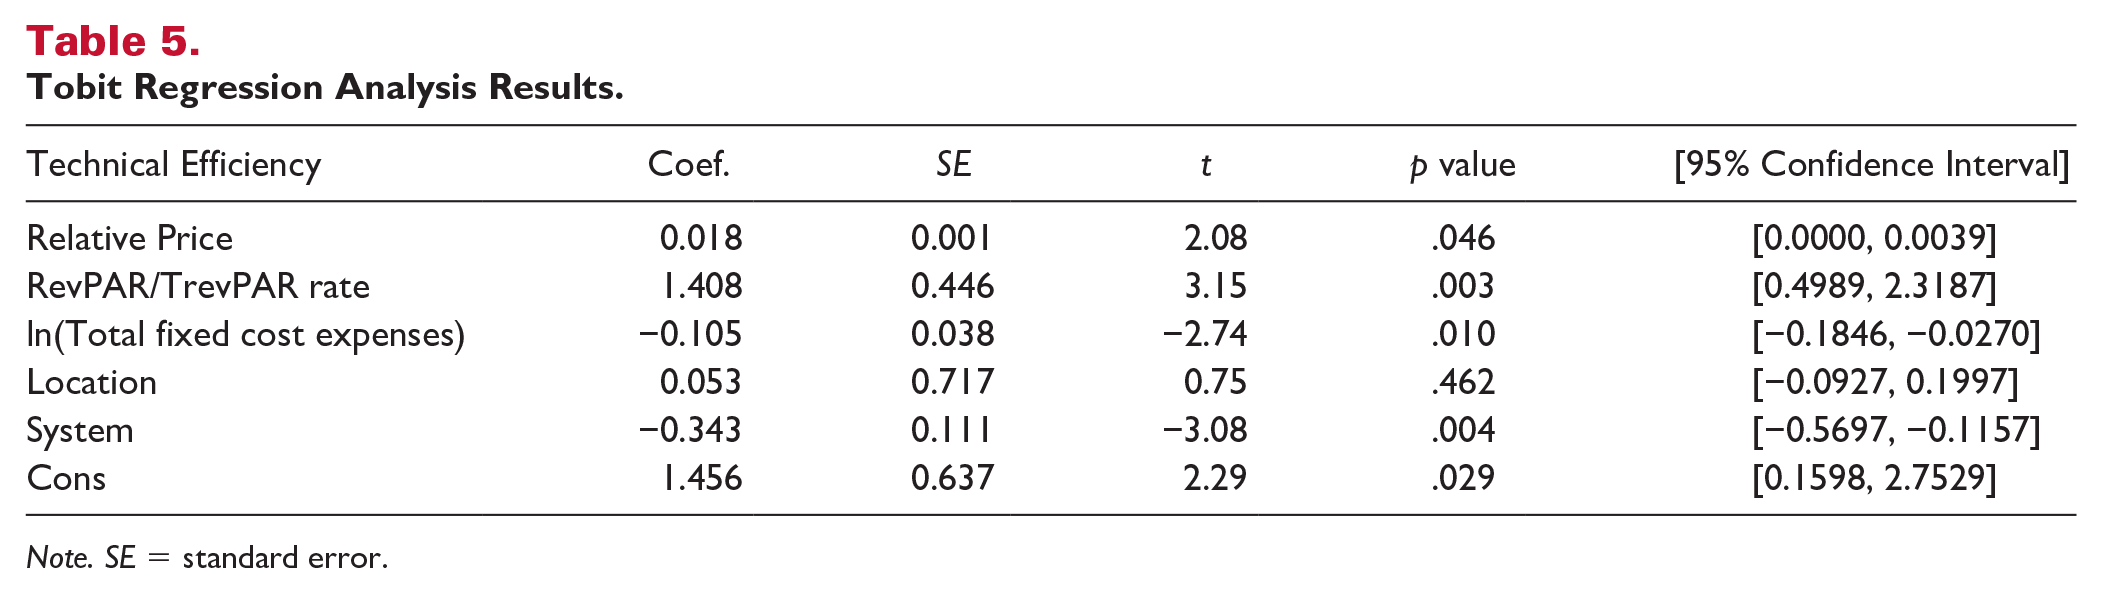
Note. SE = standard error.
First, relative price position and RevPAR/TRevPAR rate positively affected the efficiency value of luxury hotel firms, but total fixed cost expenses and management systems had a negative effect. First, the estimated coefficient of the relative price position (β4 = 0.018, p < .05) and RevPAR/TRevPAR rate (β2 = 1.408, p < .01) was statistically significant on the operational efficiency scores of luxury hotel properties. These results suggest that a higher RevPAR/TRevPAR rate with an ADR higher than the competitive set’s average ADR can positively contribute to higher operational efficiency. This finding reaffirms important luxury hotels’ operational characteristics. Ultimately, the best efficiency strategy is to increase ADR to a higher level than the relative price position grounded by service quality and diverse amenities. They provide multi-divisions that include different business units and functions. Luxury hotels should secure choice options for amenities and better service quality to efficiently operate diverse units. To fulfill such operational flow, they should also exploit price premium with ADR higher than its main market competitors since room sales’ contribution margin is higher than any other revenue-generating division (Kim et al., 2020). Luxury hotel properties should employ this strategic choice in addition to securing a substantial revenue size from its room division as a foundational financial safeguard, which is an essential and core value of hotel and lodging businesses. Also, ensuring that input resources are not overused or wasted throughout the operation is equally critical for operational efficiency. Therefore, demand forecasting and special product packaging could help maintain higher ADR and RevPAR/TRevPAR rates for efficient business operation.
Second, total fixed cost and expenses (β3 = −0.105, p < .01) and management systems (β5 = −0.343, p < .01) were statistically significant on the luxury hotels’ negative operational efficiency scores. This finding indicates that total fixed costs and expenses should be lowered for the efficient frontier model. Since fixed cost is directly associated with financial leverage, risky situations such as the COVID-19 pandemic may cause asset-heavy (real estate oriented) hotel firms to struggle. Cost flexibility is the key to efficient operations in luxury hotel properties. The type of operation also affects total fixed costs and expenses. In this model, a dummy code management system (chain = 1; independent = 0) was a negatively significant factor in luxury hotel firms’ efficiency value. This finding originates from the fact that chain luxury hotels have diverse costs associated with fixed chain management systems and the brand’s fundamental uniform costs. Such an uncontrollable management system draws contradiction between having brands that represent values offered by luxury hotel properties to guests and higher costs and fees associated with the management system and maintenance, which are inefficient uses of resources compared to independent hotels. Therefore, luxury hotels should make strategic decisions about operation efficiency according to foundational conditions (management system and fixed costs and expenses) and operational characteristics (relative price position and RevPAR/TRevPAR rates).
Conclusion
Theoretical Contributions
This study makes several theoretical and methodological contributions to existing hospitality management and RM literature. The current study is the first to reveal significant differences in operational characteristics, such as revenue and sales between luxury hotels and non-luxury hotels. Measuring and monitoring performance has become critical in the hospitality industry (Schwartz et al., 2016). Prior RM research (e.g., Claver-Cortés et al., 2007) demonstrates that hotel firms’ characteristics such as size, service level, strategies, and management types significantly affect performance (e.g., OCR, RevPAR, GOPPAR). This study reaffirms the need for a profitable and efficient sales mix of luxury hotel properties in designing quality sales strategies with marketing mixes. The study not only includes traditional hotel performance metrics (RevPAR, ADR, OCC) but also contains proportions of revenues from different business units (room, food, beverage, spa, other). This study clarifies how luxury hotel firms have a unique sales mix by taking into account these aspects. It also highlights how luxury hotel firms are different from non-luxury hotel firms regarding sales mix, the contribution of revenues other than room revenues, and the operating profit generated by an available room. By including detailed revenue data, this study contributes to the body of literature that embraces luxurification, product diversification and experience customization, and marketing strategies for luxury hotel firms (Kotler et al., 2017; Yeoman & McMahon-Beattie, 2006).
Consumer expectations for luxury hotels are higher and more diverse than those for non-luxury hotels, and hotel management should reflect these variations. Some research even suggests that luxury hotels’ expectations should be differentiated from non-luxury hotels’ expectations (Zhang et al., 2011). Vigneron and Johnson (2004) presented the framework of a luxury brand, including non-personal perceptions (conspicuousness, uniqueness, and quality) and personal perceptions (hedonic and extended self). The current study is consequential in that, by empirically testing the diversification strategies for luxury hotels suggested by previous studies, it provides an additional efficiency approach that prior research lacks. This study also utilizes the resource-based theory (Wernerfelt, 1984) with an efficiency perspective to effectively explain the overall industry and luxury hotel competition.
This study provides a sophisticated multiple-method approach by developing research propositions based on theoretical and empirical methods for RM and operational efficiency. The study empirically tests them through DEA and Tobit regression analysis. DEA identifies critical dynamics of luxury hotel firms’ businesses and critical characteristics affecting performance and operational efficiency for business improvement and benchmarking. More importantly, slacks analysis and Tobit regression analysis provide a comprehensive and holistic view of RM and hotel efficiency management in the luxury hotel market. Five exogenous variables under the censored model were tested to identify factors affecting efficiency. By integrating operational characteristics and pricing strategies unrelated to the DEA input and output variables into a Tobit model approach in the second stage, the current study proposes and empirically tests global operational efficiency factors. The inclusion of relative price position and RevPAR/TrevPAR rates as operational characteristics is the first attempt in operational efficiency estimation. This inclusion widens the literature body in luxury hotel operation, management, and strategies for productivity and efficiency from pricing. Therefore, this study’s two-step approach provides interesting and valuable findings and new theoretical and methodological lenses that suggest the usefulness of performance measures (e.g., GOPPAR and OCC) and discover operational efficiency factors (S. Lee et al., 2019).
Practical Contributions and Implications
Research findings suggest that luxury hotel firms must build and promote a complex sales mix that integrates rooms, F&B, and wellness amenities. Guests’ expectations on diversified services and products determine luxury hotel positions, and management can meet these preferences by strategizing seamless service quality and multiplied benefits from heterogeneous functions. This study provides insight into optimizing inputs and outputs to operate a complex sales mix efficiently. Competitive sets provide pragmatic interpretations based on luxury market characteristics that help managers strategically and efficiently optimize their output by maintaining a complex sales mix and promoting it to customers. Furthermore, RM managers and RM system developers can enhance existing RM systems by considering complex marketing and sales mix to improve hotels’ financial performance (Guadix et al., 2010; Xu et al., 2019). This study helps luxury hotel managers understand and build innovative performance and benchmarking metrics and strategies derived from strategic RM, hotel efficiency management, and relative pricing strategies. The luxury hotel market has a unique nature, and its consumers have different consumption behaviors (Yang et al., 2016; Yang & Mattila, 2016, 2017). Management can make calculated RM decisions by considering alternative performance and operational efficiency measures, enabling luxury hotel managers to make timely informed decisions (Schwartz et al., 2016).
To improve room-relevant revenue, supplementing sales should be highlighted, such as mini-bars, room services, and internet services. Many resorts currently adjust fees to support room revenue weaknesses by bundling Wi-Fi, laundry, parking, and complimentary drinks. Findings also indicate a need for employing experiential marketing strategies. Management can assume that guests will add value to their hotel visit, and integrated resorts highly value restaurants, bars, clubs, shopping areas, and theaters. Luxury hotel firms could selectively adopt different service units to customize guest experiences that can be evaluated by guests’ expectations, needs, and wants. Moreover, luxury hotel firms need to communicate and promote additional revenue sources when attracting guests. Owing to property-based business characteristics, management should diversify revenue sources and maintain a safely moderate room revenue reliance. To do so, luxury hotel firms need to increase the length of stay, average spending, and total RevPAR by promoting auxiliary services to prospective guests and providing exclusive restaurant and wellness deals to current guests.
In addition, the return-on-scale region (increasing/decreasing) provides practical viewpoints on the application of DEA results. As discussed, choosing strategic goals based on IRS and DRS could entail different approaches to inefficiency issues. Hotel practitioners can employ such differences in their operational decision-making process by reaffirming that they have invested current resources as inputs and established operation goals stemmed from current outputs. Not only inputs but also other operational characteristics and strategies significantly affect operational efficiency. This study demonstrated the practical significance of luxury hotel properties’ pricing strategies by appraising relative price positions. Industry practitioners can comprehensively restructure an input–output conversion process with the most beneficial pricing strategies that promise the best operational efficiency.
Finally, this study performed slack analysis to quantify input gaps to generate promising outputs and become an efficient frontier. Each input slack value provided detailed and realistic guidance to practitioners when setting strategic goals based on business efficiency. Furthermore, considering that the hotel industry is currently struggling due to the COVID-19 crisis, practitioners can use comprehensive guidelines from the DEA and Tobit approaches with practical slack values to achieve the most efficient business model to sustain the operation beyond the pandemic.
Limitations and Future Research
This study has several limitations that warrant future research streamlines. First, the multi-stage DEA approach in this study was applied only to luxury hotel properties. Although this study conducted preliminary tests regarding operational differences between luxury and non-luxury hotel properties, it only used 37 fully equipped luxury hotel properties due to data availability and DEA’s purpose. However, future studies can explore an empirical analysis of different performance measures for non-luxury hotel properties’ operational efficiency since hotel tiers and other operational characteristics provide critical business strategies and implications for operational efficiency improvements.
Another limitation is that this study employs only internally managed operational factors and characteristics. However, additional operational and environmental factors may provide a better understanding of future efficiency and best strategies to accomplish business goals. It would be a valuable endeavor for future studies to explore global differences in market demand and supply, uncontrollable situational factors and risks (e.g., COVID-19, economic recessions, natural disasters), and other socio-economic-cultural factors (e.g., population, security and safety, market prices, employment rates). It would also be worthwhile to consistently collect data and perform multiple-factor analysis to capture market changes and dynamics.
A third limitation of the current study is that it suggests the best efficient business model based on the performance, but it lacks further analysis regarding external factors’ subjective effects. The study omitted customer and brand-related intangible assets, such as consumer expectations, values, evaluations, brand images, and reputations. A subsequent study on consumer hotel perceptions is needed to predict and utilize long-term performance. For example, a study using difference analysis, structural equation modeling, and choice experience modeling could provide customer behavior insight regarding purchase decisions and payable prices.
Finally, this study mainly used the DEA model for efficiency score computation on the basis of linear programming (Figure 1). Due to the US luxury hotel markets’ homogeneity, DEA could be a proper approach to measuring efficiency and productivity. Upcoming studies could apply the Stochastic frontier model for a non-linear model, which allows estimation flexibility. In particular, it can use a regression analysis where the error term consists of a random error, and an inefficiency term can estimate the production and cost functions.
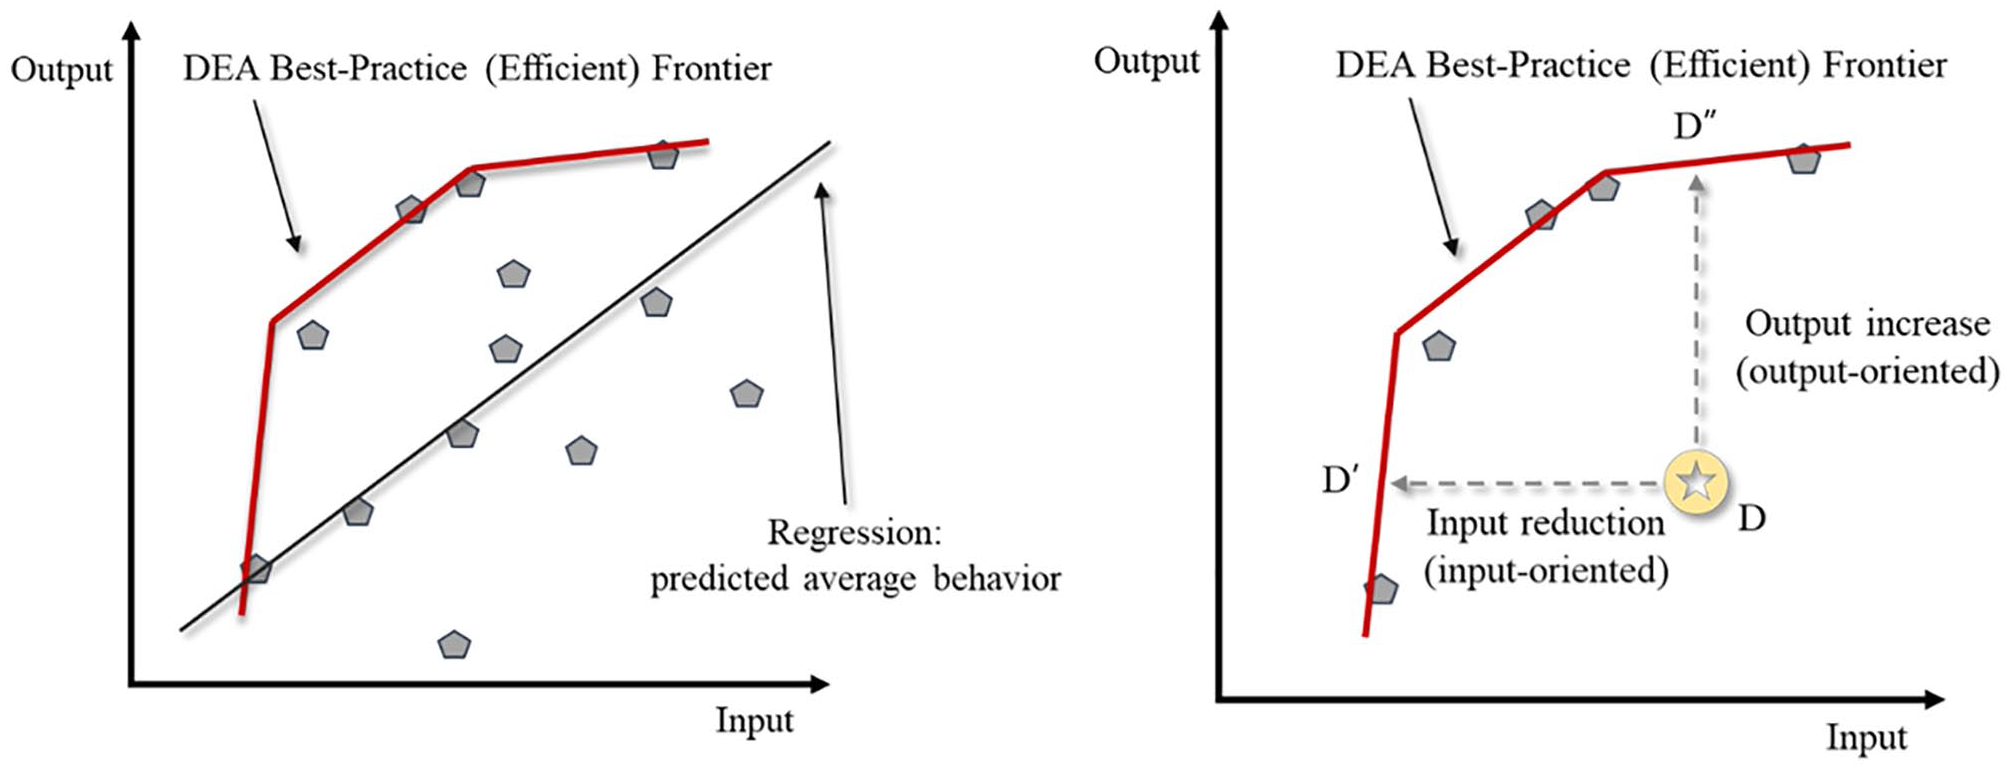
DEA Models and Variable Returns-to-Scale.
Footnotes
Declaration of Conflicting Interests
The author(s) declared no potential conflicts of interest with respect to the research, authorship, or publication of this article.
Funding
The author(s) received no financial support for the research, authorship, or publication of this article.