
Abstract
Because individual listing data for Airbnb typically are not publicly available, private companies have emerged to estimate the performance of Airbnb listings. The implicit assumption of a growing number of academics, policymakers, and consultants is that Airdna’s performance measures are directly comparable with those of STR. We argue that Airdna’s measures of Occupancy, Average Daily Rate (ADR), and Revenue per Available Room (RevPAR) do not conform to industry standards and exhibit significant bias. We expand available evidence by explicitly quantifying the sources and magnitude of the biases for Airdna’s performance measures for Airbnb listings. Using Airdna’s individual listing data for Virginia between the first quarter of 2015 and the 4th quarter of 2019, we find, on average, Airdna’s performance measures for Occupancy, ADR, and RevPAR were biased upward by 60 percent, 78 percent, and 179 percent, respectively.
Keywords
Introduction
The remarkable growth of Airbnb over the previous decade has generated a significant amount of interest from academicians, policymakers, and the popular press. Whether and under what conditions localities should legally allow short-term rentals remains a matter of contentious debate; a debate that often relies on data regarding the performance of Airbnb properties. Detailed data from Airbnb regarding property performance, however, are not readily available, 1 creating an opportunity for private firms that harvest public-facing data to estimate the performance of Airbnb listings. Airdna is widely considered to be a leading purveyor of Airbnb listing data and provides a valuable service to those without direct access to Airbnb listing data. Questions, however, remain about how Airdna calculates its measures of Average Daily Rate (ADR), Occupancy, and Revenue per Available Room (RevPAR), whether these measures conform to industry standard, and the extent of bias (if any) (Agarwal et al., 2019). 2
In this paper, we replicate and extend the literature with regards to Airdna’s performance measures. We find, consistent with the literature, that the use of booked listings (properties that are rented at least one night a month) instead of available listings (properties that are active, available for rent, and may or may not be rented during a given month) inflates measures of occupancy and RevPAR. We extend the literature by identifying and quantifying an additional source of bias: the use of listings nights instead of listing room nights. Airdna explicitly assumes that the number of rooms in each Airbnb listing is equal to one and uses listing nights to determine measures of occupancy, ADR, and RevPAR. This assumption, however, is not supported by the available evidence and introduces another source of bias. Given a growing number of studies use Airdna data without adjustment, this question is timely and pertinent to the debate in the literature on the determinants and impacts of short-term rentals.
We estimate the extent of these biases using data for Virginia from the fourth quarter of 2014 to the fourth quarter of 2019. We explicitly exclude data for 2020 due to the impact of COVID-19 on the short-term rental industry in the United States. We find Airdna’s performance measures for Occupancy, ADR, and RevPAR were biased upward by 60%, 78%, and 179%, respectively, for Virginia for this period. The magnitude of these biases is not trivial and renders a direct comparison of Airdna’s performance measures with those of STR difficult without adjustment.
Our purpose is not to cast aspersions on Airdna, a private firm that provides a valuable service and can choose to define its performance measures as it seems fit. We applaud Airdna for its willingness to discuss with us its data and the methodological foundations of its public-facing performance measures. However, we demonstrate that an increasing number of analysts and decision makers implicitly assume that Airdna’s performance measures are directly comparable with those of STR. Given Airdna’s dominant position in the Airbnb performance measurement marketplace and recent expansion into providing data on HomeAway listings, it is important that those using these data understand that Airdna often defines variables in a manner inconsistent with definitions accepted and used by respected sources such as STR.
The remainder of the paper is structured as follows. In the next section, we briefly review the extant literature on the use of Airdna data to examine the performance of Airbnb. In the third section, we discuss the methodological differences between Airdna’s and STR’s measures. We use Airdna data for Virginia to illustrate the magnitude of the potential biases. The concluding section places our findings in context and offers suggestions on how to correct for these biases.
A Brief Review of the Literature
Many of the previous analyses of the impact of Airbnb have relied on user experience surveys (Guttentag & Smith, 2017), the scraping of Airbnb’s public-facing data at specific periods of time (Ert et al., 2016; Fang et al., 2016; Zervas et al., 2015, 2017), or obtaining access to Airbnb’s proprietary data (Farronato & Fradkin, 2018; Fradkin et al., 2018). However, user experience surveys may not be replicable because the surveys are sensitive to geographical location and time period. Studies that utilize public-facing data may be constrained in terms of their ability to track the performance of properties across time. The results may also not be replicable because public-facing Airbnb data changes across time. Finally, while proprietary Airbnb data are obviously preferred, these data are not yet widely available and thus cannot be replicated by researchers who do not have access to Airbnb listing data.
A growing number of popular press articles, consulting studies, and peer-reviewed manuscripts rely on Airdna data to estimate Airbnb activities. Airdna data are used to examine host characteristics, including noting differences between Airbnb and couch surfing hosts (Jung et al., 2016). Airdna data are also used to examine if obtaining and maintaining reputable ratings is important for “superhosts” (Gunter, 2018). In London, Phoenix, and Sydney, Airdna data (not surprisingly) suggest that the number of listings is highly correlated with distance from the urban core (Pettit et al., 2018). In these cases, Airdna data may prove useful and reasonably reliable as these studies rely on the characteristics or absolute number of listings rather than the performance of listings.
Airdna data have been used to examine the development of Airbnb in the United States and other countries, to include Austria (Gunter & Önder, 2018), Canada (Sovani & Jayawardena, 2017), France (Cui & Hu, 2018; Heo et al., 2019), Hungary (Boros et al., 2018), Italy (Rubino & Coscia, 2019), the Netherlands (Boswijk, 2017; Ioannides et al., 2019), and South Africa (Visser et al., 2017), among others. HVS (Hotel Evaluations and Appraisals) employed Airdna data to estimate the impact of Airbnb on the New York City lodging market and found that Airbnb poses a significant threat to hoteliers’ revenues (HVS, 2015). CBRE (Commercial Business Real Estate) found that Airbnb not only is growing rapidly in major metropolitan areas, but also concluded that in some localities, Airbnb ADR exceeds hotel ADR (Lane & Woodworth, 2016).
A growing number of studies employ Airdna data to investigate the impact of Airbnb on the traditional lodging sector, long-term rentals, and employment, among others (Dell et al., 2017; Destefanis et al., 2020; Gibbs et al., 2018; Horn & Merante, 2017; Kwok & Xie, 2019; Mody et al., 2017; Xie & Kwok, 2017; Xu et al., 2019). Increases in the density of Airbnb rentals appear to place upward pressure on rents in major French cities, although the authors used booked listings instead of available listings as a measure of supply (Ayouba et al., 2019). In Paris, Airbnb does not appear to be in direct competition with traditional hotels, although the authors explicitly assume that an entire place listing is one room, regardless of the actual number of physical bedrooms (Heo et al., 2019). Airbnb listings appear to affect ADR but not hotel occupancy (Dogru, Mody, et al., 2020) and RevPAR (Dogru, Hanks, et al., 2020). Many of these studies appears to use Airdna performance data without adjustment.
Comparing Methodologies: When Is a Listing a Listing?
Airbnb defines an
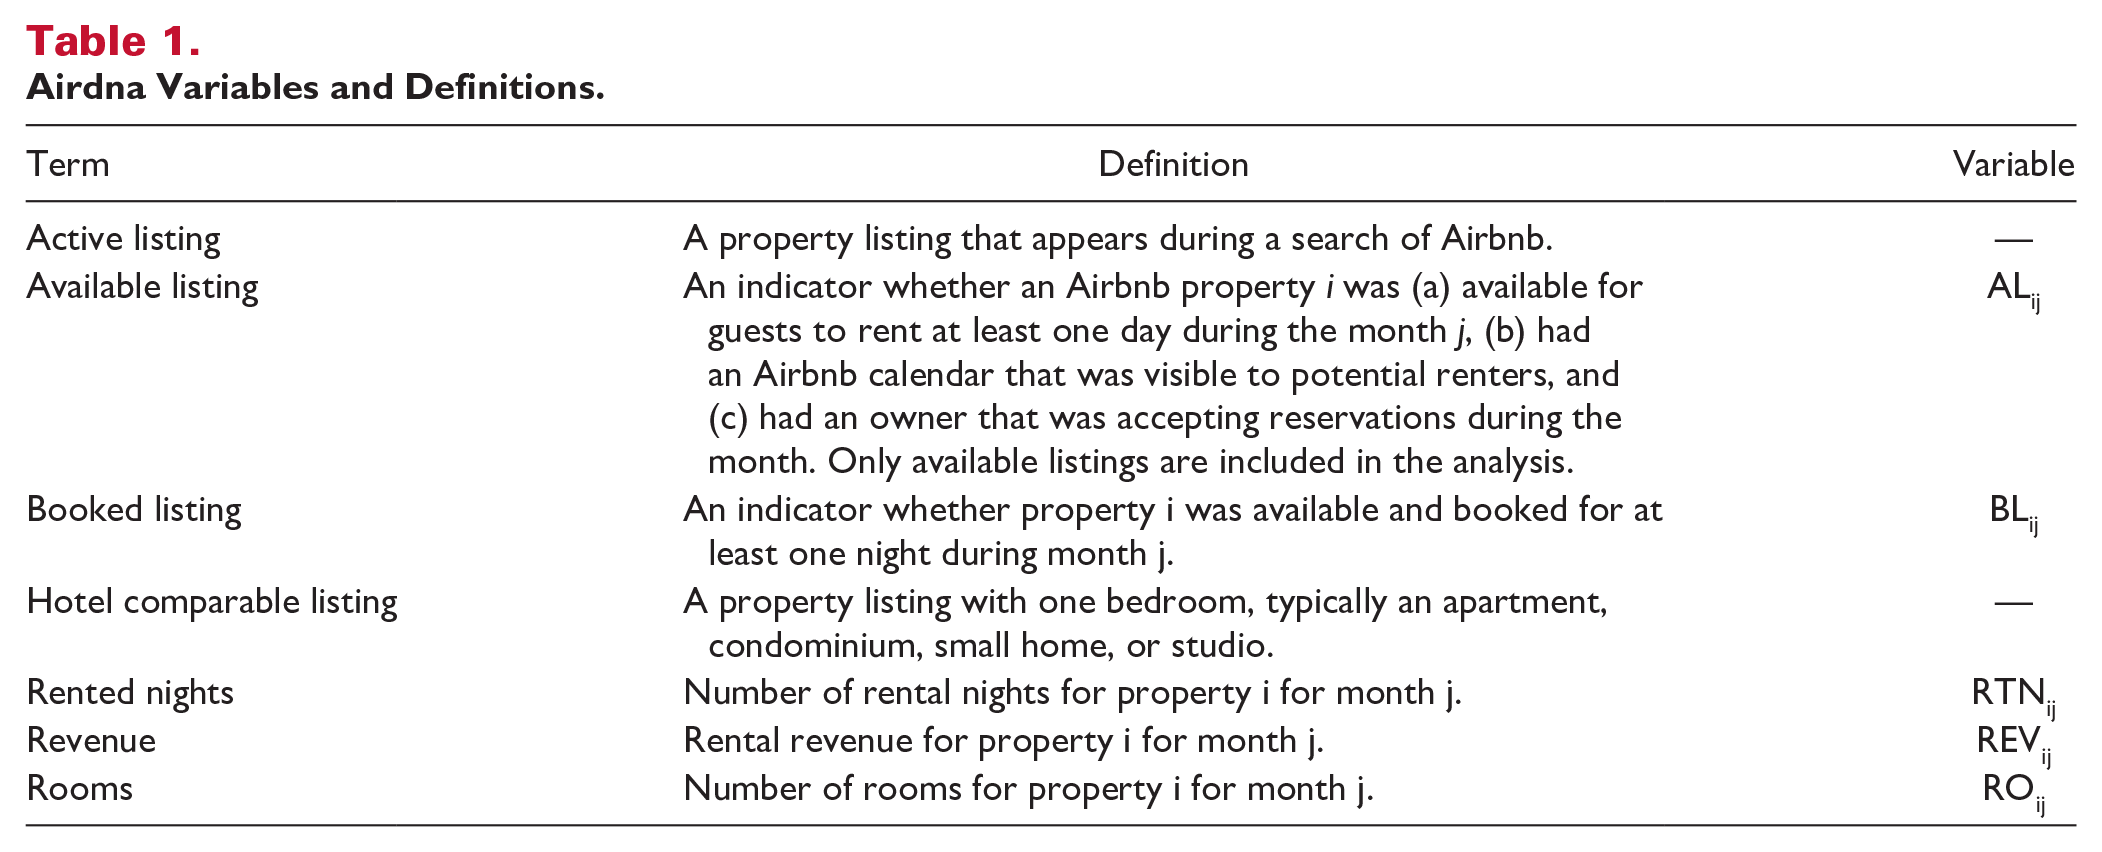
Airdna Variables and Definitions.
Calculated Variables and Definitions.
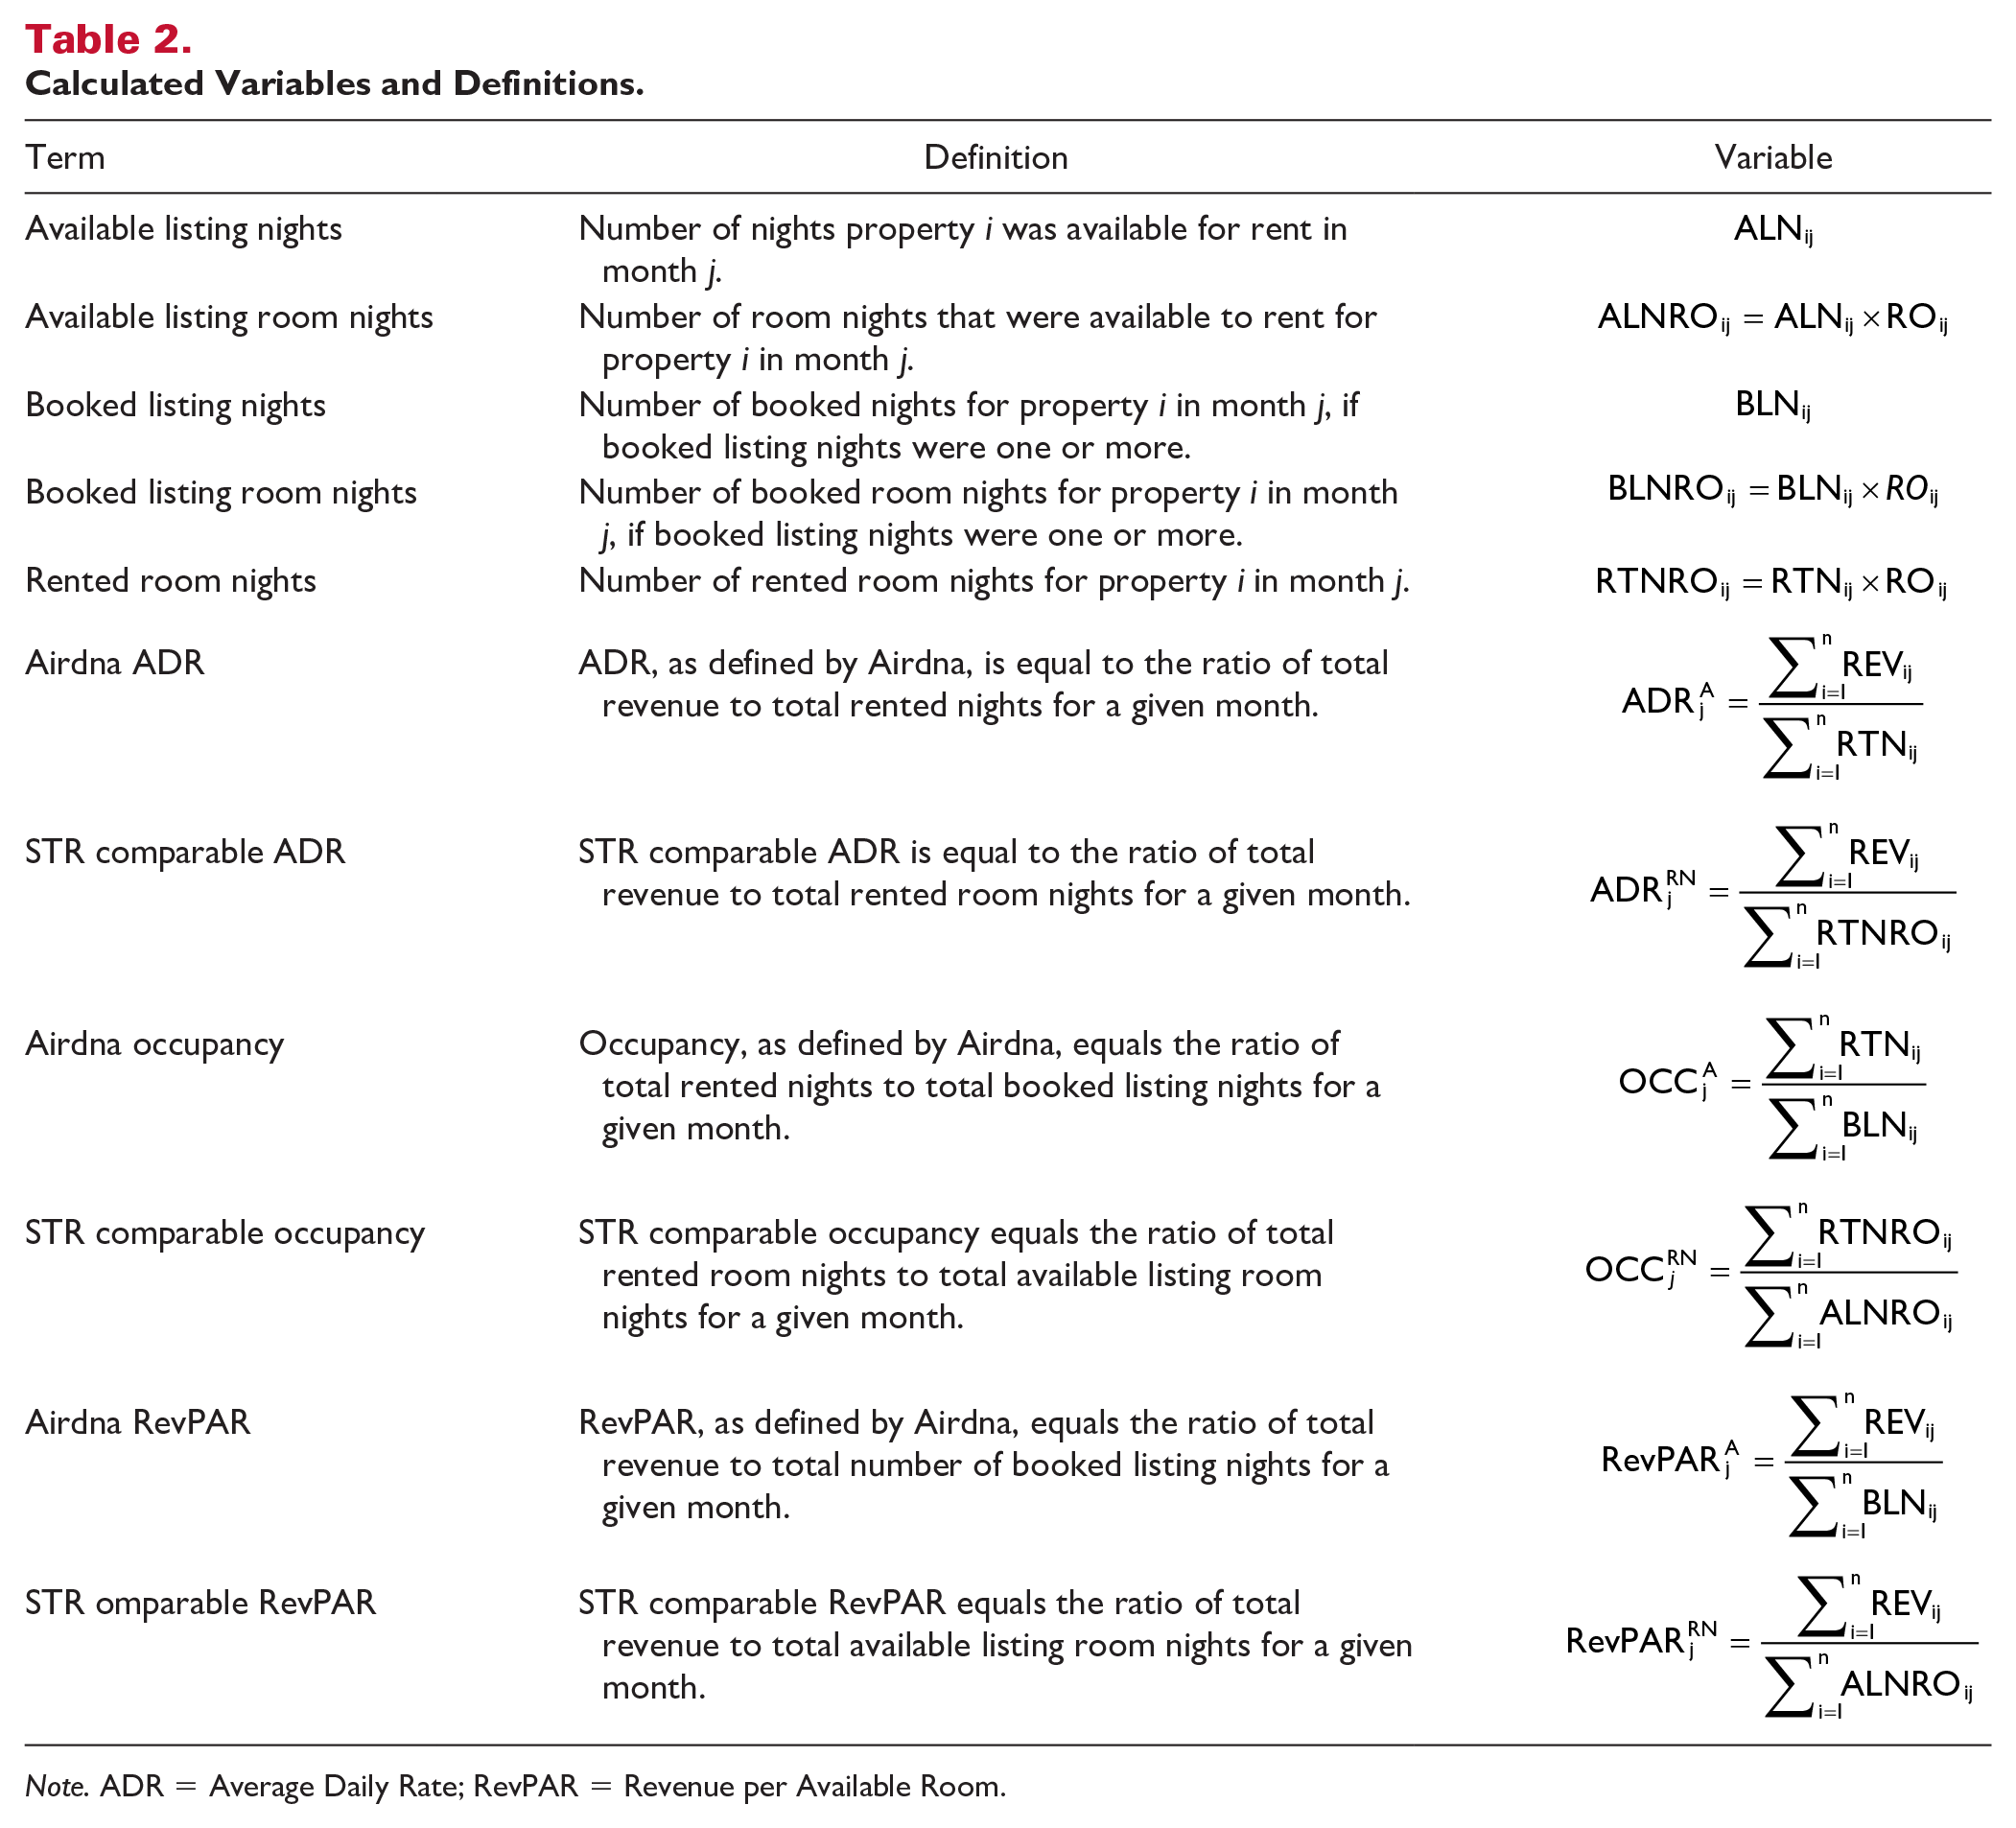
Note. ADR = Average Daily Rate; RevPAR = Revenue per Available Room.
From the set of available listings, Airdna estimates which properties have at least one reserved night in a month and classifies these properties as
The number of
Even if one were to ignore the potential bias introduced through the use of booked listing nights instead of booked listing room nights, there is another source of potential bias. The industry standard for measuring market supply is the number of available rooms in each period, regardless of whether rooms were booked or unbooked during this time. We argue that the measure comparable to the industry standard should be
Table 3 compares estimates of all available and booked listings, excluding shared rooms, 4 in Virginia from the first quarter of 2015 to the fourth quarter of 2019. 5 Of the 14,770 available listings in the fourth quarter of 2019 in the Commonwealth, for example, Airdna determined that 12,822 available listings were booked and should be included in the analysis. This methodological decision reduced the supply of available listing nights in Virginia from 383,813 to 336,836 for the fourth quarter of 2019. If we examine available listing room nights, the difference becomes even more apparent. Using Airdna’s approach, we estimate that available listing room nights in the fourth quarter of 2019 for Virginia were 697,733. On the other hand, if we use the industry standard of including booked and unbooked listings in the estimate of market supply, there were 787,863 available listing room nights in this period, a difference of 90,129 room nights.
Average Quarterly Airbnb Listings in Virginia First Quarter 2015 to Fourth Quarter 2019.
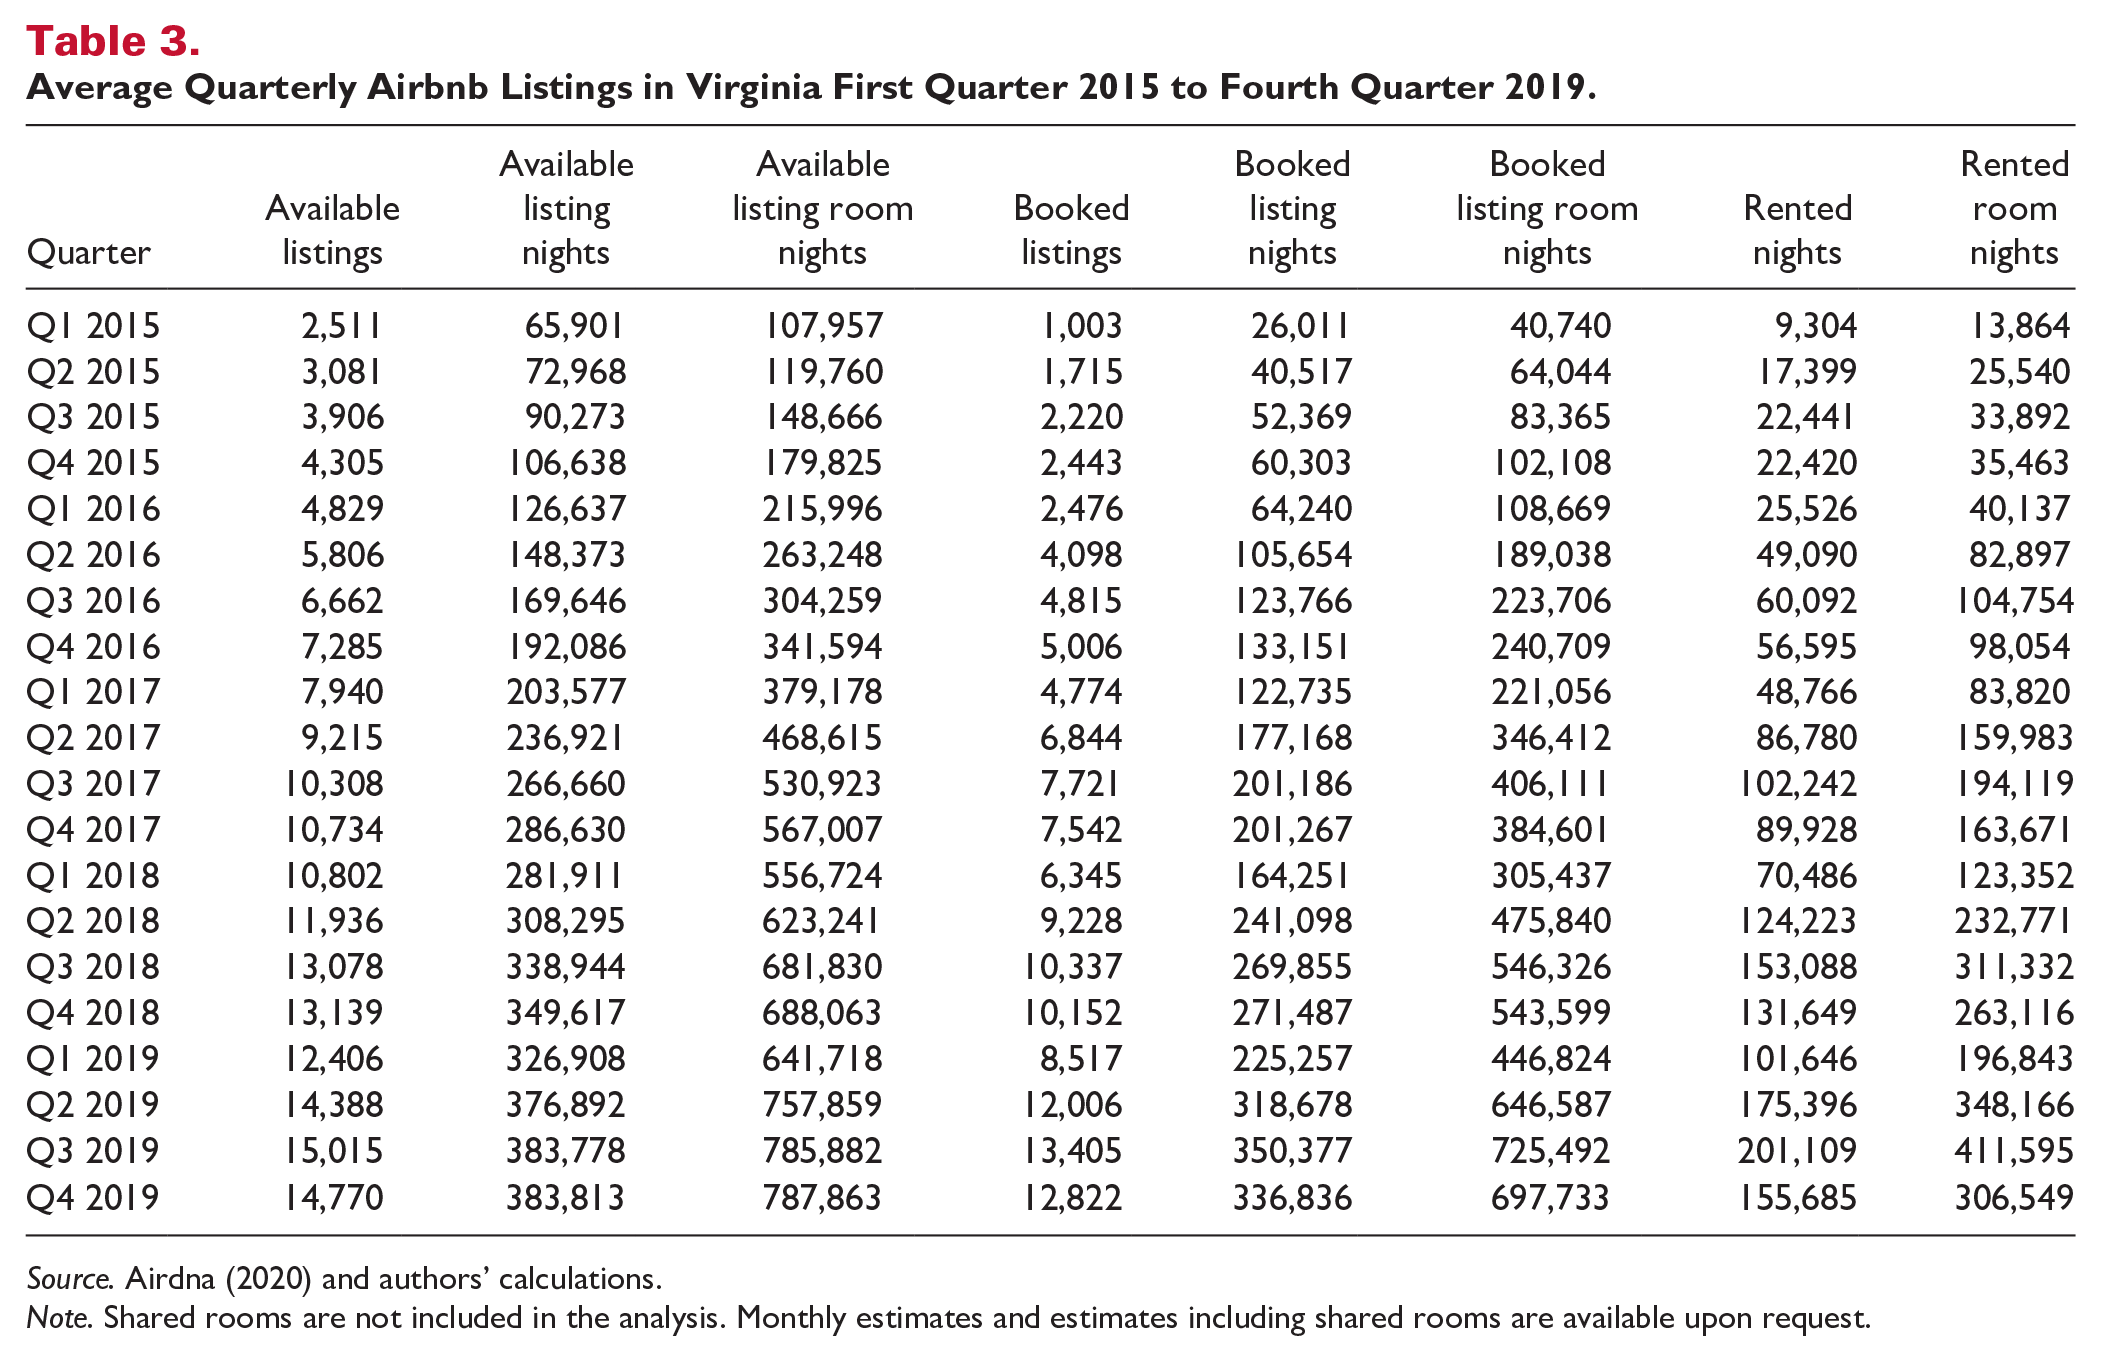
Source. Airdna (2020) and authors’ calculations.
Note. Shared rooms are not included in the analysis. Monthly estimates and estimates including shared rooms are available upon request.
A potential critique of our argument is that the booking process of Airbnb is different than the traditional lodging industry in that the owner must accept the reservation request. If the owner rejects the request, then the listing is available to be booked but is not truly available. It is entirely possible that owners could forget to block dates in the reservation calendar, change their minds upon receiving a reservation request, or engage in outright discrimination and reject the reservation. However, this would have to occur thousands of times of year (or more) to explain the difference between available listings and booked listings if one were to accept the arguments that booked listings constitute a more appropriate measure of supply. Without more detailed information from Airbnb on how many reservation requests are made and then rejected by owners, we cannot answer the question with complete certainty. We ask the reader to keep this potential (though highly unlikely) caveat in mind.
Comparing Methodologies: ADR, Occupancy, and RevPAR
Airdna estimates ADR as the ratio of total revenue to total rented nights (Equation 1). We argue, however, that for ADR for an Airbnb properties to conform to industry standard, it should be equal to the ratio of total revenue to total rented room nights (Equation 2). These measures are only equivalent if all properties have one room for the month in question, otherwise Airdna’s ADR measure is biased upward:


Airdna estimates occupancy in each month as the ratio of rented nights to total booked listing nights (Equation 3). As with ADR, we argue that this measure does not conform to the industry standard as STR defines occupancy as the ratio of rooms sold (rented) to rooms available. We argue for occupancy should be equal to the ratio of rented room nights to available listing room nights (Equation 4). Airdna’s occupancy measure only conforms to the industry standard if the number of rooms are equal to one across all properties and if the number of booked listing nights is to the number of available listing nights:


Finally, Airdna defines RevPAR as the ratio of total revenue to total booked listing nights (Equation 5). We argue that RevPAR should be the ratio of total revenue to total available listing room nights and that our measure conforms more closely to industry standard. As noted previously, the exclusion of unbooked listings and the assumption that listings only have one room understate market supply. For the subset of properties with one room, this assumption may be tenable, but for the majority of properties, this assumption would appear to bias Airdna’s RevPAR measure upward:

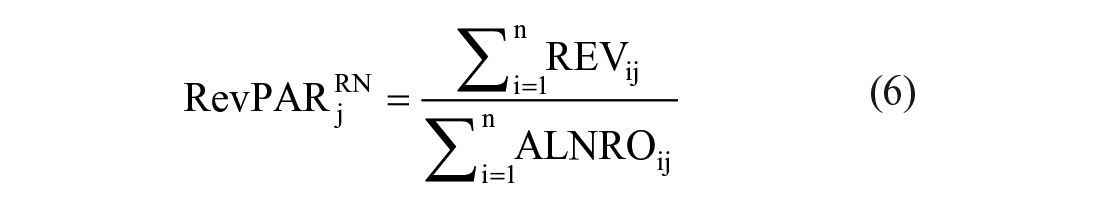
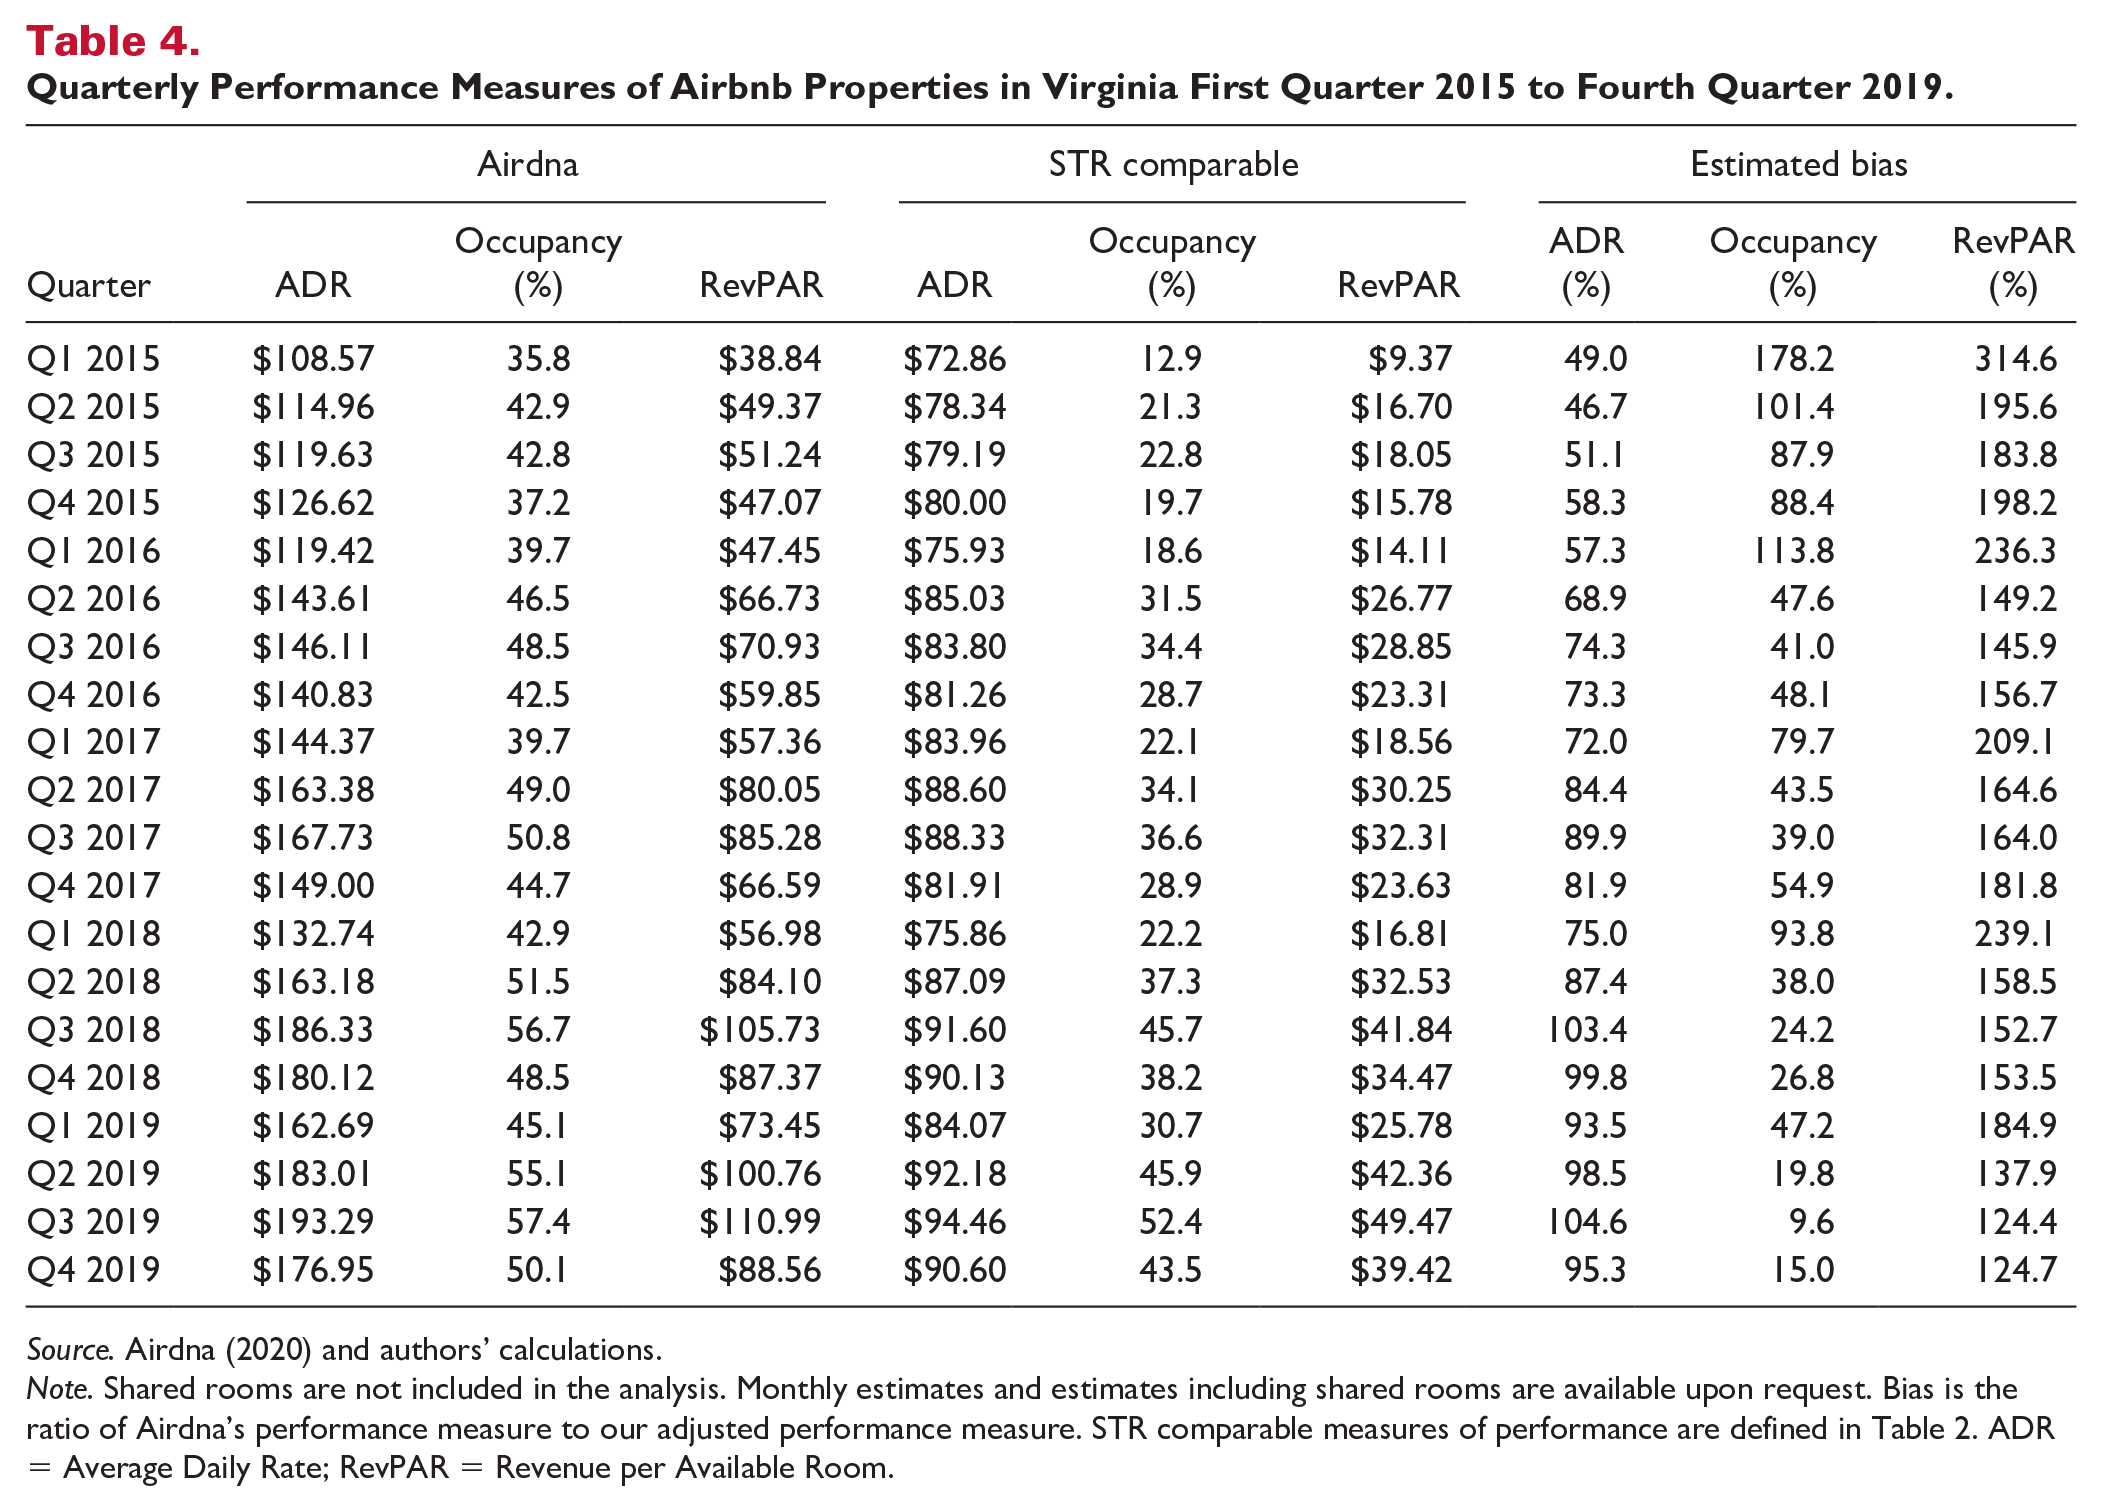
Table 4 provides a comparison of the performance measures. We find that, on average, between the first quarter of 2015 and the fourth quarter of 2019, occupancy was biased upward by 59.9 percent, ADR was biased upward by 78.2 percent, and RevPAR was biased upward by 178.8 percent. Our argument is straightforward: to compare the performance of Airbnb properties with traditional hotel properties, one must account for the variations in methodology.
Quarterly Performance Measures of Airbnb Properties in Virginia First Quarter 2015 to Fourth Quarter 2019.
Source. Airdna (2020) and authors’ calculations.
Note. Shared rooms are not included in the analysis. Monthly estimates and estimates including shared rooms are available upon request. Bias is the ratio of Airdna’s performance measure to our adjusted performance measure. STR comparable measures of performance are defined in Table 2. ADR = Average Daily Rate; RevPAR = Revenue per Available Room.
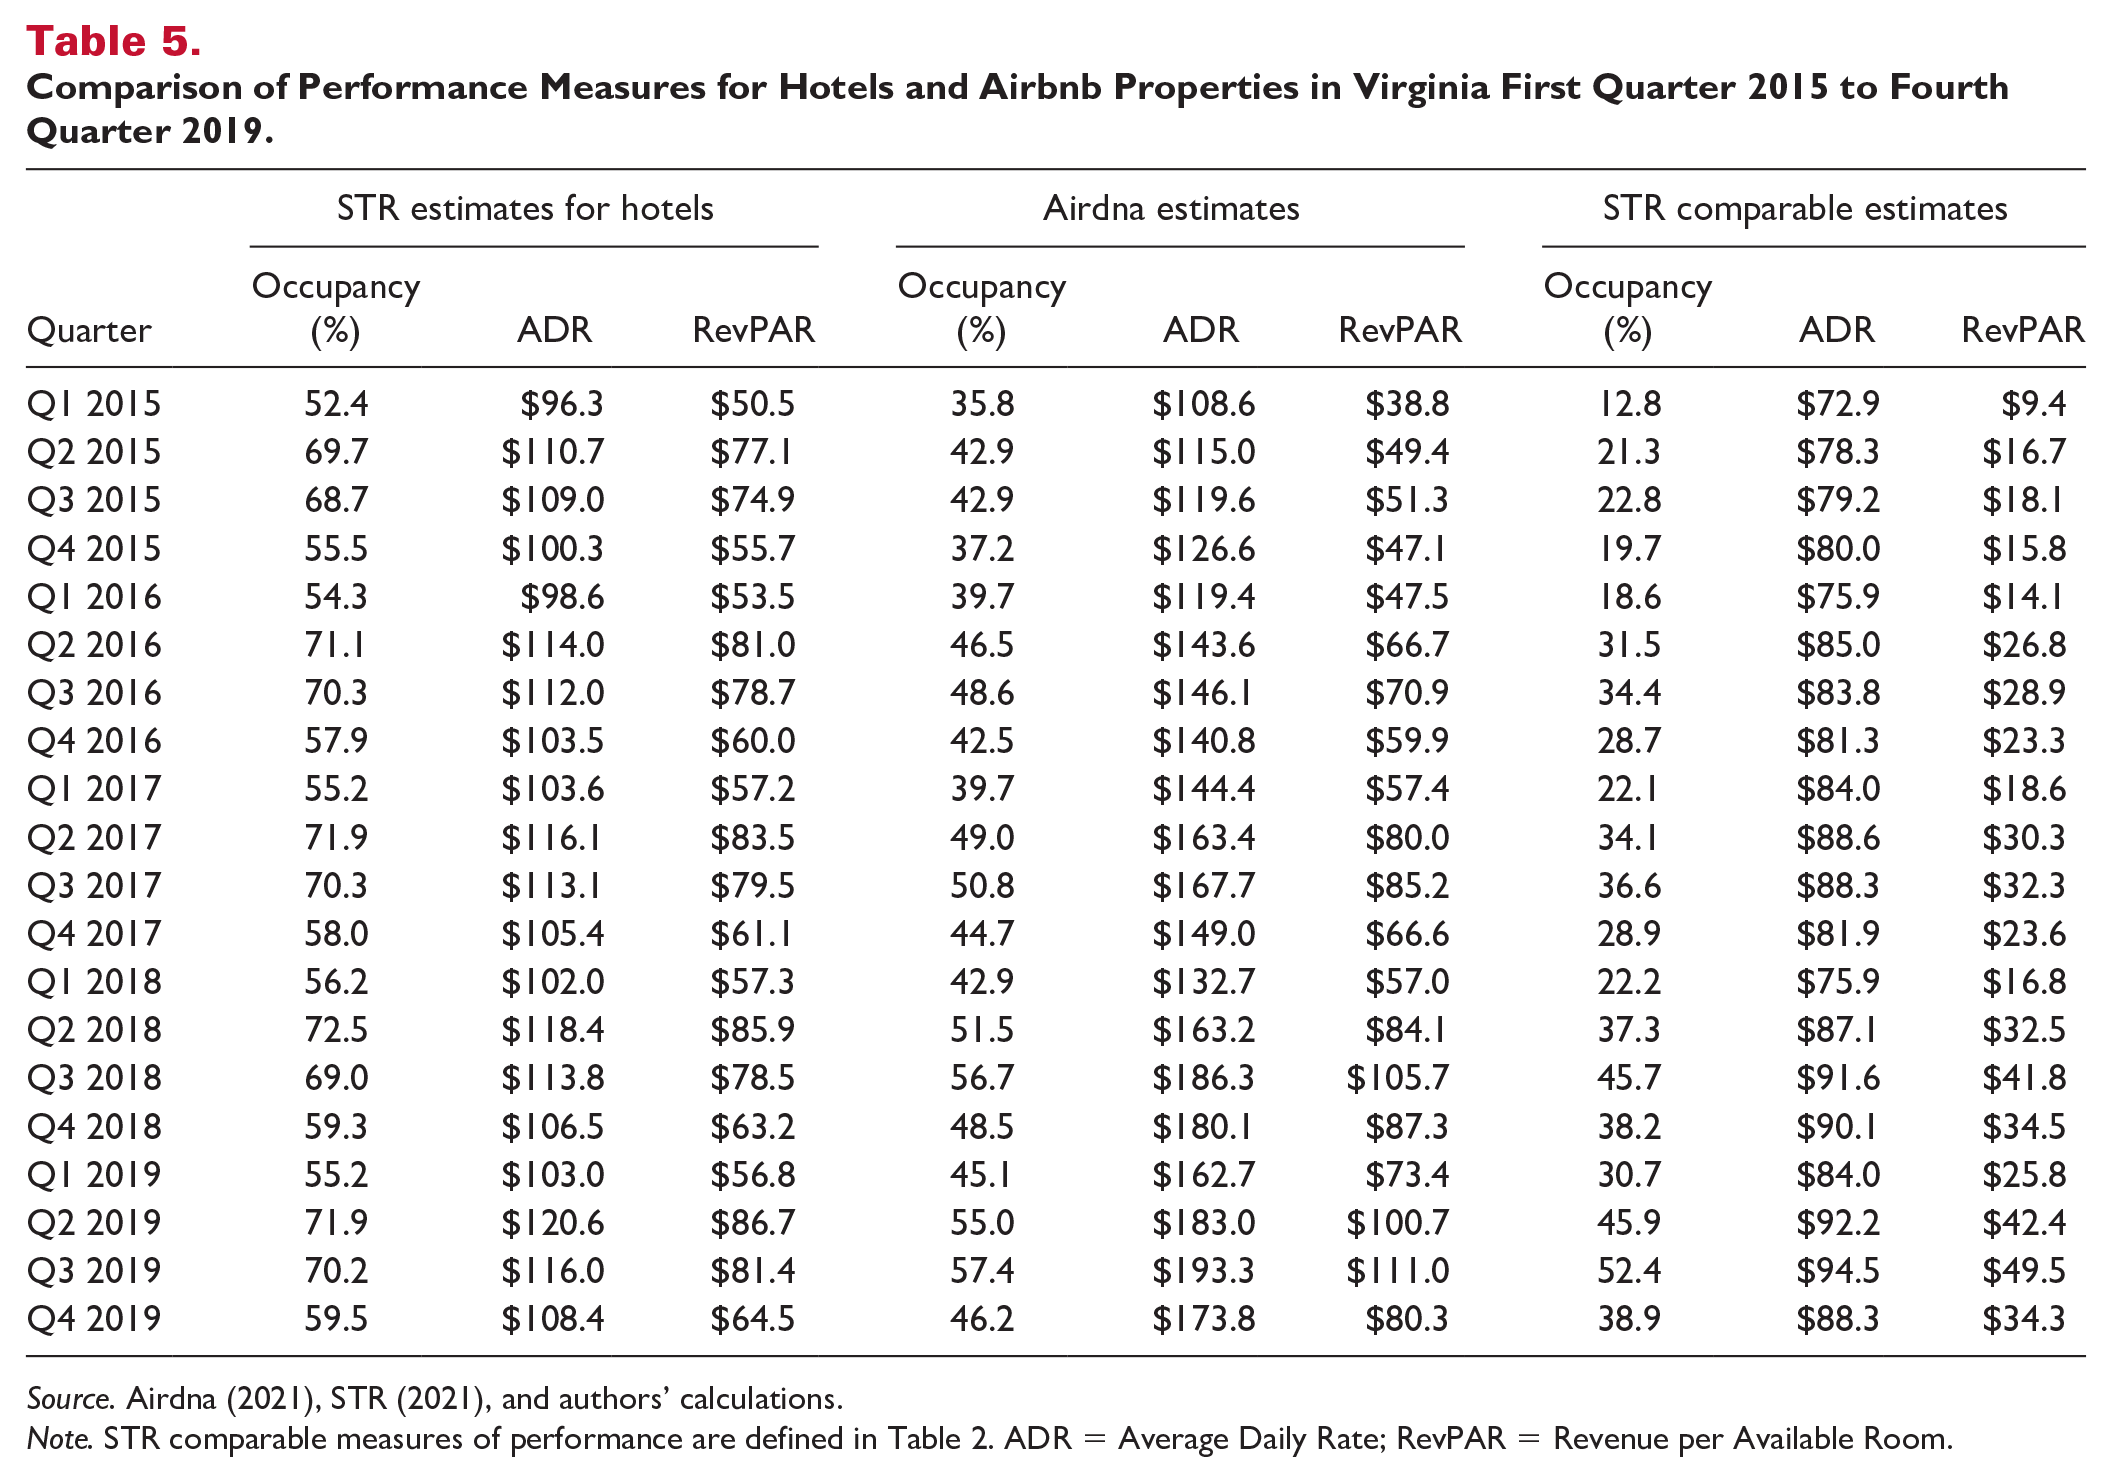
Table 5 displays occupancy, ADR, and RevPAR for Airbnb properties and hotels for Virginia from the first quarter of 2015 through the fourth quarter of 2019. We provide Airdna’s and our estimates of Airbnb’s performance for this period. A direct comparison of the performance measures provided by STR and Airdna might lead one to conclude that Airbnb listings outperform, on average, the hotel industry with respect to ADR and RevPAR. Yet, we have argued that these measures are not directly comparable and may lead to a spurious conclusion regarding the performance of Airbnb listings. When we account for the exclusion of unbooked listings and account for the difference between room nights and nights, we obtain estimates of Airbnb performance that are directly comparable to the STR measures. We find that the traditional lodging industry, on average, outperformed Airbnb for Virginia for the sample period. Accounting for the significant upward bias produces a markedly different conclusion.
Comparison of Performance Measures for Hotels and Airbnb Properties in Virginia First Quarter 2015 to Fourth Quarter 2019.
Source. Airdna (2021), STR (2021), and authors’ calculations.
Note. STR comparable measures of performance are defined in Table 2. ADR = Average Daily Rate; RevPAR = Revenue per Available Room.
Concluding Thoughts
We acknowledge that Airdna and similar firms provide a valuable service in the absence of publicly available data on the operations of Airbnb. Academicians, policymakers, and other interested parties must have information to assess accurately the potential impact of Airbnb on traffic, noise, tax collections, crime, hoteliers, neighborhood rents, and other questions of interest. While other methods might be employed to generate data, as it stands, Airdna and similar firms provide valuable aggregated data on market conditions that are readily accessible to interested parties.
In this paper, we have extended the literature regarding the substantial bias in Airdna’s performance measures of Airbnb listings. Our concern is that many who use Airdna’s performance measures assume that these measures are directly comparable to the widely accepted standard measures of hotelier performance. We have demonstrated that these measures are, in fact, not directly comparable and that, when one adjusts Airdna’s measures to adhere to standard definitions of occupancy, ADR, and RevPAR, these performance measures are significantly lower than reported by Airdna, especially for multi-room properties.
It is not our intent to discourage interested individuals from using Airdna’s data because the firm provides a valuable service. Instead, we contend that Airdna should provide measures of performance that are directly comparable to STR’s long established definitions and data. In the interim, we strongly suggest that researchers and other parties adjust Airdna’s data to account for the biases noted in this paper. We conclude the use of booked listing nights by Airdna rather than available listing room nights is the primary channel through which the biases occur. Airdna provides individual listing data that typically contain information about the property type, number of bedrooms, number of reservation days, number of days the property was available for the month, and revenue generated. The data also include information on available and booked listings. Using these data along with the definitions in Table 2 demonstrates that our proposed adjustments are not only feasible but also produce metrics that are directly comparable with STR’s measures of ADR, Occupancy, and RevPAR.
In conclusion, researchers, analysts, and decision makers should take care to understand the properties of the Airdna data. It is important to exclude, for example, inactive listings from any analysis. Adjusting for methodological differences is necessary to directly compare the performance of Airbnb properties with the traditional lodging industry. Using individual listing data to examine the performance of Airbnb properties is highly recommended, especially if one wishes to directly compare the performance of traditional lodging firms and short-term rental hosts.
Footnotes
Declaration of Conflicting Interests
The author(s) declared no potential conflicts of interest with respect to the research, authorship, or publication of this article.
Funding
The author(s) received no financial support for the research, authorship, or publication of this article.
Notes
Addendum to “Airbnb’s Success: Does It Depend on Who Is Measuring?”
In continuing conversations with Airdna after the acceptance of the manuscript, we discovered that Airdna’s Airbnb listing data contains some listings that appear on the Airbnb platform and are simultaneously listed on the VRBO platform. We, and Airdna, are unable to separate these matched listings into those rented solely through the Airbnb platform and those rented solely through the VRBO platform. This finding does not affect our methodology or conclusions. It does, however, present an extra note on caution for users of Airdna data to analyze the performance of Airbnb listings and our findings should be considered an upper-bound on Airbnb’s performance.