
Abstract
Understanding the roles of tourism development in poverty reduction and livelihood capital through a microlens is essential to rural ethnic areas’ sustainable development. However, few assessment methods are available to unravel the complex relationships between these three facets, and gaps remain in measuring residents’ livelihood. Based on the sustainable livelihood approach, this paper first selected core components of the sustainable livelihood framework to construct an evaluation index system and then provided specific indicators and evaluative criteria. Taking villages in China’s Longji Rice Terraces as a sample case, this study employed objective approaches (e.g., the entropy weight method and gray relational analysis) to assess residents’ livelihood capital. The aim was to showcase the sustainability of this area’s livelihood through a microlens. Findings offer several important contributions. First, this study presents a reliable measurement development method and a set of evaluation criteria for sustainable livelihood in tourism contexts, including five forms of capital and 21 indicators. Second, local inhabitants were found to benefit from tourism development; their livelihood options were diversified, especially in terms of growing financial capital. Yet these benefits were not evenly distributed, with notable differences observed across communities. Third, farmers’ livelihood capability did not improve uniformly over time. These findings offer valuable insights for tourism and hospitality stakeholders and can help steer rural regions toward a path of prosperity and growth. Strategies for inspiring entrepreneurship should especially be considered. In closing, theoretical implications are discussed, and suggestions for future work are provided.
Keywords
Introduction
In 2022, 80% of the world’s poorest people lived in rural areas and relied on agriculture for their livelihoods and food security (Food and Agriculture Organization of the United Nations (UNFAO), n.d. -b). Any sustainable poverty-alleviation initiatives must integrate strategies that address the challenges facing agriculture and rural livelihood. The United Nations World Tourism Organization (UNWTO, n.d.) stressed that rural tourism holds promise for stimulating local economic growth and social change due to its complementarity with other economic activities, its contributions to GDP, and its role in job creation. Consequently, rural tourism is widely seen as a viable option for promoting less-developed regions (Croes & Vanegas, 2008; Liu et al., 2017; Salvatore et al., 2018). It is also considered a major means of poverty relief in countries such as China (Gao & Wu, 2017; Liu et al., 2017).
Although the benefits of tourism development may trickle down to the impoverished by contributing to economic growth, quantifying the correlation between tourism and poverty reduction—particularly by evaluating livelihood capital—remains difficult. The primary goal of this study is hence to develop more objective measures to assess tourism development performance in poverty-threatened rural areas from a person-centered perspective. Tourism has served as a catalyst for the development of remote indigenous areas, most notably through alternative tourism approaches such as pro-poor tourism, ethnic tourism, and rural tourism. Many up-and-coming destinations in emerging economies are characterized by a blend of indigenous communities, rural remote locations, and poverty-stricken areas. The site chosen for this study (i.e., Longji Rice Terraces) also meets these criteria.
Briefly, pro-poor tourism is integral to many sustainable development strategies in less-developed countries (Chok et al., 2007; Hall, 2007; Zhao, 2021). Typically falling under the umbrella of cultural tourism (Ishii, 2012; Yang et al., 2008), ethnic tourism centers around the distinctive practices and customs of indigenous or exotic communities (Moscardo & Pearce, 1999). Rural tourism refers to “a type of tourism activity in which the visitor’s experience is related to a wide range of products generally linked to nature-based activities, agriculture, rural lifestyle/culture, angling and sightseeing” (UNWTO, n.d.). Rural tourism activities take place in non-urban areas featuring low population density, landscape, and land use, which are dominated by agriculture and forestry, and a traditional social structure and lifestyle (Garrod et al., 2006; Lane, 1994; UNWTO, n.d.).
The lines between rural, ethnic, and pro-poor tourism often blur in economically challenged indigenous communities in remote areas of China. These circumstances create opportunities and challenges. For example, area residents stand to gain new livelihood options (Biddulph, 2015; Mathieson & Wall, 1982): greater investment in promising rural destinations brings job openings, allowing villagers to engage in hospitality and tourism services. However, ensuring equitable benefit distribution remains problematic, as emphasized by the UK’s Department for International Development (DFID, 1999) and Reid (2003). Careful consideration is thus crucial for maximizing tourism’s role in poverty reduction in these regions in an effort to guarantee its sustainability and long-term advantages. Most relevant research to this point has framed tourism from a macro (i.e., provincial- or national-scale destinations) perspective when investigating antecedents of poverty reduction. The sustainability of locals’ livelihood also merits attention at a community level (i.e., locals and their families). To the authors’ best knowledge, no unified framework is currently available with which to thoroughly examine sustainable livelihoods or to investigate the dynamic relationships among poverty alleviation, tourism, and sustainable development (Bires & Raj, 2020; Ko, 2005; Stone & Nyaupane, 2018). These research gaps motivated this study.
This paper applies the sustainable livelihoods framework (SLF), presented by the DFID and the United Nations Development Program (UNDP), to examine tourism’s roles in sustainable development, poverty reduction, and livelihood from a community perspective. SLF has been well recognized (Gao & Wu, 2017; Tao & Wall, 2009) and implemented in various studies (Chambers & Conway, 1992; Shen et al., 2008). However, it has been typically applied as a conceptual assessment system. This study takes a step forward by establishing a comprehensive evaluation index system that adopts a microlens perspective. The paper delineates evaluative criteria, indicators, and an analytical approach to assess the intersection of tourism development and poverty reduction in economically disadvantaged rural areas inhabited by indigenous populations.
Arguably, SLF is a framework developed by and for Western, industrialized countries. Its applicability to rural and ethnic tourism development, particularly in an emerging-market context (X. R. Li, 2016; Morris et al., 2023; Moscardo & Pearce, 1999), has not been adequately tested; in other words, its boundaries and generalizability have yet to be confirmed. This study seeks to highlight the myriad effects of tourism at individual and household levels, including impacts on inhabitants’ lives, local households’ livelihoods, and the community. Based on the livelihood concept and the SLF framework, this study systematically quantifies sustainable livelihood and integrates relevant instruments, indicators, and scales to measure livelihood and sustainability. By evaluating residents’ livelihood capacity at the individual and household levels, this paper sheds light on the state of rural tourism in impoverished areas and offers a community perspective on the idiosyncrasies of sustainable development. The next section briefly reviews relevant literature and the study’s guiding theoretical framework, followed by the research methods, findings, discussion, and conclusion.
Sustainable Livelihoods in a Tourism Context
Livelihood and Sustainable Development
Originating in the 1980s, the livelihoods approach to development studies suggests that researchers and practitioners move beyond policy assumptions, eliminate biases and misunderstandings generated by short field visits, and invest in understanding situations from beneficiaries’ points of view (Biddulph, 2015; Chambers, 1983; Conroy & Litvinoff, 1988; Sen, 1982, 1997). A fairly common definition of livelihood comes from the UK’s Institute of Development Studies, namely that “a livelihood comprises the capabilities, assets and activities required for a means of living” (Chambers & Conway, 1992, p. 6). This study adopts the latter description.
A livelihood is sustainable when it can handle and recover from stressors and shocks while either preserving or enhancing its capabilities without undermining its natural resource base (Scoones, 1998, 2009). Serageldin and Steer (1994) recommended that experts conceptualize sustainable development based on patterns in the accumulation of and substitution among four types of capital: produced capital (e.g., farmland and basic infrastructure), human capital, natural capital, and social capital. Sustainable livelihoods are achieved through access to a range of resources incorporated into the pursuit of livelihood strategies (e.g., agricultural intensification, livelihood diversification, and migration). Scholars have pointed out that produced, human, natural, and social capital are not exhaustive; other forms of capital may exist (Richards, 1989; Scoones, 1998, 2009). To create livelihoods, people must combine the capital endowments to which they have access and control. Such endowments are composed of personal capabilities, tangible assets, and intangible assets (Bebbington, 1999; Farrell & Twining-Ward, 2005).
As a conceptual framework, the SLF (DFID, 1999) has been well acknowledged and applied in research (Chambers & Conway, 1992; Shen et al., 2008). This framework focuses on local community- and individual-level actions (Chambers & Conway, 1992; UNDP, 2017). Under it, “sustainable livelihood” is a person-centered paradigm emphasizing people’s inherent capacities and knowledge. Sustainable livelihood is rooted in a set of widely shared principles—it is individual, responsive, participatory, holistic, partnership-based, sustainable, and dynamic. Specifically, the SLF encompasses the skills, assets (i.e., material and social), and approaches people and communities adopt to survive. Numerous factors can affect inhabitants’ choices around subsistence. The SLF’s five key features of household assets are typically conceptualized as a pentagon of five types of capital: natural, physical, social, financial, and human. Notably, this pentagon of capital represents an open evaluation system that does not contain specific, measurable indicators for assessment.
Livelihood Activities, Tourism, and Poverty Reduction in Rural Ethnic Areas
With respect to tourism and rural peripheries, the livelihoods approach has largely been applied to study the effects of community-based initiatives. This method situates tourism-related activities within a constellation of livelihood activities (Bires & Raj, 2020; Gao & Wu, 2017; Mbaiwa & Stronza, 2010; Stone & Nyaupane, 2018; Tao & Wall, 2009). Traditional agriculture, fish breeding, poultry raising, and handicrafts are quintessential livelihood activities in remote rural areas, particularly those in emerging markets—including “developing countries demonstrating considerable growth momentum and economic potential” (X. R. Li, 2016, p. 419).
However, livelihood activities and lifestyles in these communities are gradually shifting amid modernization. Poor households along the rural periphery have become connected to wider economies. Sofield (2003) further contended that during modernization, development is equated to economic growth aligned with capitalist models; little attention is given to issues of equity. Some tourism research in this vein has been bifocal, identifying the deceleration of rural agriculture (or fisheries) and seeking to evaluate tourism as an alternative to this decline (Fabinyi, 2010; Gascón, 2015). Other scholars have argued that tourism research should be open to the possibility that tourism income is only part of a broader process of rural income diversification (Biddulph, 2015; Rigg, 2006). Varied livelihood options and socioecological resilience are therefore critical for sustainable development (Ruiz-Ballesteros, 2011). Policymaking related to poverty and tourism should also be informed by an understanding of rural households’ livelihood portfolios and the strategic decisions that shape them (Biddulph, 2015).
Tourism has become a rural livelihood choice and poverty reduction strategy in many developing countries. Relevant assumptions include the expectation that strengthening links to the local economy can boost the proportion of tourist spending directed toward the poor and will therefore reduce poverty (Bires & Raj, 2020; Cater, 1987; Lor et al., 2019; Mitchell & Ashley, 2010). Tourism is a relatively labor-intensive sector traditionally dominated by small enterprises. Tourism and associated investments play pivotal roles in shaping rural society communities and enhancing local livelihood strategies. Markey et al. (2008) pointed out that reversing rural recession requires a focus on investment and reforming policy support. When developed properly, tourism can generate profits and growth otherwise not available while offering employment opportunities to women, youth, and disadvantaged groups such as ethnic minorities (Dev, 2024; Robertico et al., 2024; UNWTO & Netherlands Development Organization, 2010). The tourism industry can potentially revitalize the countryside by fueling economic growth and providing jobs and other benefits to local, rural inhabitants. As such, experts have long debated how to capitalize on tourism to reduce poverty in China and elsewhere (e.g., Chok et al., 2007; Gao & Wu, 2017; Y. P. Li et al., 2019; Lor et al., 2019). Researchers are particularly interested in identifying areas in which tourism planning and resultant economic development might benefit poor residents equally.
Some countries have taken advantage of their cultural diversity and employed ethnic tourism to stimulate local economic development. Valene Smith (1977) is credited with coining the term “ethnic tourism,” defining it as tourism “marketed to the public in terms of the ‘quaint’ customs of indigenous and often exotic peoples, that often include visits to native homes and villages, observation of dances and ceremonies, and shopping for primitive wares or curios” (p. 2). Ethnic tourism has come to the fore as a crucial sector of the global tourism industry (Ishii, 2012; Yang et al., 2023). Tourism processes carry far-reaching cultural, social, and political implications: governments may use ethnic images to foster tourism and base tourism plans on the development of ethnic resources, traditions, and artifacts (Fazito et al., 2016; Wood, 1984; Yang et al., 2008). The literature has shown that when locals in ethnic tourism destinations participate in ethnic tourism activities, local communities benefit from trickle-down effects (Ishii, 2012; Scheyvens, 2002; Van den Berghe, 1992). In China, ethnic tourism has been adopted for poverty reduction, indigenous heritage protection, and rural revitalization (Lor et al., 2019; Yang, 2011).
Over the past 20 years, research on the relationship between tourism and poverty has fallen into two main camps: one emphasizing the business aspects of pro-poor tourism (i.e., the “profit camp”) and another focusing on structural barriers to ensuring poor area inhabitants benefit from tourism development (i.e., the “structures camp”). Members of the profit camp, despite mostly rejecting scholars’ assertions that tourism-spurred economic growth automatically trickles downward, have appeared most interested in rural-based tourism’s economic benefits for the poor (Croes & Rivera, 2015; Kim et al., 2016). By contrast, members of the structures camp have attended to factors that can facilitate or prevent locals from reaping tourism-related benefits (Kim et al., 2016). As a modernization tool, tourism in developing countries may inspire traditional societies’ transition to a modern way of life (Biddulph, 2015; Pi-Sunyer, 1989). Local people, especially those in remote rural ethnic areas characterized by changing livelihoods and life choices, may adopt Western values and migrate to urban and resort regions in search of high income through the tourism industry (Biddulph, 2015; Mathieson & Wall, 1982). In such cases, tourism-related assumptions about drivers that can reduce poverty are generally identified from a provincial or national point of view instead of a community view.
Tourism development may have a causal influence on livelihood capital. However, a pertinent and debatable issue in practical and theoretical realms is the challenge of ensuring equitable benefits for the poor from tourism development (Chok et al., 2007; Croes & Rivera, 2015; DFID, 1999). How to assess the relationship between tourism and poverty reduction through evaluating livelihood capital, and to measure them effectively, remains a problem. Reid (2003) pointed out that the tourism industry must address more directly the goal of distributive justice—especially in developing nations where tourism is characterized by uneven development, leading to erratic returns and unequal incomes. Tourism’s roles in poverty reduction and livelihood capital are unclear from a person-centered perspective. Therefore, the effects and sustainability of tourism for poverty reduction in ethnic areas should be carefully considered. The primary aim of this study is to develop objective measures with which to appraise tourism development performance through a person-centered lens.
Sustainable Livelihood Indicators and Development Procedure
Sustainable tourism has been included in international agendas for sustainable development. Empirical research (Conroy & Litvinoff, 1988; Farrell & Twining-Ward, 2005; Hashemi & Ghaffary, 2017; Miller, 2001) has been conducted to clarify its role in local development while protecting regional environments, natural resources, and cultural heritage and values. Some studies (Mitchell & Ashley, 2010; Shen et al., 2008) have investigated the relationships among sustainable development, rural development, and tourism using the SLF but offered limited evidence of tourism-related benefits for the poor. Mitchell and Ashley (2010) concluded that merely calculating the aggregated share of tourist expenditure that reaches the poor “tells us little about how the benefits are transmitted and how they can be increased” (p. 31).
As the core of the SLF, livelihood capital has received extensive attention. Sustainable livelihoods are achieved through access to a bevy of resources, including natural, economic, human, and social capital (Scoones, 1998, 2009). Natural capital refers to stocks of naturally occurring resources, such as soil, water, air, or generic resources, that can be used to create additional benefits (e.g., food chains, protection against soil or coastal erosion, and other natural resources) to support livelihoods. Physical capital is the basic infrastructure and production input needed to support livelihoods. Financial capital represents the financial resources populations use to achieve their livelihood objectives. Social capital encompasses the social resources on which populations rely when pursuing these goals. In this study, “social capital” refers to local social capital (i.e., networks, or guanxi in Chinese, referring to well-positioned individuals—especially those who have relationships with administrators, associations, local authorities, local officials, and broader populations receiving program assistance). Human capital denotes the abilities, experience, professional skills, and physical state of good health that collectively enable populations to fulfill personal livelihood-related goals. Various scholars have specified dimensions of capital or resources. Narayan and Cassidy (2001) helped to clarify social capital by assembling an expansive framework. Petrosillo et al. (2013) proposed a list of subjective social-environmental indicators aimed at assessing quality of life. Sen (1997) discussed the similarities and differences between human capital and human capability. Ployhart et al. (2014) constructed an integrated and multidisciplinary framework that redefined human capital resources as individual- or unit-level capacities. DFID (1999) initially put forth several forms of capital, which UNDP (2017) later elaborated.
Indicators of sustainable livelihood vary greatly, with broad and diffuse indicators requiring different assessment techniques. For instance, Shen et al. (2008) proposed a Sustainable Livelihood Framework for Tourism (SLFT) that highlighted the core features of a tourism livelihood system. Nevertheless, as with DFID’s identified livelihood assets, SLFT does not outline evaluative criteria. Most methods used in research on livelihood capital have involved qualitative or subjective assessments based on evaluators’ or interviewees’ personal responses (Chok et al., 2007; Narayan & Cassidy, 2001; Ployhart et al., 2014; Qian et al., 2017). Indicator weights are conventionally determined via subjective fixed-weight methods such as the Delphi method, the expert survey method, or the analytic hierarchy process. Naturally, these approaches can produce deviations in the index weights of subjective factors (Amiri, 2010). In contrast, objective fixed-weight methods rely on research subjects’ inherent characteristics to determine index weights, minimizing bias and ensuring objective results (Shannon, 1948). This paper seeks to address the above-mentioned issues by proposing a mixed-method approach.
Method
Proposed Framework
In light of the research gaps and challenges summarized in the literature review, this study analyzes capital applicable to rural ethnic areas by taking the DFID (1999) index and UNDP’s (2017) recommendations as primary references. The entropy weight method, gray relational analysis (GRA), and fuzzy comprehensive evaluation are used to improve the proposed approach’s objectivity and the criteria for choosing index weights. The DFID index lacks substantive and quantifiable indicators. UNDP (2017) has acknowledged the subjective nature of stakeholders judging livelihood-related capital based on cultural identity, social position, gender, or experience. To alleviate these concerns, a holistic framework of sustainable livelihood indicators is presented to explore how tourism influences inhabitants’ livelihoods, community development, and sustainable tourism. Moreover, the structural disparities in capital and obstacles to individual farmers’ livelihoods in remote rural ethnic areas merit contemplation from a sustainability standpoint. Therefore, this paper presents a mixed-method analysis that emphasizes quantitative assessment and uses objective indicators based on the original SLF and subsequent research (Colombo et al., 2018; UNDP, 2017; L. Wu & Jin, 2018).
The resulting index system considers the circumstances of ethnic villages and refers to a local government handbook titled Guide for Poverty Alleviation and Accurate Help in Guangxi Province. The system comprises 21 indicators across three levels, categorized under five key features (natural, physical, social, human, and financial capital) that reflect fundamental assets for the impoverished. These indicators have been adapted to local contexts (e.g., N2, S15, and H21, as shown in Table 1), and their definitions and descriptions align with UNDP’s (2017) recommendations.
Framework of Sustainable Livelihood Indicators.
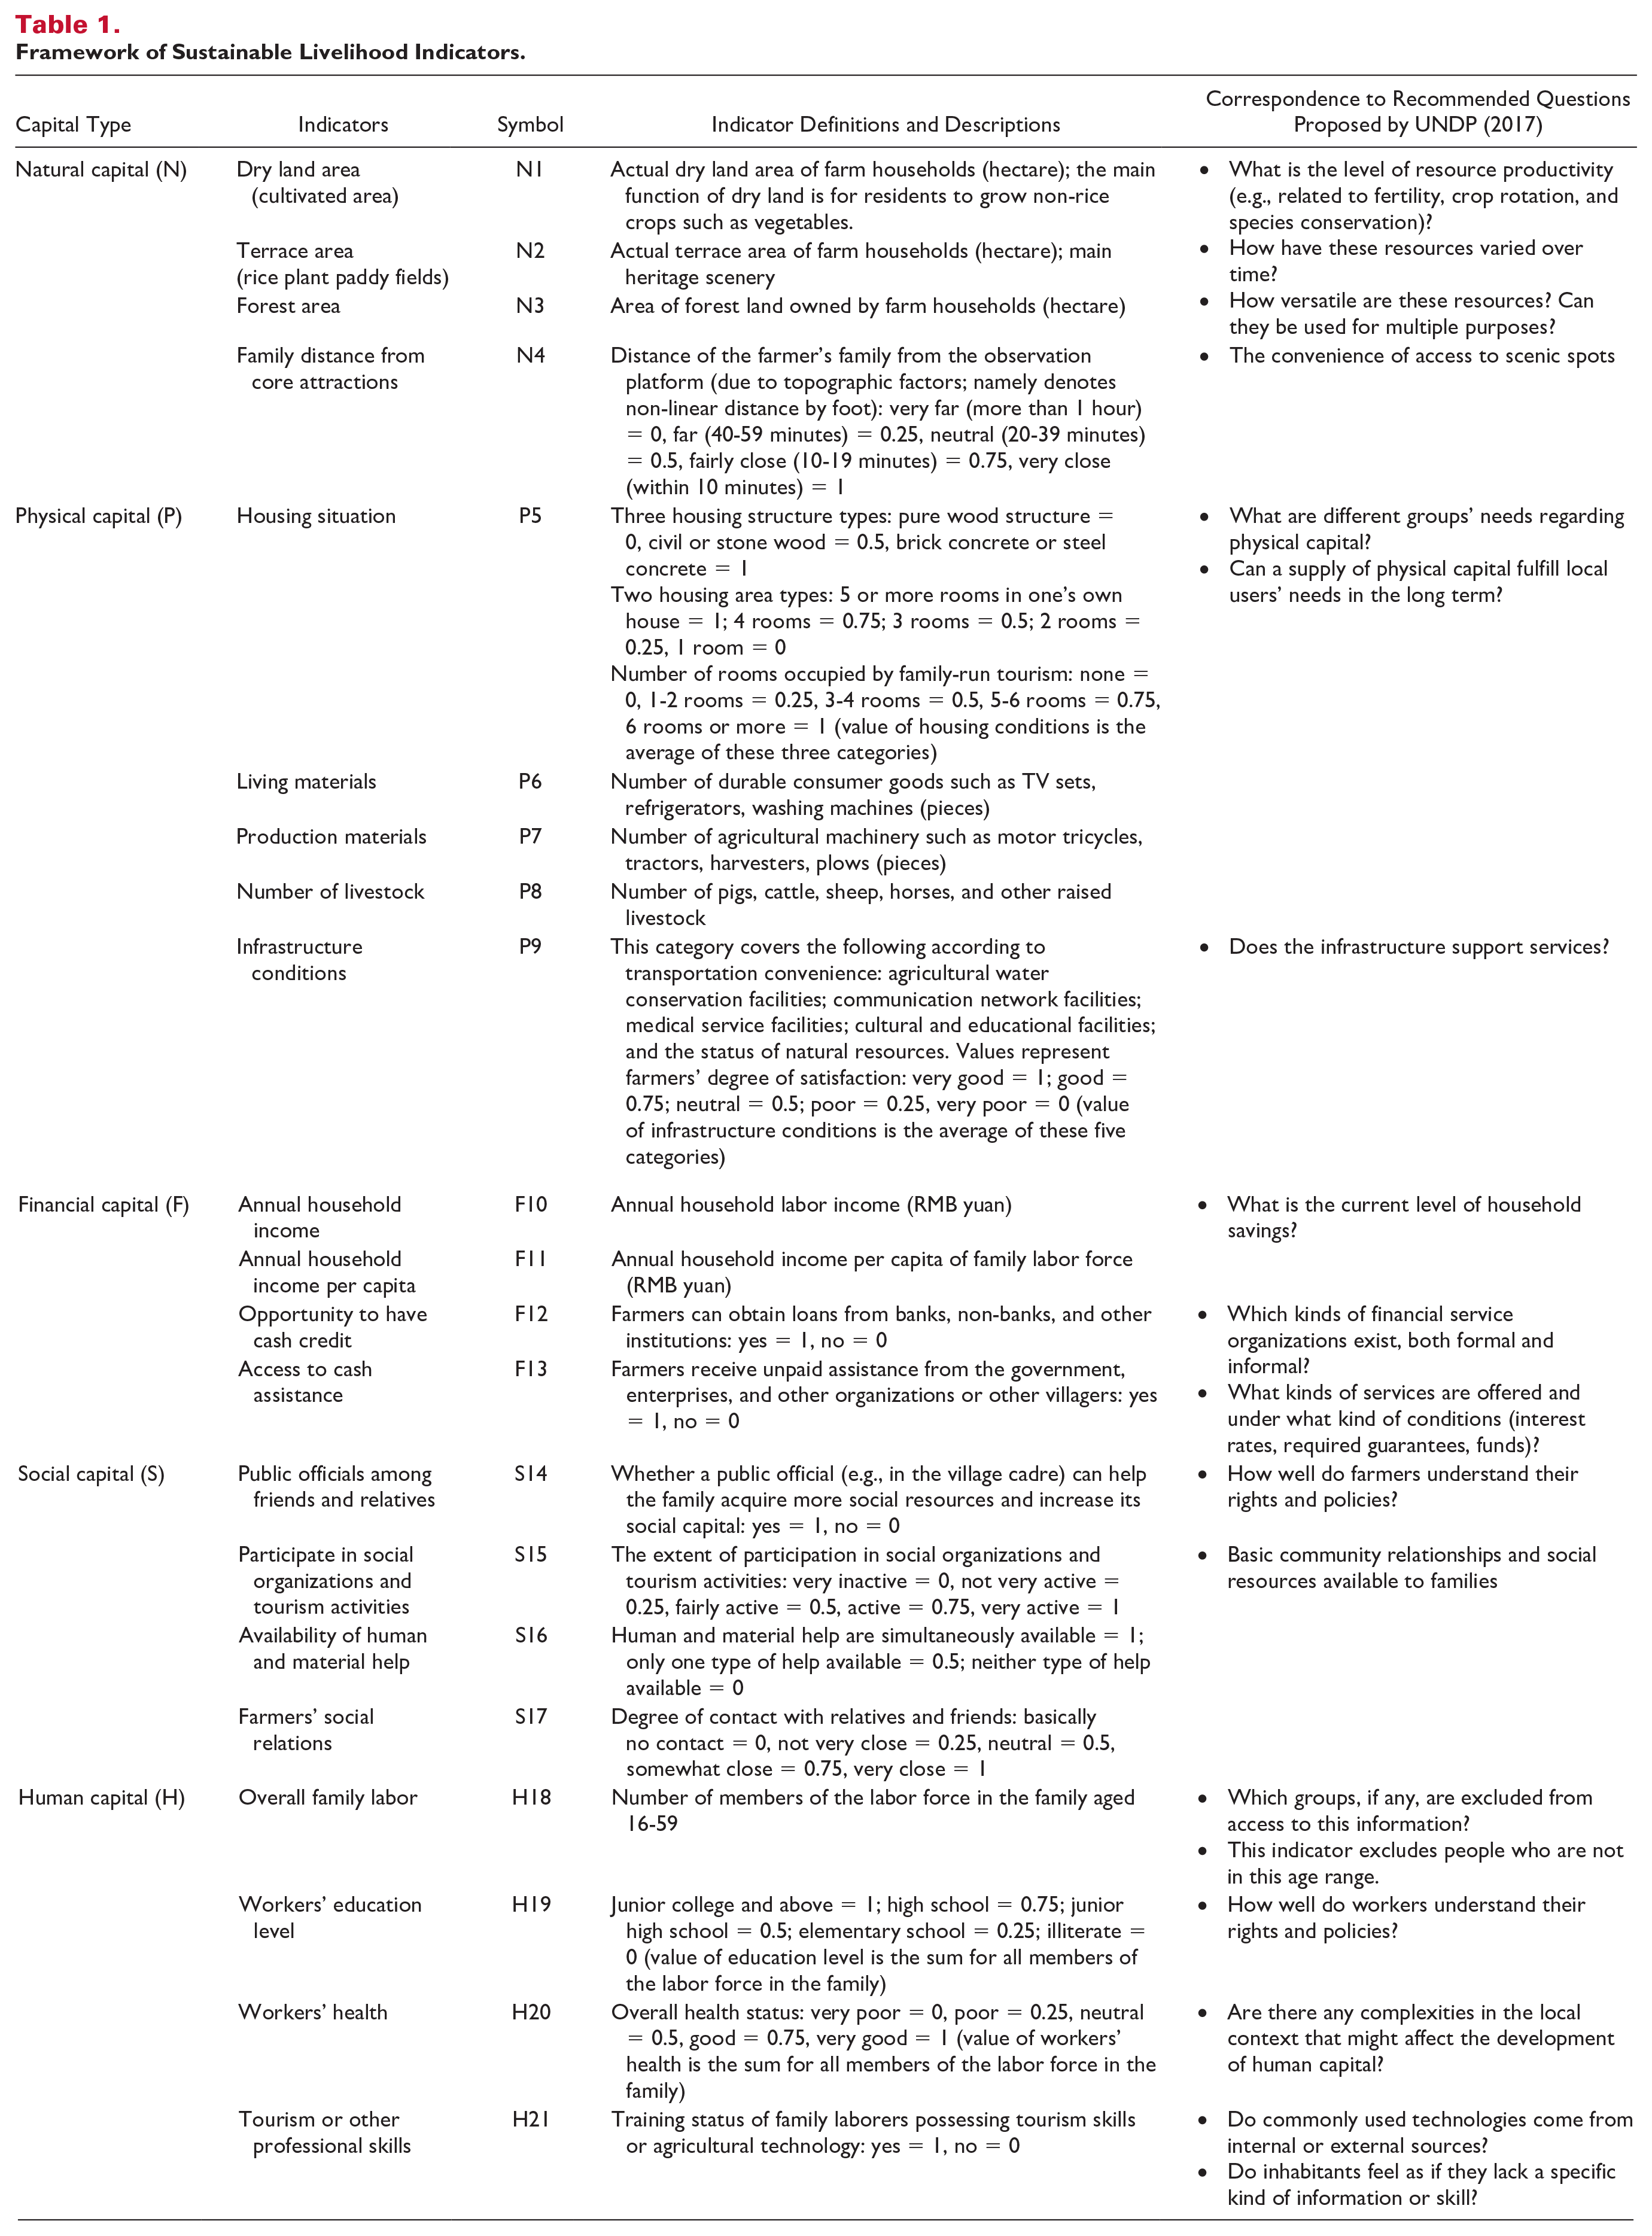
The proposed framework includes four objective indicators under natural capital (i.e., dry land area, terrace area, forest area, and family distance from core attractions) emphasizing local resources that underpin basic livelihoods. The four objective indicators and one subjective indicator under physical capital (i.e., housing situation, living materials, production materials, number of livestock, and infrastructure conditions) focus on essential infrastructure, production input that supports livelihoods, and current living standards. Within financial capital, four objective indicators (i.e., annual household income, annual household income per capita, opportunity to have cash credit, and access to cash assistance) convey household labor income and one’s ability to secure loans from banks or other institutions to promote and achieve livelihood goals. Social capital encompasses two objective indicators and two subjective indicators (i.e., public officials among friends and relatives, participating in social organizations and tourism activities, availability of human and material support, and farmers’ social relations) to evaluate the quality of local social relationships. Human capital is represented by four objective indicators, including overall family labor, workers’ education level, workers’ health, and tourism or other professional skills.
Study Area and Sample Selection
Assuming a system-level perspective with the intention of performing vertical and horizontal comparisons, the Longji Rice Terraces were taken as a study case. Given this study’s purpose, the Longji Rice Terraces were ideal because they cover multiple rural ethnic villages in an area traditionally characterized by extreme poverty. This area has also undergone multiple stages of tourism development. Longsheng Autonomous County (Longsheng), where the Longji Rice Terraces reside, is approximately 100 km from Guilin, one of China’s most popular tourist cities in the country’s Guangxi province. Longsheng has become renowned for poverty reduction: it hosts a large indigenous population and has traditionally been classified as an area of extreme poverty. Longsheng was in fact named an “extreme poverty county” in 1986. Poverty reduction efforts led the impoverished population to fall from 29,415 in 2016 to zero as of 2020 (Guangxi Zhuang Autonomous region Bureau of Rural revitalization, 2016).
The Longji Rice Terraces were built along the slope winding from the foot to the top of Longji Mountain, with agricultural production that can be traced back 2,300 years. The UNFAO (n.d.-a) honored the area as “a globally important agricultural heritage system” in 2018, thanks to its paddy cultivation, splendid terraced fields, and multinational culture. Pro-poor policies and tourism policies have gradually benefited this impoverished area. Figure 1 depicts annual tourist arrivals and receipts in Longsheng over the past several decades (Editorial Board of Guilin Economic and Social Statistical Yearbook, 1991-2018; Editorial Board of Local Records of Longsheng Yearbook, 1991-2018). Before 1992, only a small number of tourists visited Longsheng, with even fewer going to the Longji Rice Terraces and indigenous villages. No tourism facilities were available for visitors. Then, between 1992 and 1997, pro-poor tourism programs and policies were implemented, and the number of tourists rose steadily. Some local villagers began to provide simple tourism facilities.
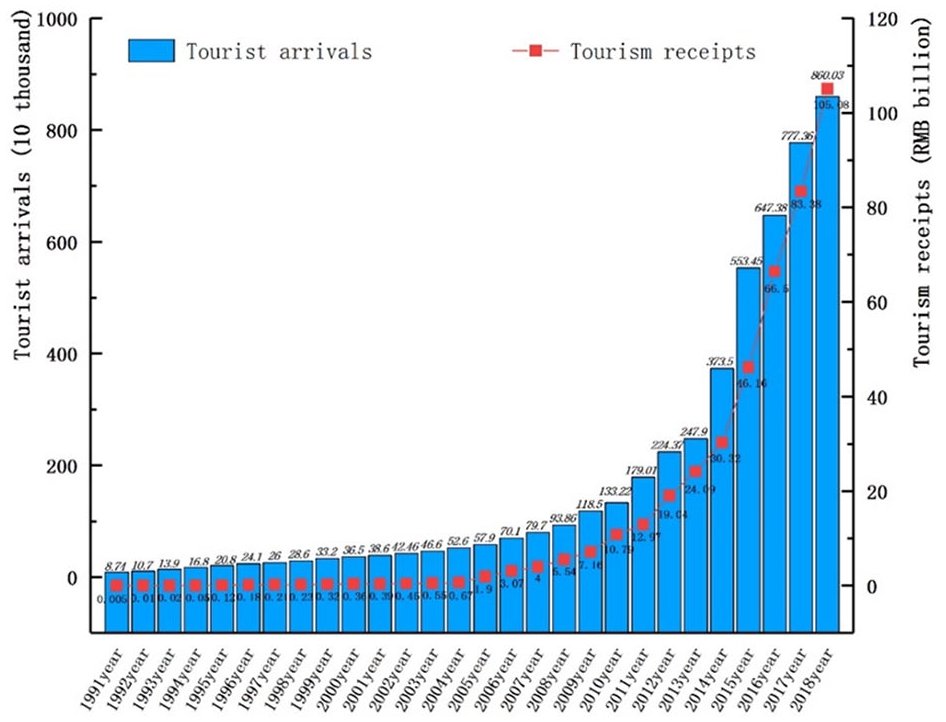
Annual Tourist Arrivals and Receipts in Longsheng County From 1991 to 2018.
As transportation infrastructure developed around the new millennium, the Longji Rice Terraces drew more travelers’ attention and were even featured in Lonely Planet, a renowned travel guidebook. In China, government tourism investment is pivotal for boosting the economy in remote rural areas. Various sources have also begun to invest in potential rural tourism destinations. More local villagers are participating in tourism and hospitality services, in turn drawing greater investment. Women’s social status is also improving because they are directly involved in tourism operations such as running inns, homestays, catering, and related business activities. Tourism and hospitality have come to jointly represent a leading industry in this area. The number of tourists increased rapidly after 2000, and tourism-related investments surged. Tourism has since spurred the cultivation of terraced fields, classical local-style dwellings protection, and local county economies. UNWTO named Jinkeng Yaozhai (also called Dazhai village) one of the Best Tourism Villages of 2022 (UNWTO, 2022). Local villagers have clearly benefited financially from the blooming tourism industry, although some negative impacts (e.g., a widening income gap) have emerged.
The two focal villages in Longsheng, Pingan Zhuangzhuai and Jinkeng Yaozhai (Figure 2), are ethnic indigenous villages that have witnessed substantial poverty reduction. Tourism has played a considerable role in residents’ livelihood in the past nearly 30 years, providing the authors a prime opportunity to observe these village inhabitants’ development and poverty alleviation. Pingan Zhuangzhai is home to 205 families and 801 people, all of whom are of Zhuang ethnicity. Jinkeng Yaozhai hosts more than 280 families and 1,227 Yao descendants. These villages’ inhabitants have cultivated the Longji Rice Terraces for generations. Both villages offer agricultural biodiversity, resilient ecosystems, and a valuable multiethnic culture.
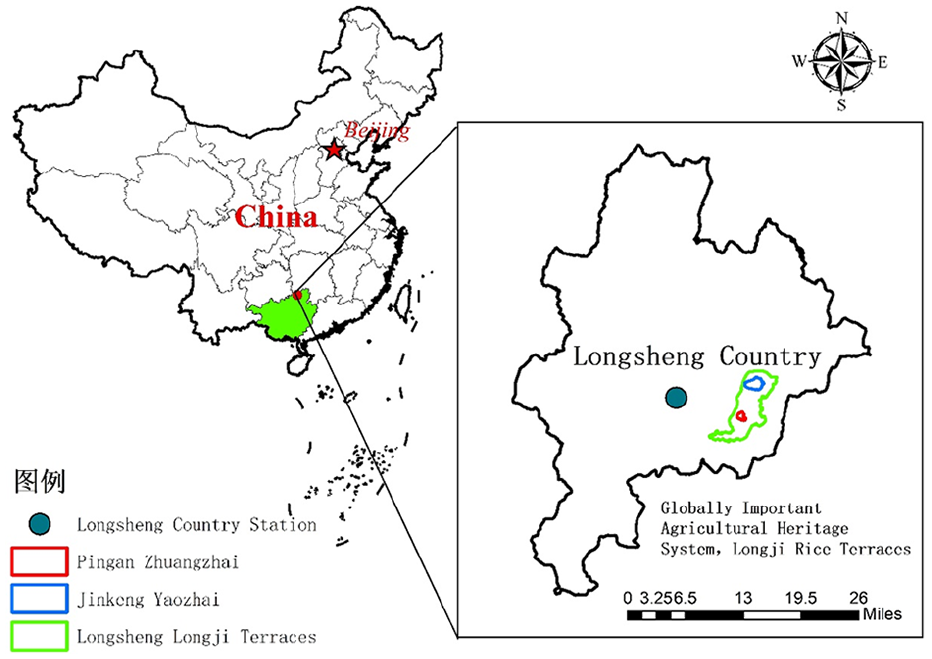
Location of the Two Focal Villages.
Local inhabitants’ core livelihood sources include field crops, fruits, vegetables, and tourism. Tourism has become these residents’ key source of income; associated sectors span catering, accommodation, making and selling souvenirs or local specialties, shopping, tour guide services, and scenic tour ticketing fees and shared bonuses from tourism companies. Some researchers have criticized the area’s tourism development for having forced full-time farmers to become part-time workers in their hometowns (Tian et al., 2016), a common phenomenon within these two villages. Many inhabitants embrace non-farm work, such as manual labor, during the off-season; others have completely ceased working in the field to join the tourism industry by becoming small business owners.
Data Collection
Along with the livelihood index system proposed in Table 1, this empirical study incorporated quantitative analyses on both survey and secondary data. A pilot survey was conducted in May 2018, after which the questionnaire was slightly modified. Three field visits, each lasting 5 to 7 days, were completed for data collection purposes during the second half of 2018. To understand (a) the process of village development and (b) changes in, and the current status of, inhabitants’ lives and livelihood portfolios, the survey included several sections: (a) respondents’ (i.e., farmers’) demographic information; (b) farmers’ natural, physical, financial, social, and human capital status; and (c) challenges associated with farmers’ poverty reduction, that data were mainly obtained from the Poverty Reduction Work Office of Longsheng in Guilin City and local poverty reduction inhabitants (i.e., locals who qualified for and were directly involved in poverty reduction programs).
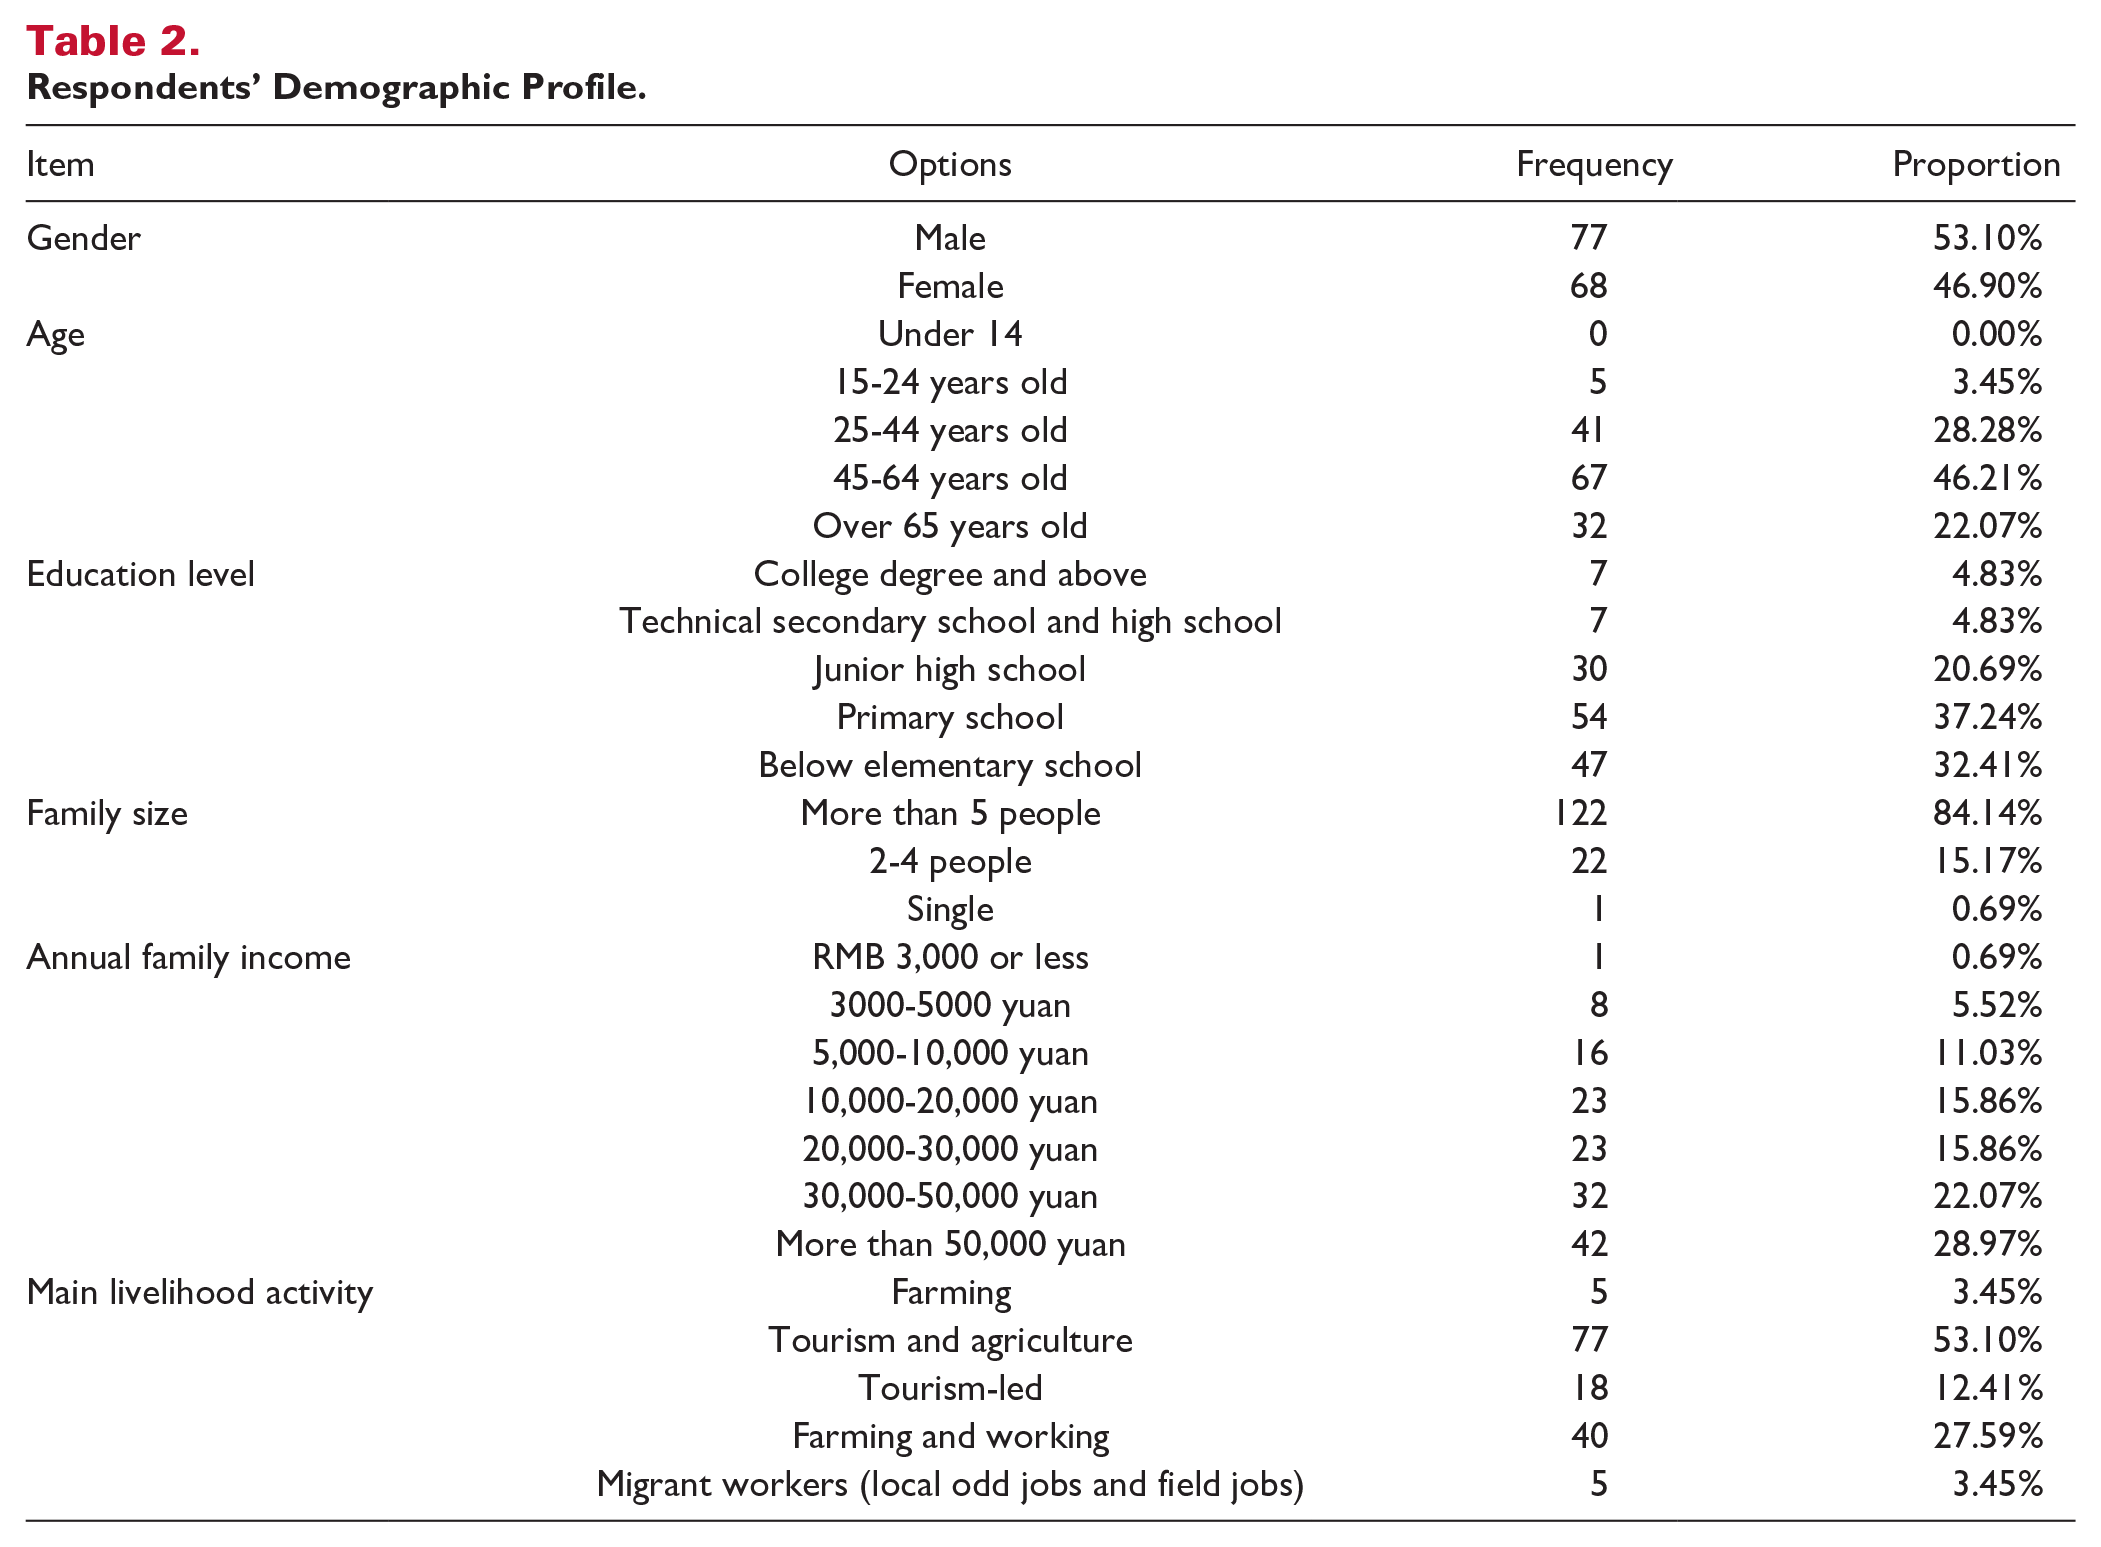
Pingan Zhuangzhai and Jinkeng Yaozhai are home to 485 families. All 485 families were attempted to be surveyed through three field visits. In total, 145 valid survey responses (87 from Jinkeng Yaozhai and 58 from Pingan Zhuangzhai, one representative per family) were acquired and numbered sequentially (effective response rate: 28.89%). Respondents’ demographic information is summarized in Table 2. D1 to D87 denote respondents from Jinkeng Yaozhai; P88 to P145 denote respondents from Pingan Zhuangzhai. Under the targeted poverty reduction policies in place since 2013, Longsheng has identified poverty-stricken households and maintained annual data on registered impoverished households since 2015. Among the 145 responding families, 81 were registered as impoverished households in 2015 and later identified as poor exit households; the rest were farmers who had been out of poverty since 2015 based on local official records. Most respondents in this study had relatively low education levels and were not accustomed to taking surveys. To ensure overall survey quality and to gather data in the least intrusive manner possible, the authors used a face-to-face interview survey approach: surveys were administered in the local dialect by trained researchers with knowledge of the community (Bernard, 2000). Compared with self-administered surveys, personal interview surveys are usually much more time-consuming but enable researchers to gather more in-depth information. Each interview, in this case, took 50 to 60 minutes to complete and was audio-recorded with participants’ consent. Interview data were subsequently transcribed for content analysis. Although the interview findings were not the focus of this paper, they helped to contextualize the survey data and results and hence guided interpretation.
Respondents’ Demographic Profile.
Five on-site interviews were conducted with village cadres and town leaders. Village field observations were performed as well, including observations of farmers’ housing, field terraces, and tourism activities. Field notes were taken during on-site observations. Interview findings, field notes, and information gleaned from interactions with locals helped the research team validate, triangulate, and interpret questionnaire responses.
Maintaining sensitivity and respect for the locals were priorities throughout the fieldwork process (Liamputtong, 2007). Several steps were taken to achieve these goals. First, the research team aimed to establish rapport with the participants by demonstrating sincerity and honesty. Team members also provided ID cards, student certificates, and an official letter of introduction to verify their credibility. Second, having researchers who are familiar with the local dialect is beneficial when conducting on-site visits. The interviewers and participants in this study shared similar ethnic backgrounds, and the researchers received cultural training. Third, to prevent what Liamputtong (2007) called a “data raid” approach, the research team took the time to build trust with participants by getting to know them on a personal level. The team also avoided taking a “smash and grab” approach to data collection, where they simply collected data and left. Fourth, as part of an effort to demonstrate reciprocity and respect, the research team presented all participants with small gifts and gave back to the community by promoting scenic spots on social media. Finally, data were obtained at participants’ homes to ensure personal comfort while encouraging transparent communication.
Index Weight Calculation
Because most research on livelihood capital has entailed subjective assessment, more objective methods were adopted here. The entropy weight method is an objective weighting method that calculates index weights based on the amount of information provided by various factors. The weighting process reflects the significance of the entropy value associated with each index. In this case, the degree of difference in each index was considered and information entropy was used to reflect the weight of each index factor. This aspect was key when devising measures in this study. The calculation process included four steps as described below.
In Step 1, an evaluation matrix was constructed to depict poverty reduction farmers’ sustainable livelihoods. This study focused on m such farmers (i.e., the research object) and n evaluation indicators, which formed an original data matrix X = (Xij) (i = 1,2,3,. . ., m; j = 1,2,3,. . ., n). Among these, Xij denotes the jth index value of the ith evaluation object. Then, dimensionless processing was carried out on the index data; the dimension and magnitude of each data point differed, which could affect the results. Positive and negative index data were normalized using Formulas (1) and (2):


As the indicators involved in this study were all positive, only Formula (1) is applied.
In Step 2, the index proportion was calculated based on the proportion Pij of the jth index value of the ith evaluation object to the sum of index values; see Formula (3):

In Step 3, the jth index Ej entropy was computed as follows:

where
In Step 4, the index entropy weight was identified based on the jth index value of entropy weight Wj, as shown in Formula (5):

The final calculation results of each index layer appear in Table 3.
Calculation Results of Index Weights for Each Layer.
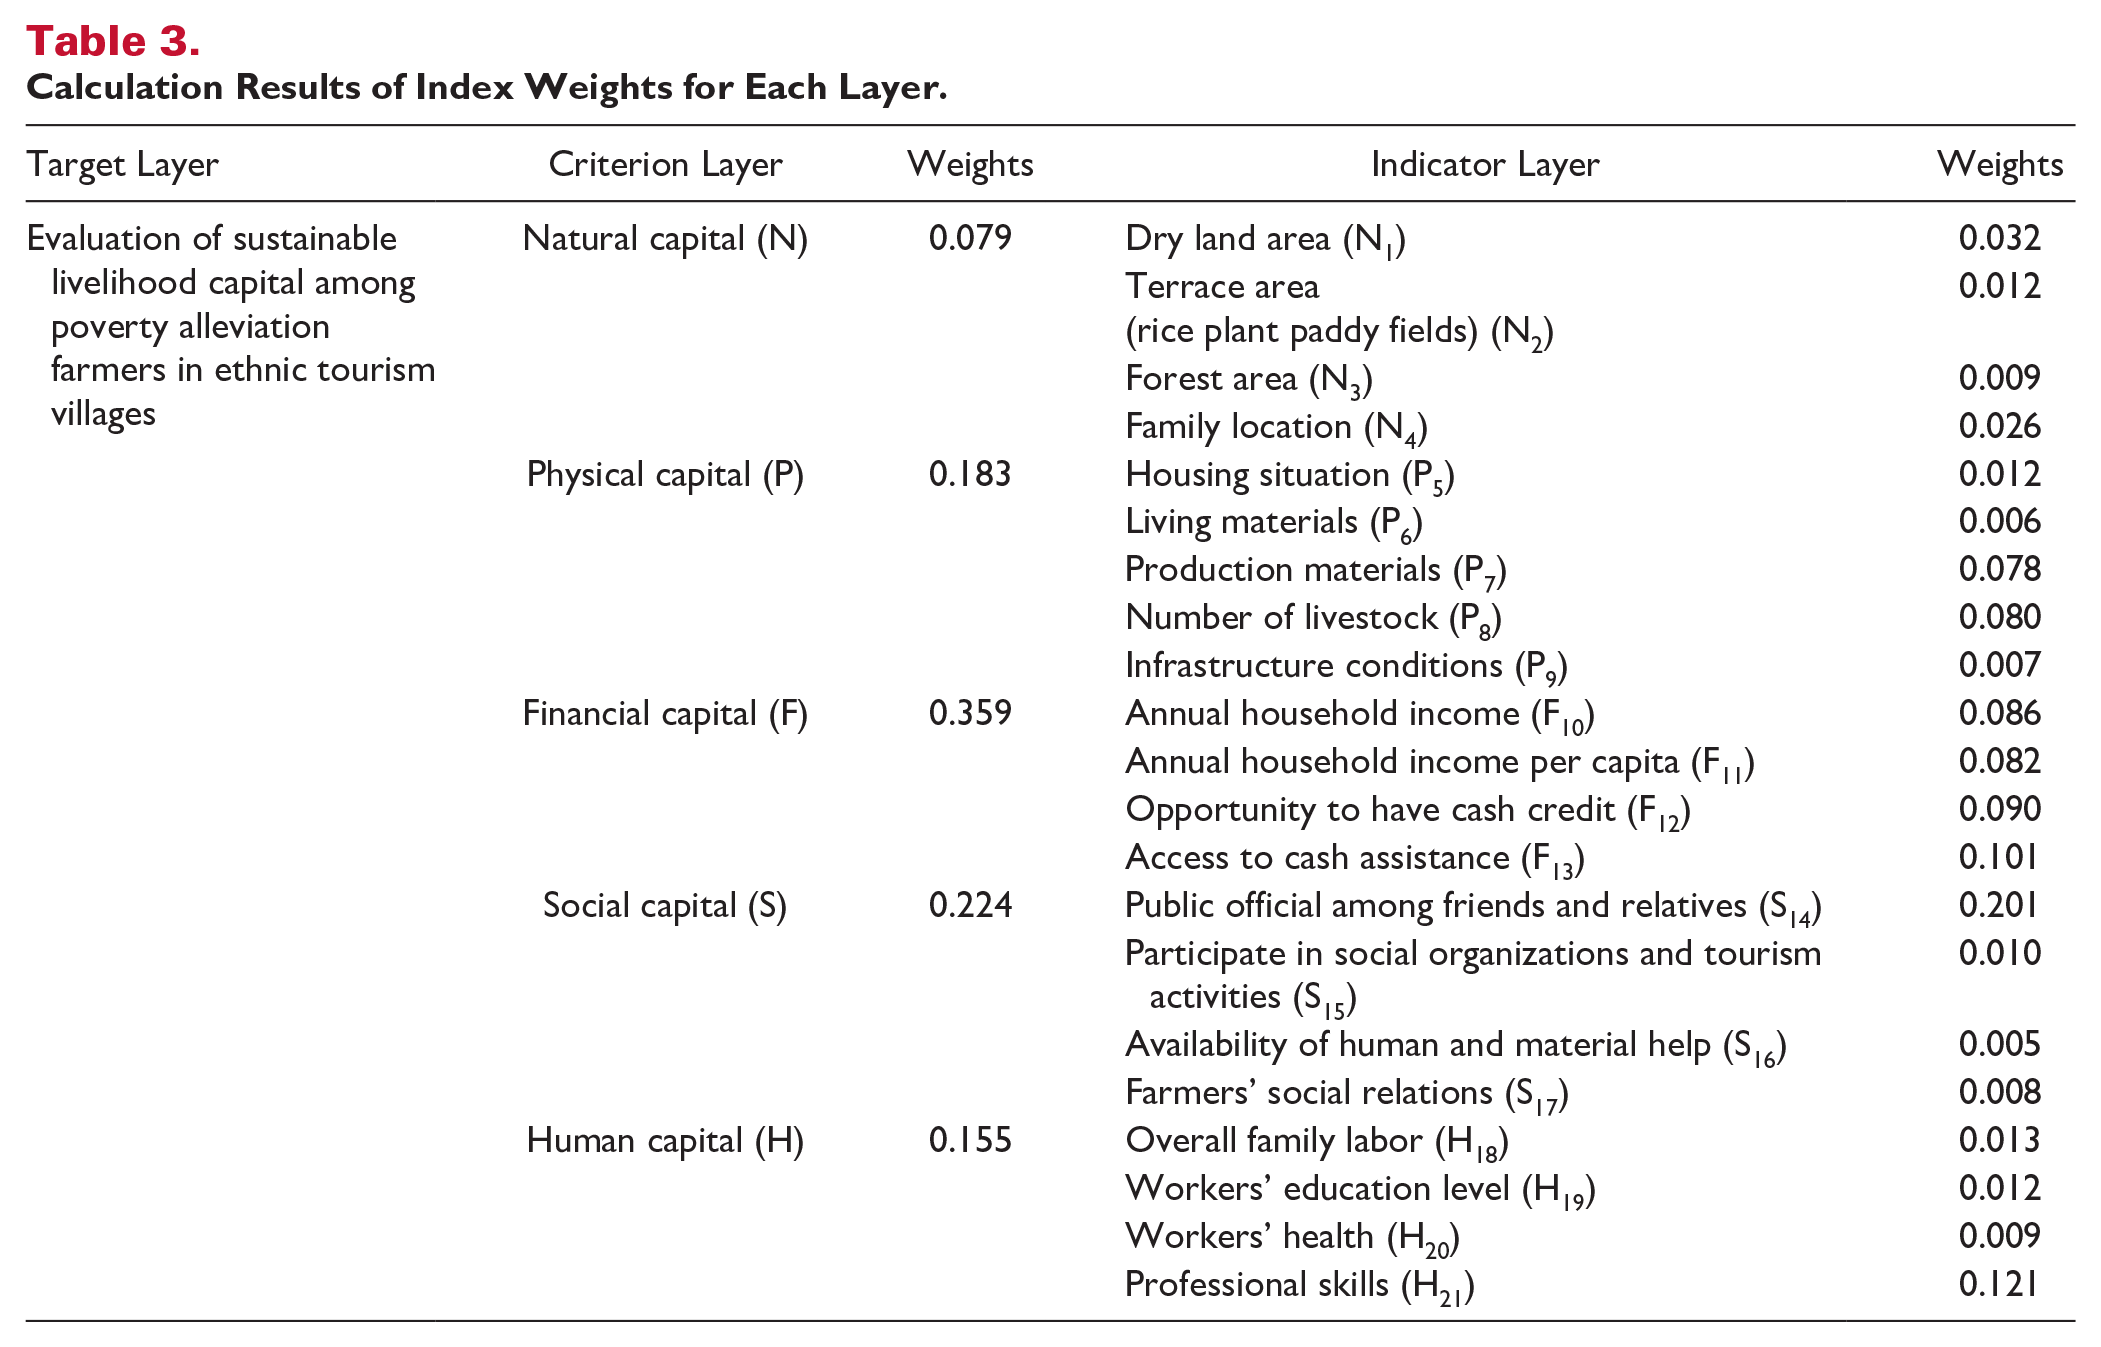
Entropy weight analysis revealed that the greater the weight, the higher the indicator’s importance and the stronger its overall impact. In addition, the greater the weight, the higher the degree of variation. In the criterion layer, the five forms of capital (in descending order) were financial (weight = 0.359), social (weight = 0.224), physical (weight = 0.183), human (weight = 0.155), and natural (weight = 0.079). The five most prominent indicators in the indicator layer were S14 (weight = 0.201), H21 (weight = 0.121), F13 (weight = 0.101), F12 (weight = 0.090), and F10 (weight = 0.086), reflecting social capital (S), human capital (H), and financial capital (F), respectively.
Comprehensive Evaluation of Sustainable Livelihood Capital
This study sought to employ a reliable measurement development method to appraise sustainable livelihood in rural indigenous areas. GRA is a quantitative method used to explore the similarities and dissimilarities among factors in developing dynamic processes (Deng, 1989). This technique can identify inter-factor correlations based on the extent to which changes in various factors affect a system. GRA proposes gray dependence to measure the degree of correlation between factors: the more similarities are observed, the stronger the correlation. This method uses the “grey relational grade” to measure factors’ degree of relation between factors. One advantage of GRA is its capability to simultaneously evaluate multiple objective functions (Mia et al., 2018). Specifically, GRA facilitates the calculation of underlying relationships, even with limited or low-quality data. GRA also accommodates small sample sizes; enables simple calculation; and yields objective, reliable results. The method has been widely used in research on tourism resource potential, ecological suitability evaluations, and influencing factors in tourism economics (Ma et al., 2018; Wang et al., 2021).
This paper uses GRA based on the entropy weight method to assess village inhabitants’ livelihood capital, calculated as follows. First, it is necessary to determine the comparison sequence and reference sequence; the former is the sequence value obtained by the survey object in the research area for each indicator, and the latter is the optimal state of each indicator in that area. All index attributes were positive in this study. The optimal value was thus the maximum value in the data, and the sequence of the maximum value in each index column was taken as the reference sequence. Second, in initialization processing, dimensionless entropy data were used as initial values to calculate gray relations. Third, the absolute difference between a given reference sequence and comparison sequence was identified through absolute difference calculations on the comparison and reference sequences determined in Step 1; the highest and lowest values in the absolute difference matrix denote the maximum difference M and minimum difference m. Fourth, the gray relational coefficient value was calculated using Formula (6):

where ρ ∈ [0,1] is the resolution coefficient, whose main function is to minimize distortion caused by excessive values. Research (Deng, 1989, 1990) has shown that the resolution reaches an optimal value at ρ ≤ 0.5463, in which case ρ = 0.5 was applied in this paper.
In Step 5, the comprehensive degree of gray relations was calculated by multiplying the index weight and correlation coefficient (i.e., the gray-weighted relation degree):

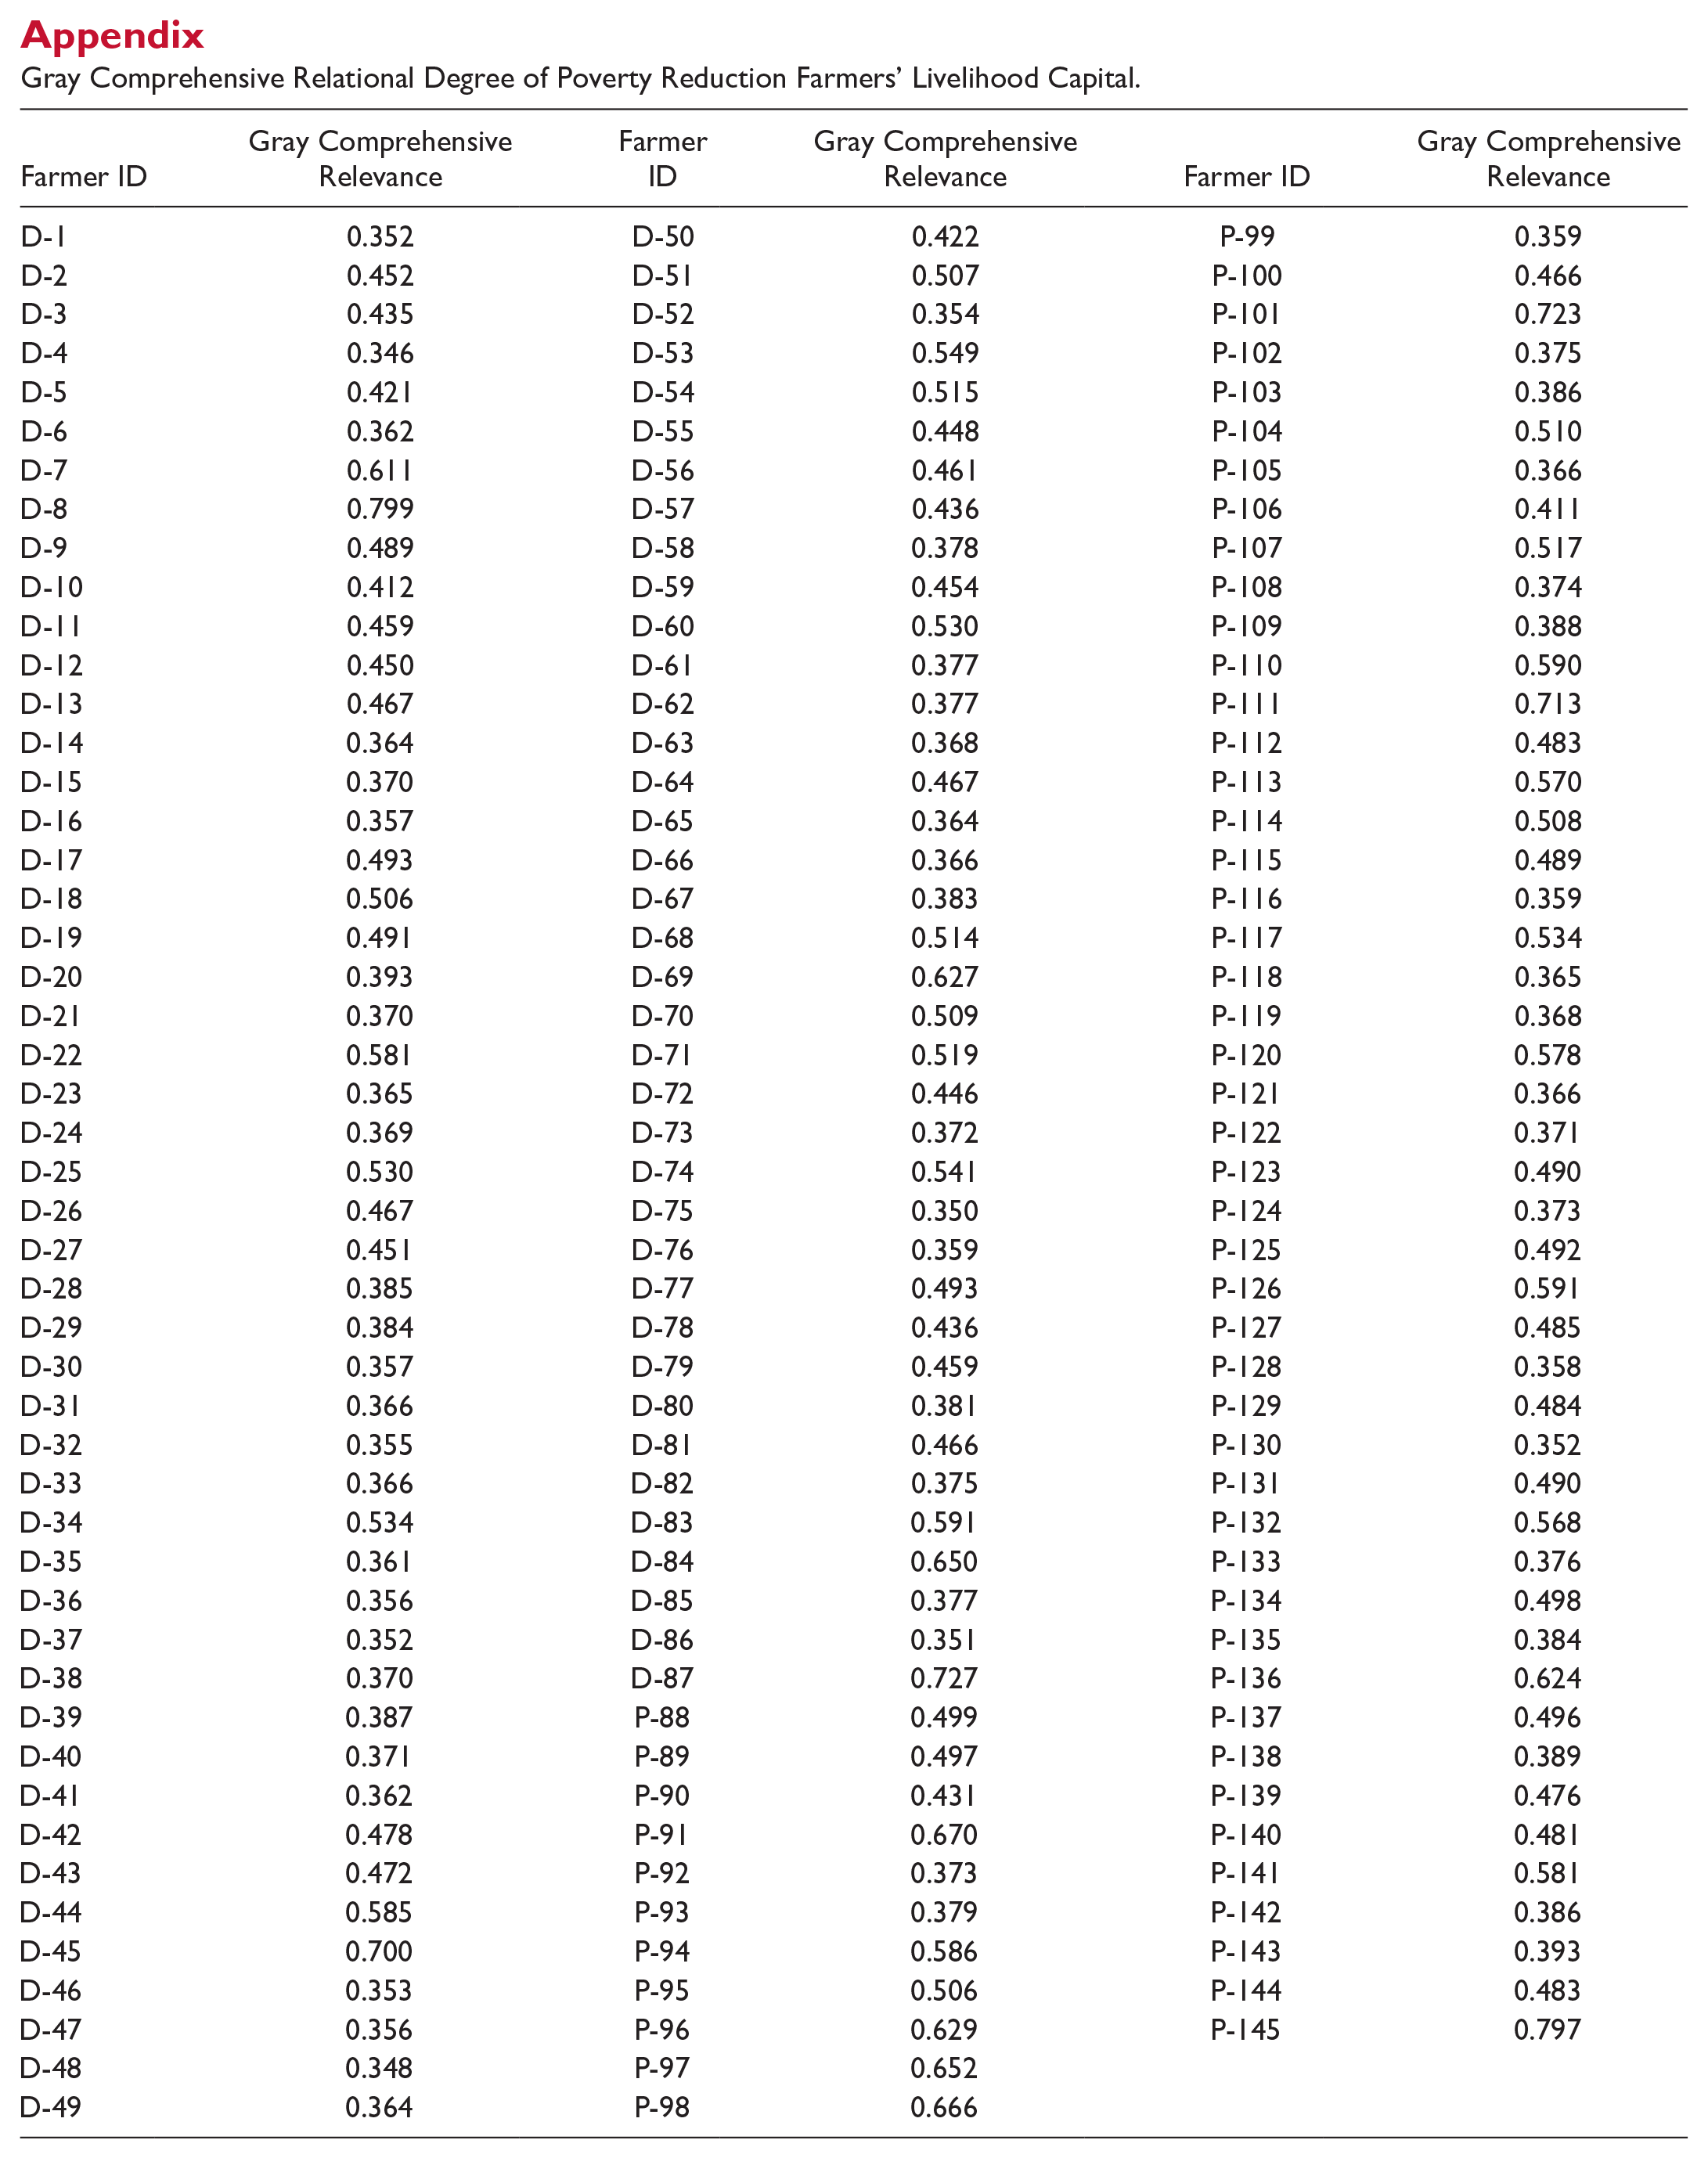
Among the farmers surveyed in this study, the gray comprehensive relation of their sustainable livelihood capital was calculated using Formula (7); see the Appendix for results. The corresponding status of farmers’ sustainable livelihood capital conveys their ownership of various forms of livelihood capital.
Results
Overall Level of Sustainable Livelihood Capital
Based on the five types of livelihood capital and 21 indicators in the proposed system, the two villages’ sustainable livelihood status was evaluated through the entropy weight method and GRA (see Tables 3 and 4). Both cases were also compared across developmental stages. Entropy weight analysis indicated that financial capital (weight = 0.359) exhibited the largest difference between groups or interviewees, followed by social capital (weight = 0.224). Natural capital (weight = 0.079) demonstrated the smallest difference. The gray relational degree range was [0, 1], and the gray comprehensive relation of sustainable livelihood capital reflected current conditions: the maximum value was 0.799, indicating a relatively good sustainable livelihood capital level; the minimum value was 0.346, showing relatively poor sustainable livelihood capital; and the per capita value was 0.459, reflecting a lower-than-median sustainable livelihood capital level. Based on these findings, sustainable livelihood capital was not ideal, and internal differences among poverty-reduction farmers were large.
Classification of Evaluation Values Regarding Poverty Reduction Farmers’ Sustainable Livelihood Capital.
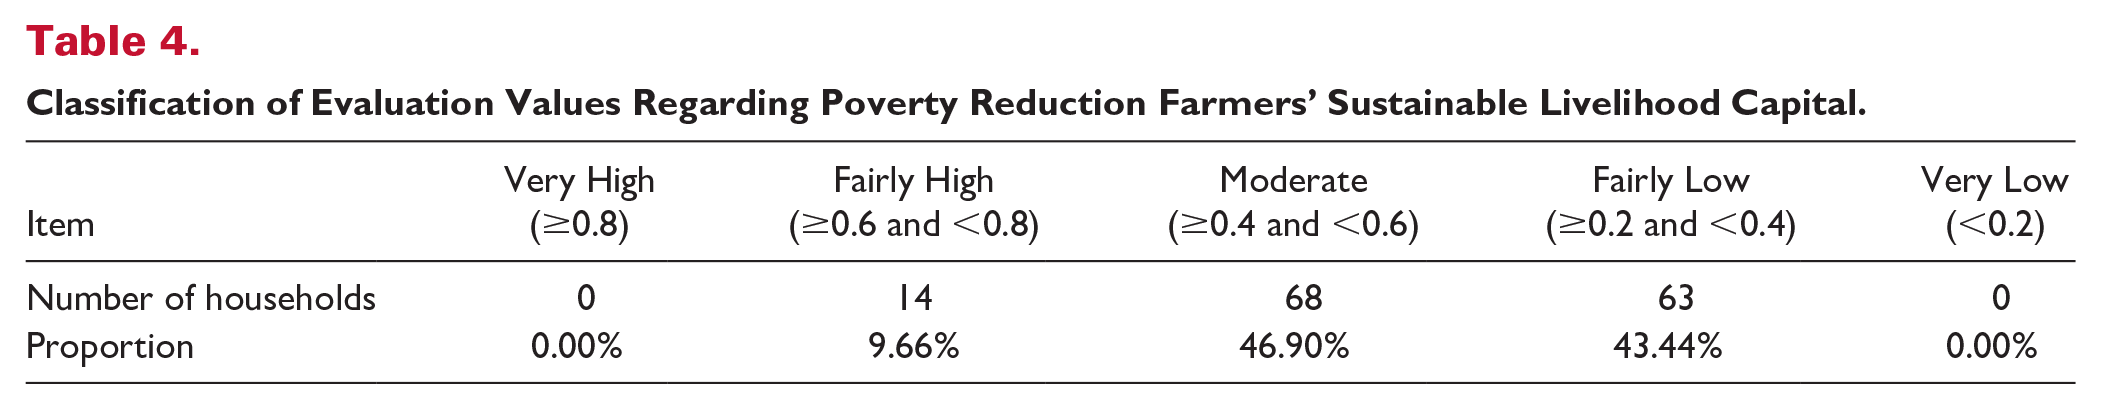
The research findings and case-specific circumstances, when analyzed using the entropy weight method, indicated that the 145 households’ sustainable livelihood capital could be categorized into five levels (see Table 4): extremely low (<0.2), low (≥0.2 and <0.4), moderate (≥0.4 and <0.6), high (≥0.6 and <0.8), and extremely high (≥0.8). Only 9.66% reached the “high” level, and the largest proportion of farmers in the sample (46.9%) had a moderate degree of sustainable livelihood capital. Meanwhile, 43.44% were classified as “low.” The largest proportion of farmers with a moderate degree of sustainable livelihood capital indicated that economic growth through tourism development indeed contributed to poverty reduction. A few farmers had a high level of sustainable livelihood, becoming wealthy through tourism and hospitality. No farmers in the study area fell into the “extremely low” category; as such, local poverty reduction had achieved some success. Similarly, no farmers reached the “extremely high” level, indicating room for further improvement. The farmers in this study mainly possessed moderate and low livelihood capital overall.
A separate analysis revealed that the average livelihood capital level in Pingan Zhuangzhai was 0.485 and that in Jinkeng Yaozhai was 0.442. This trend was unsurprising given that Pingan Zhuangzhai’s tourism industry had developed for 6 years longer than that in Jinkeng Yaozhai. There may be long-term economic benefits for indigenous communities that embrace rural tourism.
Influences of Index-Layer Factors for Farmers at Different Livelihood Levels
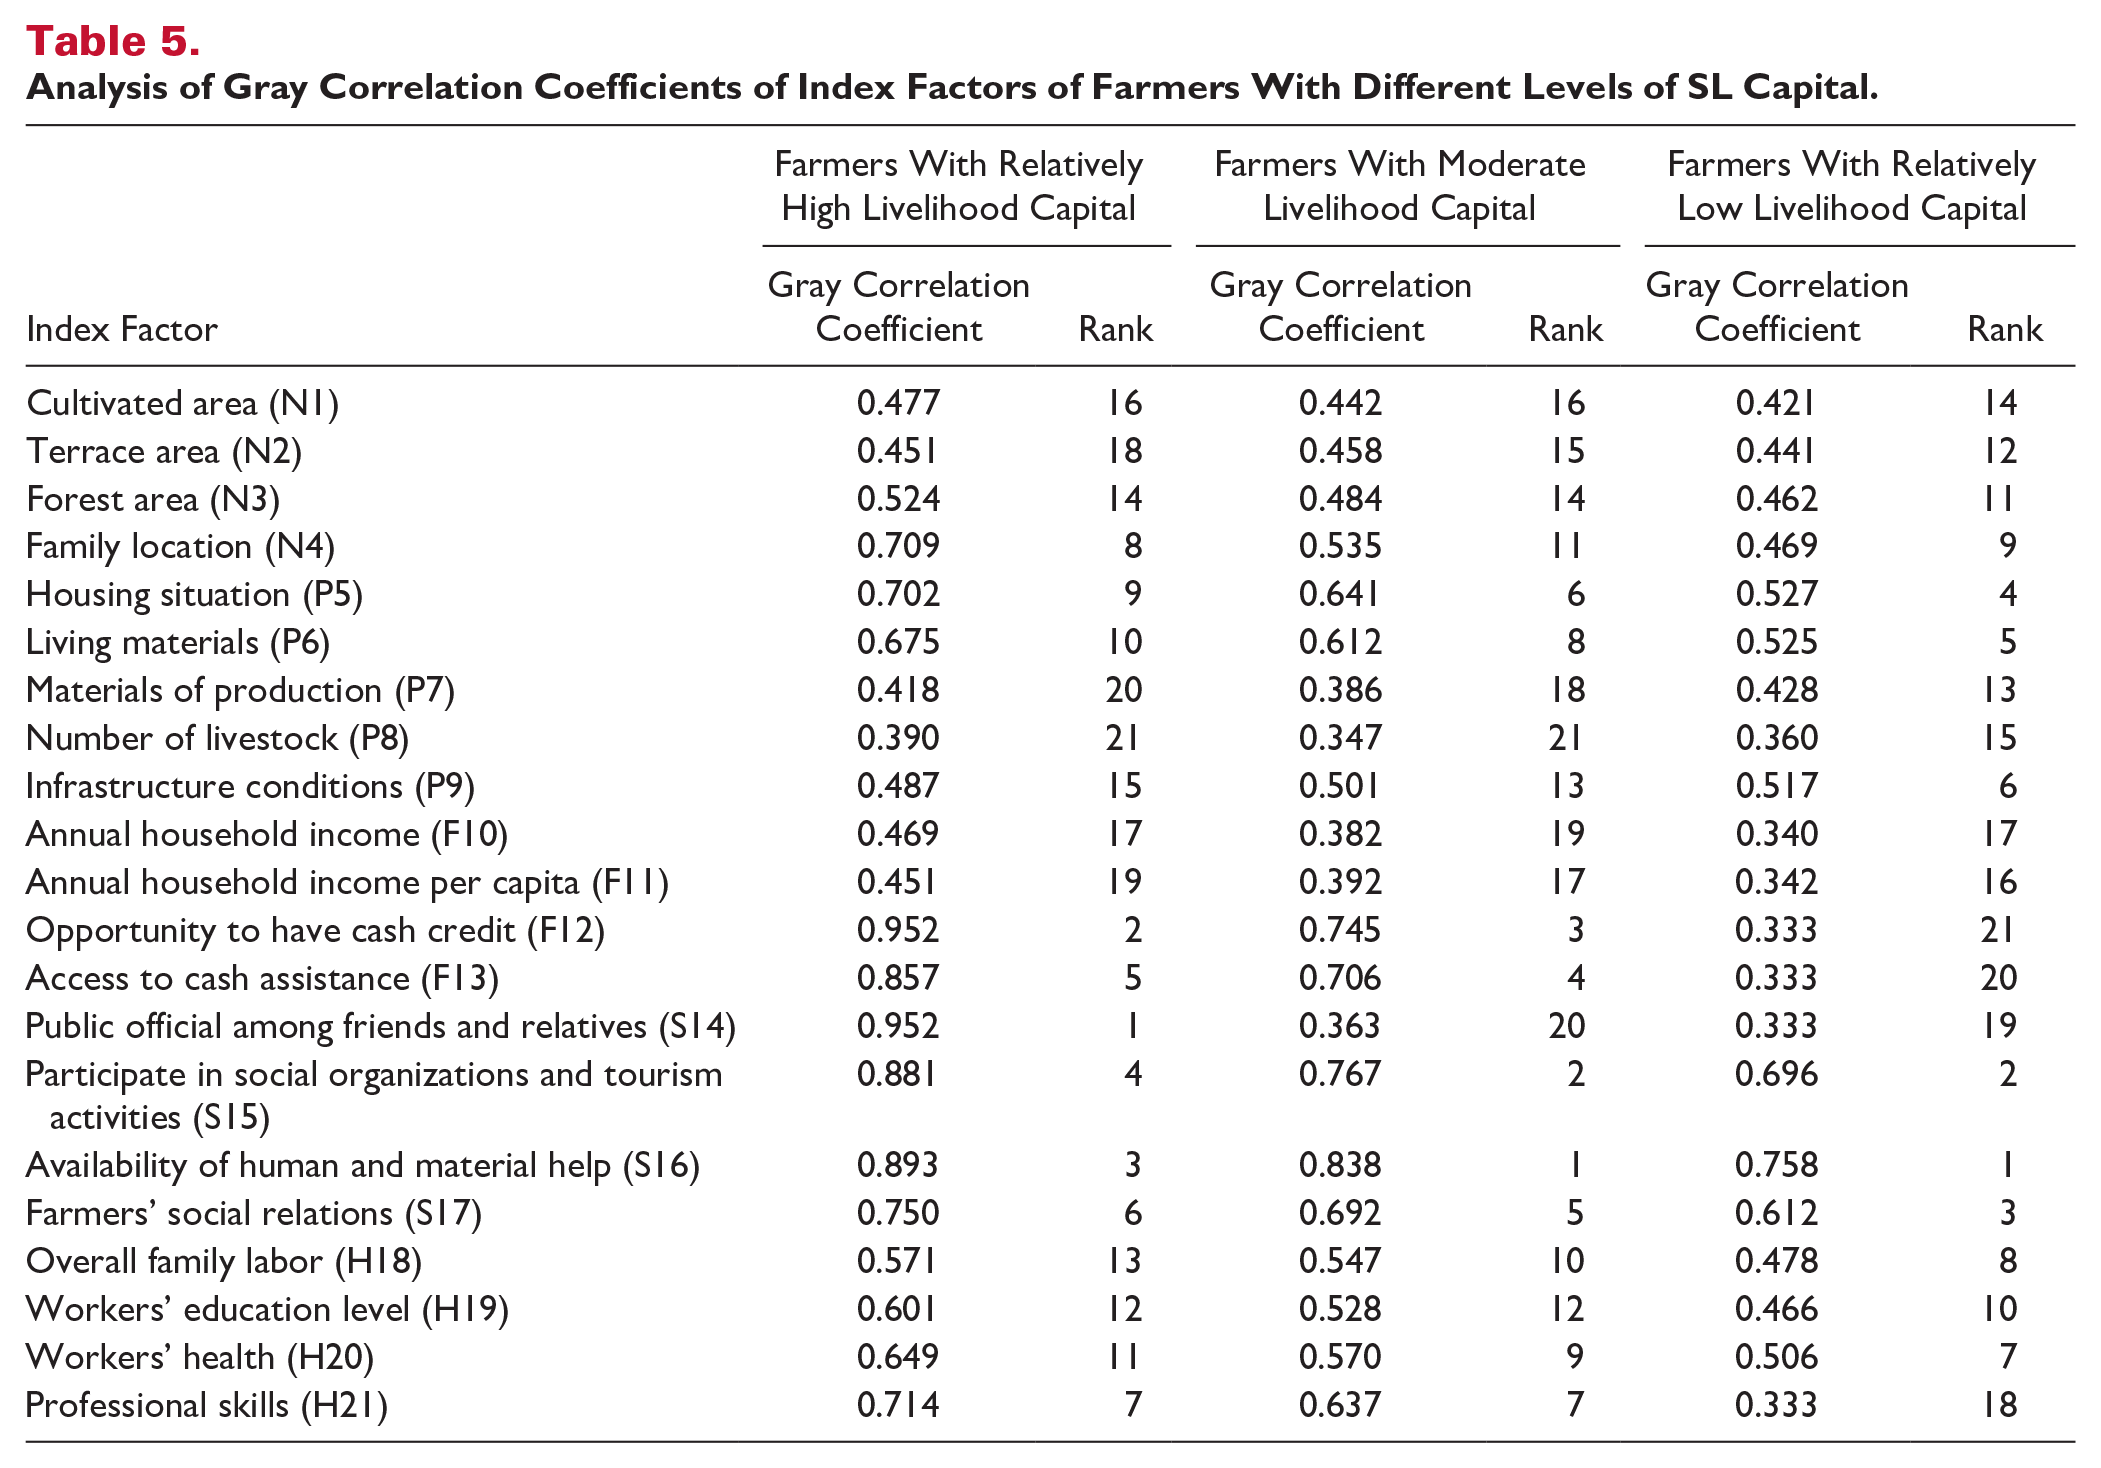
Formula (6) was used to calculate gray relation coefficients for the index layers associated with farmers possessing varying degrees of sustainable livelihood capital; see Table 5. Then, based on the weight of each indicator layer, Formula (7) was adopted to examine five criterion-level aspects (i.e., the five key features of sustainable livelihood capital). Corresponding findings are depicted in Figure 3.
Analysis of Gray Correlation Coefficients of Index Factors of Farmers With Different Levels of SL Capital.
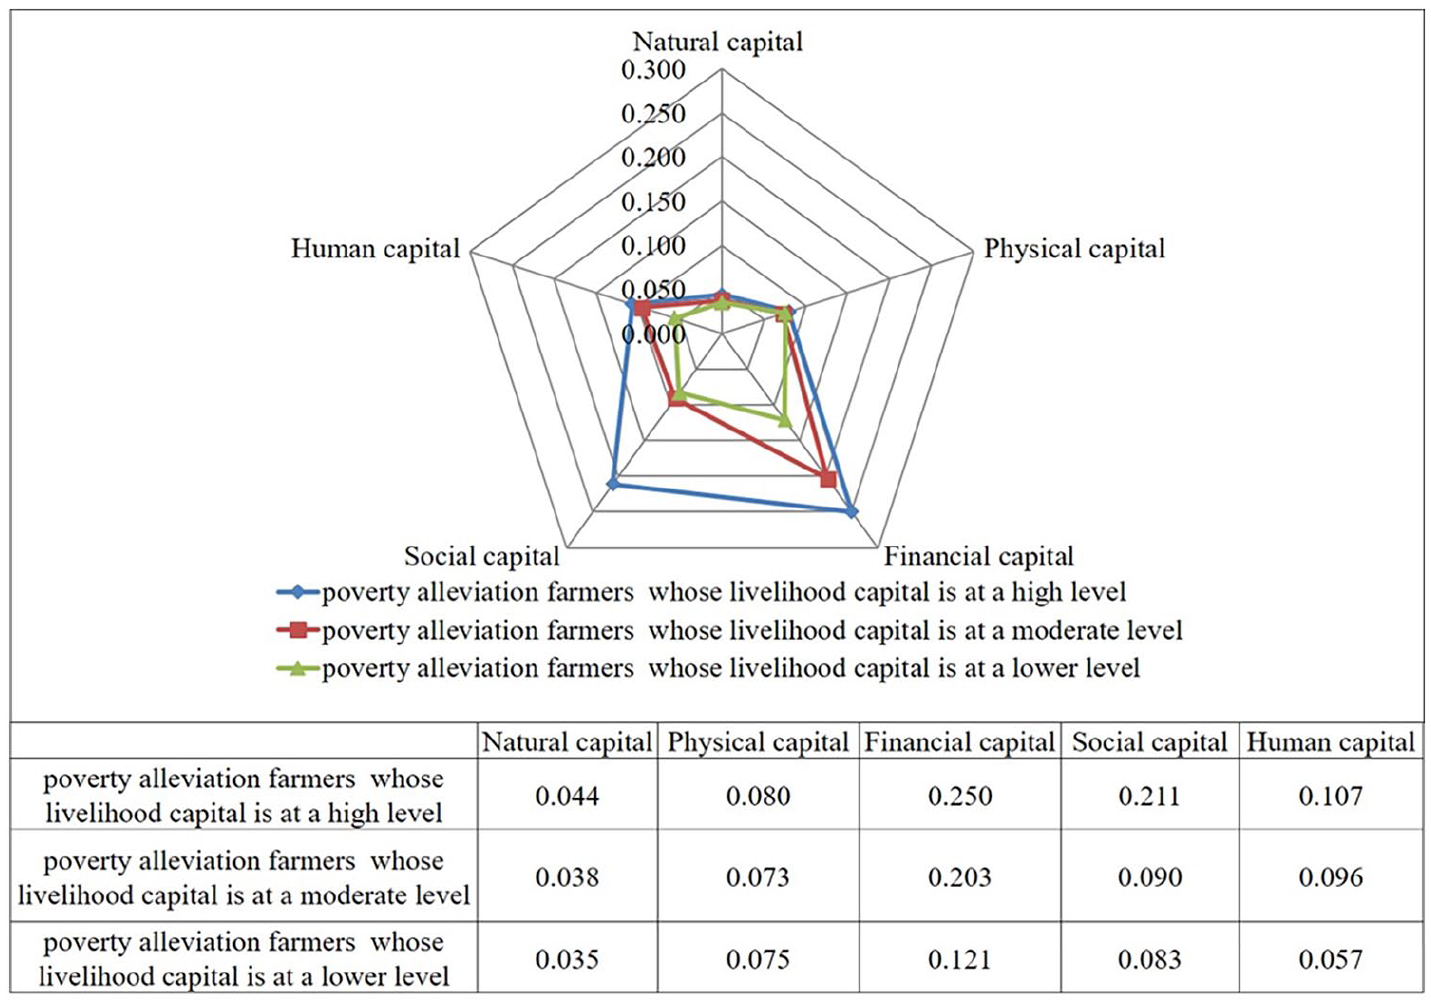
The Gray Correlation Analysis of the Criteria Level of Poverty Reduction Farmers With Different Sustainable Livelihood Capital Levels.
In terms of criterion-level indicators (see Figure 3), few distinctions were observed among three groups of farmers (relatively high, moderate, and relatively low sustainable levels) in natural capital and physical capital. Clearer differences emerged for human capital and social capital. Financial capital demonstrated the most compelling difference among farmers at these three levels.
Among the five types of sustainable livelihood capital, financial capital was most prominent across the three farmer groups. Tourism development notably enhanced inhabitants’ living standards, particularly in terms of economic impacts. Economic effects were also apparent in interviewees’ annual household income: more than half earned over 30,000 RMB (equivalent to US$ 45,233 per the 2018 average exchange rate), which is more than twice the poverty line in China. Tourism financially contributed to enhancing residents’ daily lives. At the same time, however, it widened regional income gaps: “elite” members of the tourism system, who possessed favorable business positions, magnified differences in farmers’ financial capital. Social capital played a significant part as well (Table 3). A sizable difference manifested between farmers whose livelihood capital was relatively high versus the other two groups. The findings from this study, coupled with researchers’ observations, showed that local inhabitants benefited from tourism development—especially in terms of growing financial capital. However, inhabitants’ livelihood capital was clearly imbalanced. Fairness and equity thus remained challenging as uneven development and unequal income continued to threaten sustainable development.
Farmers with relatively high sustainable livelihood capital generally possessed great advantages in financial and social capital. Regarding index-layer factors, F12 (0.952), S14 (0.952), and S16 (0.893) (Table 5) had the largest gray relation coefficients. These farmers belonged to the “elite” in villages: they had strong social networks with relatives and friends in government positions. Their houses tended to be near the terrace scenery (N4 = 0.709). They therefore enjoyed a certain degree of support in their production and living activities along with more intensive participation in tourism projects, making their livelihoods more sustainable. Despite these advantages, the efficiency of natural capital and the rationale behind using physical capital could stand to be improved.
Farmers with a moderate level of sustainable livelihood capital represented the largest group in the study sample. The gray comprehensive relations of financial and human capital were high, whereas human and social capital varied negligibly. Gray relation coefficients were relatively large for index-layer factors S16 (0.838), S15 (0.767), and F12 (0.745) (Table 5). These farmers could acquire human resources and material resources easily, had solid social networks, and seized opportunities to earn cash credit. Their livelihoods were relatively stable and could weather natural disasters or change crop prices to some extent. Gray relation coefficients of human capital among farmers with moderate sustainable livelihood capital ranked second (H = 0.096, Figure 3). Human capital, such as having better education or strong professional skills, seems especially conducive to this group’s long-term development.
Farmers with relatively low sustainable livelihood capital, occupying 43.44% of the sample, were disadvantaged in terms of family labor, chances for financial assistance, and professional skills. The analysis revealed that these farmers earned roughly 3,000 RMB annually (equivalent to US$ 435.40) and could not access favorable loans from banks or other financial institutions. These farmers had fewer opportunities to access cash credit (F12 = 0.333) or cash assistance (F13= 0.333), had few public officials as friends and relatives (S14 = 0.333), and possessed limited skills in tourism or other professional abilities (H21 = 0.333); see Table 5. Human capital H19 had an average score of 0.466 for these farmers, indicating lower human capital compared to the regional benchmark for junior high school graduates. In addition, lower levels of sustainable livelihood capital were associated with lower educational attainment. These patterns imply possible correlations between education, human capital, and sustainable livelihoods in this farmer population. Their index-layer values for all five forms of capital were somewhat low, and their general capital ownership was relatively small, which could influence income and routine household livelihood activities. The ability to pursue various livelihood strategies depends on individuals’ basic material, social, tangible, and intangible assets. These farmers had few livelihood strategies due to limited assets, which may increase the income gap in rural communities over the long term.
Utility of the Sustainable Livelihood Approach in Tourism
A comprehensive evaluation of sustainable livelihood capital uncovered several trends in this study area. First, economic growth through tourism development alleviated poverty in the focal rural ethnic area. As the most important type of economic income, tourism afforded local inhabitants’ opportunities in terms of catering, accommodation, making and selling souvenirs or local specialties, shopping, tour guide services, and shared bonuses from tour ticket sales. More than 65% of farmers in this study participated in tourism activities, as shown in Table 2. The tourism industry enhanced synergistic relationships among local livelihood activities. Livelihood freedom exemplifies the degree to which a community or household possesses the resources and capacity to choose a livelihood portfolio and to shift between activity options (Su et al., 2016; M. Wu & Philip, 2014). Rural inhabitants can choose different livelihood combinations based on their assets and outside opportunities. Inhabitants participating in tourism businesses—particularly those whose family resided in a core scenic area (e.g., a scenic observation platform or along a main road linking scenic sites, such as N4, P5, and S15 in Table 5)—and who maintained strong social bonds tended to possess more assets and livelihood freedom (e.g., S14, F12, and F13 in Table 5). They enjoyed more freedom in choosing among potential economic opportunities. In addition to generating tourism-related income, tourism triggered development by enriching local livelihood portfolios.
Meanwhile, the income gap was widening. Farmers’ overall livelihood capital was not high: the per capita value was 0.459, lower than the median even for areas whose tourism industry had developed for several decades and those that had earned an honor/title and governmental recognition. Natural capital remained lowest across the three farmer groups; physical capital was lower ranking as well. The sustainability of farmers’ livelihood capital hence appeared uncertain.
Second, the area’s fragile environment restricted broader improvements in overall livelihood assets among all poverty-reduction farmers. Entropy weight analysis (Table 3) showed that natural capital (N = 0.079) was the lowest-weighted term among the five types of capital. In the indicator layer, natural lands (N1 = 0.032, N2 = 0.012, and N3 = 0.009) and tourism-related natural resources (N4 = 0.026) had low scores. The two indicators of physical capital, living materials (P6 = 0.006) and infrastructure conditions (P9 = 0.007), were also weak.
Third, the results pointed to a noticeable disparity in farmers’ sustainable livelihood capital (Table 4). The imbalance in farmers’ livelihood capital indicated a widening gap among them. Regarding specific index factors, these discrepancies were reflected in opportunities for financial assistance (F12, F13), farmers’ professional skills (H21), and guanxi (S14) (Table 5). Increased financial capital was the most evident benefit of tourism and could enhance residents’ sustainable livelihood. Importantly, though, this element is a double-edged sword: greater financial capital also widened the equity gap, including the possibility of cumulative advantages or disadvantages in financial and social capital. Farmers whose livelihood capital was low were at a disadvantage in terms of vocational skills and financial support, partially due to the efficiency and targeting of poverty reduction policies and resource allocation. From an internal perspective, farmers’ limited ability for self-development further compromised their livelihood sustainability. Improved human capital and financial capital appeared vital, especially among farmers with relatively low sustainable livelihood capital (Table 5).
Implications and Future Research
Theoretical Implications
This study contributes to the literature by empirically examining and demonstrating how tourism development affects poverty alleviation in impoverished rural ethnic areas by calculating livelihood capital from a person-centered perspective. While rural-ethnic-based tourism provides economic benefits to the poor as reported previously (Fabinyi, 2010; Su et al., 2016), this study unearthed structural differences in human capital, social capital, and financial capital by applying the entropy weight method and GRA. Barriers to individual farmers’ sustainable livelihood in a remote rural ethnic area were also identified. In particular, the trickle-down effect proposed by the “profit camp” (Croes & Rivera, 2015; Hawkins & Mann, 2007; Kim et al., 2016) did not uniformly reach all locals in need of poverty alleviation. The SLF was applied to analyze an ethnic tourism destination in a rural area grappling with poverty within an emerging-market context. Findings expand this framework’s boundaries and applicability in addition to offering fresh insights into the links between tourism, poverty reduction, and livelihood capital.
Earlier studies typically examined sustainable livelihood development in tourism areas using conceptual, qualitative, or descriptive methods. This study took a further step by quantifying the community/household level with a set of indicators to assess sustainable livelihood capital and the role of tourism. Sustainable livelihood development in a rural ethnic area was operationalized in terms of five types of capital, and an evaluation index system comprising 21 indicators was built based on the core components of the SLF. The entropy weight method (an objective weighting method) and GRA (to evaluate multiple objective functions simultaneously) were subsequently employed. The resulting measurement approach contributes to tourism and hospitality research as well as livelihood studies. Put simply, this analysis provides a benchmark for exploring the dynamic relationships among poverty alleviation, tourism, and sustainable development. In general, the evaluative approach in this paper aligned well with the focal villages’ circumstances. It offered insight into the development of farmers’ sustainable livelihood, particularly in villages using tourism to reduce poverty. It also stressed the need for government–community–resident collaboration in improving sustainable capabilities. Vertical comparisons across time and horizontal comparisons in categories such as spatial geography (e.g., using historical data) supported tourism’s multifaceted role in local inhabitants’ livelihood—especially in terms of diversified activities and lifestyles, farmers’ views of tourism development, and the protection of indigenous cultures.
Meanwhile, the presented analytical method empirically reveals that tourism is not a panacea for poverty in remote ethnic areas. Although tourism development may alleviate rural poverty in principle and influence local family income (both in absolute amount and revenue sources), its differential effects on reducing poverty and livelihood diversity should be carefully evaluated. The final assessment result reflects that sustainable livelihood is not only an economic matter (financial capital and physical capital) but also concerns natural capital, social capital, and human capital. In his discussion on the cause of poverty and famines, Sen (1982) indicated that the poor have less access to resources, lack the skills to solve poverty-associated problems, and are hence unable to achieve what they value. In the present case, residents in a remote rural area saw their financial capital and social capital quickly improve thanks to tourism development, yet their natural capital and human capital lagged. A structural unbalance in livelihood persisted. Poverty reduction is meant first and foremost for people and families. When investigating sustainable livelihood, it is recommended to adopt both macro and micro perspectives and to extract individual differences from aggregated patterns and statistics.
Practical Implications
This study unveiled that locals’ living conditions had generally improved compared with decades prior. At the time of this study, residents enjoyed enhanced local infrastructure, the protection of traditional ethnic culture, and higher household income due to tourism. Longsheng County inaugurated an expressway in 2020, representing a substantial enhancement in local transportation infrastructure facilitated by government investment. This development, together with investments from domestic and foreign sources, could catalyze sustainable growth—particularly in the rural tourism context. Although the two villages had developed tourism over decades, sustainable livelihood capital remained low at the individual level, and differences among poverty reduction households were stark. Overall development trends cannot compensate for individual imbalances.
Findings also inform recommendations for rural ethnic farmers and governments regarding sustainable livelihood development beyond Longsheng. First, rural ethnic farmers need to be motivated. The key to improving these farmers’ sustainable livelihood lies in enhancing their abilities and inspiring entrepreneurship. Field observations showed that some local farmers lacked a strong awareness of development opportunities or a desire to learn. The two village heads mentioned in their interviews that the local tourism authority had offered training, but not many locals had attended. Farmers’ own motivation is a cornerstone of sustainable livelihoods in this population.
Second, more equitable government support and guidance mechanisms should be established, especially in terms of public infrastructure construction, inclusive education, regular rural tourism skills training, vocational education, and financial support. Social security plays a significant role in poverty alleviation and sustainable development. A social safety net should be built to provide security for farmers’ livelihoods, reduce their financial burden, and prevent poverty caused by poor health in rural ethnic villages. This case reinforces how tourism can benefit residents but illuminates obstacles to ensuring sustainable livelihood through tourism. The two villages received substantial and sustained government support. A fundamental challenge entails ensuring fair and efficient resource allocation among all stakeholders in the poverty alleviation process. Namely, fairness and equity remained challenging. Having some extent of guanxi with a public official, in terms of friendship or even a family connection, appeared critical in the study area. Local governments should strive for fair policy implementation, which is key when establishing a rural tourism development system.
Third, not all indigenous villages can use tourism to alleviate poverty. Tourism does not occur in a vacuum; successful tourism development usually calls for resources such as land, labor, and capital and social relation capacities. This study revealed little variation in natural and physical capital in the focal villages, whereas mindful system design, humanistic care, and targeted poverty alleviation would make real differences and are vital to feasible livelihood interventions. The circulation of village land resources should be institutionalized to ensure viable use of such resources while minimizing possible damage to ethnic traditional architecture and agriculture.
Limitations and Future Research
As mentioned, the evaluative approach in this paper aligned well with the focal villages’ circumstances. Results offer meaningful insight into the development of farmers’ sustainable livelihood, particularly in villages using tourism to reduce poverty. Yet this study has several weaknesses that subsequent work may rectify. First, to thoroughly evaluate sustainable livelihood capital in the study area, a more comprehensive index system can be constructed. Such a system should contain additional qualitative indicators with an eye toward social and human capital. These enhancements would enable a more precise appraisal of livelihood capital. Second, how the COVID-19 pandemic (before, during, and after the outbreak) has influenced the study area in terms of the five forms of capital merits investigation warrants further investigation. Furthermore, findings are delimited to this research setting. Scholars should consider other ethnic tourism sites to reinforce the rigor and robustness of the proposed approach. This assessment system should also be applied to more cases to determine its generalizability. Finally, spatial analysis methods (e.g., ArcGIS) may be incorporated when evaluating sustainable livelihood capital to construct a more vivid livelihood map.
Footnotes
Appendix
Gray Comprehensive Relational Degree of Poverty Reduction Farmers’ Livelihood Capital.
| Farmer ID | Gray Comprehensive Relevance | Farmer ID | Gray Comprehensive Relevance | Farmer ID | Gray Comprehensive Relevance |
|---|---|---|---|---|---|
| D-1 | 0.352 | D-50 | 0.422 | P-99 | 0.359 |
| D-2 | 0.452 | D-51 | 0.507 | P-100 | 0.466 |
| D-3 | 0.435 | D-52 | 0.354 | P-101 | 0.723 |
| D-4 | 0.346 | D-53 | 0.549 | P-102 | 0.375 |
| D-5 | 0.421 | D-54 | 0.515 | P-103 | 0.386 |
| D-6 | 0.362 | D-55 | 0.448 | P-104 | 0.510 |
| D-7 | 0.611 | D-56 | 0.461 | P-105 | 0.366 |
| D-8 | 0.799 | D-57 | 0.436 | P-106 | 0.411 |
| D-9 | 0.489 | D-58 | 0.378 | P-107 | 0.517 |
| D-10 | 0.412 | D-59 | 0.454 | P-108 | 0.374 |
| D-11 | 0.459 | D-60 | 0.530 | P-109 | 0.388 |
| D-12 | 0.450 | D-61 | 0.377 | P-110 | 0.590 |
| D-13 | 0.467 | D-62 | 0.377 | P-111 | 0.713 |
| D-14 | 0.364 | D-63 | 0.368 | P-112 | 0.483 |
| D-15 | 0.370 | D-64 | 0.467 | P-113 | 0.570 |
| D-16 | 0.357 | D-65 | 0.364 | P-114 | 0.508 |
| D-17 | 0.493 | D-66 | 0.366 | P-115 | 0.489 |
| D-18 | 0.506 | D-67 | 0.383 | P-116 | 0.359 |
| D-19 | 0.491 | D-68 | 0.514 | P-117 | 0.534 |
| D-20 | 0.393 | D-69 | 0.627 | P-118 | 0.365 |
| D-21 | 0.370 | D-70 | 0.509 | P-119 | 0.368 |
| D-22 | 0.581 | D-71 | 0.519 | P-120 | 0.578 |
| D-23 | 0.365 | D-72 | 0.446 | P-121 | 0.366 |
| D-24 | 0.369 | D-73 | 0.372 | P-122 | 0.371 |
| D-25 | 0.530 | D-74 | 0.541 | P-123 | 0.490 |
| D-26 | 0.467 | D-75 | 0.350 | P-124 | 0.373 |
| D-27 | 0.451 | D-76 | 0.359 | P-125 | 0.492 |
| D-28 | 0.385 | D-77 | 0.493 | P-126 | 0.591 |
| D-29 | 0.384 | D-78 | 0.436 | P-127 | 0.485 |
| D-30 | 0.357 | D-79 | 0.459 | P-128 | 0.358 |
| D-31 | 0.366 | D-80 | 0.381 | P-129 | 0.484 |
| D-32 | 0.355 | D-81 | 0.466 | P-130 | 0.352 |
| D-33 | 0.366 | D-82 | 0.375 | P-131 | 0.490 |
| D-34 | 0.534 | D-83 | 0.591 | P-132 | 0.568 |
| D-35 | 0.361 | D-84 | 0.650 | P-133 | 0.376 |
| D-36 | 0.356 | D-85 | 0.377 | P-134 | 0.498 |
| D-37 | 0.352 | D-86 | 0.351 | P-135 | 0.384 |
| D-38 | 0.370 | D-87 | 0.727 | P-136 | 0.624 |
| D-39 | 0.387 | P-88 | 0.499 | P-137 | 0.496 |
| D-40 | 0.371 | P-89 | 0.497 | P-138 | 0.389 |
| D-41 | 0.362 | P-90 | 0.431 | P-139 | 0.476 |
| D-42 | 0.478 | P-91 | 0.670 | P-140 | 0.481 |
| D-43 | 0.472 | P-92 | 0.373 | P-141 | 0.581 |
| D-44 | 0.585 | P-93 | 0.379 | P-142 | 0.386 |
| D-45 | 0.700 | P-94 | 0.586 | P-143 | 0.393 |
| D-46 | 0.353 | P-95 | 0.506 | P-144 | 0.483 |
| D-47 | 0.356 | P-96 | 0.629 | P-145 | 0.797 |
| D-48 | 0.348 | P-97 | 0.652 | ||
| D-49 | 0.364 | P-98 | 0.666 |
Author’s Note
Min Feng is now affiliated to Guangdong Engineering Polytechnic College, China.
Declaration of Conflicting Interests
The author(s) declared no potential conflicts of interest with respect to the research, authorship, or publication of this article.
Funding
The author(s) disclosed receipt of the following financial support for the research, authorship, and/or publication of this article: The manuscript is supported by the National Natural Science Foundation Project of China (Grant no. 72064007).