
Abstract
This study utilizes a collaborative and historical research approach to examine how and why environmental and socioeconomic burdens have accumulated over time in Port Arthur, Texas, especially on its west side. As a majority non-White city ringed by refining and petrochemical facilities—including the second largest oil refinery in North America—Port Arthur has long exemplified the “sacrifice zones” discussed in environmental justice literature and has been frequently cited in studies on cumulative impacts (CIs). This article offers two key contributions. First, it explores how local patterns of racism and structural inequities took shape historically, becoming ingrained especially under Jim Crow and contributing to the disproportionate exposure of Port Arthur’s Black neighborhoods to industrial pollution. We develop this explanatory framework through the georeferencing of census records, zoning and land use maps, and Environmental Protection Agency (EPA) datasets, as well as extensive archival research, including community newspapers and oral histories, integrating these through an analytical narrative using StoryMap. Thereby, we provide a long-term, explanatory framework especially for West Port Arthur’s consistently high percentile rankings on environmental, climate, health, and socioeconomic burden indices—such as those in the EPA’s EJScreen. Second, we situate our use of StoryMap within a broader literature on effective community outreach, education, and engagement strategies regarding CIs. We argue that StoryMap, an ArcGIS-developed platform, serves as an effective tool both for research and for community engagement, uniquely integrating historical and contemporary data to illuminate both the nature and underlying causes of Port Arthur’s cumulative environmental harms.
INTRODUCTION
This special issue reflects how, since the 1990s, the concept of cumulative impact (CI) has developed into a major tool for environmental justice activists, allied academics, and policy-makers to capture, convey, and address the combined dilemmas faced by our nation’s most environmentally overburdened and marginalized communities. Agencies have sought to encompass this “totality of exposures to combinations of chemical and non-chemical stressors and their effects,” as EPA scientists have put it, through mapping tools such as the U.S. EPA’s EJScreen, the Biden White House’s Climate and Economic Justice Screening Tool, and state or local platforms such as California’s CalEnviroScreen 2.0. 1 Correlating a wide range of numerical variables and indexes, these tools identify communities where multiple pollutants and other hazards congregate alongside socioeconomic, disease, and other burdens.2,3,4,5 CI assessment tools have indeed advanced, enhancing consideration of CIs in many relevant fields and policy-making. But quantification alone cannot resolve the many tough questions faced in translating these numbers into policy, nor can it contextualize or explain what it shows. 6 One problem, as Horgan et al. note, is that screening tools “reify or concretize” the health, environmental, and other burdens confronted by a community, and can thereby seem to “naturalize” the social production of inequities they spotlight. 7 That historical approaches “have not been employed in environmental justice to a large degree,” as Boone and Buckley note, contributes to a related flaw in enumerations of today’s CIs: They often lack historical context. 8
Addressing these gaps and deficiencies head-on, this article suggests what a more historical approach can contribute to our understanding of the CIs in one industrial city, Port Arthur, Texas. That begins with how it can encompass not just recent years but decades of exposure. As we now know, many of pollution’s effects are chronic; moreover, long-term and multiple exposures as well as pollutant-driven “epigenetic” changes can accelerate biological aging, heighten disease risks from cancer or other chronic diseases, and even pass impacts from one generation to another.9,10,11,12 In this article, however, we concentrate on what historical research can reveal about the power-laden processes that steer environmental and other burdens onto some people and communities more than others: policies that turned Port Arthur’s West Side into an environmental “sacrifice zone.” 13 Focusing especially on the period prior to modern pollution control, from the 1920s through the 1960s, we show how successive waves of especially local policy-making facilitated the concentration of environmental and socioeconomic burdens there. Their legacies, also largely sustained from the 1970s onward, pose deep-rooted yet ongoing challenges for equitable policy responses today.
While federal policy-makers have thus far received the most attention in this history, our research brings out the importance, especially of local policies and decision-making in establishing these environmental inequities. Environmental justice studies have thus far zeroed in mainly on one early twentieth-century federal initiative: Home Owners Loan Corporation (HOLC) redlining maps from the 1930s, recently digitized by a team at the University of Richmond.14,15,16 But our research into Port Arthur over this same earlier period affirms historian Rob Gioelli’s caution about what an exclusive emphasis on federal influence “masks”: how “local private actors in every American city fully endorsed, sponsored, and assisted with the design and implementation of redlining policies.” 17 Critical to establishing and upholding these patterns in Port Arthur, we show, was a regime of Jim Crow shared with other cities across the American South.
While engaging this scholarly debate about the sociohistorical drivers of environmental inequities in American cities, we also describe two innovations in our research process for understanding the history of Port Arthur’s CIs that, in contrast to our profession’s tradition of the lone academic historical researcher, more thoroughly engage the affected community. First, the purview and agenda for our historical research have come not just from professional historians but out of extended discussions with our activist coauthor and other community members. And second, to analyze as well as to present our findings about Port Arthur’s history to Port Arthurians, we have employed a relatively new digital platform known as ArcGIS StoryMaps. This tool enabled us to combine contemporary environmental, health, and other data from screening tools such as EJScreen, with both past data and with text and multimedia visuals. Thereby, StoryMaps proved useful both for correlating and analyzing our findings from our deep dive into Port Arthur’s past and for communicating this history in a way that accessibly engages community members.
BACKGROUND AND METHODS
Port Arthur today represents a kind of poster child for CIs. It contains the second, tenth, and 27th largest oil refineries in the United States, with a capacity to refine 1,224,000 barrels per day, and numerous attendant chemical plants. 18 Along with the towns of Beaumont and Orange (the “Golden Triangle”), it comprises one of the nation’s leading petrochemical hubs, with 2.2 million pounds of toxic chemicals released into the air by industrial facilities within the city limits in 2023. 19 These threats impinge on a town of 55,335 people in 2024, 29% of whom lived in poverty, and 42.5% of whom are Black, 35% Latino, and 25% White. 20 A health study of Port Arthur in 2004 found elevated respiratory and other disease symptoms compared to nearby Galveston, and in another study of Jefferson County’s Blacks found them 15% more likely than other Texans to develop cancer, and 40% more likely to die from it.21,22 CIs have accrued especially on Port Arthur’s historically Black West Side, along the fence line of the town’s two biggest refineries, and in zip code 77640, with releases in 2023 of 1.44 million pounds of air toxics. The 12 census tracts nearest them are all at least 94% Black, and several flash red on EJScreen, registering at or above the 95% percentile nationally on toxic releases to air, low life expectancy, lack of health insurance, unemployment, and low income. Port Arthur has acquired a national reputation as a “sacrifice zone,” from a book by that title to EPA’s designation of it as an “Environmental Justice Showcase” to published investigations of its cumulative risks.23,24,25,26
While Kelley himself was instrumental in much of the latter work, the historical research recounted here began in 2022, as part of an National Science Foundation (NSF) funded collaboration between his Community In-Power Development Association (CIDA) and an interdisciplinary team within the Environmental Data and Governance Initiative (EDGI) led by historians Chambers and Sellers. While one vein of research for this project centered on the U.S. Environmental Protection Agency, another probed how one community, Port Arthur, Texas, accumulated so many environmental and other detrimental impacts in ways that often eluded EPA’s purview and power to act. We set out to investigate how, despite these environmental injustices, government policies—ranging from zoning laws to selective enforcement of environmental regulations—have reinforced the concentration of environmental hazards in Port Arthur’s marginalized communities. We developed a community-based participatory method that, unlike so many of its adaptations to environmental justice and CIs studies, involved professional historians and investigation of this community’s past.27,28 While the historians on our team did much of the digging into past documents and data, ongoing conversations with CIDA as well as community members steered this research itself and the scope and trajectory of our synthesis.
The research began by delving into how and why an environmental justice movement arose in the 1990s to highlight under-regulated refinery pollution. Team conversations clarified the ongoing breadth of CIDA’s interests not just in pollution but in problems such as joblessness, low home values, and flooding exacerbated by climate change. Our research into Port Arthur’s environmental burdens then widened to also encompass the industrial, labor, housing, and political history and to include archival, interview, and longitudinal methods, the three “historical approaches” described by Boone and Buckley. 29
To craft a more longitudinal angle on this town’s current CIs, we sought out comparable quantitative data to that in EJScreen from further back in time, including environmental, socioeconomic, and demographic information running back a century or more. As much finer-grained data was already georeferenced or could be, Stony Brook’s Geospatial Center came aboard to gather and synthesize it with other Geographic Information System (GIS) - ready maps, from the easily available 1930s redlining by HOLC to historical census data to maps of town zoning, land use, industrial location, and pollution georeferenced by our team.30,31 To address source inaccuracies (for instance, zoning maps that missed informal land uses), we cross-referenced with other sources providing correctives (for instance, maps of land use). Zoning and land-use maps, as well as early pollution studies, came from public library collections and city archives. Georeferencing their information enabled us to cross-analyze them with one another and also with contemporary environmental data from the EPA’s EJScreen, to assess long-term historical as well as spatial patterns by which impacts accumulated. ArcGIS’s StoryMaps proved a powerful tool for this integrative analysis, illuminating spatial correlations between various impacts and enabling us to follow continuities as well as changes in these patterns across time.
At the same time, qualitative research enabled us to flesh out many of the political and economic dynamics driving what the numbers and maps showed. To understand the policy and other processes that produced the environmental injustices landscape and patterns visible in Port Arthur today, we consulted historical newspapers, photograph collections, town government documents, and other community groups archives in the Port Arthur Public Library and elsewhere. To capture the community-level experiences of this history and its consequences for daily life, the ethnographic lens provided by oral histories proved indispensable.
ArcGIS’s StoryMaps also served the final goal of the project: conveying this recovered history of Port Arthur directly to the community itself. Its 2019 release, pitched as “digital storytelling with maps,” has already acquired many uses from government agencies to classroom teachers. As with many of these adopters, we appreciated how easily incorporates not just maps but visual imagery, audio and video such as from oral histories, but textual narratives, “bringing together the utility of mapping and storytelling.”32,33,34,35 It thus “create[s]… a distinctive and integrated platform for visual representations of stories, places, people, and events.” 36 StoryMap fit our presentational needs well, as unlike many other community-based researchers, we aimed to communicate not just facts and data but to enfold these within a historical narrative that would help Port Arthurians interpret their significance.
Overall, our study employs a mixed-methods approach, integrating GIS analysis to quantify environmental burdens, historical research to trace policy decisions, and community engagement to contextualize findings within lived experiences. A nine-part StoryMap collection synthesized our many findings via a narrative thread revolving around the changing historical balance of benefits versus burdens that Port Arthur’s oil refineries and petrochemical plants brought to this community. 37 The research on display in our StoryMap also provides a multifaceted historical answer account of why Port Arthur became such an exemplar of environmental racism: those dynamics through which so many burdens came to be concentrated in this town, and especially on its West Side.
WHY DID SO MANY DETRIMENTAL IMPACTS ACCUMULATE IN WEST PORT ARTHUR?
Our answer to this most basic question in environmental justice studies draws upon an extensive tradition in environmental history, studying the roots of environmental inequities in particular places. While the 1930s HOLC maps, now recognized by many environmental justice scholars, played a supporting role, most environmental historians find many additional historical reasons for these inequities, especially at the local level.38,39,40,41,42 In Port Arthur, the HOLC maps themselves were drawn by local realtors, and actions by the local government had a more direct and definitive hand in cementing this pattern into local law, thanks to Port Arthur’s version of Jim Crow. From the 1920s up until the 1960s, these and other discriminatory local and state policies ensured White control over who lived where. We focus here on this critical formative period, prior to the fall of Jim Crow as well as the emergence of modern pollution control in the 1960s and 70 seconds, when the city’s non-Whites had little choice but to live on its West Side, even as the refineries faced few constraints in their emissions.
Only 30 miles south of where Spindletop Lucas gusher commenced a Texas oil boom in 1901, Port Arthur quickly came to harbor one of the world’s largest refinery complexes.43,44,45 By 1916, its Gulf refinery ranked as the second largest in the United States, and the Texas Company’s was fourth; with two other major refineries joining them over the next two decades.46,47,48 Many new jobs attracted thousands of both White and Black Americans by the 1920s, as well as immigrants from Mexico, many of them fleeing that country’s recent revolution. 49 Already by 1925, the earliest map of Black and Brown residences in Port Arthur discovered in our historical research shows a housing pattern for both groups that would persist over many decades to come. When a team from Columbia University Teachers’ College surveyed Port Arthur’s public school system in that school year, they mapped out the confinement of the city’s small but growing Black and Mexican population to the city’s West Side, wedged between the Gulf and Texas Company (future Texaco) refineries (Fig. 1). 50
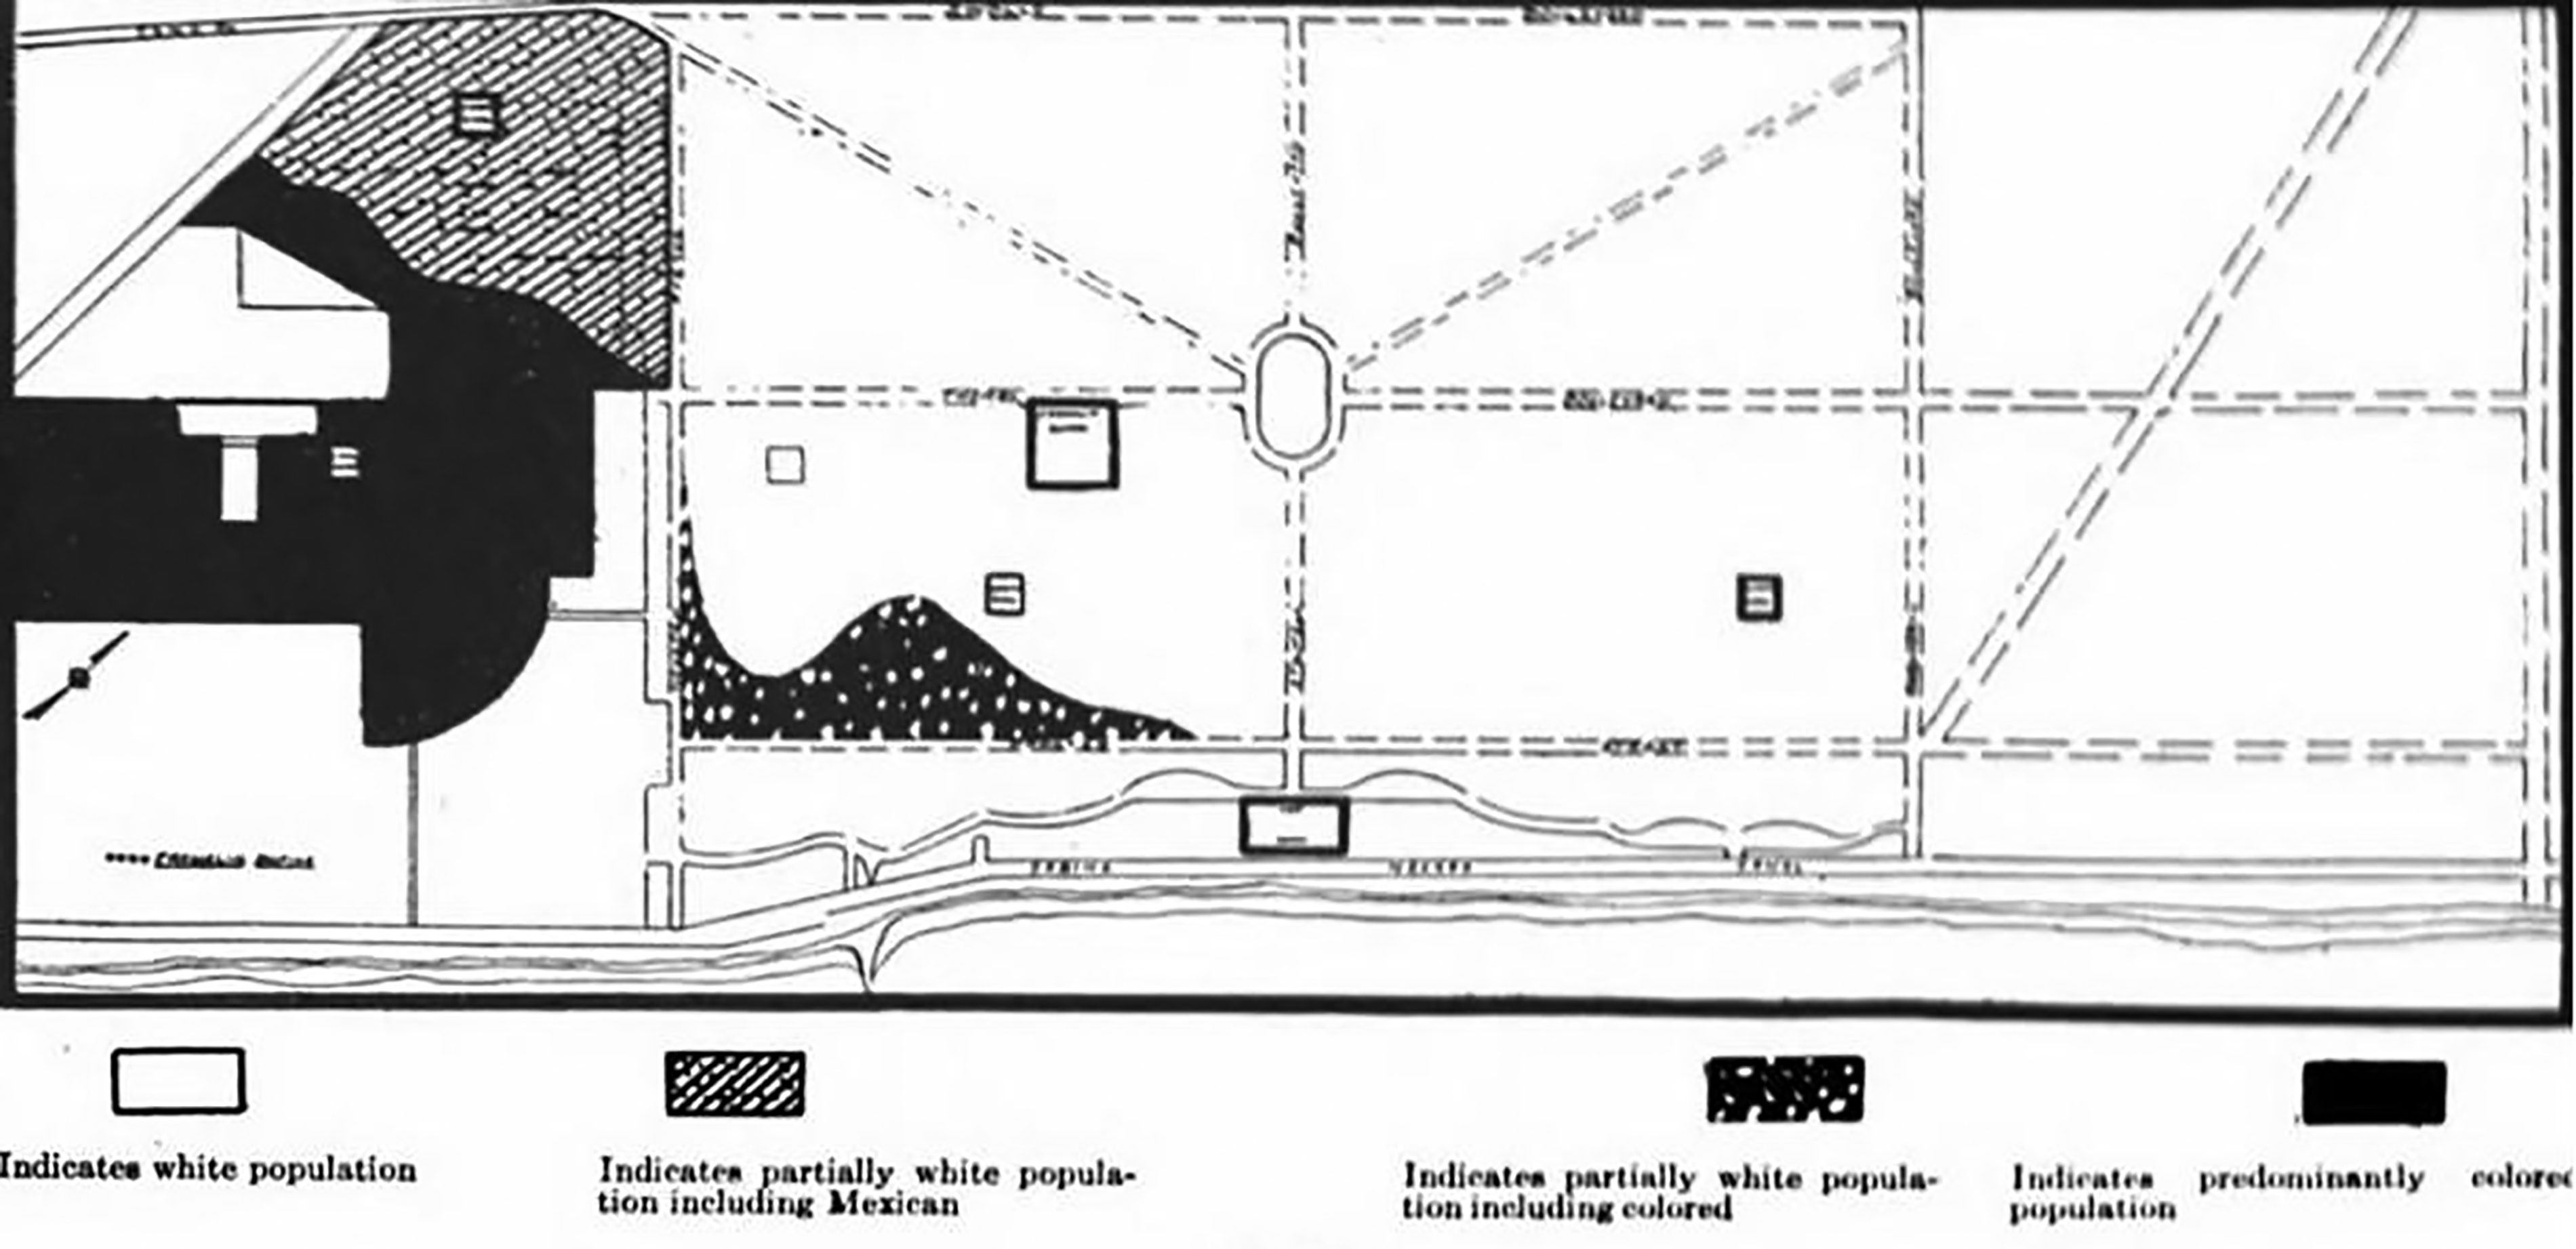
Map illustrating the racioethnic distribution of population in Port Arthur by 1925, with the largest refineries lying just off the map to the left (Gulf) and the top (Texas Company)a.
In 1925, most non-Whites in Port Arthur resided next to its two biggest refineries, just over a couple of decades after the Gulf and Texas Company facilities had arrived. The discriminatory attitudes and customs confining them there had roots running back to slavery, the Civil War, and a failed Reconstruction, but by the 1920s, the state and city governments overseeing Port Arthur had also gotten involved. Here, as in other parts of the American South, doctrines of White supremacy justified exclusions of non-Whites not just from better educations and higher-paying jobs, and by Texas state law, from primary elections—in this and other one-party Democratic states, the only balloting that counted. Consequently, town governance lay exclusively in White hands, and alongside the racial restrictive covenants that kept Blacks out of more exclusive subdivisions, Port Arthur also had a segregation ordinance that barred them from buying homes beyond the West Side. When, in the late 1920s, Blacks nevertheless began to purchase uncovenanted homes past 16th Street, in central Port Arthur, White residents successfully persuaded the all-White city government to enforce it. 51 The racial tensions helped spur Port Arthur’s first zoning commission, which came up with a plan for regulating land uses throughout the city. In doing so, White leaders turned a deaf ear to a recently organized Negro Business League, which pointed out: “We have our west ends margined and congested. You have your parks, pools and Pleasure Pier. We have no room for one park of passing consideration.” 52
Remarkably, the considerable pollution emitted by the refineries went unmentioned in these early public debates about zoning and land use. Residents’ as well as reporters’ reluctance even to mention it furnished a building block for what became a long-standing deference to the refineries in local political culture, presumed as they were to be engines of the town’s economic prosperity. Nevertheless, explosions at these plants regularly stoked widespread distress across nearby neighborhoods, including one in 1929 at the Gulf Refinery that spurred “hundreds of calls from frightened residents” to the local paper. 53
By the Great Depression, when housing and real estate markets collapsed across the nation and New Dealers in Washington sought ways of reviving them, Black Port Arthurians made up an estimated 20% of the population and “Mexicans” numbered about a thousand. 54 Members of the city’s white-dominated real estate industry took advantage of federal initiatives as these began, upholding the city’s racially segregated housing patterns while burnishing their own business prospects. Three Port Arthur “real estate men” drew and signed the Home Owners’ Loan Corporation’s “redlining” map for the city. S.O. Lattimore, the first author, had been a local broker for HOLC’s loans. He and W.L. Shephard then specialized in local home loans and sales connected to federal programs, for properties on both sides of the city’s preestablished color line.55,56,57,58 The maps themselves, intended as guidance for future investments, added geographic precision to patterns already sketched by the city’s segregation ordinance, also by a zoning commission whose plan had not yet been approved by the city. Refinery-proximate neighborhoods, already mostly Black or Brown, were rated lowest—as C, D, or “Negro”—while white areas further from the plants garnered higher (B) or highest ratings (A), as the best prospects for future investment and residential development.55
Whereas HOLC ratings only differentiated between residential neighborhoods and had no legal authority, city zoning codes also regulated industry and commerce and were legally binding. In 1941, as real estate markets began picking up, the Port Arthur City Council finally approved its first comprehensive zoning ordinance. Setting geographic bounds for industrial and commercial development, Port Arthur’s zoning code officially declared the better-off White neighborhoods to the east, the only ones to be protected, as exclusively “residential” zones. By contrast, Black and Latino neighborhoods that had been designated C, D, and “Negro” in the HOLC maps were deemed the only places where “industry” or “heavy industry” was allowed—along with nearly every other type of land use (Fig. 2a and b). This local policy-making effectively wrote the proximity of this city’s two biggest refineries to Port Arthur’s historically Black neighborhoods on the West Side into local law. A Black business and commercial district had consolidated along West 7th and adjacent streets to the west, with its own shops and eating places as well as two theaters. 59 Yet officially sanctioned, “unrestricted” zoning of this part of town ensured a racialized accumulation of pollution and other impacts there over the coming decades, to the detriment of the health, wealth, and welfare of its residents. 60

(
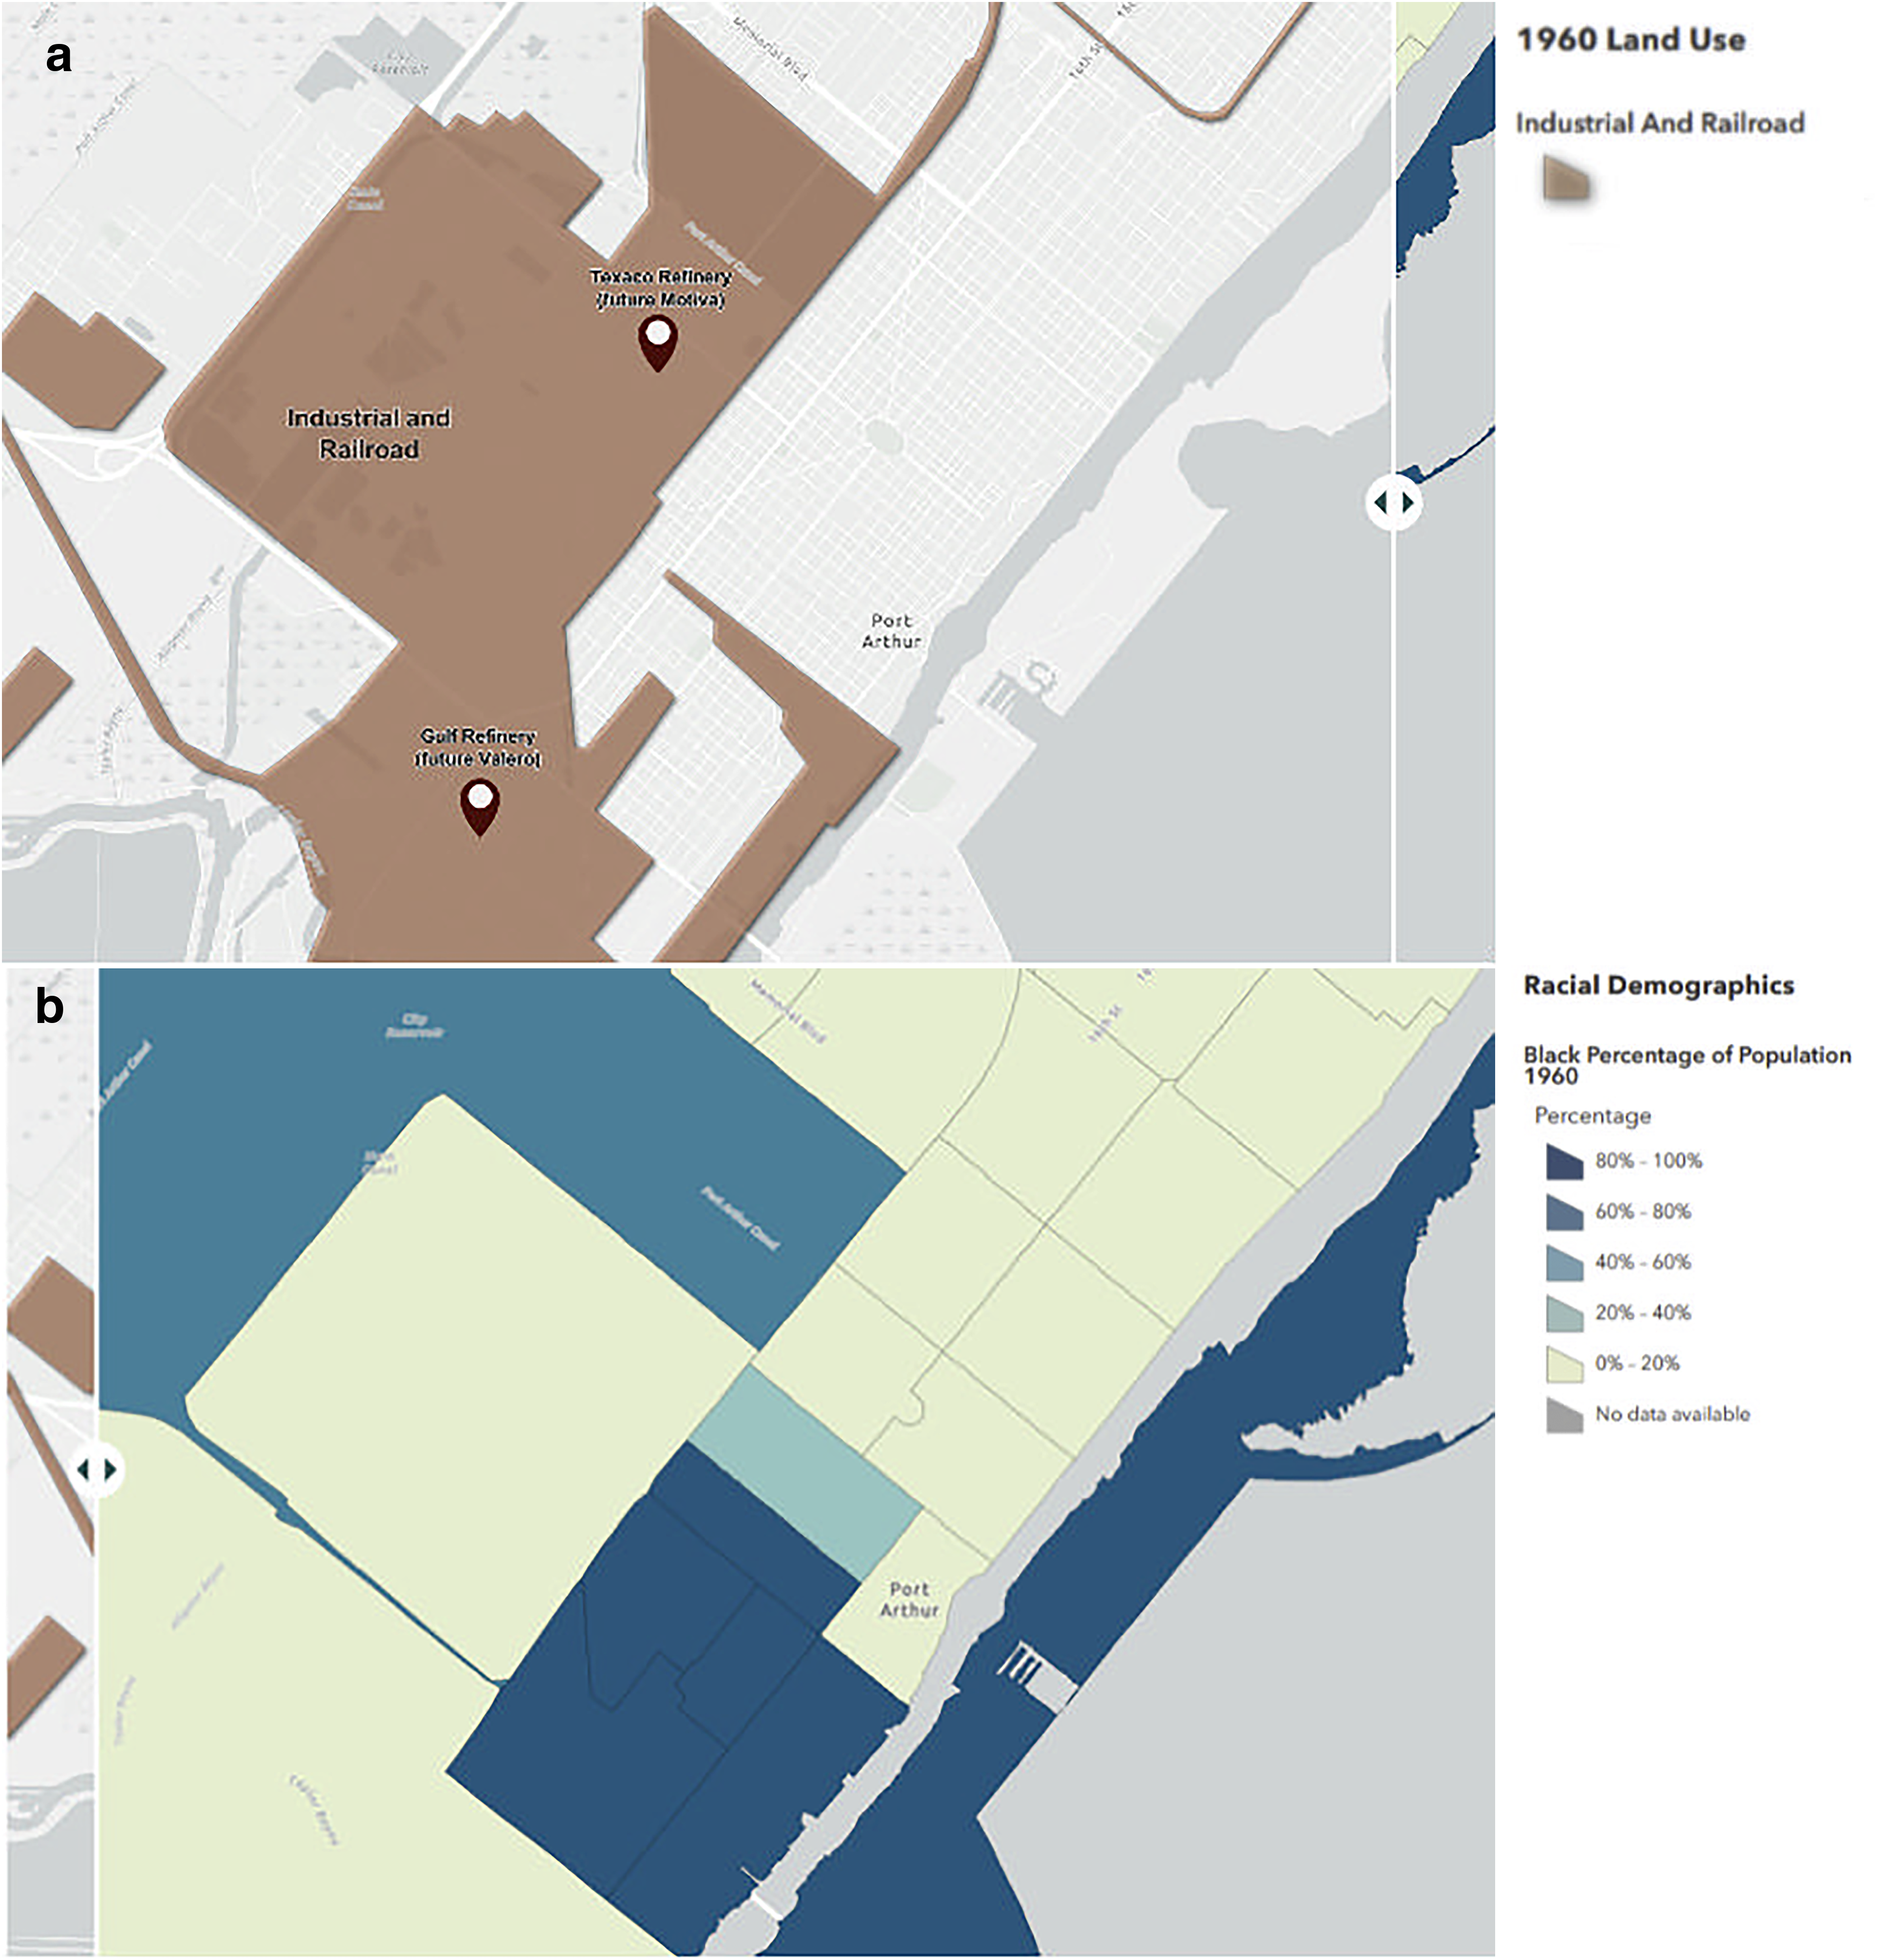
Following World War II, as the oil refineries’ and petrochemical plants’ share of Port Arthur employment veered toward a historic peak of 38.4% in 1959, a Jim Crow-style of racial discrimination pervaded the refinery workforce, limiting Black incomes and further constraining what housing they could afford, despite the advocacy of a union local of Black refinery workers.61,62 Port Arthur’s white city government discovered additional ways of reinforcing a local color line. It situated the city’s first public housing project, Carver Terrace, next door to the Texaco refinery, and began updating its zoning code in ways that sustained the dearth of protections for Black homeowners on the West Side. 63 The accumulated results of four decades of Jim Crow policies are demonstrated in our StoryMap pairing of the city’s first survey of actual land uses from 1960 with that year’s census data on Black neighborhoods (Fig. 3a and b).64 As Whites continued their dominance in city government, the city’s updated zoning plan, affirming industrial and commercial zoning for the Black West Side, continued to insulate Port Arthur’s white east side both from Black residents and from the pollution of the two largest refineries.
(
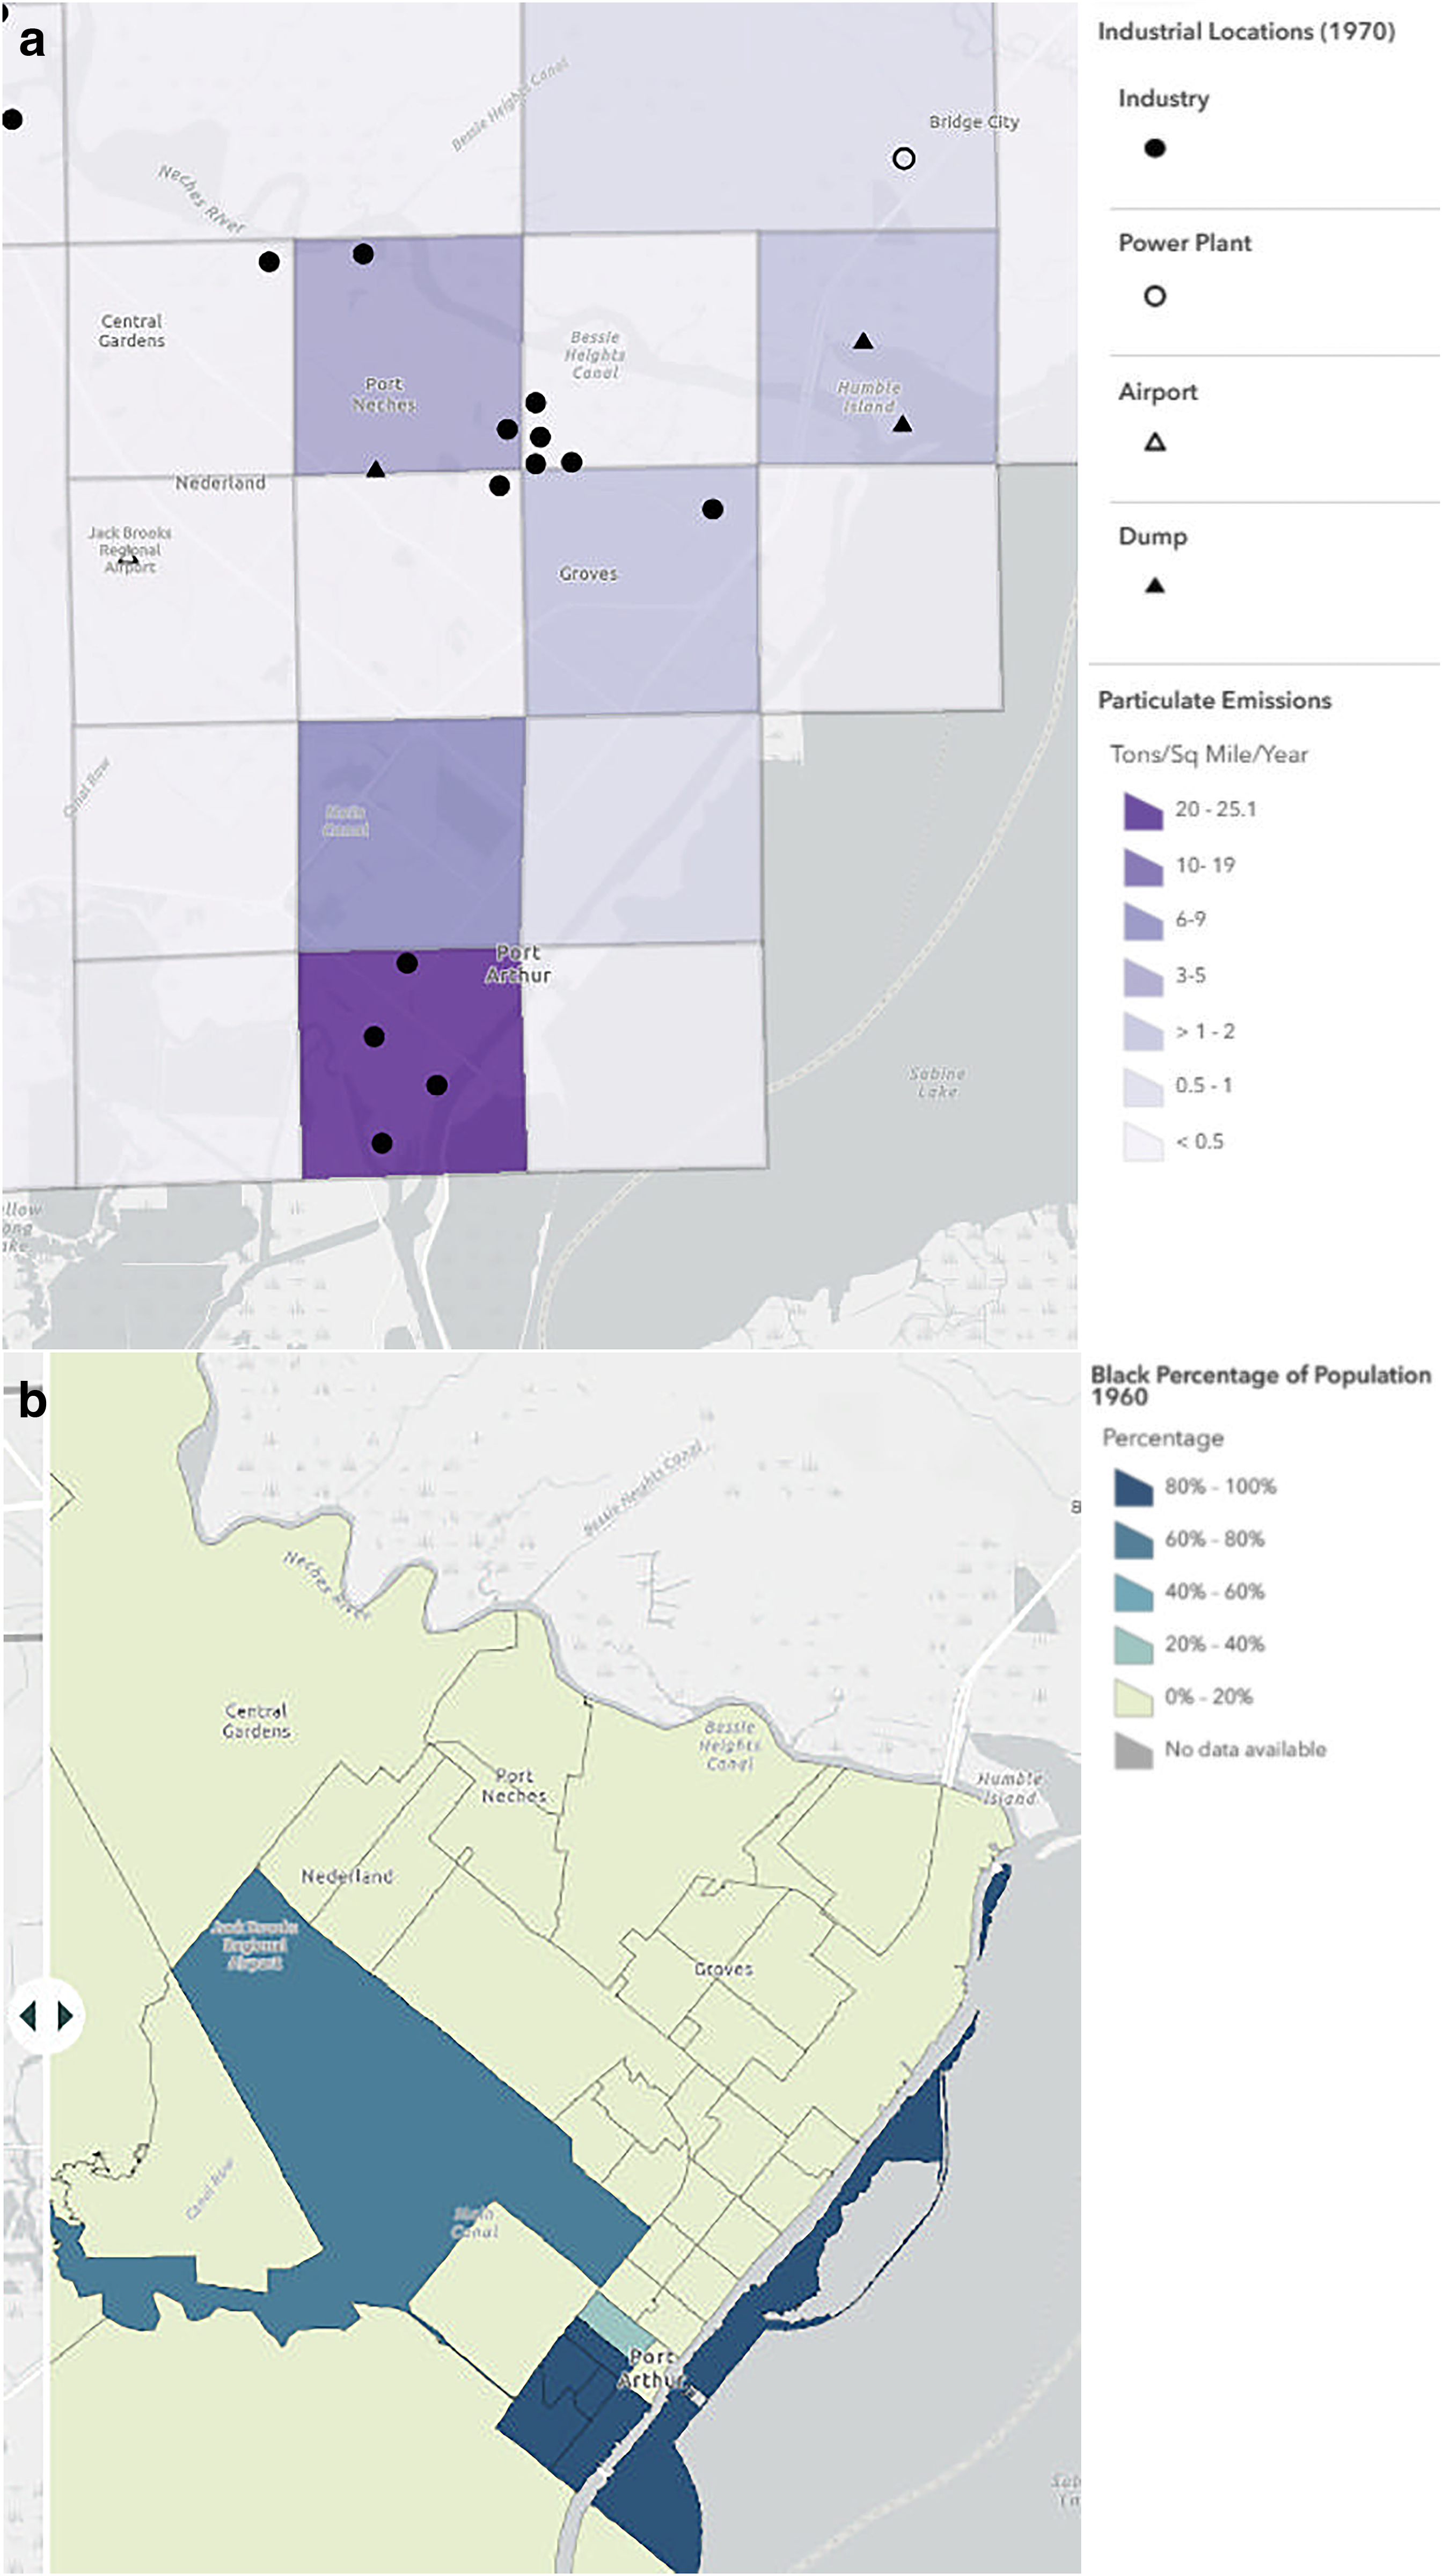
This continued confinement of Blacks and Latinos alongside the city’s two largest refineries meant that they bore the brunt of the accumulating environmental and other burdens into the 1960s, as air pollution finally began to be more noticed and assessed. They were the first to witness the smoke and fires and to smell fumes that emanated from their industrial neighbors. Industrial proximity sanctioned by zoning also affected pocketbooks, lowering housing values in a West Port Arthur that by 1960 remained overwhelmingly Black. 65 The first published estimates of Port Arthur’s air pollution emissions in 1968, by the federal predecessor to the Environmental Protection Agency, suggested just how intensive and concentrated West Side pollutants actually were. 66 Estimated emissions of particulates, total hydrocarbons, and carbon monoxide surpassed those of any other quadrant in the Golden Triangle (also including Beaumont and Orange). Particulate emissions, now known to cause chronic lung, heart, and other ailments, including asthma and heart attacks, 67 in the highest Port Arthur grid were estimated to be nearly seven times higher than from the highest area grid outside of Port Arthur. Hydrocarbon emissions including toxic chemicals such as benzene and polycyclic aromatic hydrocarbons now known to cause cancer were estimated to be more than five times higher than in any other (see Fig. 4a and b, Fig. 5; Table 1). These extreme levels had likely prevailed over preceding years if not decades, not just depressing local housing wealth but yielding inestimable disease and death and possibly intergenerational epigenetic damage.
(
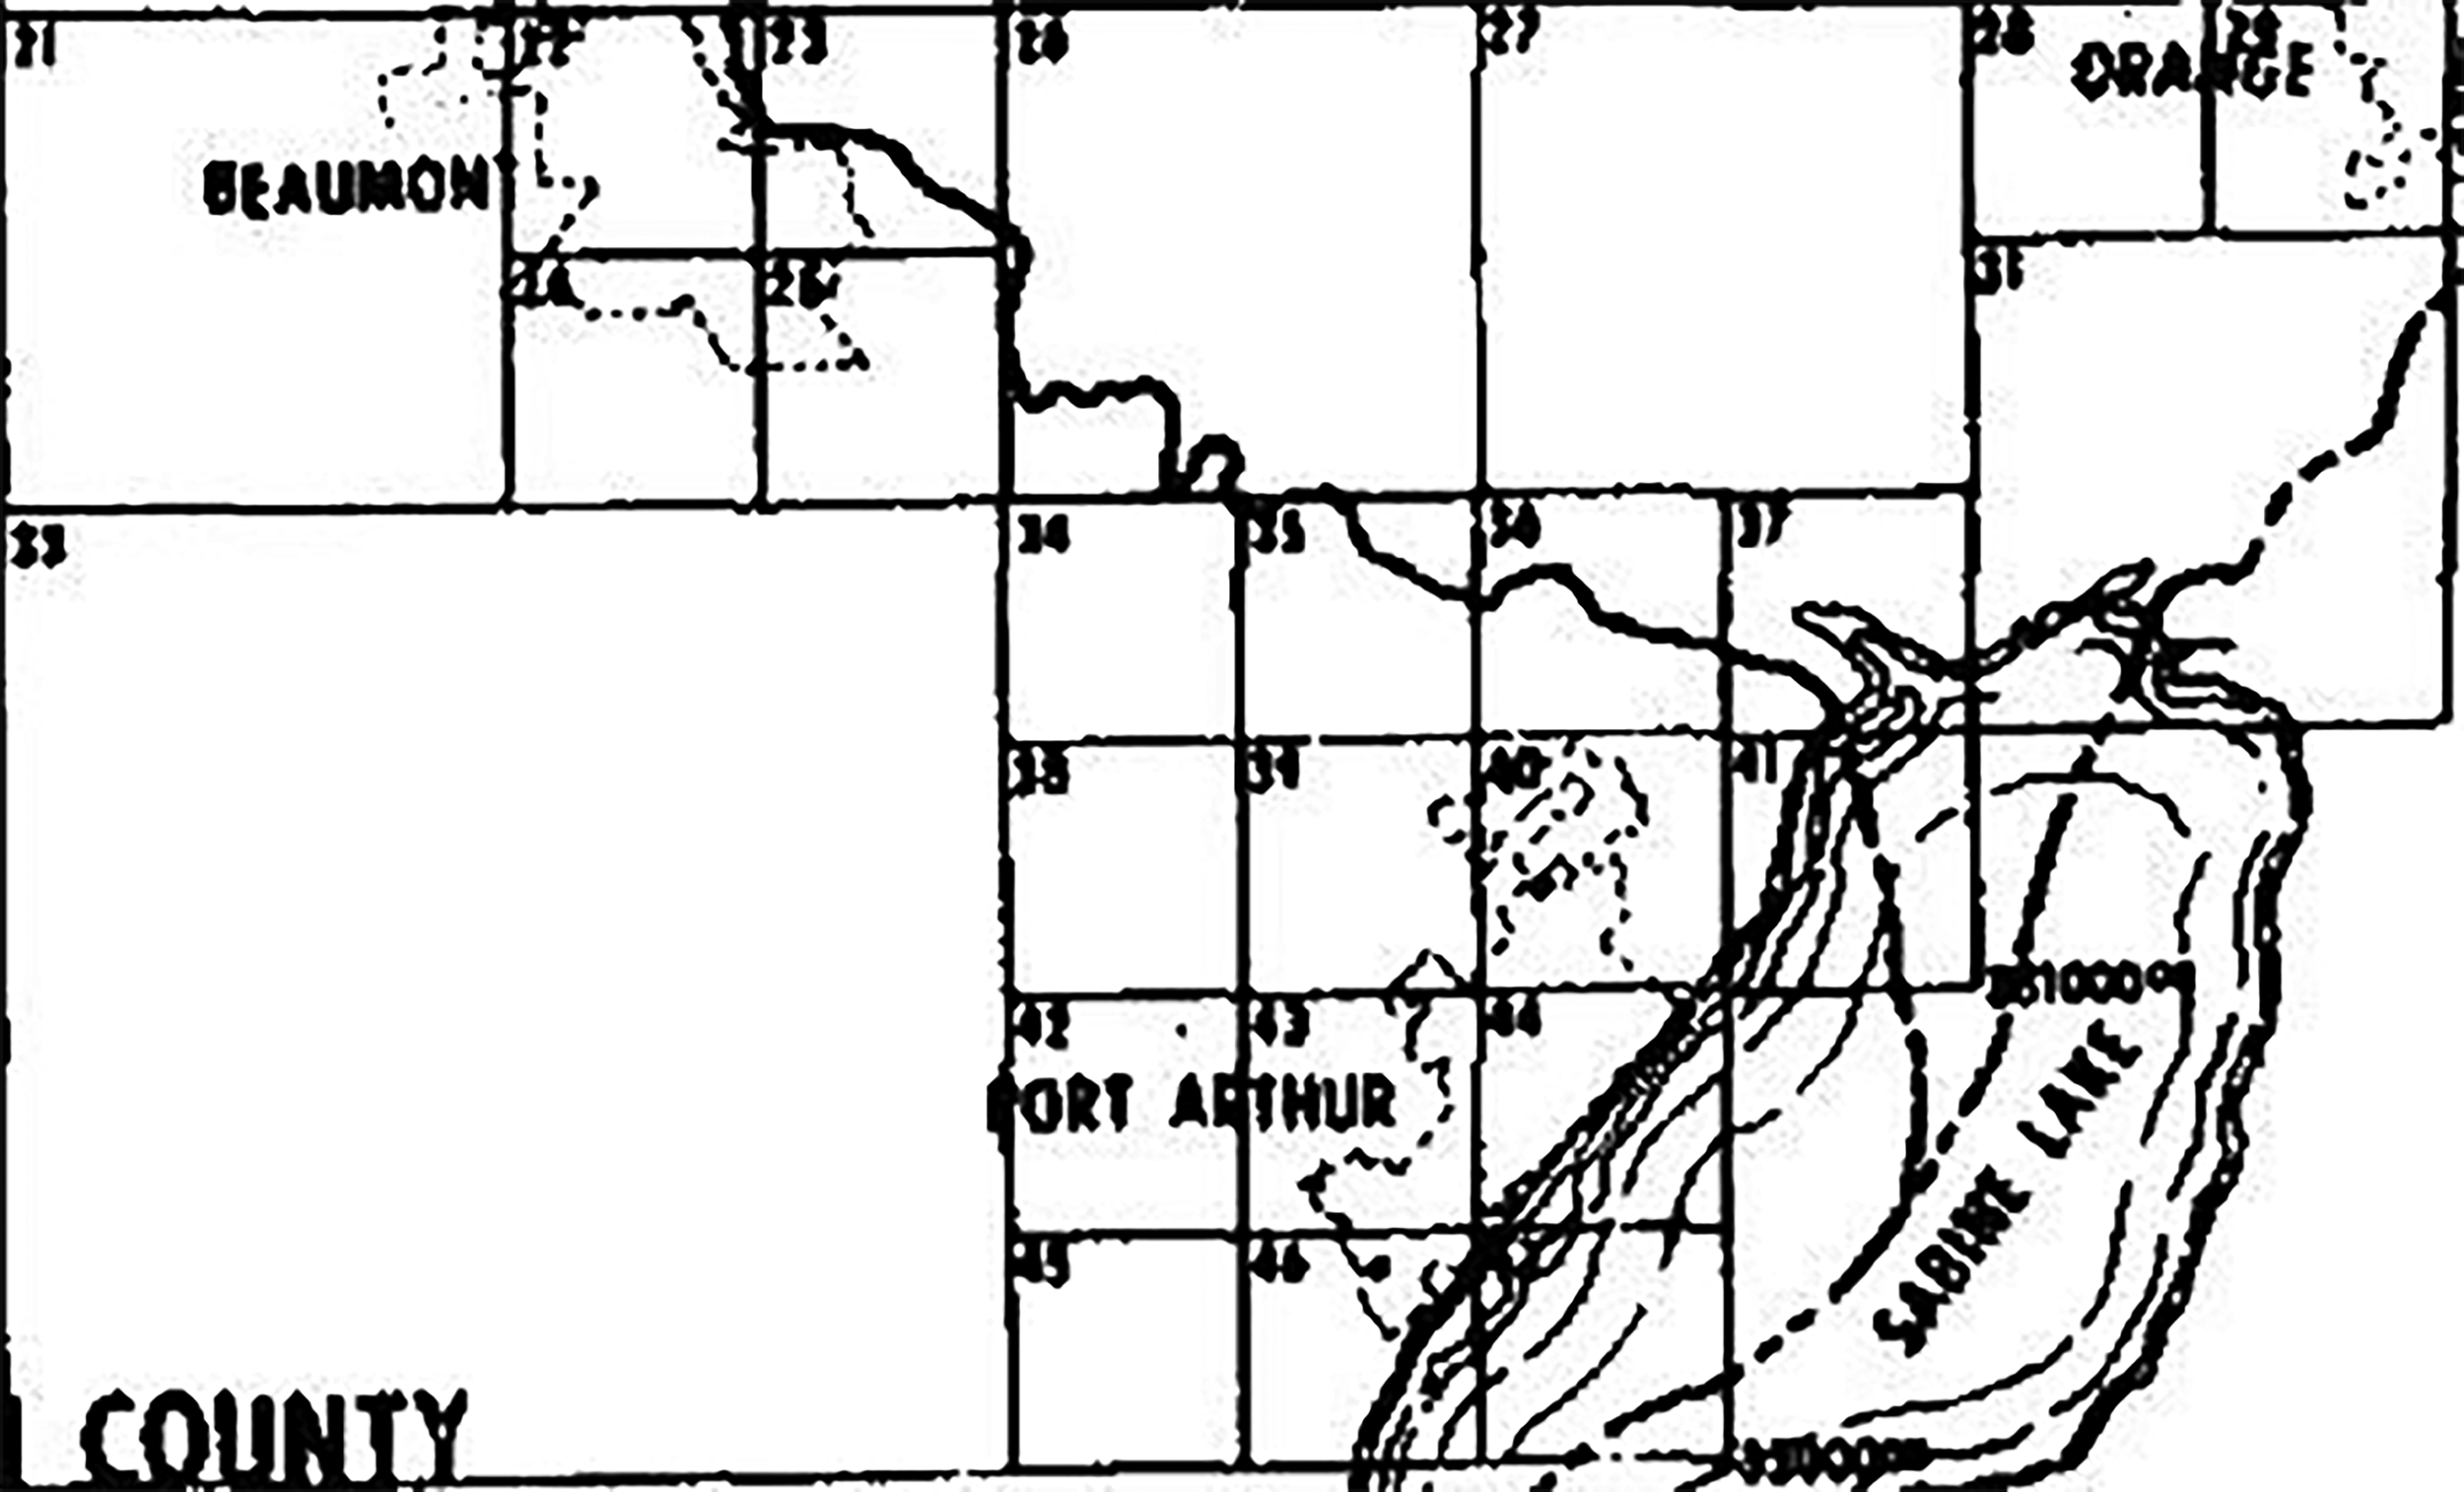
Map illustrating the Grid System for the 1968 Emissions Survey.a West Port Arthur lies in grids 43 and 46.
Table Displaying 1968 Emissions Estimations a
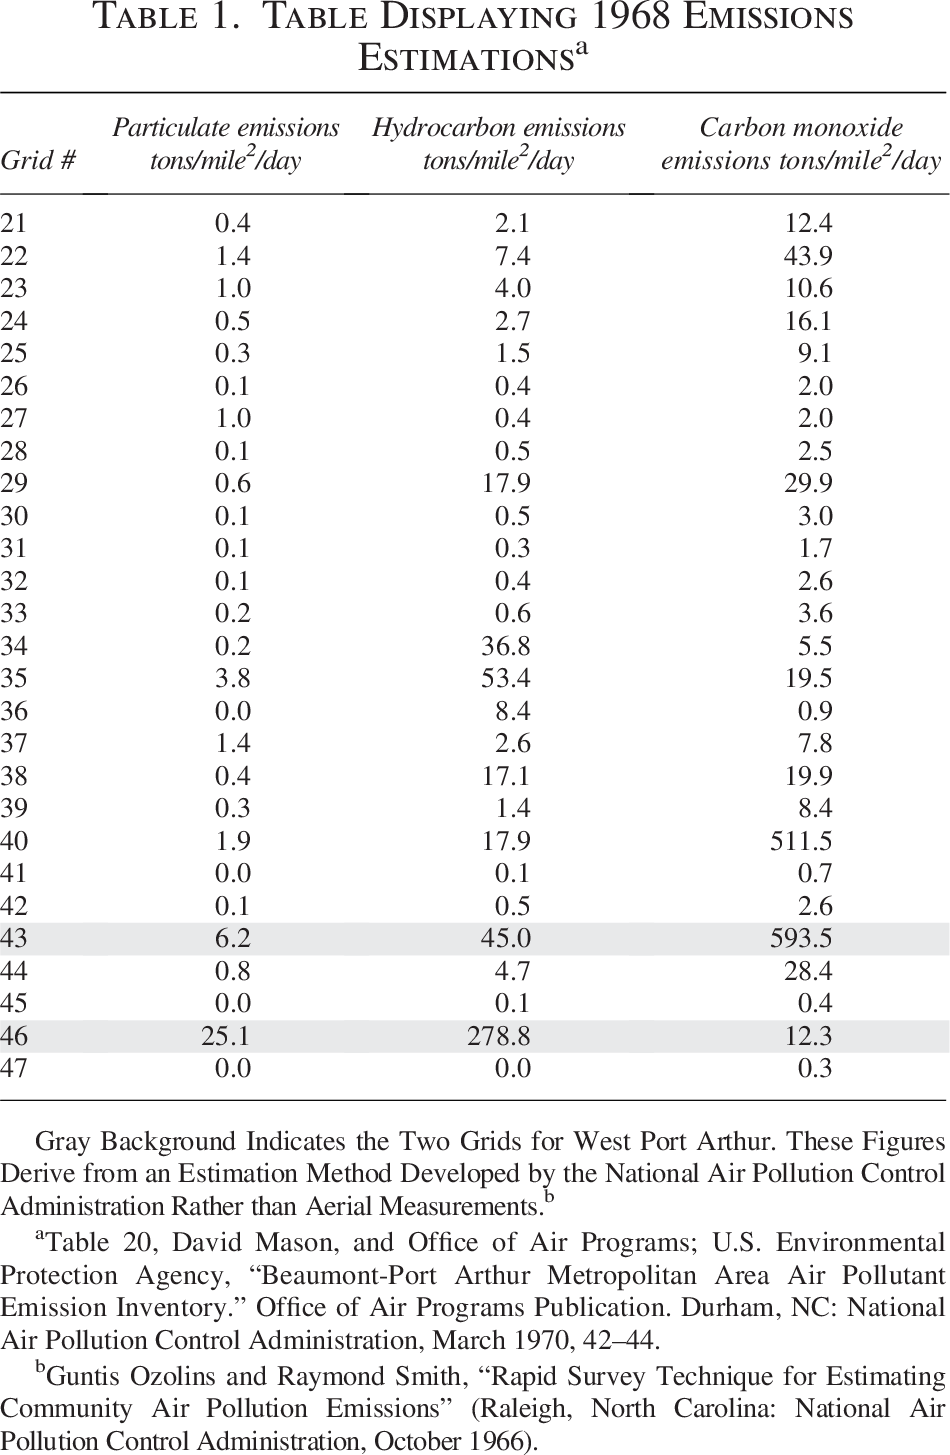
Gray Background Indicates the Two Grids for West Port Arthur. These Figures Derive from an Estimation Method Developed by the National Air Pollution Control Administration Rather than Aerial Measurements.b
Table 20, David Mason, and Office of Air Programs; U.S. Environmental Protection Agency, “Beaumont-Port Arthur Metropolitan Area Air Pollutant Emission Inventory.” Office of Air Programs Publication. Durham, NC: National Air Pollution Control Administration, March 1970, 42–44.
Guntis Ozolins and Raymond Smith, “Rapid Survey Technique for Estimating Community Air Pollution Emissions” (Raleigh, North Carolina: National Air Pollution Control Administration, October 1966).
To fast-forward through the next 50 years: this city’s two biggest refineries continued to operate, grow, and pollute alongside West Port Arthur, many of whose census tracts by 2024 remained almost exclusively inhabited by people of color. From the 1970s, federal and state governments gained the power to regulate air pollution, yet rules set by the EPA along with their enforcement by the Texas Air Control Board still enabled a steady stream of toxic releases over the decades, without measurements along West Side fencelines until initiated by an environmental justice movement in the early 2000s. The town council remained extremely reluctant to challenge local industrialists, instead encouraging what became a largely white flight to suburban mid-Jefferson County, away from the air and noise pollution of the refineries. As the city turned majority non-White by 1990, a corporate crackdown on unions accelerated an ongoing drop in the share of local employment in refineries and petrochemical plants. Their share had plummeted to an estimated 7% by 2020, less than one-sixth of their 1959 peak, 68 as fears about further job losses seemed to reinforce rather than diminish the deference of local government to this industry. Meanwhile, detrimental environmental as well as socioeconomic impacts continued to affect residents in West Port Arthur and the rest of the downtown from one generation to the next: degrading their health, through continued pollution combined with limited health insurance; shrinking their pocketbooks, as joblessness and poverty spiked there; and impeding their ability to move, through rock-bottom home values. Drawing from EJScreen’s as well as other recent data, our StoryMaps collection pairs these multiple outcomes with their geography to show just how cumulative they have become. 69
CONCLUSION
Our research into Port Arthur’s history shows that the segregation of so many Black and Latino residences next to the city’s two biggest refineries was a decades-long and ongoing process, whose means of maintenance shifted over time. The pattern was first established decades prior to our modern federally directed system of pollution control, during a Jim Crow era when Port Arthur’s local as well as state governments lay exclusively in White hands. From the 1920s into the 1960s, policy-making by the city’s white leaders was intertwined with practices of local realtors to cement then sustain this discriminatory pattern. New Deal initiatives such as the HOLC maps played a role, but especially through their appropriation by local actors. Land-use zoning and related local policy-making proved more decisive and influential.
Our research also shows how ArcGIS StoryMaps enables rich and rigorous analysis connecting the policies of this earlier era with their outcomes and persistence from 1970 onward, only partly deterred by our modern system of pollution control. Demonstrating the deeper historical foundations to today’s CIs in West Port Arthur, our research helps explain why these patterns have proven so recalcitrant, also how critical the local political deference to industry has been in sustaining them. On this front, the accessible history-telling in our StoryMaps collection may also have a role to play: narrating ties between a local past and present in ways that may encourage community members and their leaders to ask more of their corporate neighbors.