
Abstract
Recent years have seen a proliferation of mapping and data tools characterizing the cumulative impacts (CI) of environmental and social stressors. The development of these tools by governmental and nongovernmental organizations has been motivated by the need to address multiple, persistent environmental disparities and identify overburdened communities. These mapping and data tools empower policymakers to make informed decisions on where to focus their attention and resources in addressing environmental health inequities. This article examines some of the concerns and debates surrounding CI mapping tools from the perspectives of two established tools, the California Environmental Protection Agency’s CalEnviroScreen and the Centers for Disease Control and Prevention/Agency for Toxic Substances and Disease Registry’s Environmental Justice Index. We discuss the importance of balancing statistical rigor with community engagement, transparency, and ease of use, and we discuss the processes behind indicator selection and evaluation. Furthermore, we explore persistent data gaps and trade-offs between specificity and generalizability, as well as precision and accuracy in CI tools. Our discussion is framed by a commitment to achieving equity through prioritizing meaningful community engagement and collaboration. To mitigate common limitations of CI mapping, we propose strategies such as statistical validation, the use of plain language communication, and community collaboration for increased adoption and use. We conclude with recommendations for future tool enhancements and underscore the importance of transparent methodologies and community-driven approaches in CI screening, all while continuing the development of principles that guide equitable environmental decision making to address environmental and health disparities.
Keywords
INTRODUCTION
The development of environmental and public health screening and mapping tools has its roots in the environmental justice (EJ) advocacy movements of the 1980s and 1990s, which sought to highlight the disproportionate environmental burdens experienced by marginalized communities.1 Policymakers, community advocates, and scientists began developing tools to visualize the spatial relationships between environmental hazards and demographic groups. Several such tools focus on measuring cumulative impacts (CI), defined as the combined effects of environmental burdens, socioeconomic status, and health vulnerabilities that may increase an individual’s susceptibility to harm. As these tools have proliferated over the past decade, they have proven instrumental in identifying communities disproportionately impacted by and vulnerable to environmental pollution, particularly by guiding resource allocation and policy development2,3 (Fig. 1).
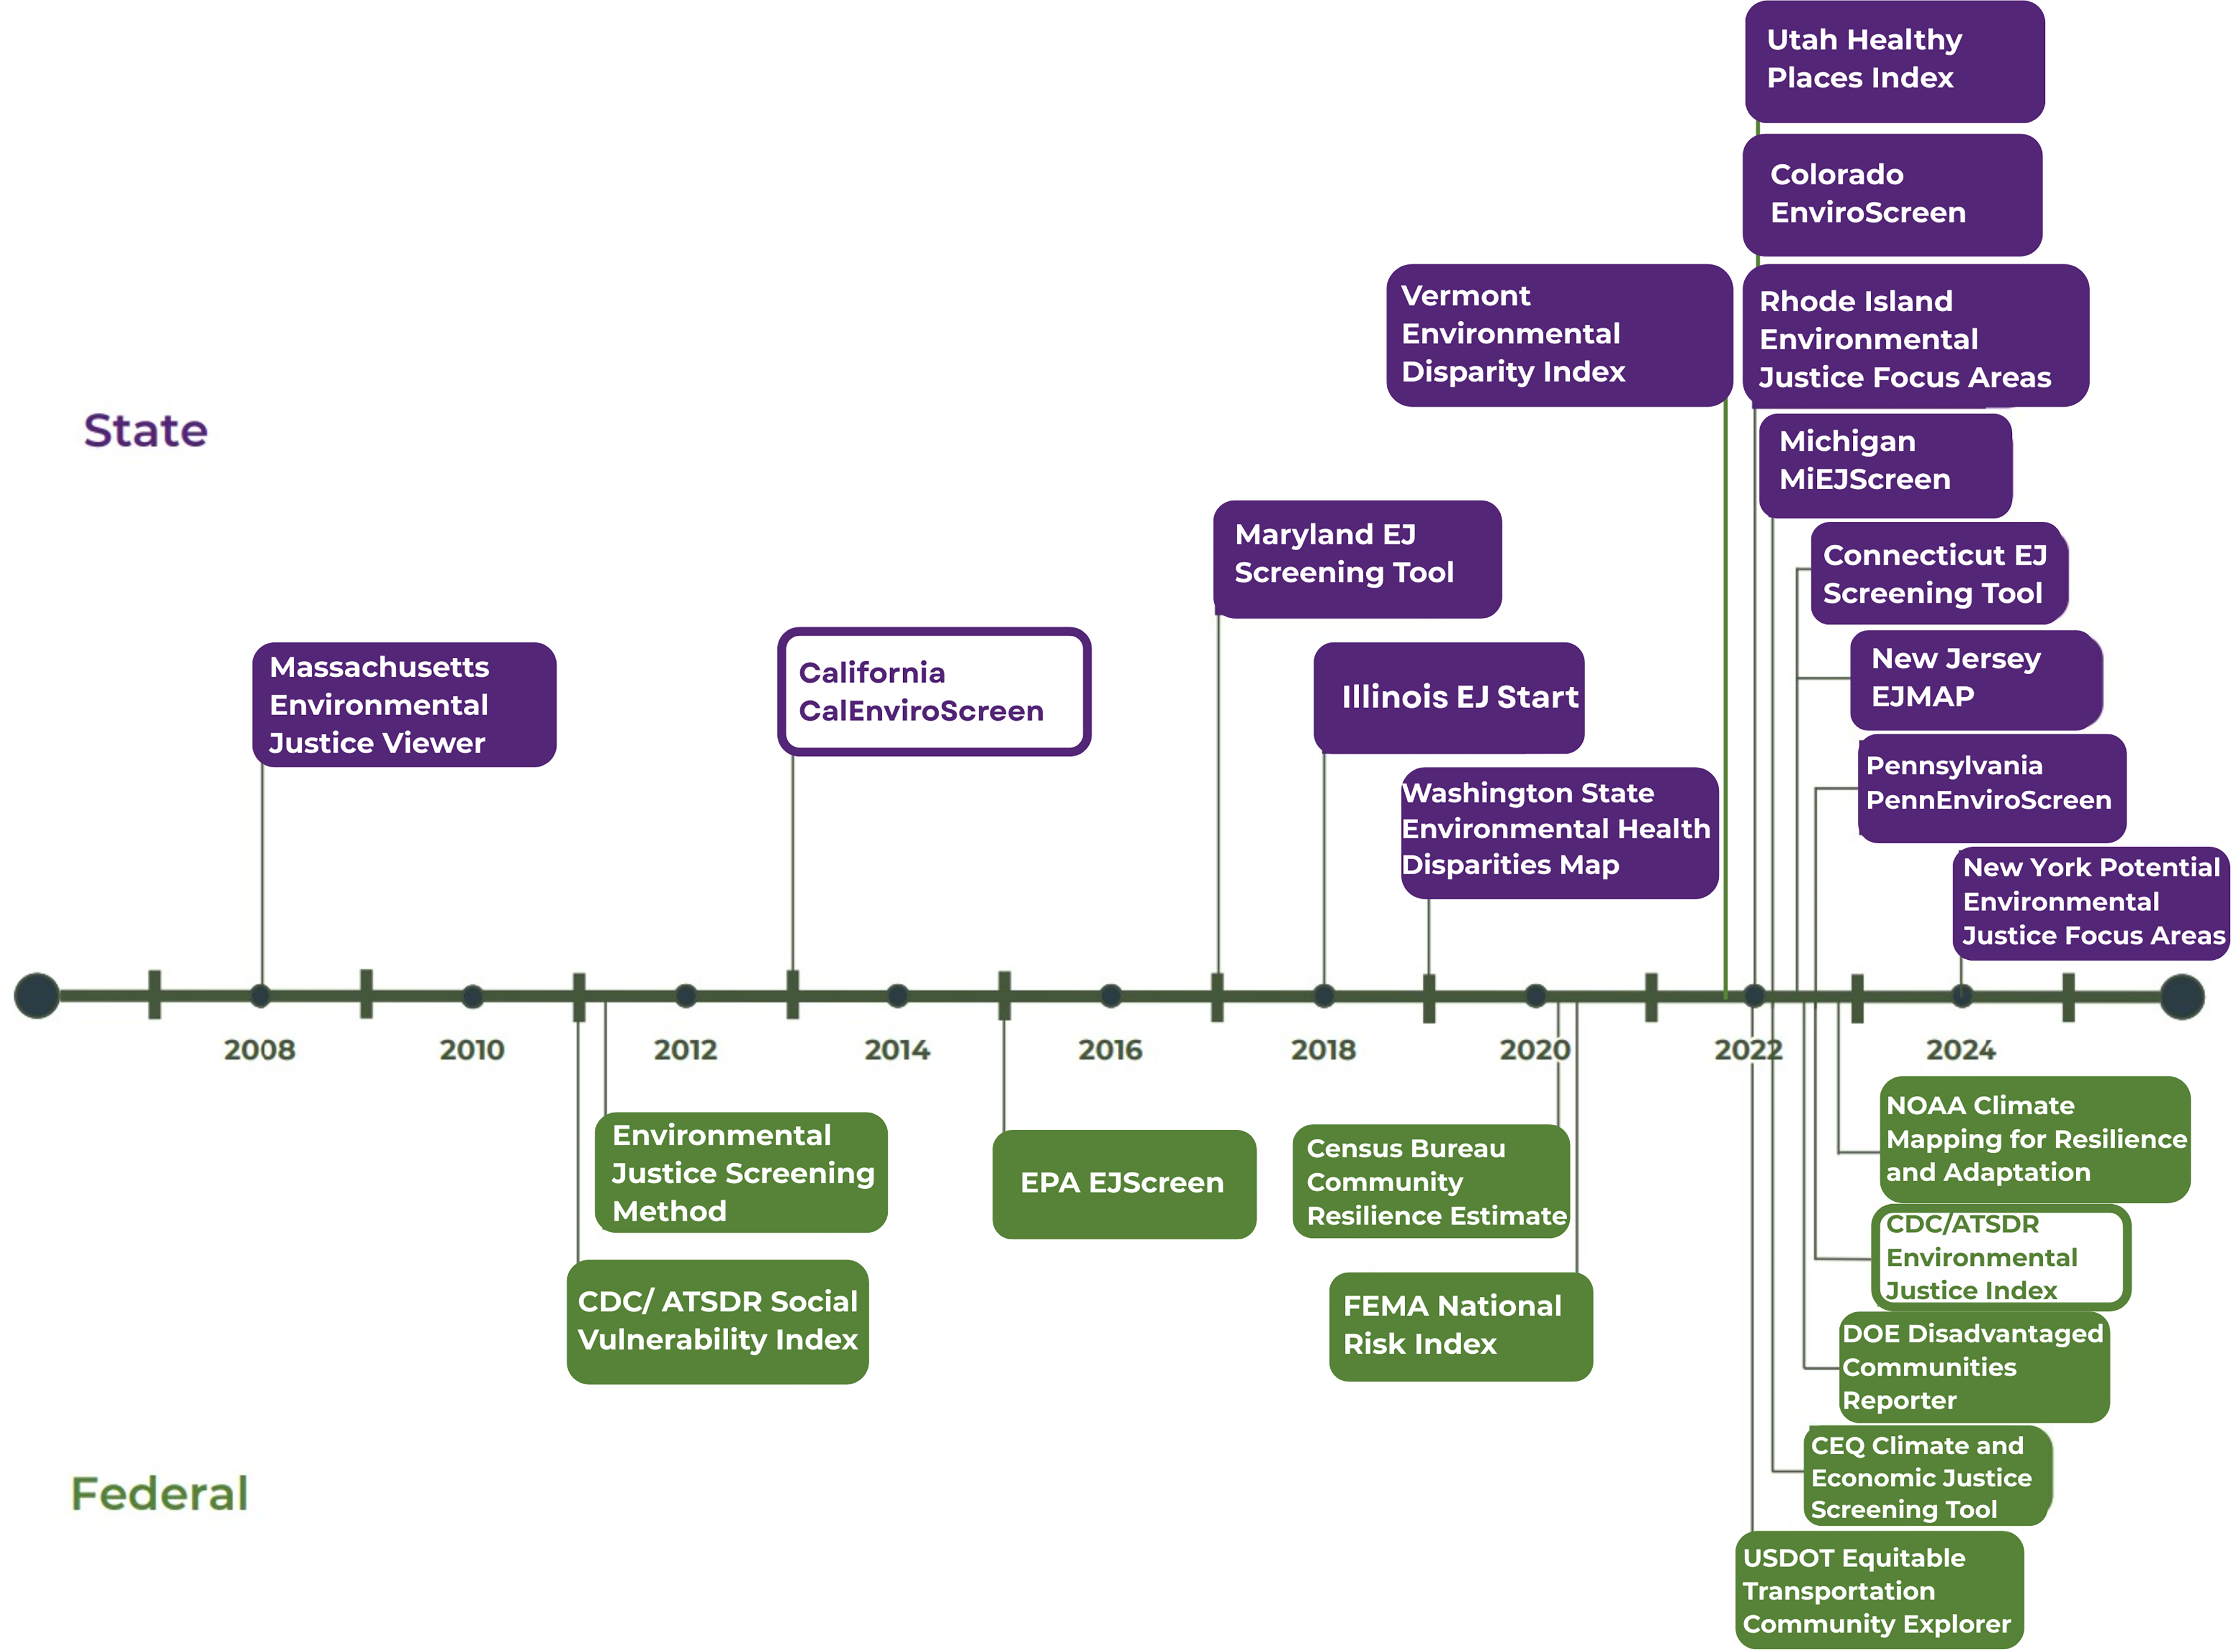
Timeline of State and Federal Cumulative Impacts and Environmental Justice mapping tools created between 2008 and 2024.
The creation of these tools has required collaboration between diverse groups, including community organizations, scientists, and policymakers, to ensure these tools reflect the lived experiences and needs of the communities they are meant to serve. However, developing effective screening tools using a CI framework presents unique challenges. Trade-offs naturally arise as these tools balance technical rigor with usability while representing a range of communities with different concerns.4 As such, questions have arisen about the generalizability of these tools across regions, their ability to accurately capture the complexity of environmental and public health issues, and how model decisions may affect funding allocations for disadvantaged communities.5,6,7,8,9 This article examines two widely adopted CI mapping tools, California’s CalEnviroScreen and the Centers for Disease Control and Prevention/Agency for Toxic Substances Disease Registry’s (CDC/ATSDR) Environmental Justice Index (EJI), as case studies to explore the strengths and limitations of current approaches to creating CI mapping tools (Fig. 2). Specifically, we will use common critiques and suggestions to illustrate how these two tools balance generalizability with specificity and methodological rigor with model simplicity while prioritizing community input and participation in development.
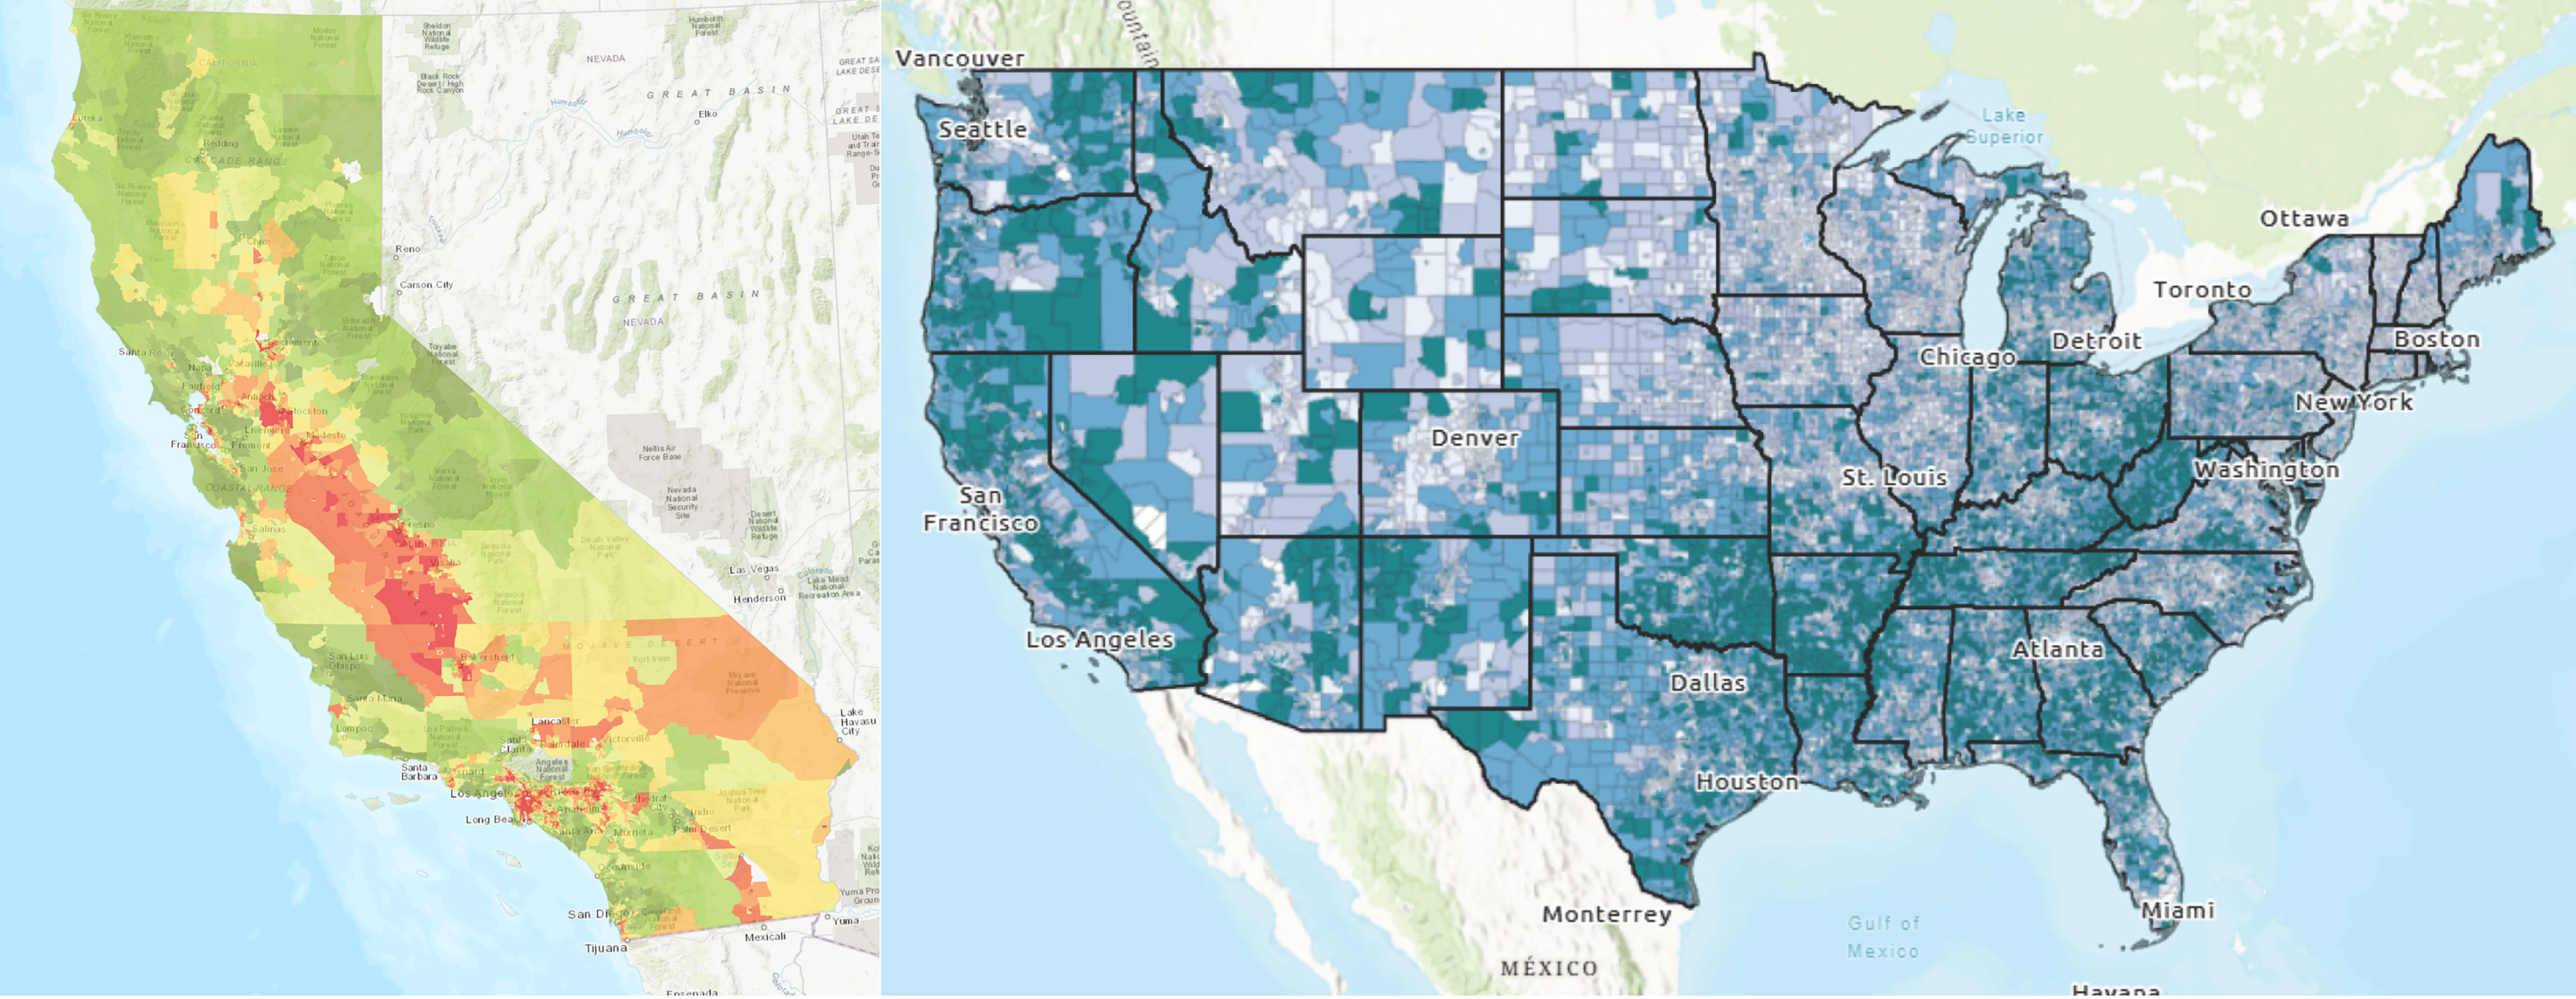
Results maps of CalEnviroScreen 4.0 (left) and the 2024 Environmental Justice Index (right).
BACKGROUND
CalEnviroScreen, developed by the California Environmental Protection Agency (CalEPA) Office of Environmental Health Hazard Assessment (OEHHA), assesses environmental pollution, health burdens, and social stressors across California at the census tract level.10 CalEnviroScreen 4.0 includes 21 indicators to evaluate how different communities experience cumulative environmental impacts and uses a multiplicative model to combine the indicators into a composite index with a percentile-ranked score reflecting the total relative burden of pollution and health risks for each community (Fig. 3). The tool is used broadly throughout CalEPA and is crucial in identifying the highest-scoring areas as “disadvantaged communities” (DACs) under California’s SB535. SB535 and a subsequent bill, AB1550, require that at least 35% of California Climate Investments funding benefits priority populations, which include DACs and low-income communities and households.11 As of November 2023, 76% of California Climate Investments program funds, or roughly $8.1 billion, have been invested in these communities through this mechanism.12
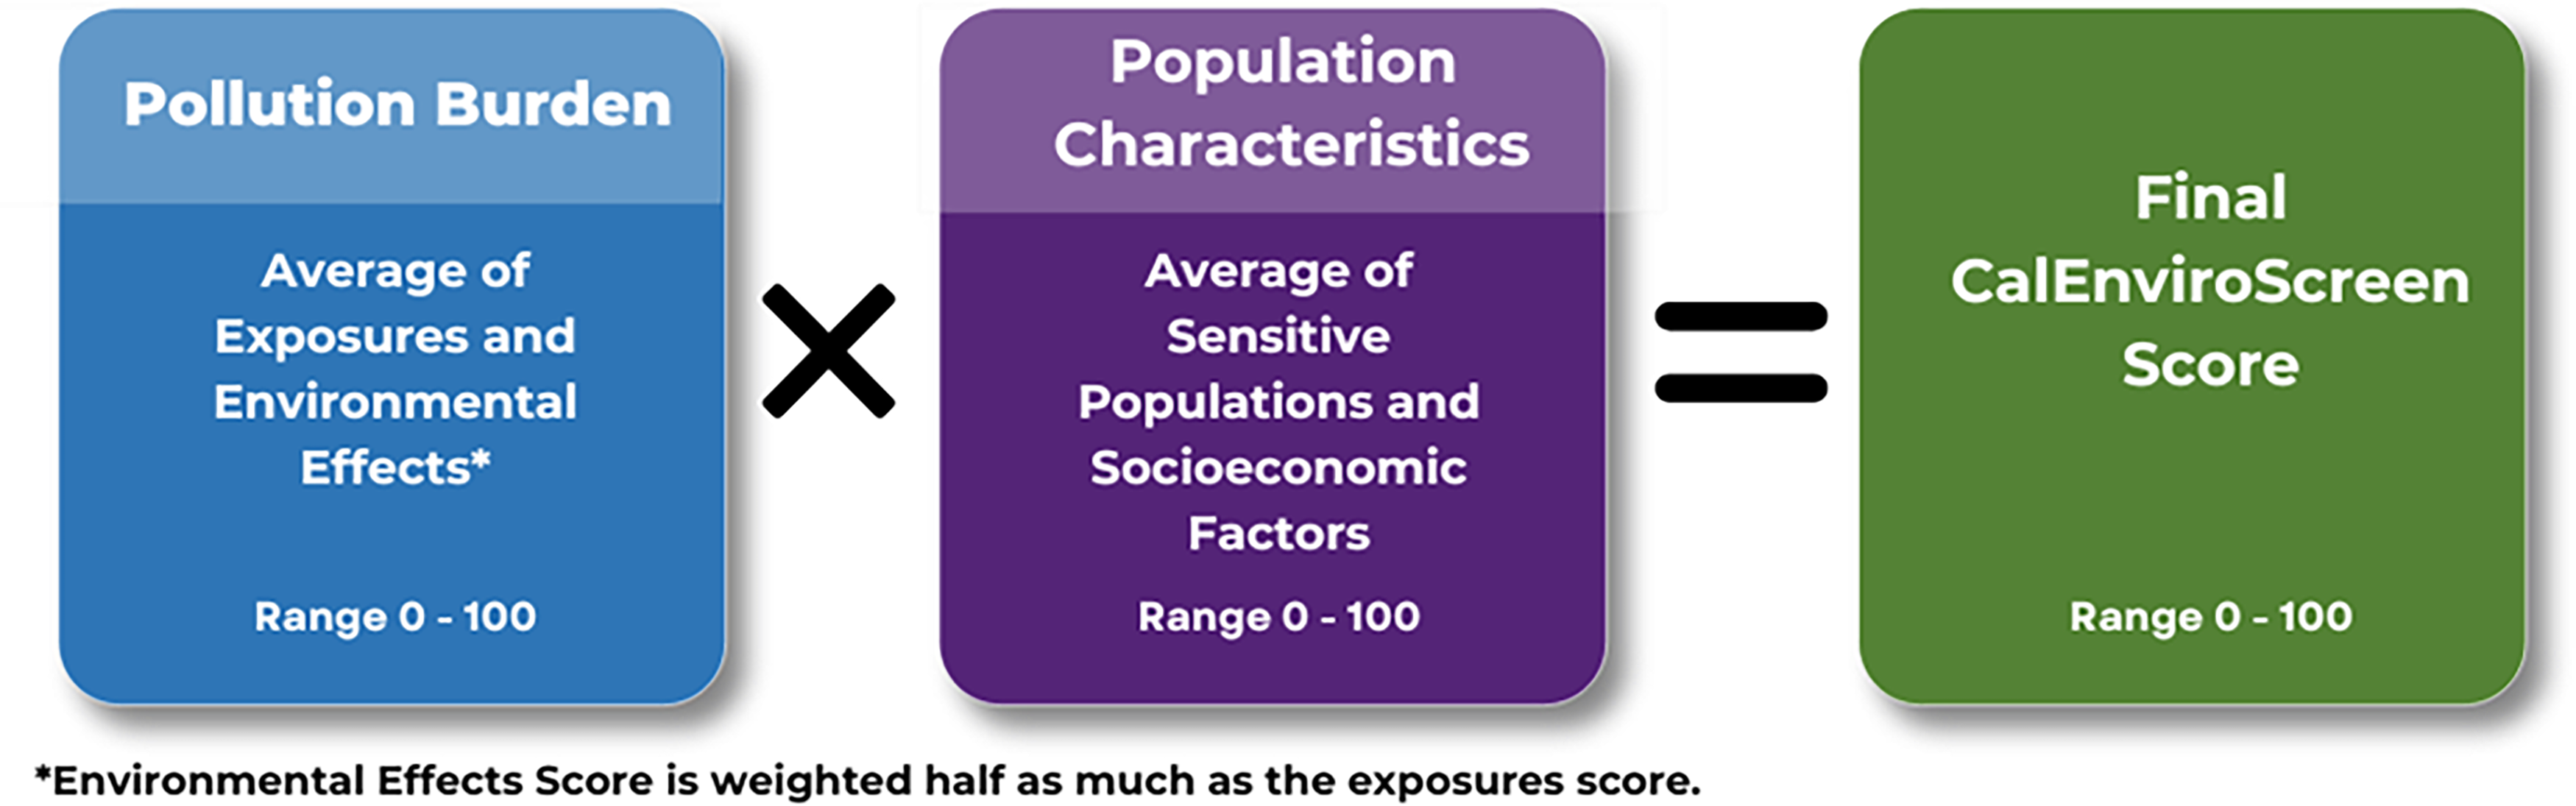
Model used to calculate the CalEnviroScreen score for each community to identify and map areas most at risk.
CalEnviroScreen is also the primary tool used by California local governments to identify EJ communities in compliance with Senate Bill 1000, which mandates addressing EJ in their general plans.13 It is also regularly used by state and local agencies to inform decisions and prioritize funding for projects, such as for prioritizing site cleanup and enforcement initiatives. From 2013 to 2019, CalEPA’s Environmental Justice Task Force used CalEnviroScreen to identify target areas for a community-centered approach to address enforcement of environmental laws.14 California community-based organizations and local governments also use CalEnviroScreen and its underlying data as an authoritative state tool in their work. For example, community organizations in North Richmond have cited CalEnviroScreen to provide context on the disproportionate cumulative pollution burdens the area faces.15,16
The EJI, first released in 2022, is the first national place-based tool to measure the CI of environmental burdens on health and provide a single percentile rank for each community at the census tract level.17 Comprised of 36 indicators grouped into 10 domains across three modules—social vulnerability, environmental burden, and health vulnerability—the EJI provides a comprehensive additive framework for assessing the CI of environmental and social stressors on health (Fig. 4).18 The EJI was used with other federal tools to support initiatives like the Justice40 program, which allocated 40% of benefits from federal investments in climate, clean energy, and sustainable housing to DACs.19 Additionally, the EJI has been widely adopted by state and local governments to inform planning and policy decisions and has proven valuable in environmental health research, providing strong evidence for the role of cumulative socioenvironmental stressors in driving health disparities.20,21,22 As a state-specific application, the New York Metropolitan Transit Authority used EJI to prioritize communities with disproportionate chronic disease and pollution burdens for the implementation of health protective measures.23
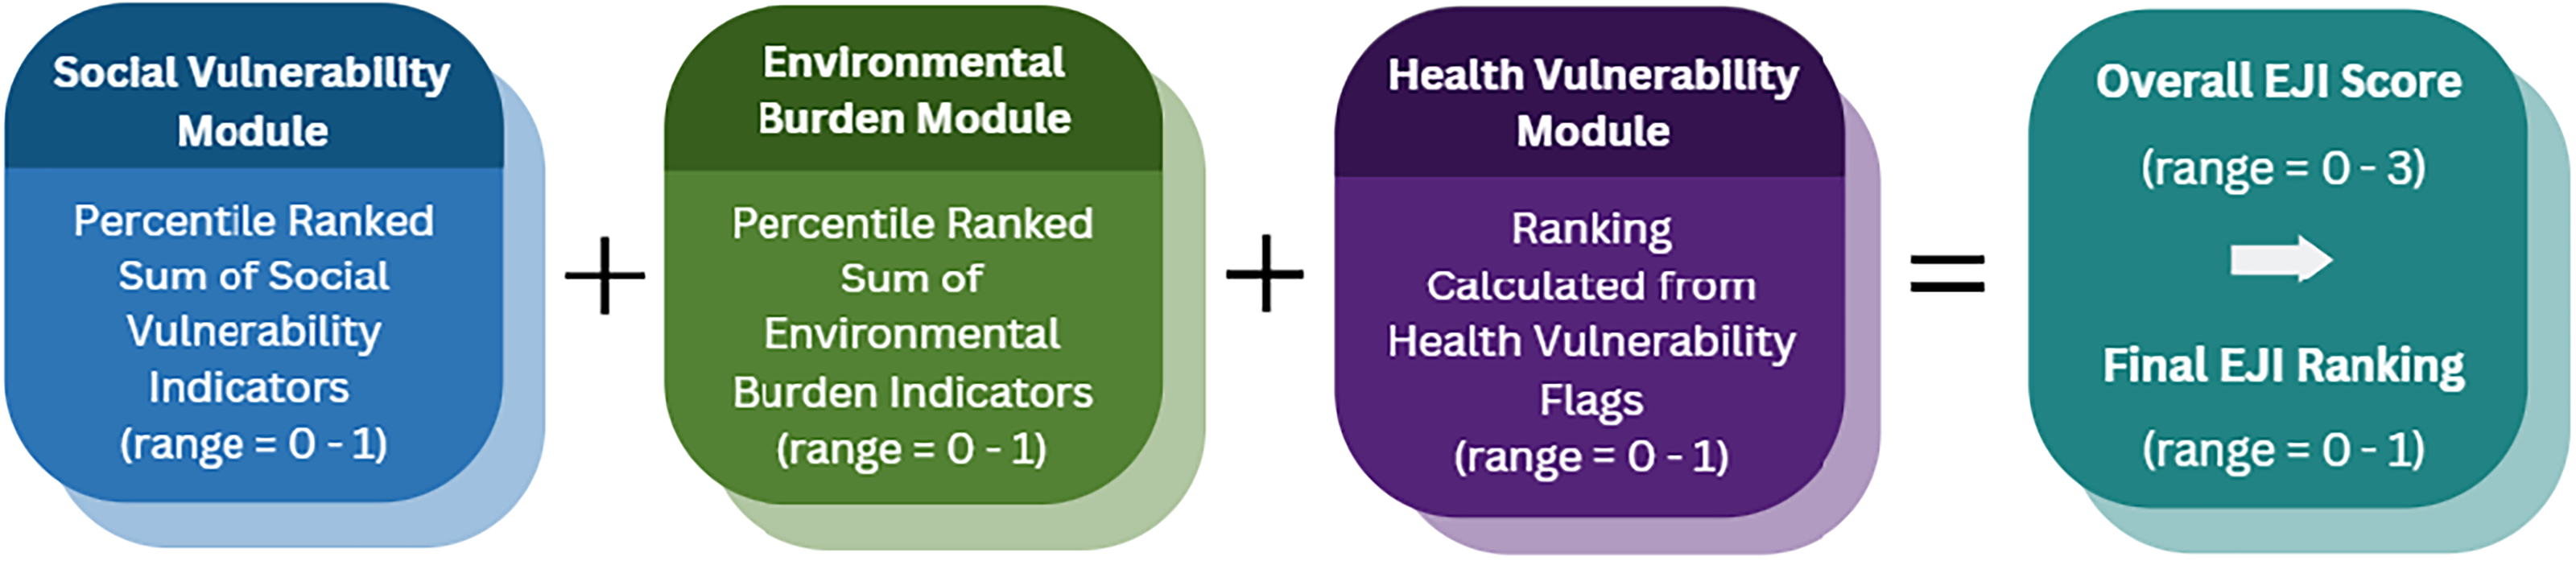
Model used to calculate the Environmental Justice Index rank for each community to identify and map areas most at risk.
Community engagement plays a crucial role in the development and refinement of CI tools, ensuring that these tools accurately reflect the experiences and needs of the communities they are designed to serve. These efforts ensure that local knowledge and lived experiences are integrated into the tool’s development, making it a more accurate and effective resource for addressing environmental injustice. By prioritizing community input, both CalEnviroScreen and the EJI aim to create tools that not only guide policy and resource allocation but also empower affected communities to advocate for their own health and environmental well-being (Fig. 5).
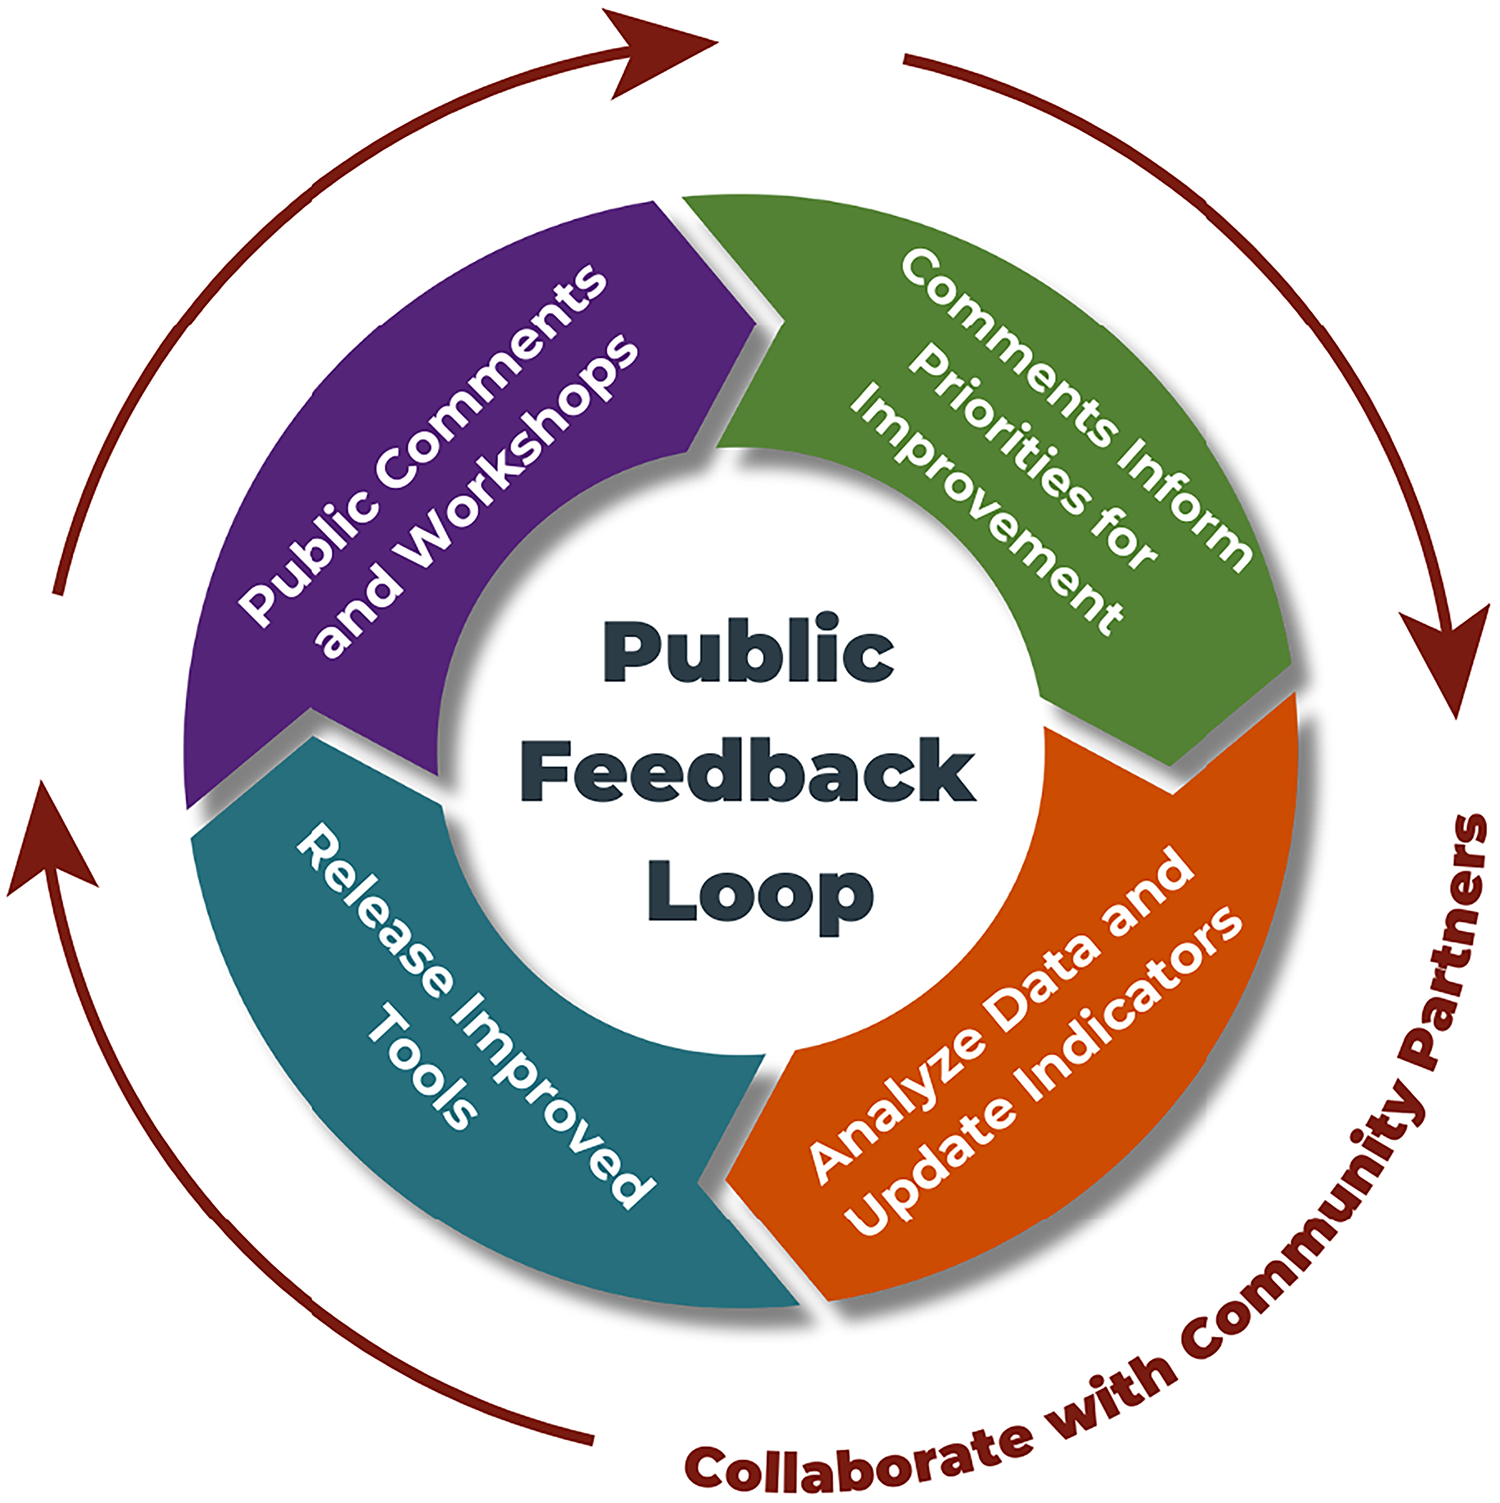
Iterative public feedback loop used by cumulative impacts tools.
KEY CONCERNS AND DEBATES
The development of CI tools involves key trade-offs between specificity and generalizability, as well as between methodological rigor and model simplicity and transparency.24 These tools, designed for statewide or national use, must be generalizable across diverse regions, which often requires sacrificing some degree of local or regional specificity. While a more localized approach may offer deeper insights into community-specific needs, a generalized tool at the state or national level ensures broad applicability, transparency, and fairness in resource allocation. This trade-off becomes particularly critical when the tools inform funding or policy decisions, as stakeholders often prefer communities to be evaluated with a consistent framework. Decisions regarding trade-offs between robustness and sensitivity and between complexity and simplicity are inherent in the construction of any composite index that relies on aggregation. These decisions must be informed by the tool’s intended use and audience, which is why community engagement plays a crucial role in the development and refinement of CI tools, ensuring that these tools accurately reflect the experiences and needs of the communities they are designed to serve.25,26
Most CI tools, including CalEnviroScreen and the EJI, use relatively straightforward methods of calculation, such as ranking normalization and arithmetic-based aggregation, in service of broad usability and acceptance. This has led to criticism regarding their robustness and accuracy, as these approaches can render these tools potentially sensitive to model inputs and local variability.27,28,29,30 The methods used to construct both the EJI and CalEnviroScreen were chosen with the intention of balancing generalizability with specificity and methodological rigor with model simplicity in a way that prioritizes meaningful engagement and fairness in the decision making process. It is also important to acknowledge the role that political dynamics play in tool development and application. CI tools developed under the direction of state or federal government agencies are often subject to constraints that can at times be at odds with community or scientific interests. Below we discuss some specific trade-offs and critiques related to the methods and approaches used by both CalEnviroScreen and the EJI and provide rationale for these decisions. We also discuss how some concerns can be mitigated through the standardization and communication of statistical processes for evaluating CI tools.
Community specificity
CI tools often receive feedback regarding the inclusion of relevant indicators to meet local needs and the adaptation of large-scale tools for specific community types. Creating tools that address community-specific issues while maintaining broad applicability is challenging, especially for large-scale tools like CalEnviroScreen and the EJI. These tools are designed to be generalizable but often face challenges in characterizing local burdens, particularly in rural communities and Tribes. Each community has distinct needs, making it essential that these tools do not systematically exclude particular groups. CalEnviroScreen has been criticized for its lack of rural-specific indicators, and while it does consider factors like pesticide exposure and water quality, many of its environmental burden indicators are biased toward urban concerns. For example, indicators such as PM2.5 and diesel exhaust reflect pollution that is more prevalent in urban areas, and the associated data are often higher quality due to the greater availability of high-resolution monitoring in more densely populated areas. This urban focus may leave other communities, which face different environmental challenges, inadequately represented. To address these disparities, some have proposed adapting large-scale CI tools for specific community types, as tailoring tools for specific communities can allow more relevant indicators to be incorporated. For instance, ranking environmental burdens only within certain regions or community types could help ensure that challenges for specific communities, such as for rural areas, do not get overshadowed by the more dominant issues faced in cities. However, adapting existing state or national tools presents challenges for policies that already rely on these tools, as different communities would be evaluated using different metrics.
Another limitation to the generalized approach of CI tools is that they do not always accurately reflect the lived experiences and values of Tribes and Indigenous peoples. To account for unique issues faced by Tribes, CalEPA includes all federally recognized Tribal lands in California as DACs, in addition to areas scoring high by CalEnviroScreen, which ensures that Tribes are eligible for SB535 funding while maintaining respect of Tribal data sovereignty.31 While these measures provide a starting point for addressing concerns regarding DAC designations and the characterization of Tribal lands and people in the short term, continued consultation with Tribes will be key to continuing to address their concerns and improve these tools moving forward.
An additional strategy for enhancing the accuracy of CI tools involves the integration of alternative data sources, such as local or community-science data, and data from air quality measurement tools like PurpleAir monitors. While alternative data sources may not always meet the rigorous standards required for CI tools, they can help fill critical data gaps, providing a more nuanced understanding of community-specific issues.32 In response to community concerns, CalEnviroScreen has made strides in this area by incorporating pollution data from the U.S.–Mexico border, exemplifying how these tools can be enhanced to better reflect the realities of border communities.33,34 Qualitative data can offer valuable insights as well; however, CI tool developers may hesitate to use it due to concerns about representativeness and defensibility.35 One solution is to incorporate community-collected or alternative data as nonscored, supplemental components, an approach that has been previously recommended by community partners to OEHHA.
CI tools can also address the unique environmental burdens faced by vulnerable populations by collaborating with interested organizations, activists, and advocates during the design and production of the tools, as well as between versions, to ensure that community needs and lived experiences are reflected.36 Since the first iteration of CalEnviroScreen, OEHHA has employed an inclusive, participatory approach to engage advocates through written feedback and interactive workshops often held in partnership with community-based organizations (CBOs), using the “World Café” method to create an open and welcoming environment for dialogue.37 Participants, including community members, Tribal representatives, and other environmental health leaders, can discuss the tool’s components, provide feedback on data and methodology, and reflect on the unique environmental concerns in their regions.38 In 2024, OEHHA proactively collaborated with and compensated CBOs to prioritize data updates and develop a public engagement plan for CalEnviroScreen 5.0. Similarly, the EJI team has engaged with communities through multiple methods, including listening sessions, surveys, and workshops. A series of virtual EJI community engagement workshops in 2023 drew more than 1300 registrations and resulted in hundreds of comments and survey responses from Tribes, state and local government, academia, industry, and CBOs, which were then used to inform updates to the 2024 EJI.39
Geographic specificity
CI tools often receive feedback regarding decisions about specificity, particularly concerning the level of geography used to represent communities. CI tools, including CalEnviroScreen and the EJI, commonly represent communities using U.S. census tracts, as indicator data are typically available at, or can be aggregated to, the tract level. The U.S. Census Bureau created census tracts specifically for representing statistical data and designed them to contain roughly equal population sizes to ensure a more standardized approach for comparing data across communities.
Despite the advantages of census tract-level data, there have been calls for CI tools to provide data using other geographies. While smaller geographies (e.g., census blocks) may allow for more granular indicator data, they often experience greater challenges related to data quality and wider margins of error than tracts, particularly in areas with very low or very high population densities. Census tracts are also advantageous compared to larger geographies (e.g., ZIP codes), as they are inherently spatial and remain relatively consistent over time, making it easier to update and maintain CI tools and indicators. Additionally, it is easier to find and aggregate data to the tract level than it is for ZIP codes, as ZIP codes are based on U.S. postal routes and frequently change. Although there are some limitations to using census tract-level estimates in CI tools, they strike a balance between providing sufficient spatial granularity and maintaining estimate reliability, making them invaluable in analyzing and addressing social and health disparities.40
Data normalization
Normalizationa is a key step in the construction of CI tools, as it places variables with differing units of measurement on a common scale, allowing for meaningful comparison across indicators. One commonly used normalization method, employed by CalEnviroScreen and the EJI, is percentile ranking. This approach has received both support and criticism in the context of CI tools. Critiques around the simplicity of percentile rankings argue that this method may lack robustness when compared to alternative methods, such as z-score transformation, which scales values for a mean of 0 and a standard deviation of 1. While z-score transformation is more robust to outliers and more sensitive to the magnitude of difference between values than percentile ranking, z-scores can be difficult to interpret and are not suitable for non-normal data such as bimodal or skewed distributions.
Despite critiques, percentile ranking remains a preferred normalization method for CI tools like CalEnviroScreen and the EJI because of its simplicity and interpretability. For instance, an EJI rank of 0.75 indicates that the area in question ranks higher for CI than at least 75% of all other tracts in the nation, providing a clear, meaningful measurement that is easy to understand. Percentile rankings are widely used in society, appearing in contexts like test scores and growth charts, which makes them a familiar and accessible measure. Moreover, percentile ranking does not rely on advanced statistical knowledge or software and can be replicated with basic tools, making the process of index calculation more transparent and easier to communicate. Percentile ranking is also better suited for handling nonparametricb data than alternatives like z-score transformation, as it is not affected by skewed or irregular distributions. This makes percentile ranking an effective choice for CI tools, balancing simplicity and transparency while addressing the need for consistent, meaningful comparisons across diverse regions.
Model aggregation
A distinctive feature of many CI tools is that they aggregate, or combine, normalized environmental, social, and health indicators into a composite measure. Critiques surrounding aggregation in existing CI tools range from a preference for either linear aggregation (e.g., sums and means) or geometric aggregation to calls for more advanced approaches.41,42 While each aggregation method has unique benefits and limitations, the chosen method should be one that fits the specificity and purpose of the composite index.43
Aggregation methods differ in their treatment of compensability,c where in compensatory models, low values in one index component (e.g., indicator, module) are offset by high values in another. Additive models allow for compensability, while noncompensatory approaches and nonlinear aggregation can be used to ensure that low values for one component cannot be offset by high values for another component.44 For example, a tract with very high environmental burden and low social vulnerability cannot score higher than a tract with moderately high scores for both environmental burden and social vulnerability. This is a notable difference between the CalEnviroScreen and EJI models, with CalEnviroScreen utilizing multiplicative aggregation and EJI opting for an additive approach. CalEnviroScreen’s multiplicative model is considered partially noncompensatory, whereas EJI’s additive model is compensatory.
The choice between compensatory and noncompensatory aggregation involves trade-offs between interpretability and robustness. Nonlinear and noncompensatory methods can be advantageous in that they may be more robust against single-indicator influence and less temporally sensitive. However, they can require more advanced statistical knowledge to understand and can be difficult for nonexperts to interpret.45 In cases where prediction is the main purpose of the index or where strong trade-offs between indicators are unacceptable, noncompensatory aggregation is often more appropriate.46 Linear aggregation has the benefit of being easily understandable and readily applicable, while highlighting the compensatory trade-offs that may exist in the real world for communities. Future work to understand the CI of environmental, social, and health factors may help to better inform which method of aggregation best reflects the lived experiences of communities. However, ensuring that methods remain transparent and replicable will continue to be an important consideration for the creators of CI tools.
Sensitivity and subjectivity
Recent examinations of CI tools have raised concerns regarding the sensitivityd of models used to designate “disadvantaged” communities for funding, as well as perceived subjectivity in these models.47,48 CI tools, like CalEnviroScreen and the EJI, employ relatively straightforward methods, making their outputs sensitive to small changes, such as alterations in aggregation methods, indicator normalization, or the specific indicators included. Critiques suggest that this sensitivity could lead to allocative harms, such as the inappropriate exclusion of overburdened neighborhoods from funding mechanisms, or even the manipulation of the tool by political actors seeking to favor particular groups or populations.49,50
Suggestions to mitigate the potential for allocative harms by reducing sensitivity and subjectivity in decision making or funding allocation have included using results from multiple alternative models to designate “disadvantaged” communities or even randomizing designations for communities near a decision threshold. While reducing model sensitivity does reduce the impact that an individual decision may have, the added complexity of multiple models makes the process by which CI tools are constructed and implemented exponentially more obscure to the decision makers using these tools and to the communities affected by their use. This approach would also create trade-offs between reducing model sensitivity and maintaining model transparency and simplicity. Additionally, it could increase model opacity, making the tool more susceptible to manipulation by making it harder to detect.
To address concerns regarding model sensitivity and perceived subjectivity, more transparency is needed. While CI tools may be sensitive to alterations in methods such as normalization or aggregation, the methods chosen for these tools reflect a robust process of public engagement and a commitment to transparency in decision making. Public consultation and accountability provide safeguards to potential manipulation and help ensure that tools do not sacrifice real-world accuracy for statistical robustness. However, CI tools can also address criticisms of robustness by better communicating the methods and results of sensitivity analysese used in model validation and how these results inform specific decisions regarding trade-offs chosen by tool creators.51
CONCLUSION
The CI methods advocated by CalEnviroScreen and the EJI prioritize generalizability, dissemination, and utilization without sacrificing accuracy of the underlying concepts. These priorities are critical given that CI tools occupy a unique space where translational sciencef and the EJ movement intersect. In bridging the gap between exposure science, science communication, and environmental policy, CI tools must find a common audience among governmental, academic, and community-based entities. To be widely trusted and utilized, CI tools must be grounded in the principles of meaningful engagement and framed within a community health context, ensuring they are accessible, reproducible, accurate, and precise. They must also be acceptable, developed collaboratively, and disseminated efficiently. Last, these tools must be available, remain current, and be based on tangible, real-world indicators. While upholding all these principles, CI tool makers must also consider that the political dynamics that they operate within can impact decisions in development and implementation. This balance between political viability and scientific or community desires can be the difference between greater and lesser adoption of the tool in policy.
Through open and frequent dialogue with environmental and public health advocates, CI screening tools introduce improvements with every new version released. In recent years, tool developers have begun offering some data in supplemental layers or models, ensuring that emerging concerns are represented even when the data do not meet the criteria for full integration into the primary model. Additionally, incorporating plain language, visual aids, and transparent methodologies can enhance the accessibility and utility of these tools for diverse audiences. In addressing ethical, theoretical, and statistical concerns, tool developers can improve their methods by more clearly communicating the assumptions, limitations, and trade-offs inherent in the models. This could include detailed reporting on the processes of indicator selection and sensitivity analyses to assess model stability and responsiveness. Notably, tools like the EJI and CalEnviroScreen have made strides in this area. In 2024, CDC/ATSDR made the methods and results of the EJI publicly available, accompanied by technical documentation and community engagement reports that guide users through decision points and trade-offs. Similarly, CalEnviroScreen provides comprehensive reports detailing methodological decisions for each tool version, with plans to include more in-depth documentation and sensitivity analyses in future releases.
Ultimately, we conclude that the continued success of CI tools hinges on prioritizing enhanced transparency, improved communication, and robust public input ahead of increased model complexity. By addressing critiques through clearer explanations of methods, assumptions, and decision making processes, tool developers can build trust with communities and foster the continued evolution of these critical tools.
AUTHORS’ CONTRIBUTIONS
Conceptualization: K.R. and L.A.; Investigation: K.R., Z.V., A.S., K.B., and L.A.; Visualization: Z.V.; Writing—original draft: K.R.; Writing—review and editing: K.R., Z.V., A.S., and L.A.; Project administration: K.R.; and Supervision: L.A.
Footnotes
ACKNOWLEDGMENTS
The authors would like to thank Benjamin McKenzie, Lauren Freelander, Grace Mohandoss, and Stephen Scroggins for their contributions in conceptualizing and developing this work.
AUTHOR DISCLOSURE STATEMENT
No competing financial interests exist.
FUNDING INFORMATION
The authors have no external funding to disclose.