
Abstract
Safe drinking water is a fundamental human right, yet socioeconomic vulnerability creates water insecurity even in high-income nations. Rural Native American nations in the United States experience notable gaps in reliable, safe water. This study investigated how structural disadvantage shapes disparities in regulatory compliance of community water systems, relating findings to achieving Sustainable Development Goal 6 (universal access to clean water and sanitation). Regulatory violation records (2011–2021) for community water systems serving Native American populations in Arizona, California, Nevada, and New Mexico. Systems were classified by size and socioeconomic context. Multiparametric and nonparametric analyses examined violation frequencies and types, emphasizing health-based infractions. Median household income and poverty rate served as covariates. Smaller, rural systems showed significantly higher overall violation rates than larger, affluent counterparts (p < 0.01). Health-based violations comprised most breaches. Violation frequency correlated negatively with median income (r = −0.62) and positively with poverty rates (r = 0.58). The disparity persisted throughout the decade, indicating a chronic regulatory gap affecting Native American communities. These findings expose systemic inequities in water governance that perpetuate insecurity among underserved U.S. populations. Health-related violations in small, disadvantaged systems highlight shortcomings in regulatory oversight and resource distribution, demonstrating how domestic drinking-water inequities reflect broader challenges articulated in sustainable development goal (SDG) 6, particularly targets 6.1 (universal access to safe drinking water) and 6.b (community participation in water governance). Structural disadvantage drives disproportionate regulatory noncompliance in Native American community water systems, hindering progress toward SDG 6. Policymakers should prioritize targeted infrastructure investment, expand technical assistance for small systems, and embed equity-focused metrics within regulatory frameworks to close the safety gap and promote environmental justice.
INTRODUCTION
Among the United Nations Sustainable Development Goals (SDGs), SDG 6—ensuring availability and sustainable management of water and sanitation for all—is foundational due to its critical links to health, education, food security, and economic resilience. 1 Despite global investment in water, sanitation, and hygiene (WASH) initiatives exceeding $1 trillion annually, progress remains uneven, and significant service gaps persist. 2 Yet, water insecurity is not only a global issue but also a pressing domestic challenge, particularly for marginalized populations in high-income countries such as the United States.
This research examines how regulatory frameworks intersect with socioeconomic vulnerabilities to shape water security outcomes in Native American communities, applying a multivariate approach that integrates statistical and decision-analytical tools. Even in high-income countries such as the United States, nearly 10 million people still lack reliable access to safe drinking water. 3 Systemic challenges, including the COVID-19 pandemic and the rising costs of climate change adaptation, have intensified water insecurity, especially among marginalized populations.4,5 Native American communities are among the most severely affected, where disproportionate COVID-19 mortality rates in New Mexico and Arizona have been partly attributed to chronic inequities in water access and WASH infrastructure. 6
These disparities underscore persistent structural vulnerabilities in underserved populations in developed nations—an issue underrepresented in the global SDG 6 discourse. Water insecurity in Native American communities threatens not only local health and well-being but also the broader achievement of SDG 6 domestically, given water’s central role in the water-energy-food nexus and its recognition as a basic human right. 7
Yet few studies have systematically evaluated compliance trends under the U.S. Safe Drinking Water Act (SDWA) in these communities or quantified their socioeconomic drivers. This study addresses that gap by analyzing a decade of SDWA violation records (2011–2021) for community water systems serving Native American populations in the U.S. Southwest. Although the full dataset spans four states—Arizona, California, Nevada, and New Mexico—the article’s tables emphasize California and New Mexico because these two states contain the largest number of tribally operated community water systems with complete socioeconomic and compliance records. These states also represent contrasting hydrological, institutional, and demographic contexts, making them analytically valuable case studies for understanding regional patterns of water insecurity. It is hypothesized that smaller, rural, and socioeconomically disadvantaged systems experience disproportionately higher violation rates, elevating risks of water insecurity.
By linking violation patterns with demographic and socioeconomic indicators, this research provides new longitudinal evidence of inequities in drinking water within a high-income context and situates these findings within the SDG 6 framework. The study highlights policy-relevant insights for achieving SDG 6 inclusively, emphasizing targeted infrastructure investment, technical assistance, and equity-centered governance.
METHODOLOGY
Data collection
The U.S. Safe Drinking Water Act (SDWA) served as the basis for this study. Data on violations were obtained from the Environmental Protection Agency’s (EPA) Enforcement and Compliance History Online database. Records from 2011 to 2021 were extracted for community water systems serving Native American populations in Arizona, California, Nevada, and New Mexico. These four states were selected because they collectively account for a large share of the Native American population in the western United States, include Nations with diverse community sizes and governance structures, and are located within regions experiencing prolonged drought and Colorado River Basin pressures. 8
Within this four-state dataset, California and New Mexico contain the largest number of tribally operated systems with complete socioeconomic data, which is why these states are highlighted in the main tables. These two states serve as representative case studies illustrating broader structural challenges, while the overall analysis incorporates data from all four states, ensuring the findings reflect regional patterns in water insecurity. Violations included health-related (e.g., maximum contaminant level exceedances), public notification, and monitoring/reporting. Compliance reports were reviewed to separate health-based from administrative violations. Population and socioeconomic indicators (e.g., median household income, poverty, and education levels) were compiled at the community level for statistical comparisons.
The dataset was drawn from a validated federal source. To ensure consistency, suspicious outliers (<5% of values) were flagged but retained using the Oklahoma Mesonet quality-control approach. 9 Because tribal and non-tribal systems differ in size, analyses were normalized to the Native American population served by each system to avoid disproportionate weighting and ensure comparability.
Data analyses
Temporal patterns in SDWA violations were assessed using Spearman’s rho, a nonparametric test robust to non-normal distributions and widely applied in environmental health trend detection.10,11 The null hypothesis assumed no trend in violation frequency, and rejection indicated significant increases or decreases over the study period (α = 0.05).
The Preference Ranking Organization Method for Enrichment Evaluations (PROMETHEE) combined with Graphical Analysis for Interactive Assistance (GAIA) (Decision Lab 2000 Executive Edition) was also employed. 12 PROMETHEE ranked communities according to socioeconomic and water security attributes, while GAIA visualized multidimensional relationships. Variables expected to enhance resilience (population size [Pop], median household income [MHI], and high school graduation rate) were maximized, while SDWA violations and other vulnerability indicators were minimized. This approach provided a structured framework to identify how socioeconomic disadvantage aligns with regulatory noncompliance and water insecurity. Overall, this mixed-methods design—integrating longitudinal violation data, socioeconomic indicators, and multivariate ranking—tested the hypothesis that small, rural, and socioeconomically disadvantaged Native American communities face disproportionate drinking water insecurity, 13 and situates these findings within a broader context of achieving SDG 6 domestically.
RESULTS AND DISCUSSION
Overview of SDWA violations across Native American communities
Arizona
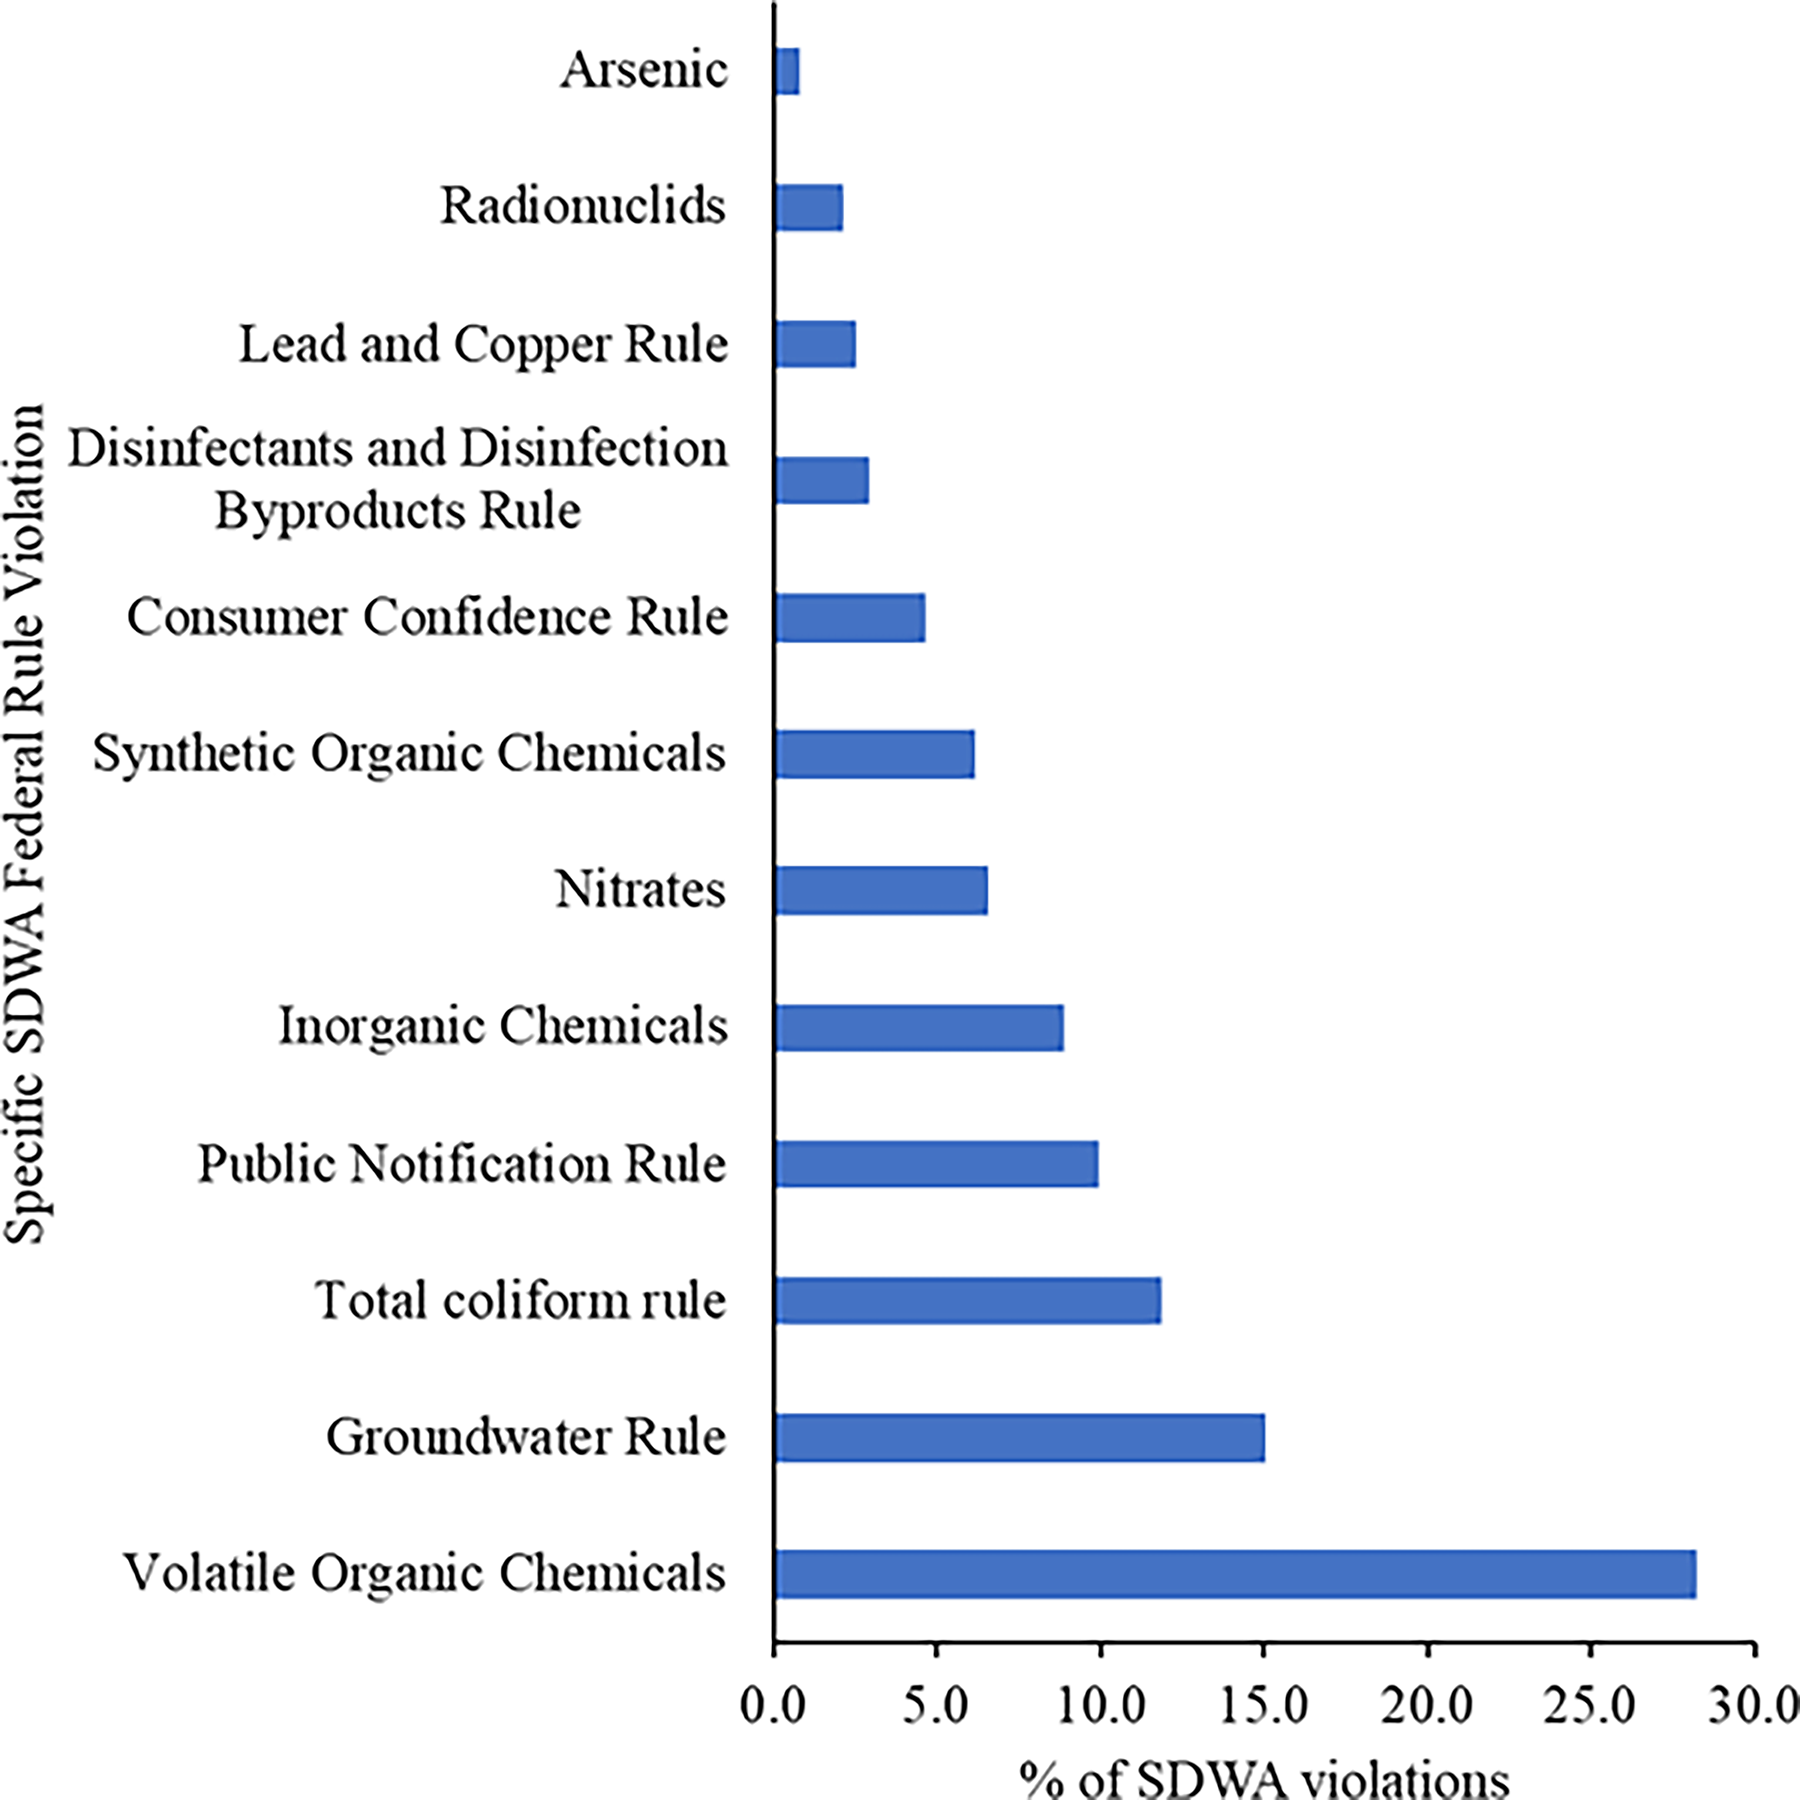
Between 2011 and 2021, Native American communities in Arizona recorded a notable decline in SDWA violations (Fig. 1). Total violations fell from 1186 in 2011 to 649 in 2021 (45% reduction), with Spearman’s rho confirming a strong decreasing trend (rs = −0.99, p < 0.001). Monitoring and reporting violations, the most frequent category, decreased by nearly half (49%, rs = −0.97, p < 0.001), while public notification violations declined modestly (−36%). Health-related violations, though fewer, showed the steepest relative decrease (−58%, rs = −0.84, p < 0.01). The sharpest improvements occurred between 2011 and 2014, after which violations plateaued.
Main SDWA violations recorded in Native American communities in Arizona (2011–2021). SDWA, U.S. Safe Drinking Water Act.
Despite progress, disparities persist. Over half (57%) of Arizona’s violations occurred in systems run by the Navajo Tribal Utility Authority (NTUA). The Navajo Nation spans three states and faces unique challenges such as low population density, limited capital, and aging infrastructure, with about 30% of households lacking piped water and relying on hauled or unregulated groundwater. 14 Prior estimates suggest billions are needed to modernize this infrastructure, 15 far beyond tribal revenues. 16
Figure 1 shows that 84% of Arizona’s violations were health-related, dominated by synthetic organic chemicals (22%), disinfectant byproducts (20%), and volatile organic chemicals (20%). These contaminants pose direct health risks, particularly in rural households dependent on under-monitored water systems. In 2015, Native American communities serving ∼294,000 people reported 1,299 violations, compared to just 28 in large urban utilities serving over a million. 17 Federal and tribal actions have reduced violations over time, but structural constraints—economic marginalization, jurisdictional complexity, and NTUA dependence—mean reductions have not eliminated disproportionate risks. Persistent health-related violations underscore the need for targeted federal investment and stricter oversight in tribal water systems.
These patterns also reflect the challenges identified under SDG 6.1, which emphasizes universal and equitable access to safe drinking water. The persistence of health-based violations in Arizona’s tribal systems illustrates how structural constraints—such as chronic underinvestment and fragmented governance—limit the ability of Native American Nations to achieve the basic service levels envisioned in SDG 6, even within a high-income country.
California
Tribal water systems in California showed mixed compliance between 2011 and 2021. Only health-related violations declined significantly (rs = −0.8, p = 0.003), while public notification violations increased (rs = 0.65, p = 0.02). Monitoring/reporting and total violations fluctuated without clear trends (p > 0.05), suggesting uneven progress, with gains in contaminant control offset by communication failures.
California’s system is highly fragmented: 15% of water systems serve ∼94% of the population in large urban centers, 18 while nearly all tribal systems are “small.” Among the 27 Native American communities with violations, only two exceeded 10,000 inhabitants. In 2019, the State Water Resources Control Board (SWRCB) reported 2309 violations statewide, 91% in small systems. 19 Native American communities accounted for 775 violations (33.5%) affecting ∼59,523 residents, three times the per capita violation rate for non-tribal systems. 20
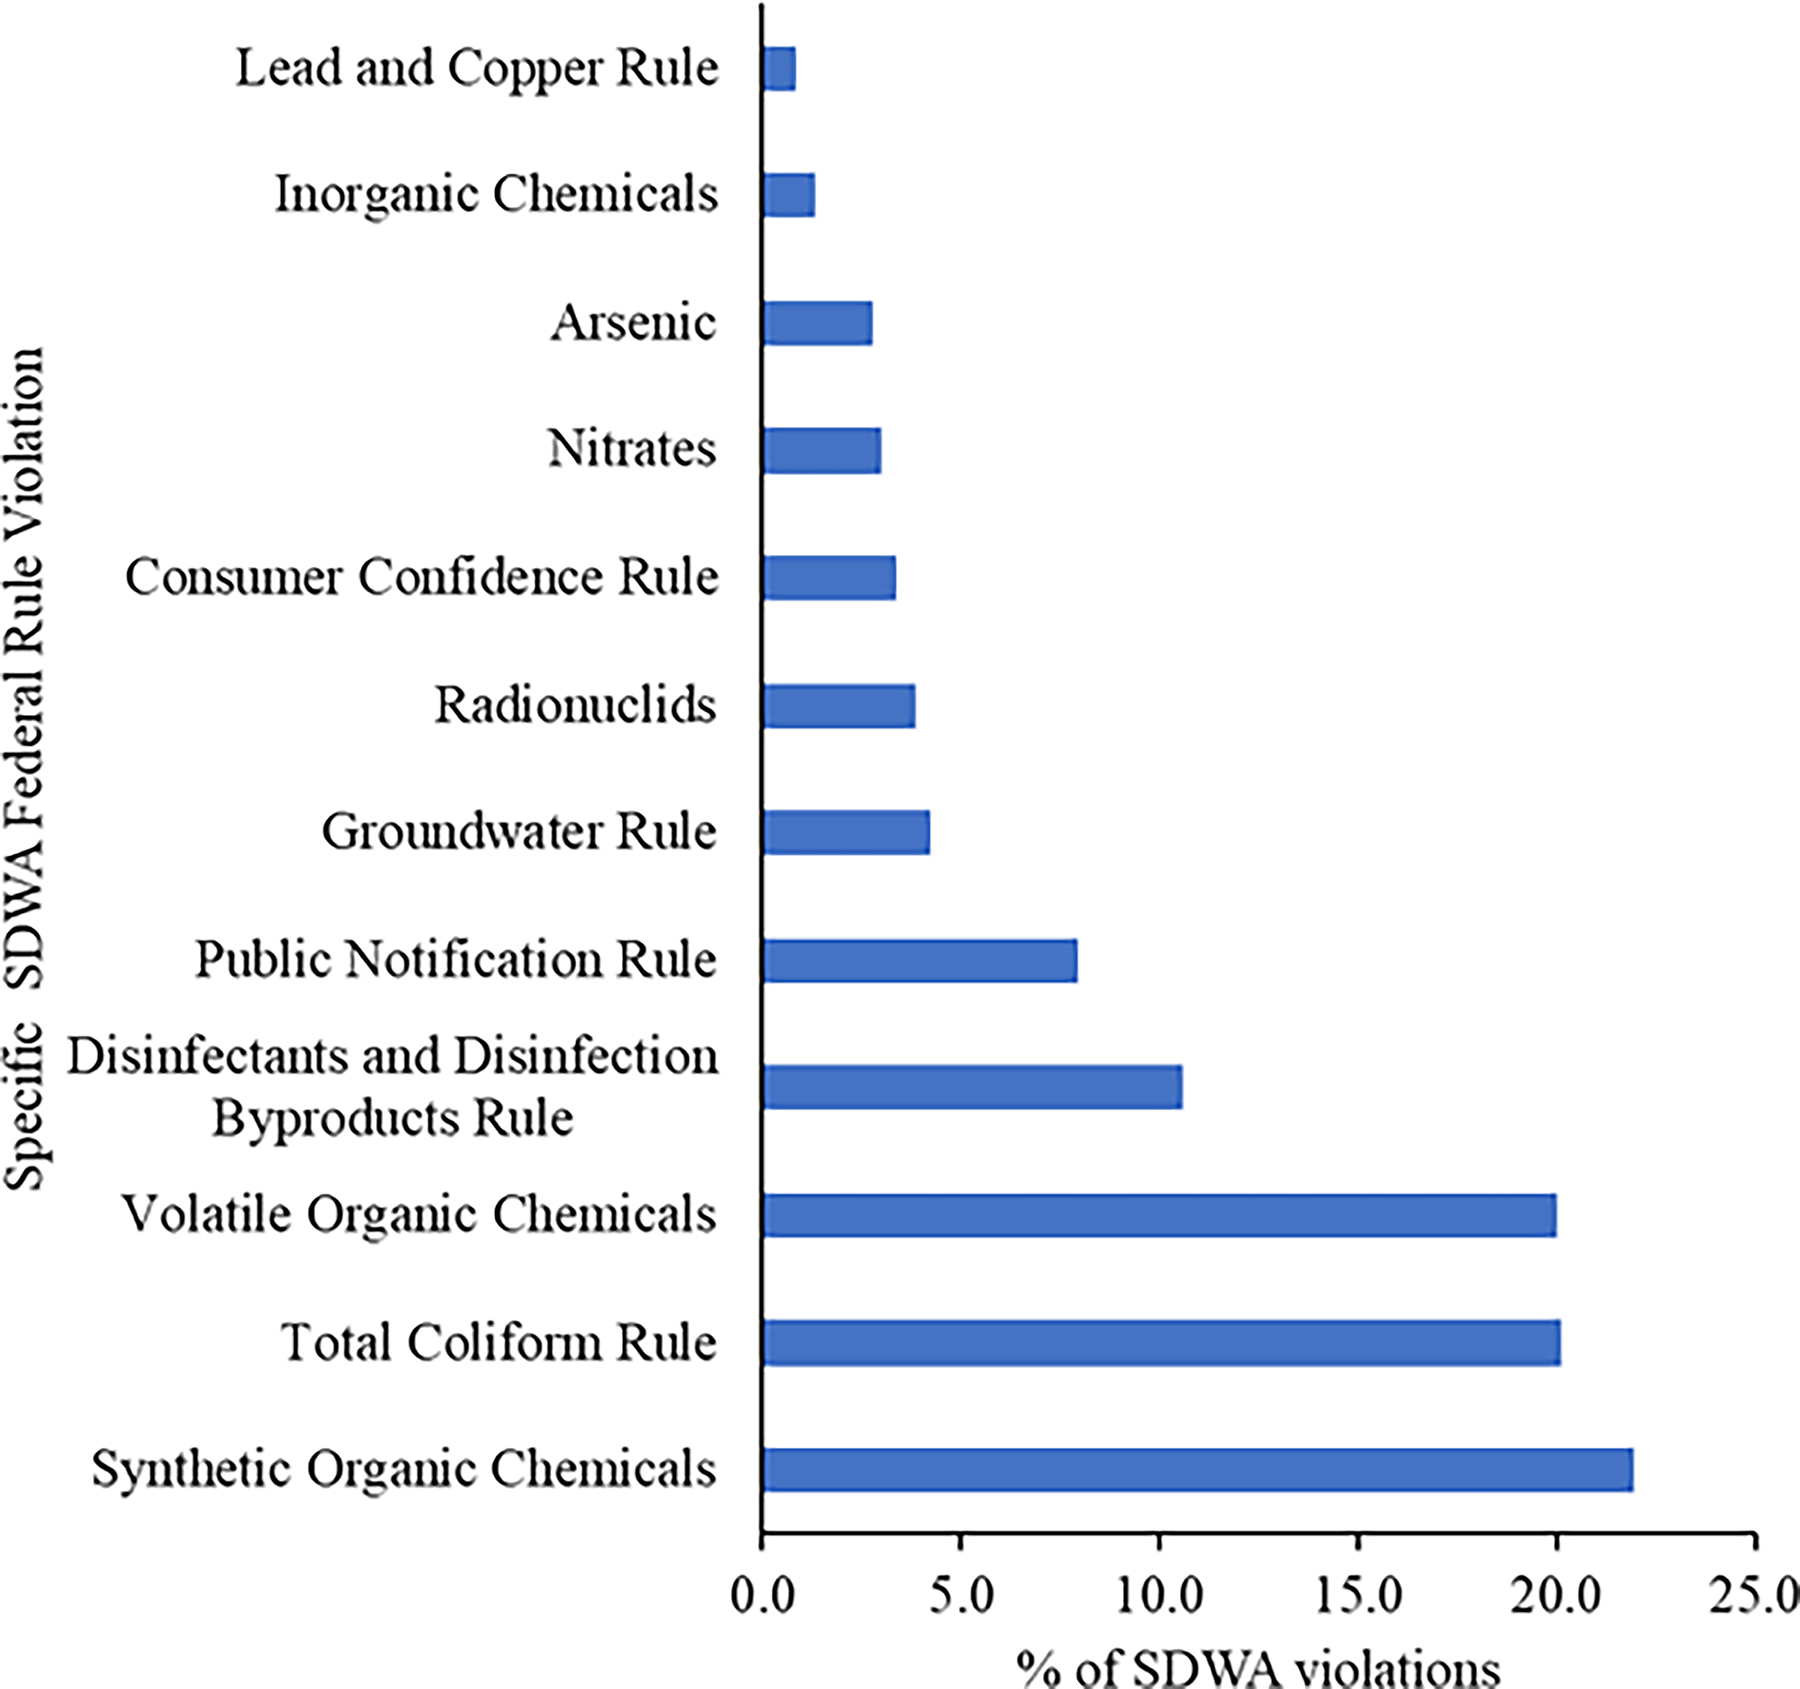
Violation type analysis (Fig. 2) shows that synthetic organic chemicals, total coliforms, and volatile organics comprised 54% of all health-related cases, while public notification failures make up 21%. The remainder is spread across disinfection byproducts (6.8%), groundwater rules (5.4%), consumer confidence (3.1%), and smaller categories including radionuclides, arsenic, lead/copper, and inorganic chemicals (2.3%, 2.2%, 1.4%, and 1.2%, respectively). These results highlight that while chemical risks remain, administrative lapses also drive exposure.
Main SDWA violations recorded in Native American communities in California (2011–2021).
California exemplifies the “small system problem,” where scattered tribal systems face disproportionately high compliance costs. Although health-related violations declined, the rise in public notification failures reflects persistent governance and capacity gaps. These findings echo SWRCB’s recognition that disadvantaged and tribal communities face systemic barriers to safe water delivery, including chronic underinvestment, reliance on variable groundwater, and difficulties meeting administrative requirements. Policy responses must go beyond infrastructure upgrades to include institutional strengthening, technical assistance, and enforcement tailored to small-system realities.
California’s “small system problem” directly parallels SDG 6.b, which stresses community participation and capacity in water governance. Persistent administrative violations (e.g., public notification failures) demonstrate that achieving SDG 6 is not solely a matter of infrastructure, but also of regulatory capacity, institutional support, and political empowerment—areas where U.S. policy gaps disproportionately burden Native American Nations.
Nevada
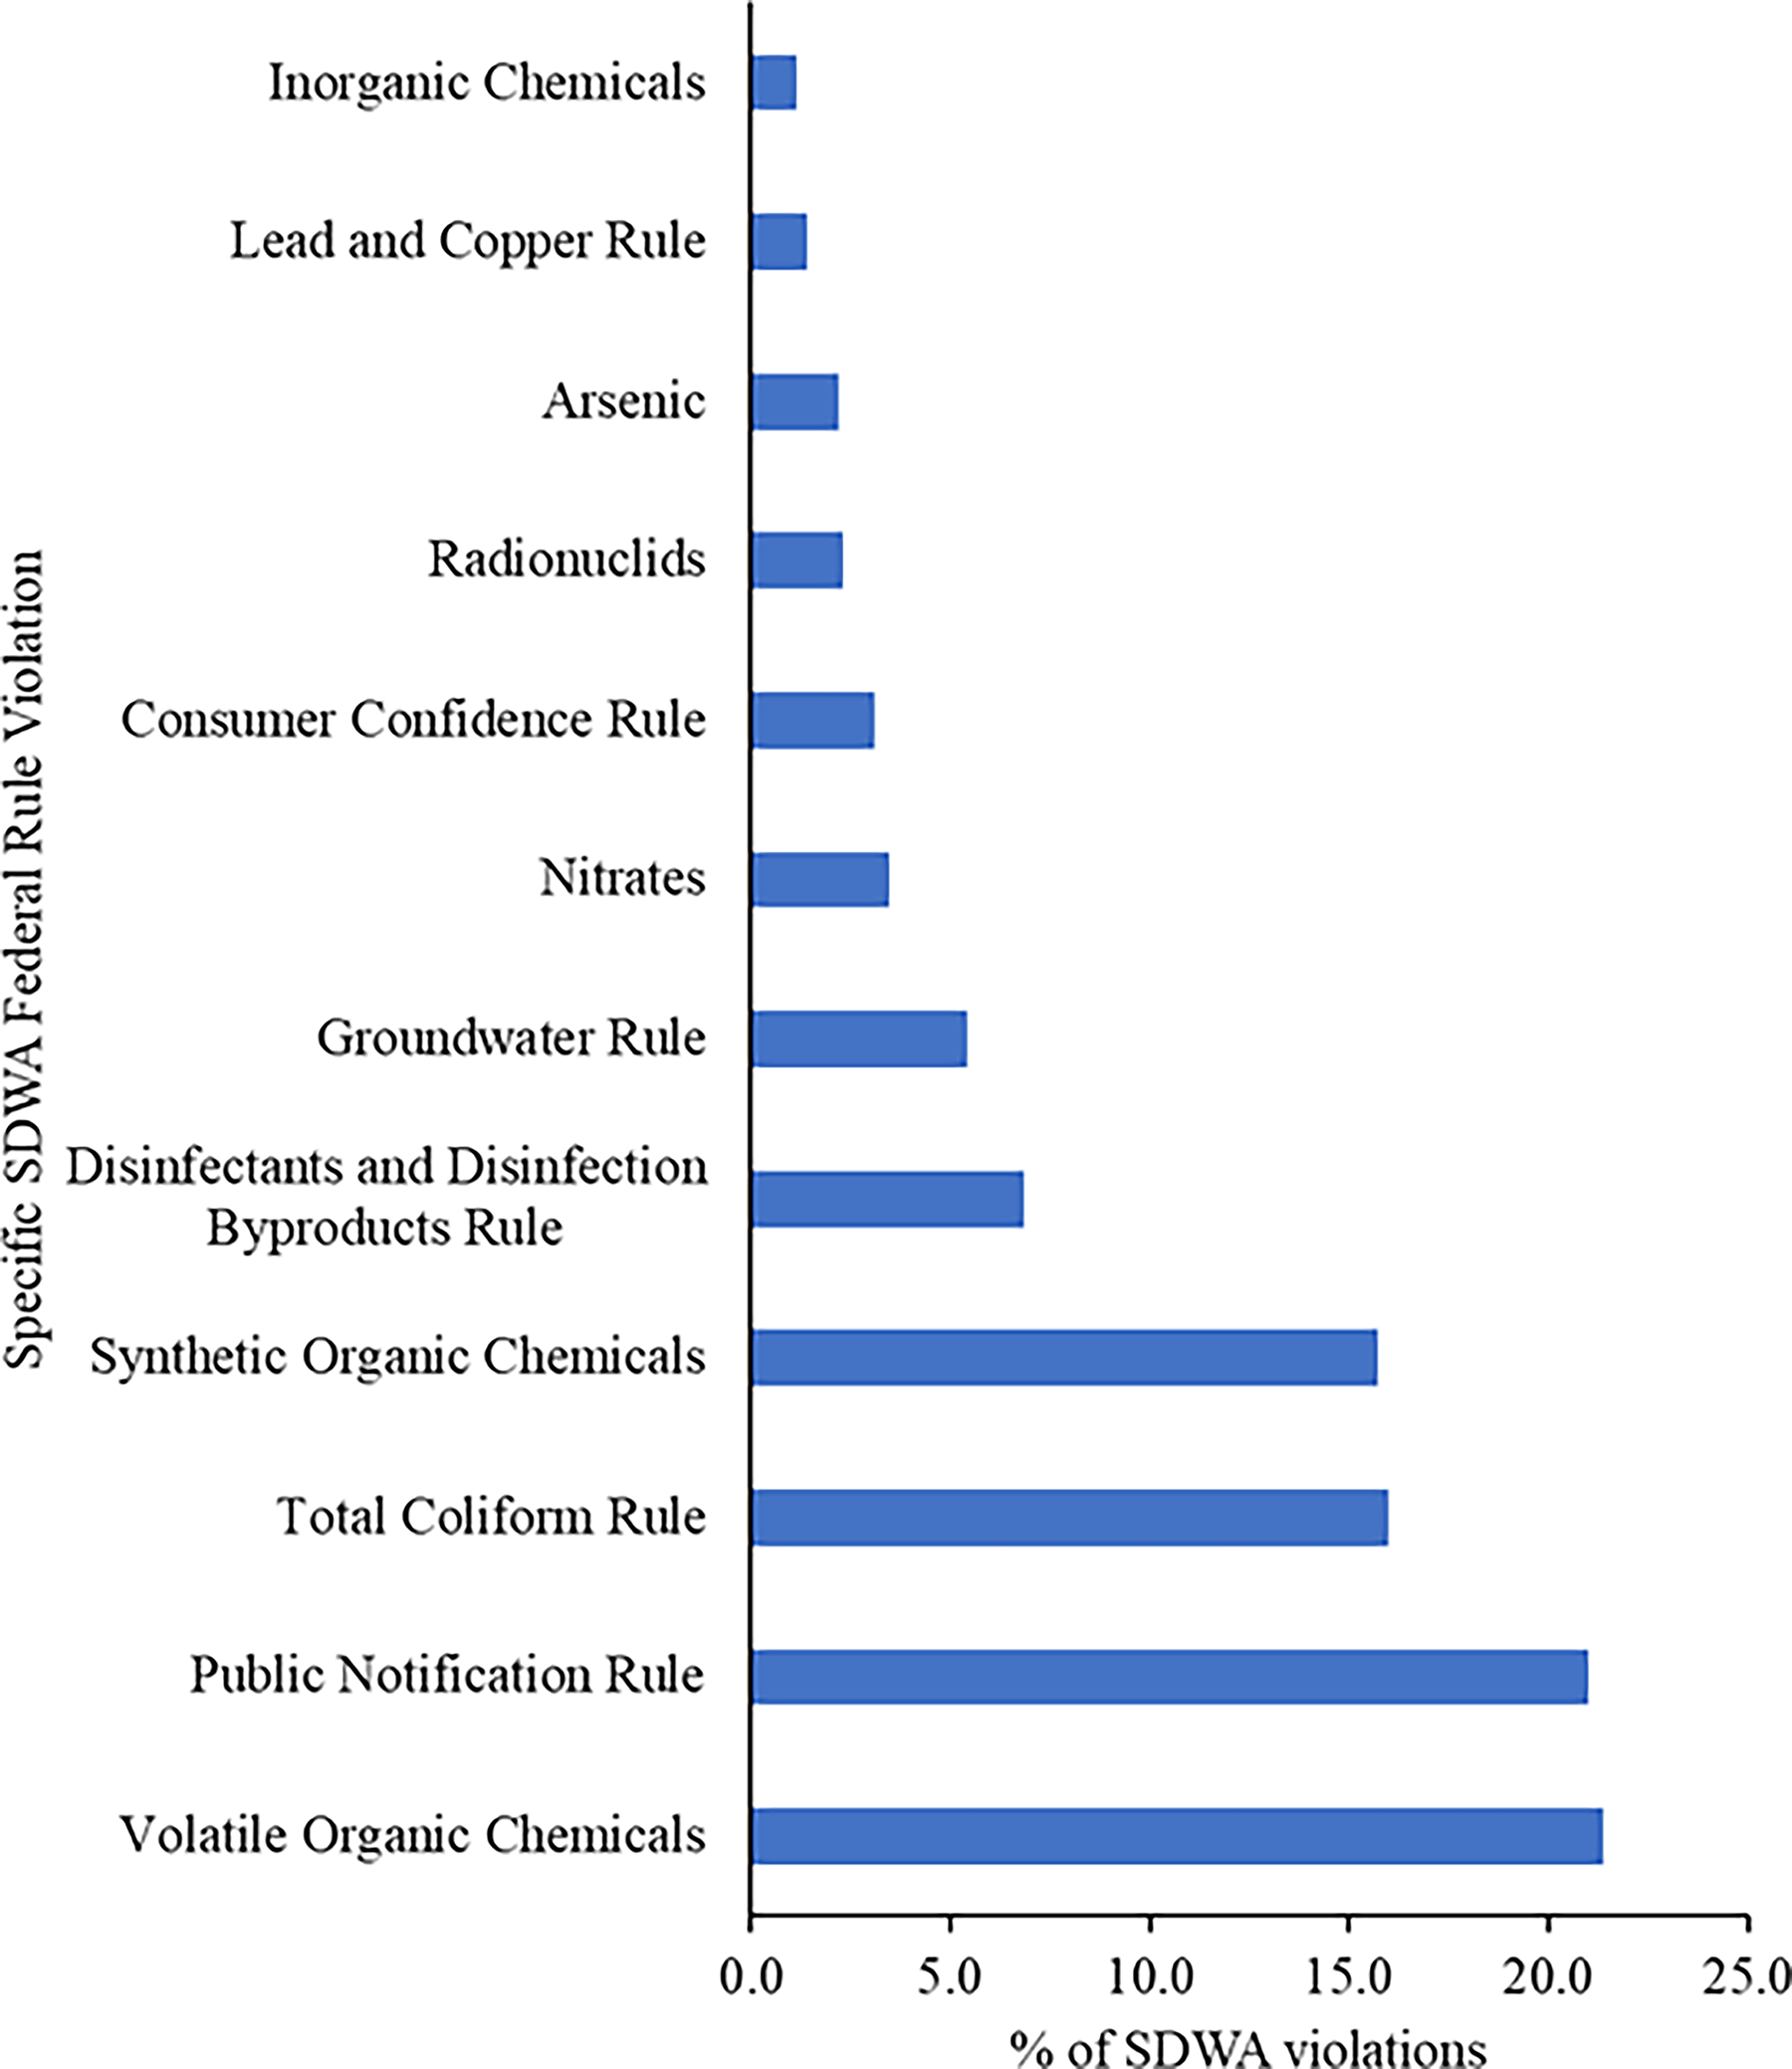
Unlike Arizona and California, Native American communities in Nevada showed no significant trends in violation frequencies between 2011 and 2021 (p > 0.05). This indicates stagnation, with compliance neither improving nor worsening. Nevada, nonetheless, ranks among the six worst states for SDWA compliance in Indian Country. 21 Violation types (Fig. 3) show health-related issues dominated (55.2%), led by VOCs, groundwater exceedances, and coliforms. Administrative violations were less frequent but notable, with public notification failures at 10%, followed by inorganics (8.9%), nitrates (6.6%), and synthetic organics (6.2%). Other categories, each < 5%, included consumer confidence (4.7%), disinfection byproducts (3.0%), lead/copper (2.5%), radionuclides (2.1%), and arsenic (0.8%). These patterns confirm prior studies that coliforms, VOCs, and groundwater exceedances as prevalent in Nevada tribal systems. 22
Main SDWA violations recorded in Native American communities in Nevada (2011–2021).
Nevada’s demographic and infrastructure profile is unique: the seventh largest state by area, yet 36th in population, with ∼90% concentrated in Las Vegas and Reno. Tribal systems in remote areas remain isolated from major investment corridors. While Nevada’s drinking water infrastructure is newer than neighboring states, it is still under strain. The American Society of Civil Engineers graded it “C-” (rated as mediocre) in 2018, citing limited long-term planning. 23
The absence of clear trends reflects chronic compliance problems that oversight and infrastructure renewal have not resolved. Tribal systems rely heavily on groundwater, unlike non-tribal systems, which are supplied mainly by surface water. This difference translates to a higher prevalence of microbial and chemical contaminants. 24 Addressing inequities in Nevada requires infrastructure upgrades alongside groundwater-specific strategies for isolated systems that cannot benefit from economies of scale.
The stagnation in Nevada underscores how political and jurisdictional fragmentation impede SDG 6 implementation in the United States. Because the U.S. does not formally integrate the SDGs into domestic water policy, tribal water systems remain structurally disadvantaged despite being among the populations most aligned with SDG 6’s equity and resilience goals.
New Mexico
No significant trends were found in New Mexico tribal SDWA violations between 2011 and 2021 (p > 0.05). Over 90% of community sources are groundwater, 25 similar to Nevada. Two-thirds of tribal utilities with violations are NTUA-managed, slightly higher than in Arizona. Still, 30% of Navajo households remain unconnected to public systems and instead use unregulated livestock wells 26 outside SDWA jurisdiction, complicating risk assessment.
Figure 4 shows that health-based violations, mostly coliforms and disinfection byproducts, made up 55% of cases. Administrative categories such as public notification (12.5%) and consumer confidence (7.4%) were common, along with nitrate (9.5%) and arsenic (5.7%). Radionuclides (1.7%) and lead/copper (0.2%) were rare, though independent studies show elevated uranium and arsenic in Navajo groundwater.27,28 Many contaminated wells remain unregulated, underestimating actual risk, even though ∼40% of Navajo households rely on them. 29
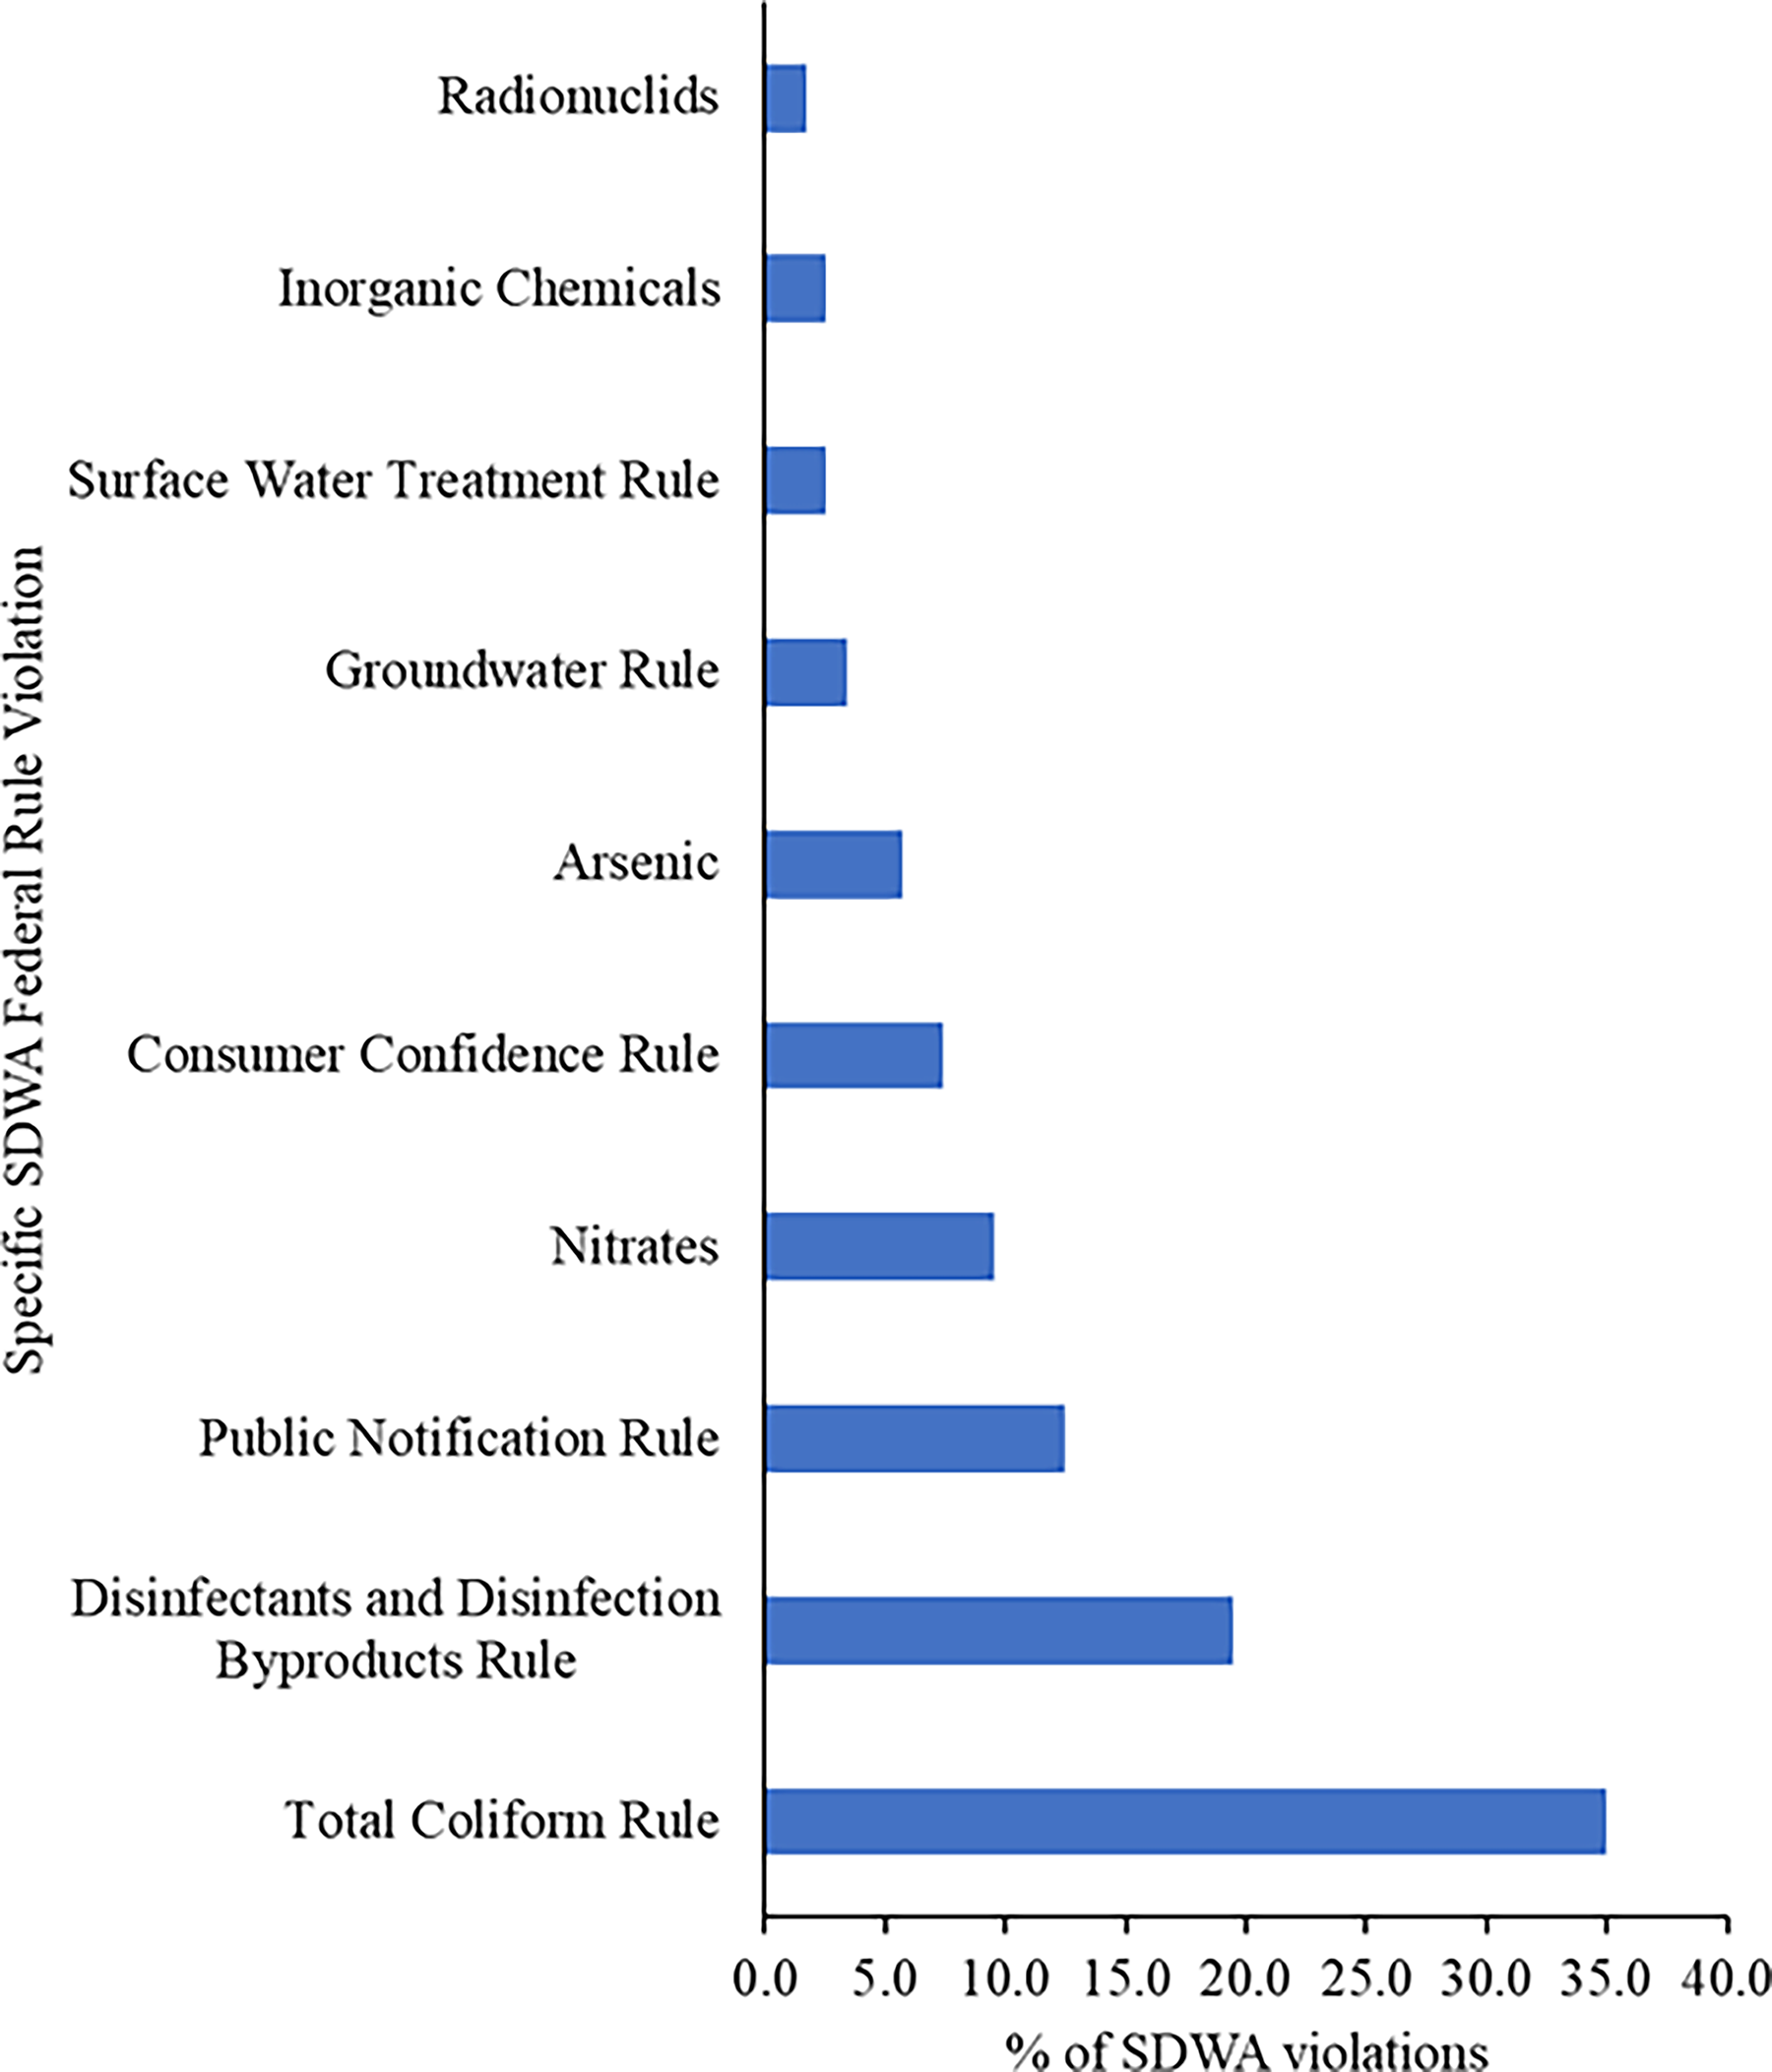
Main SDWA violations recorded in Native American communities in New Mexico (2011–2021).
Governance adds further complexity. Some New Mexico tribes lack trust status or treaties, and many operate under “Treatment as a State” (TAS) under the Clean Water Act. While TAS enhances self-determination, its effectiveness for drinking water is questionable. 30 The dominance of microbial and disinfection violations underscores design and operational issues, particularly residence times in distribution networks. 31 That such issues persist under NTUA management highlights systemic underinvestment in small systems. Bridging gaps requires expanding monitoring to non-SDWA sources, alongside investment and community-led governance strategies. 32
The dominance of microbial and disinfection byproduct violations underscores the role of system design and operation, particularly residence times in distribution networks in shaping water safety outcomes. 33
The reliance on unregulated groundwater and persistent operational issues highlight misalignments between U.S. regulatory frameworks and SDG 6 targets, especially 6.1 and 6.3 (improvement of water quality). The lack of regulatory coverage for many Navajo households demonstrates how gaps in U.S. policy environments hinder alignment with global water-security standards.
Scaling inequities: Population size and SDWA violations in tribal nations
Figure 5 shows violations normalized by population across Arizona, California, Nevada, and New Mexico. Disparities are striking. The Mescalero Apache Tribe (∼50 residents) reported 113 violations, equivalent to 226 per 1000 inhabitants. By contrast, the Navajo Nation (83,000+ residents) recorded just five violations (0.006 per 1000).
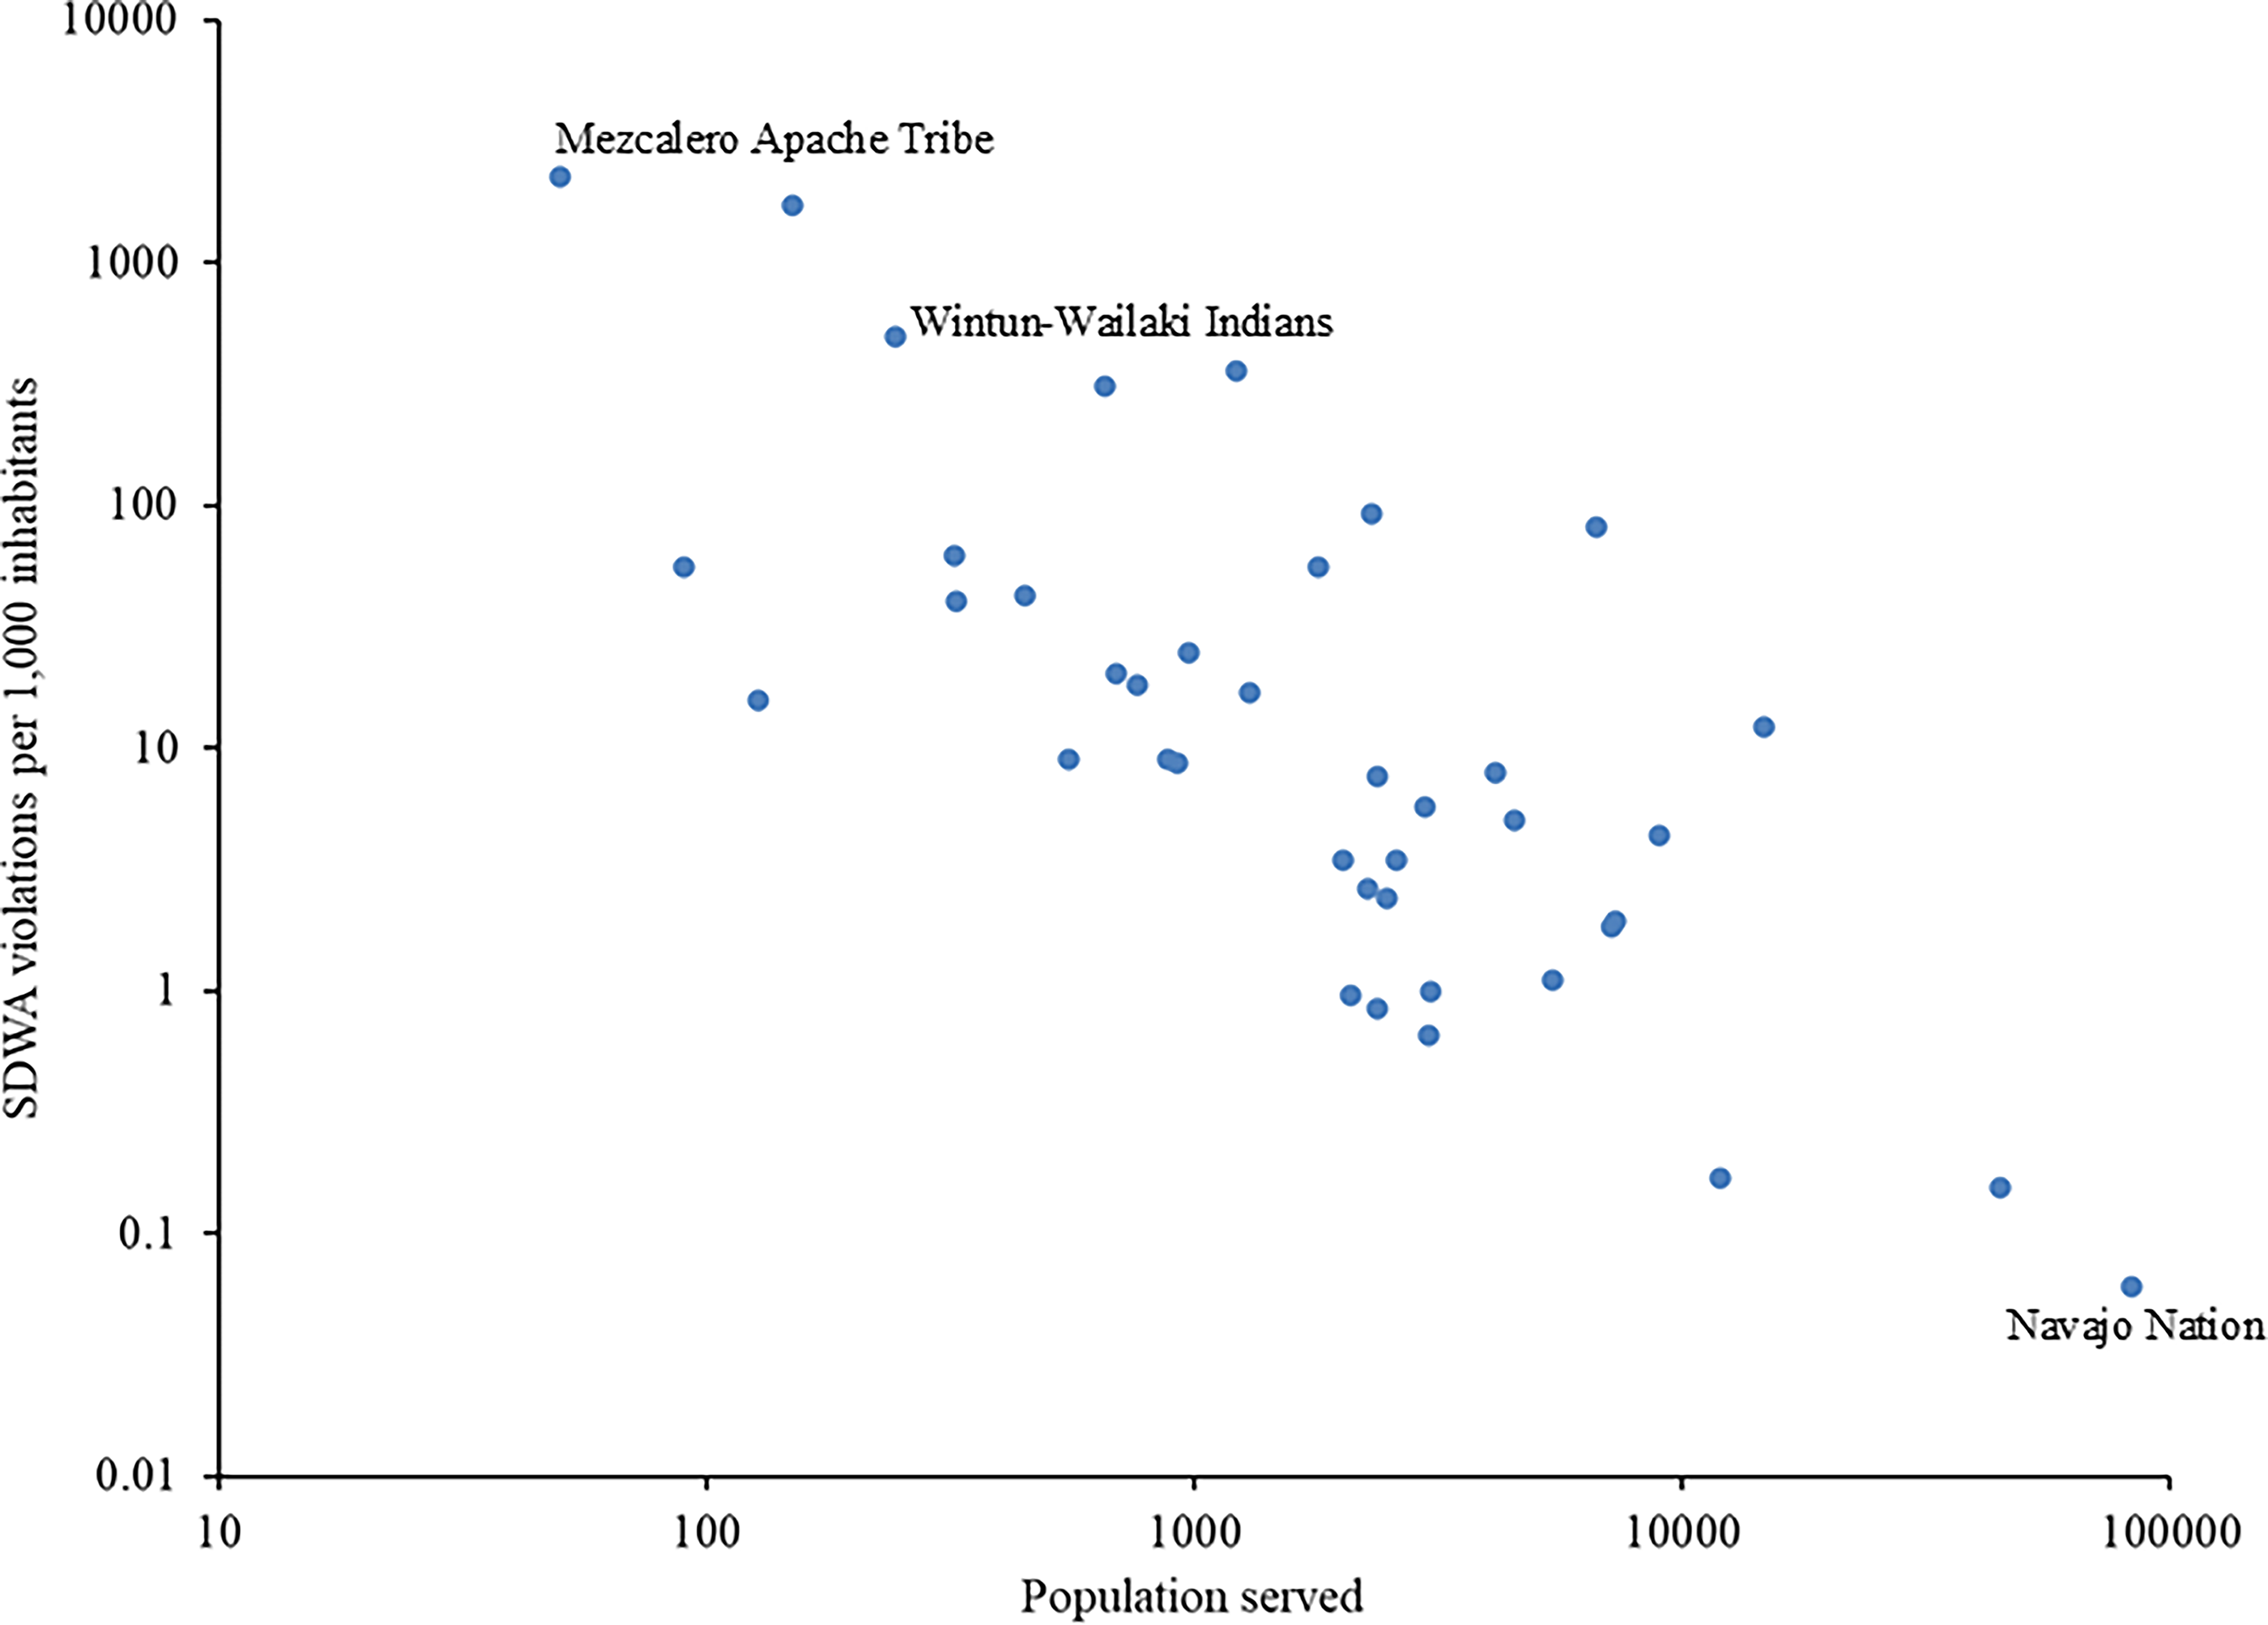
SDWA violations reported per 1000 inhabitants for the different Native American tribes in Arizona, California, Nevada, and New Mexico.
Analysis confirmed a strong inverse correlation between population size and violation rates (rs = –0.55, p = 0.00021). Small tribes such as the Wintun-Wailaki (∼150 residents, 172 violations per 1000) and Mono People (∼244 residents, 50 violations per 1000) bore the highest burdens. Larger tribes, such as the Luiseno/Cupeno (∼45,000 residents), had far lower rates (0.02 per 1000).
Economic indices (Table 1) suggest socioeconomic conditions compound these vulnerabilities. Wealthier tribes (e.g., Pauma, Luiseno/Cupeno) reported fewer per capita violations, while poorer communities (e.g., Shoshone, Wintun-Wailaki) faced heavier burdens. These patterns indicate that both demographic scale and socioeconomic disadvantage shape regulatory outcomes, leaving small, under-resourced communities at greater risk.
Native American SDWA violations, population served, and economic indices.
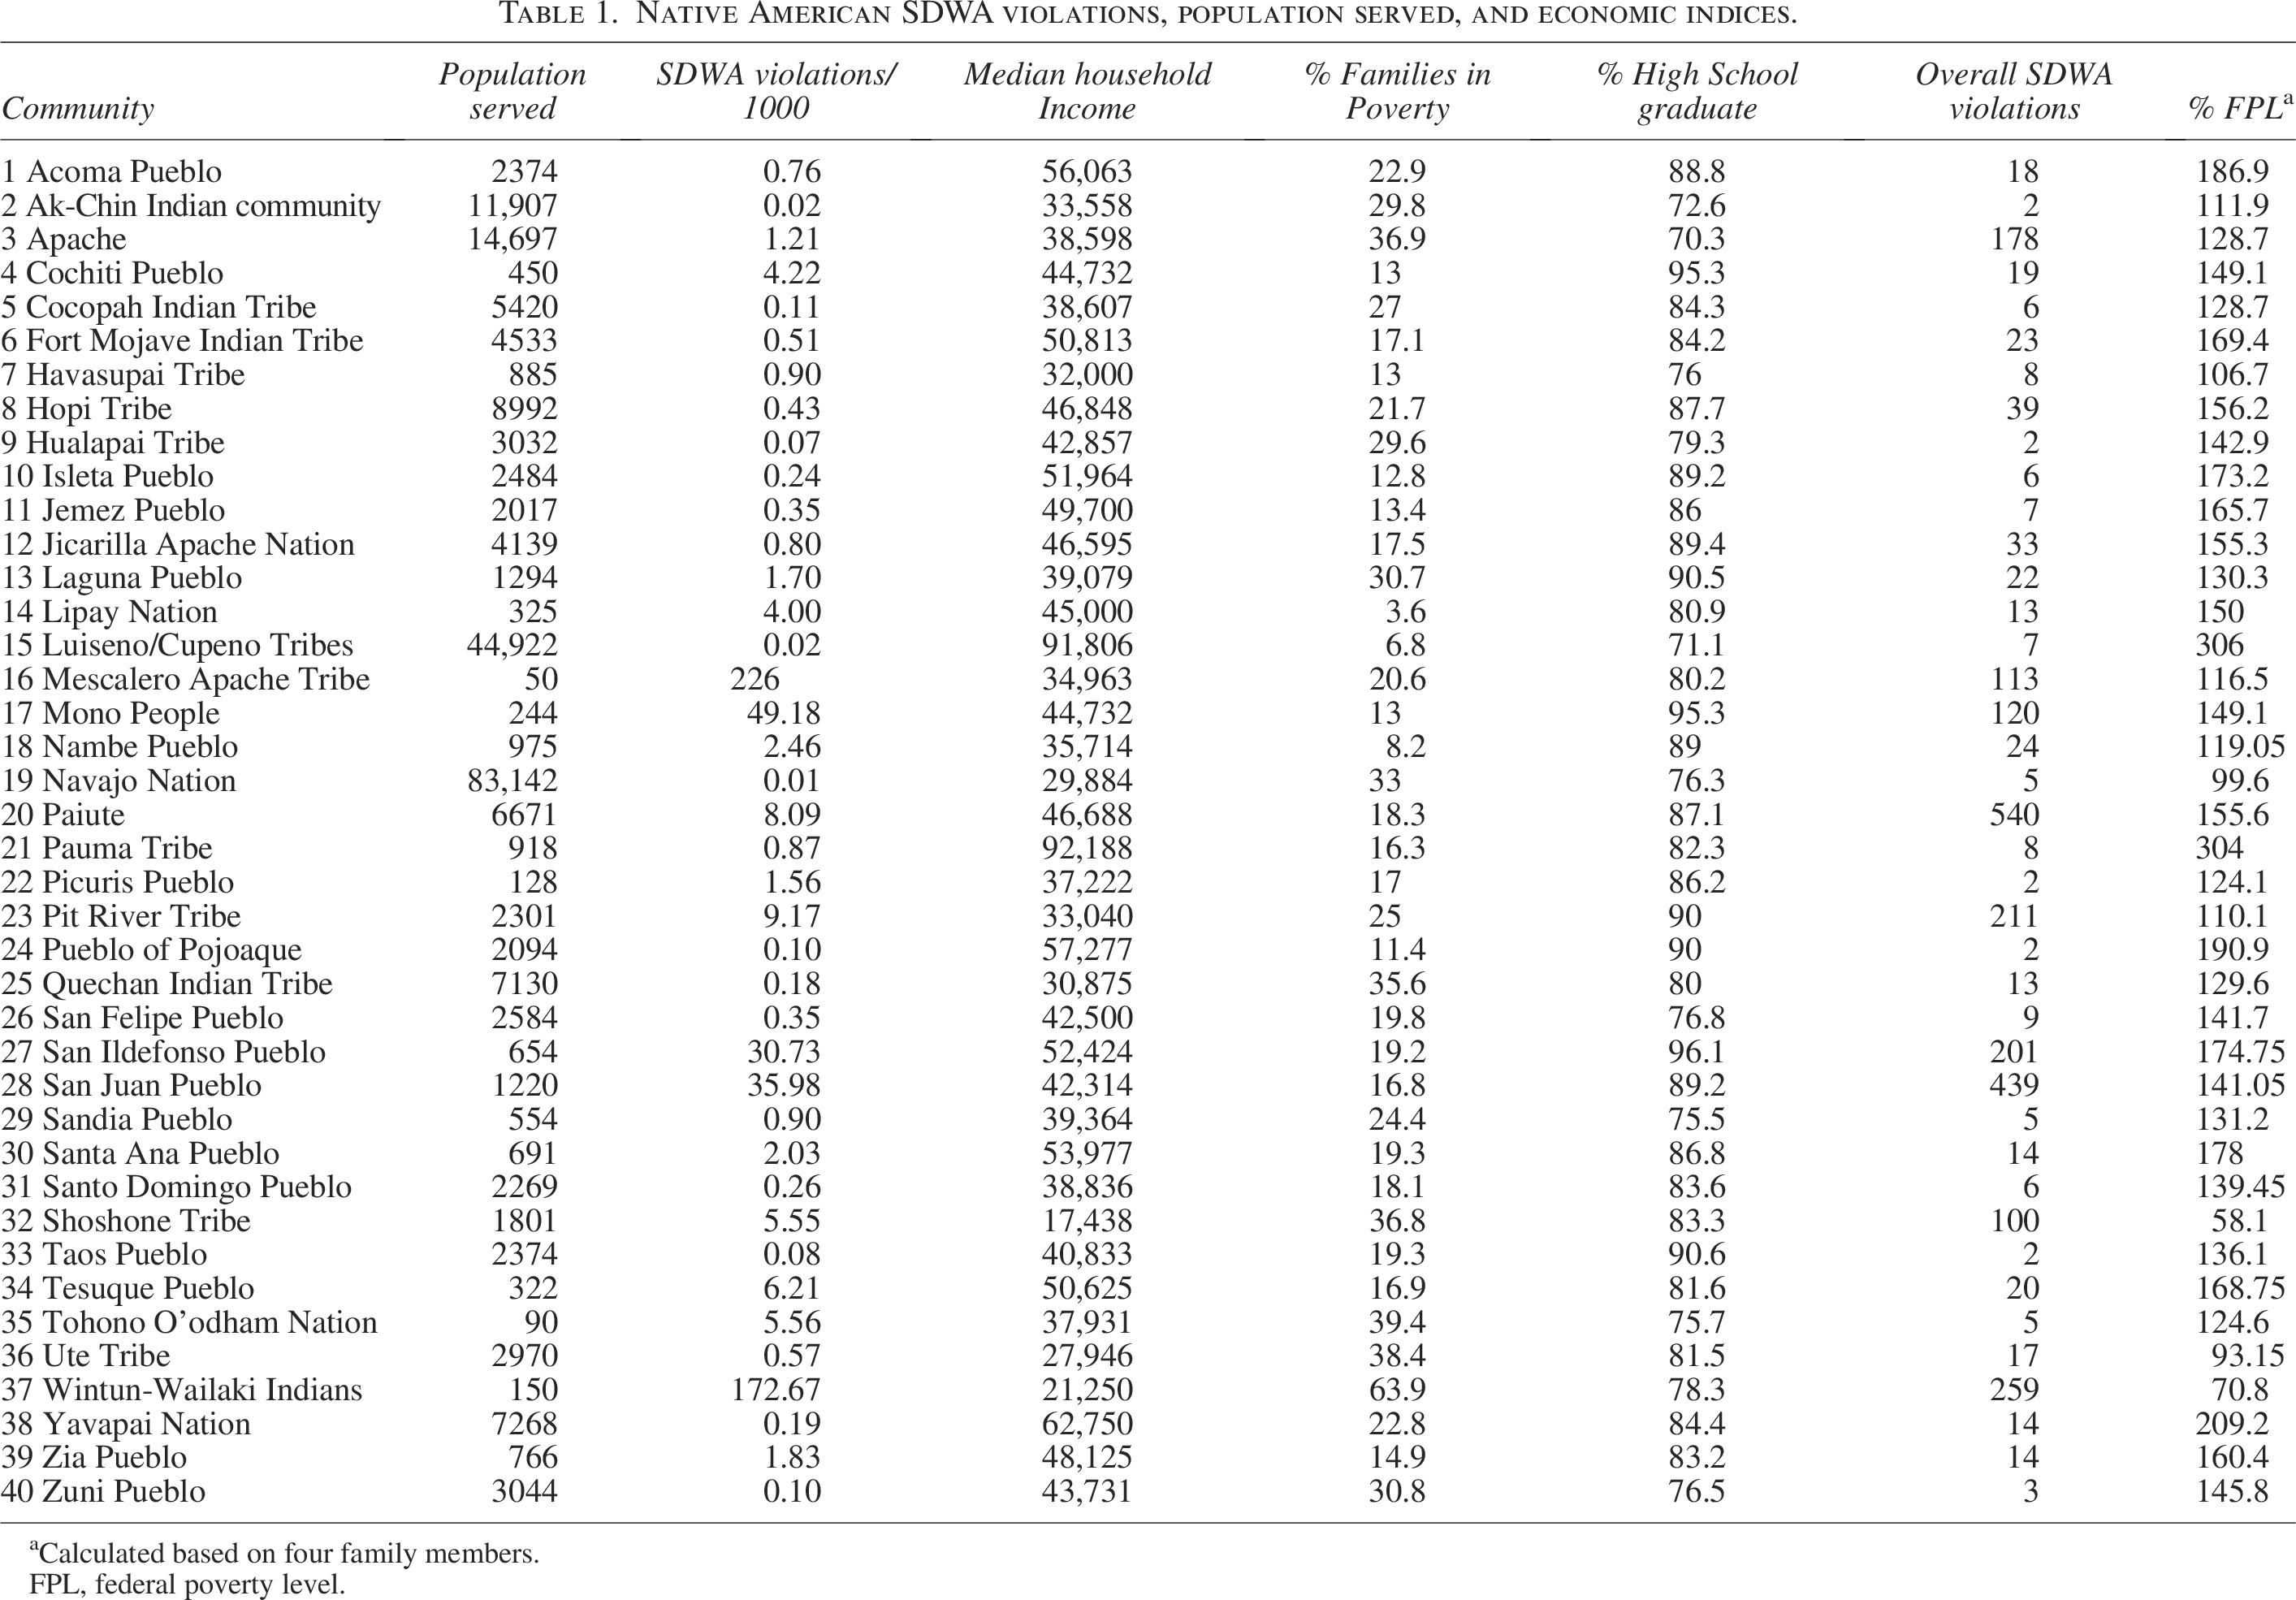
Calculated based on four family members.
FPL, federal poverty level.
The relationship illustrated in Figure 5 suggests water insecurity is not evenly distributed but follows a nonlinear pattern. Larger tribes, despite managing complex systems, show low violation rates, while smaller tribes face disproportionate burdens. Socioeconomic indicators reinforce that poverty and limited education amplify these risks. Addressing them will require infrastructure investments paired with capacity-building, regionalized management, and flexible regulatory mechanisms. These findings directly resonate with SDG 6.1, which calls for universal and equitable access to safe and affordable drinking water. The nonlinear burden on small tribal nations illustrates how current U.S. governance systems—characterized by decentralized oversight, inconsistent funding, and variable enforcement—do not fully support the equitable outcomes envisioned in SDG 6.
Socioeconomic determinants of SDWA violations
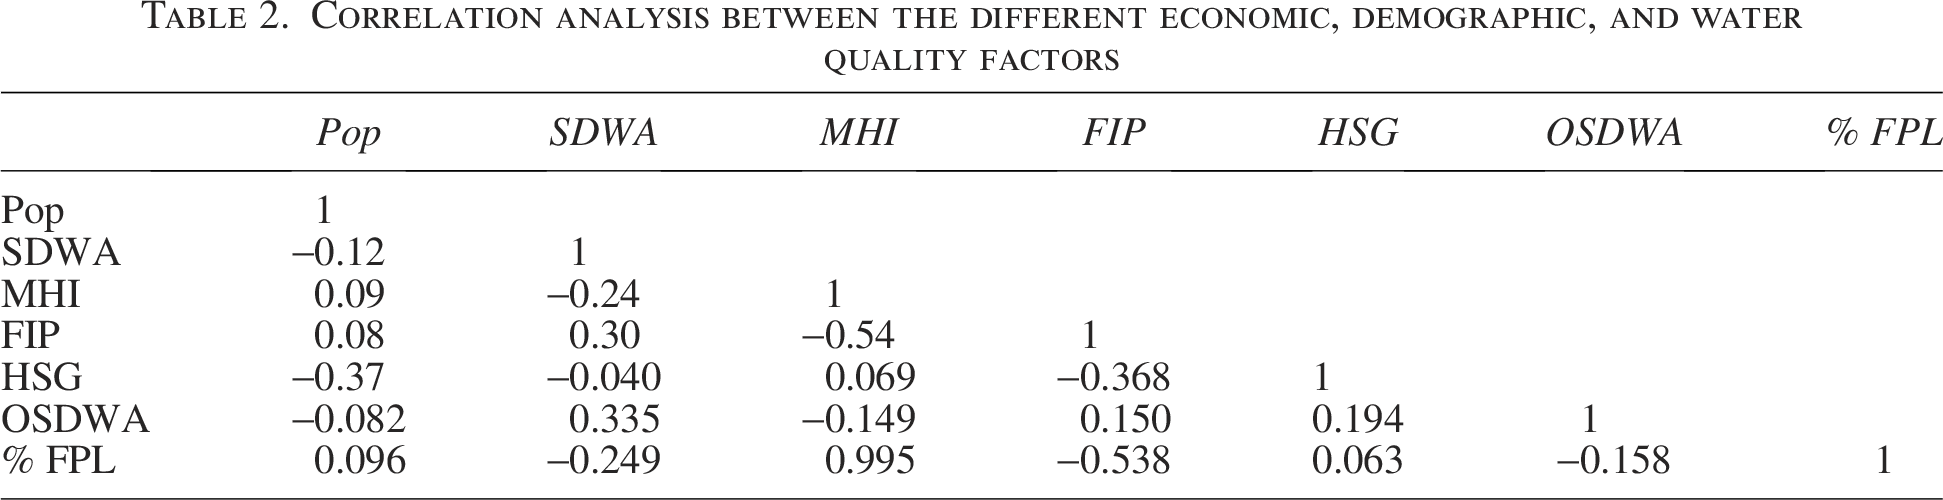
Beyond univariate comparisons, this study examined how economic, demographic, and water quality indicators jointly shape disparities. Table 2 shows SDWA violations correlated negatively with median household income (MHI, r = −0.24) and population size (Pop, r = −0.12), but positively with poverty rates. These findings reinforce evidence that socioeconomic vulnerability exacerbates water insecurity, echoing studies noting limited infrastructure and political leverage as barriers. 34 Also, these findings are consistent with prior studies identifying low political leverage and limited infrastructure capacity as barriers to safe water access in Native American nations. 35
Correlation analysis between the different economic, demographic, and water quality factors
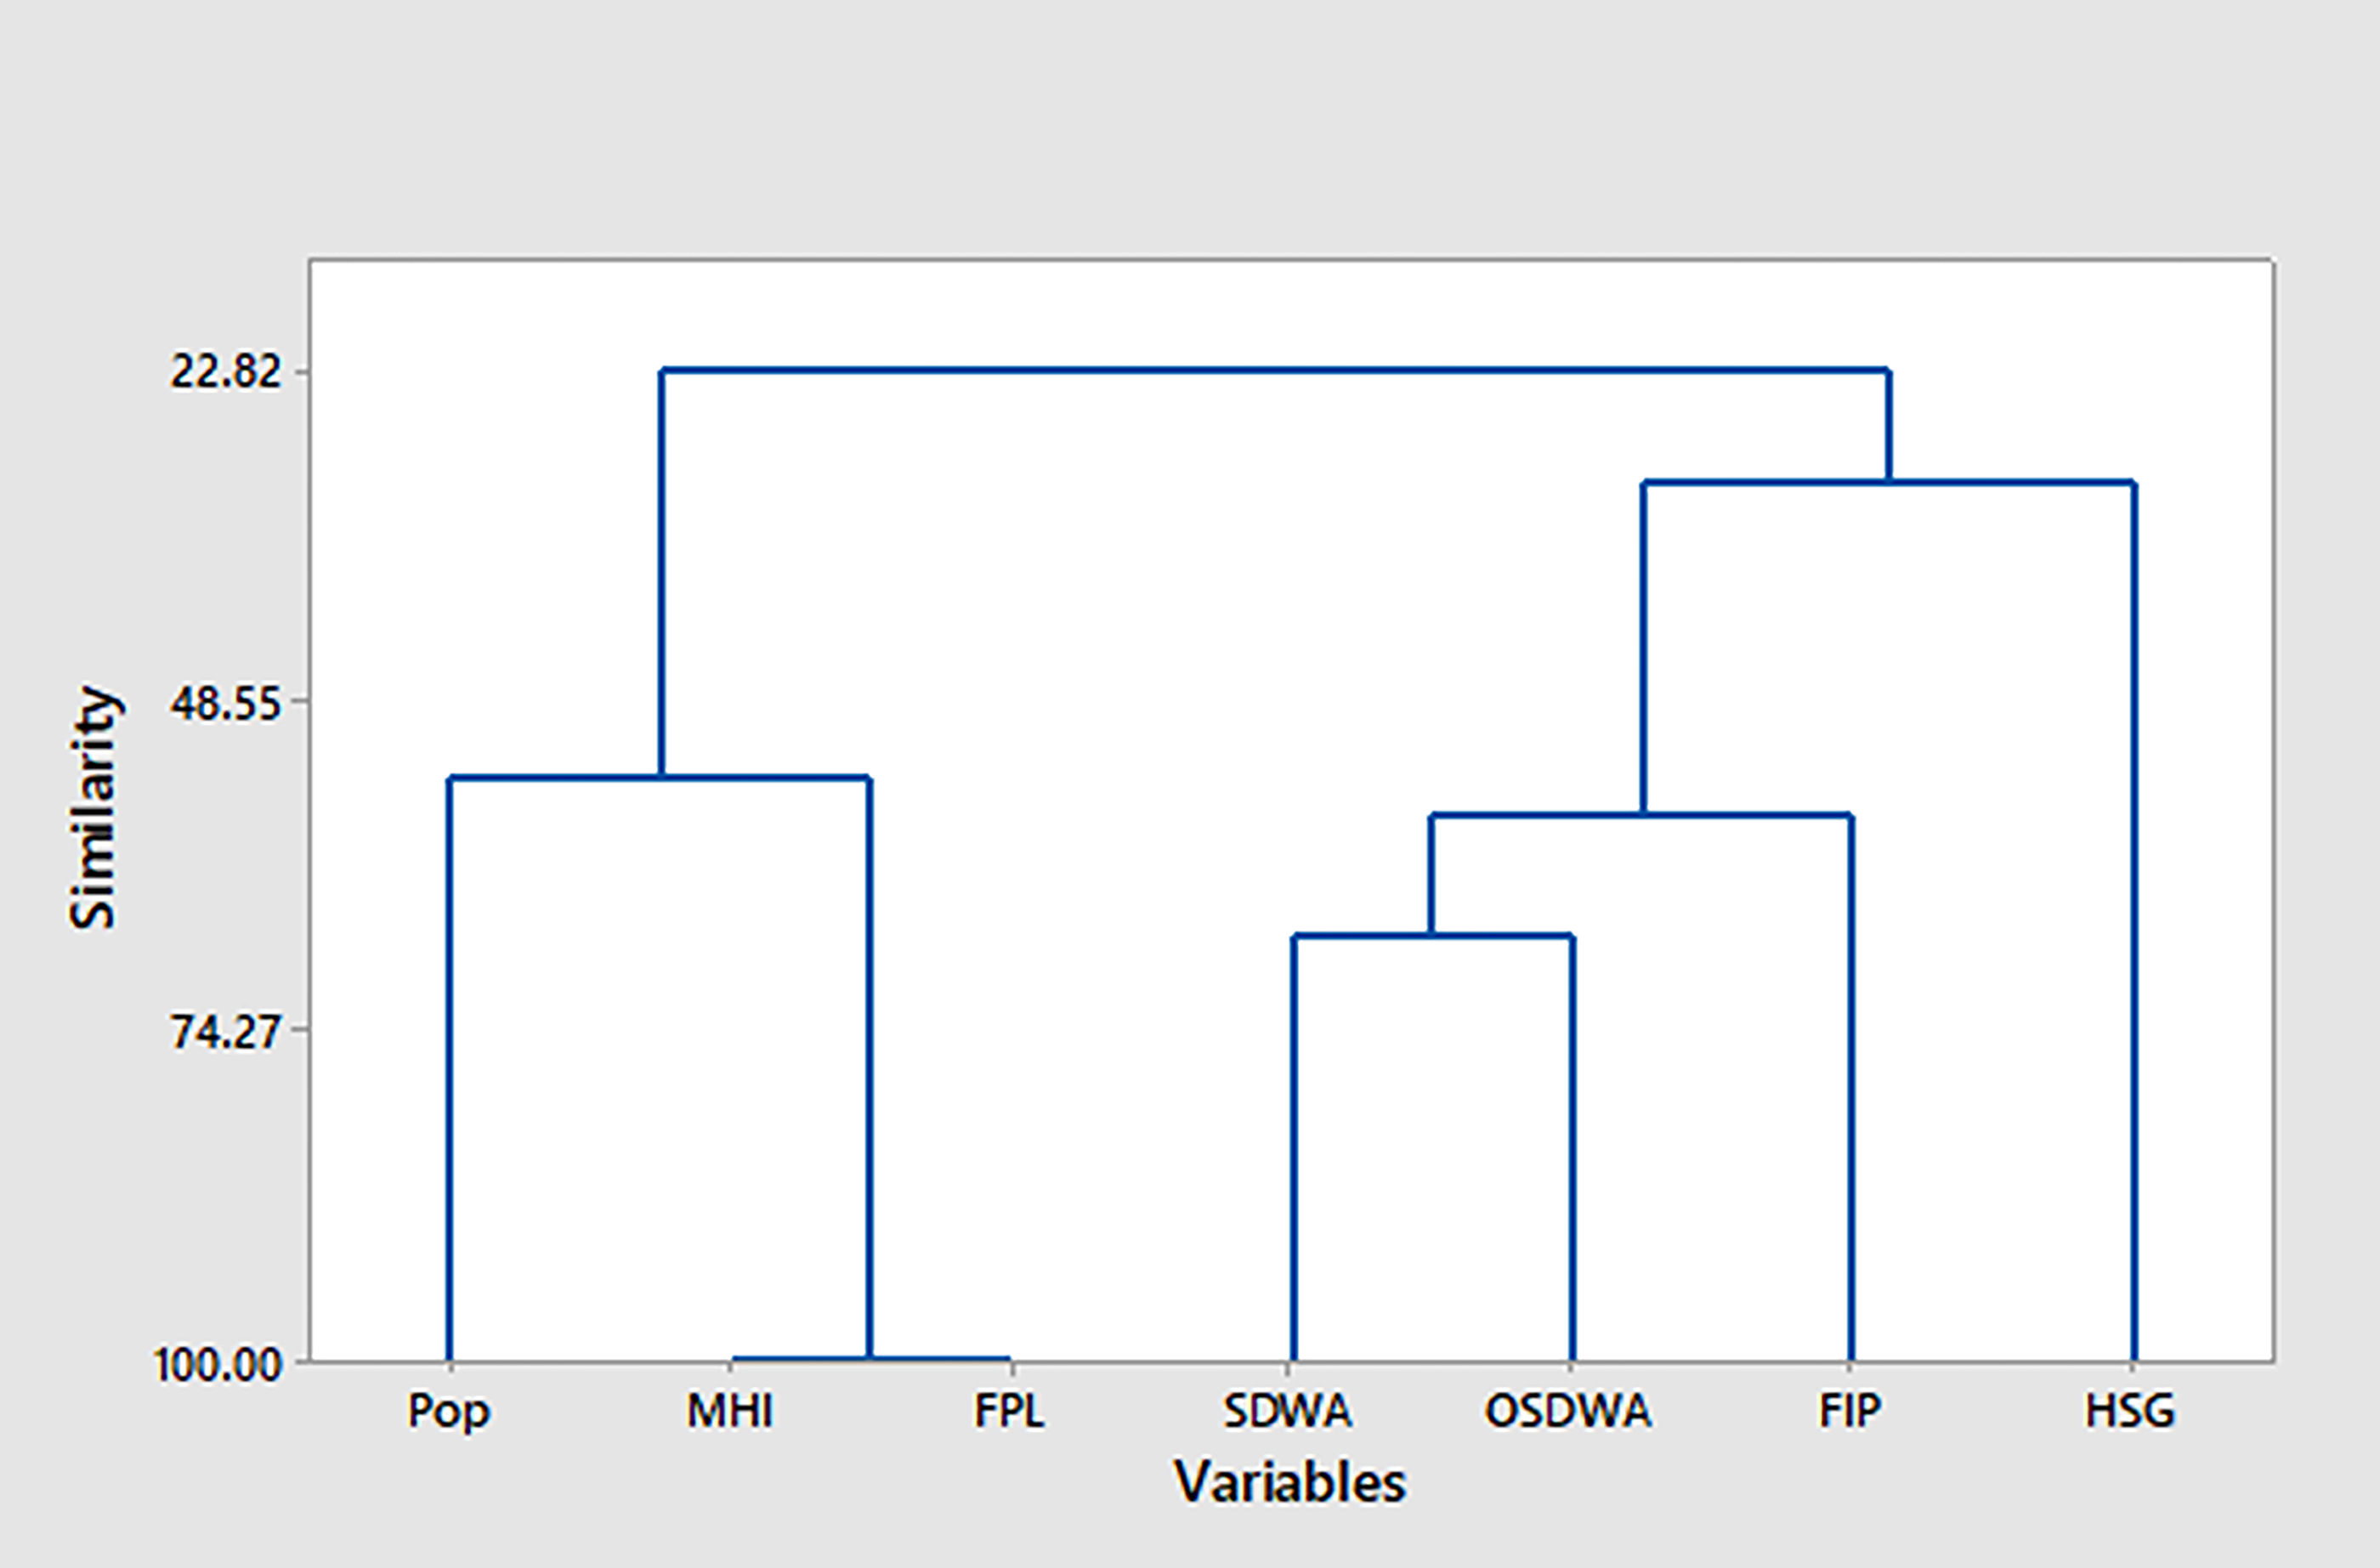
The PCA loadings plot (Fig. 6) confirms these trends: SDWA and OSDWA are aligned with poverty, while negatively correlated with MHI and %FPL. Population size emerged as protective, reducing violations through economies of scale and institutional capacity. At the community level, the scores plot (Fig. 7) shows divergent drivers: the Pauma and Luiseno/Cupeno Tribes were influenced more by economic conditions, the Navajo Nation by population size, and the Wintun-Wailaki Indians by extreme poverty (FIP = 63.9%). These results suggest that poverty magnifies risks in smaller communities, while scale modifies outcomes in larger Nations.
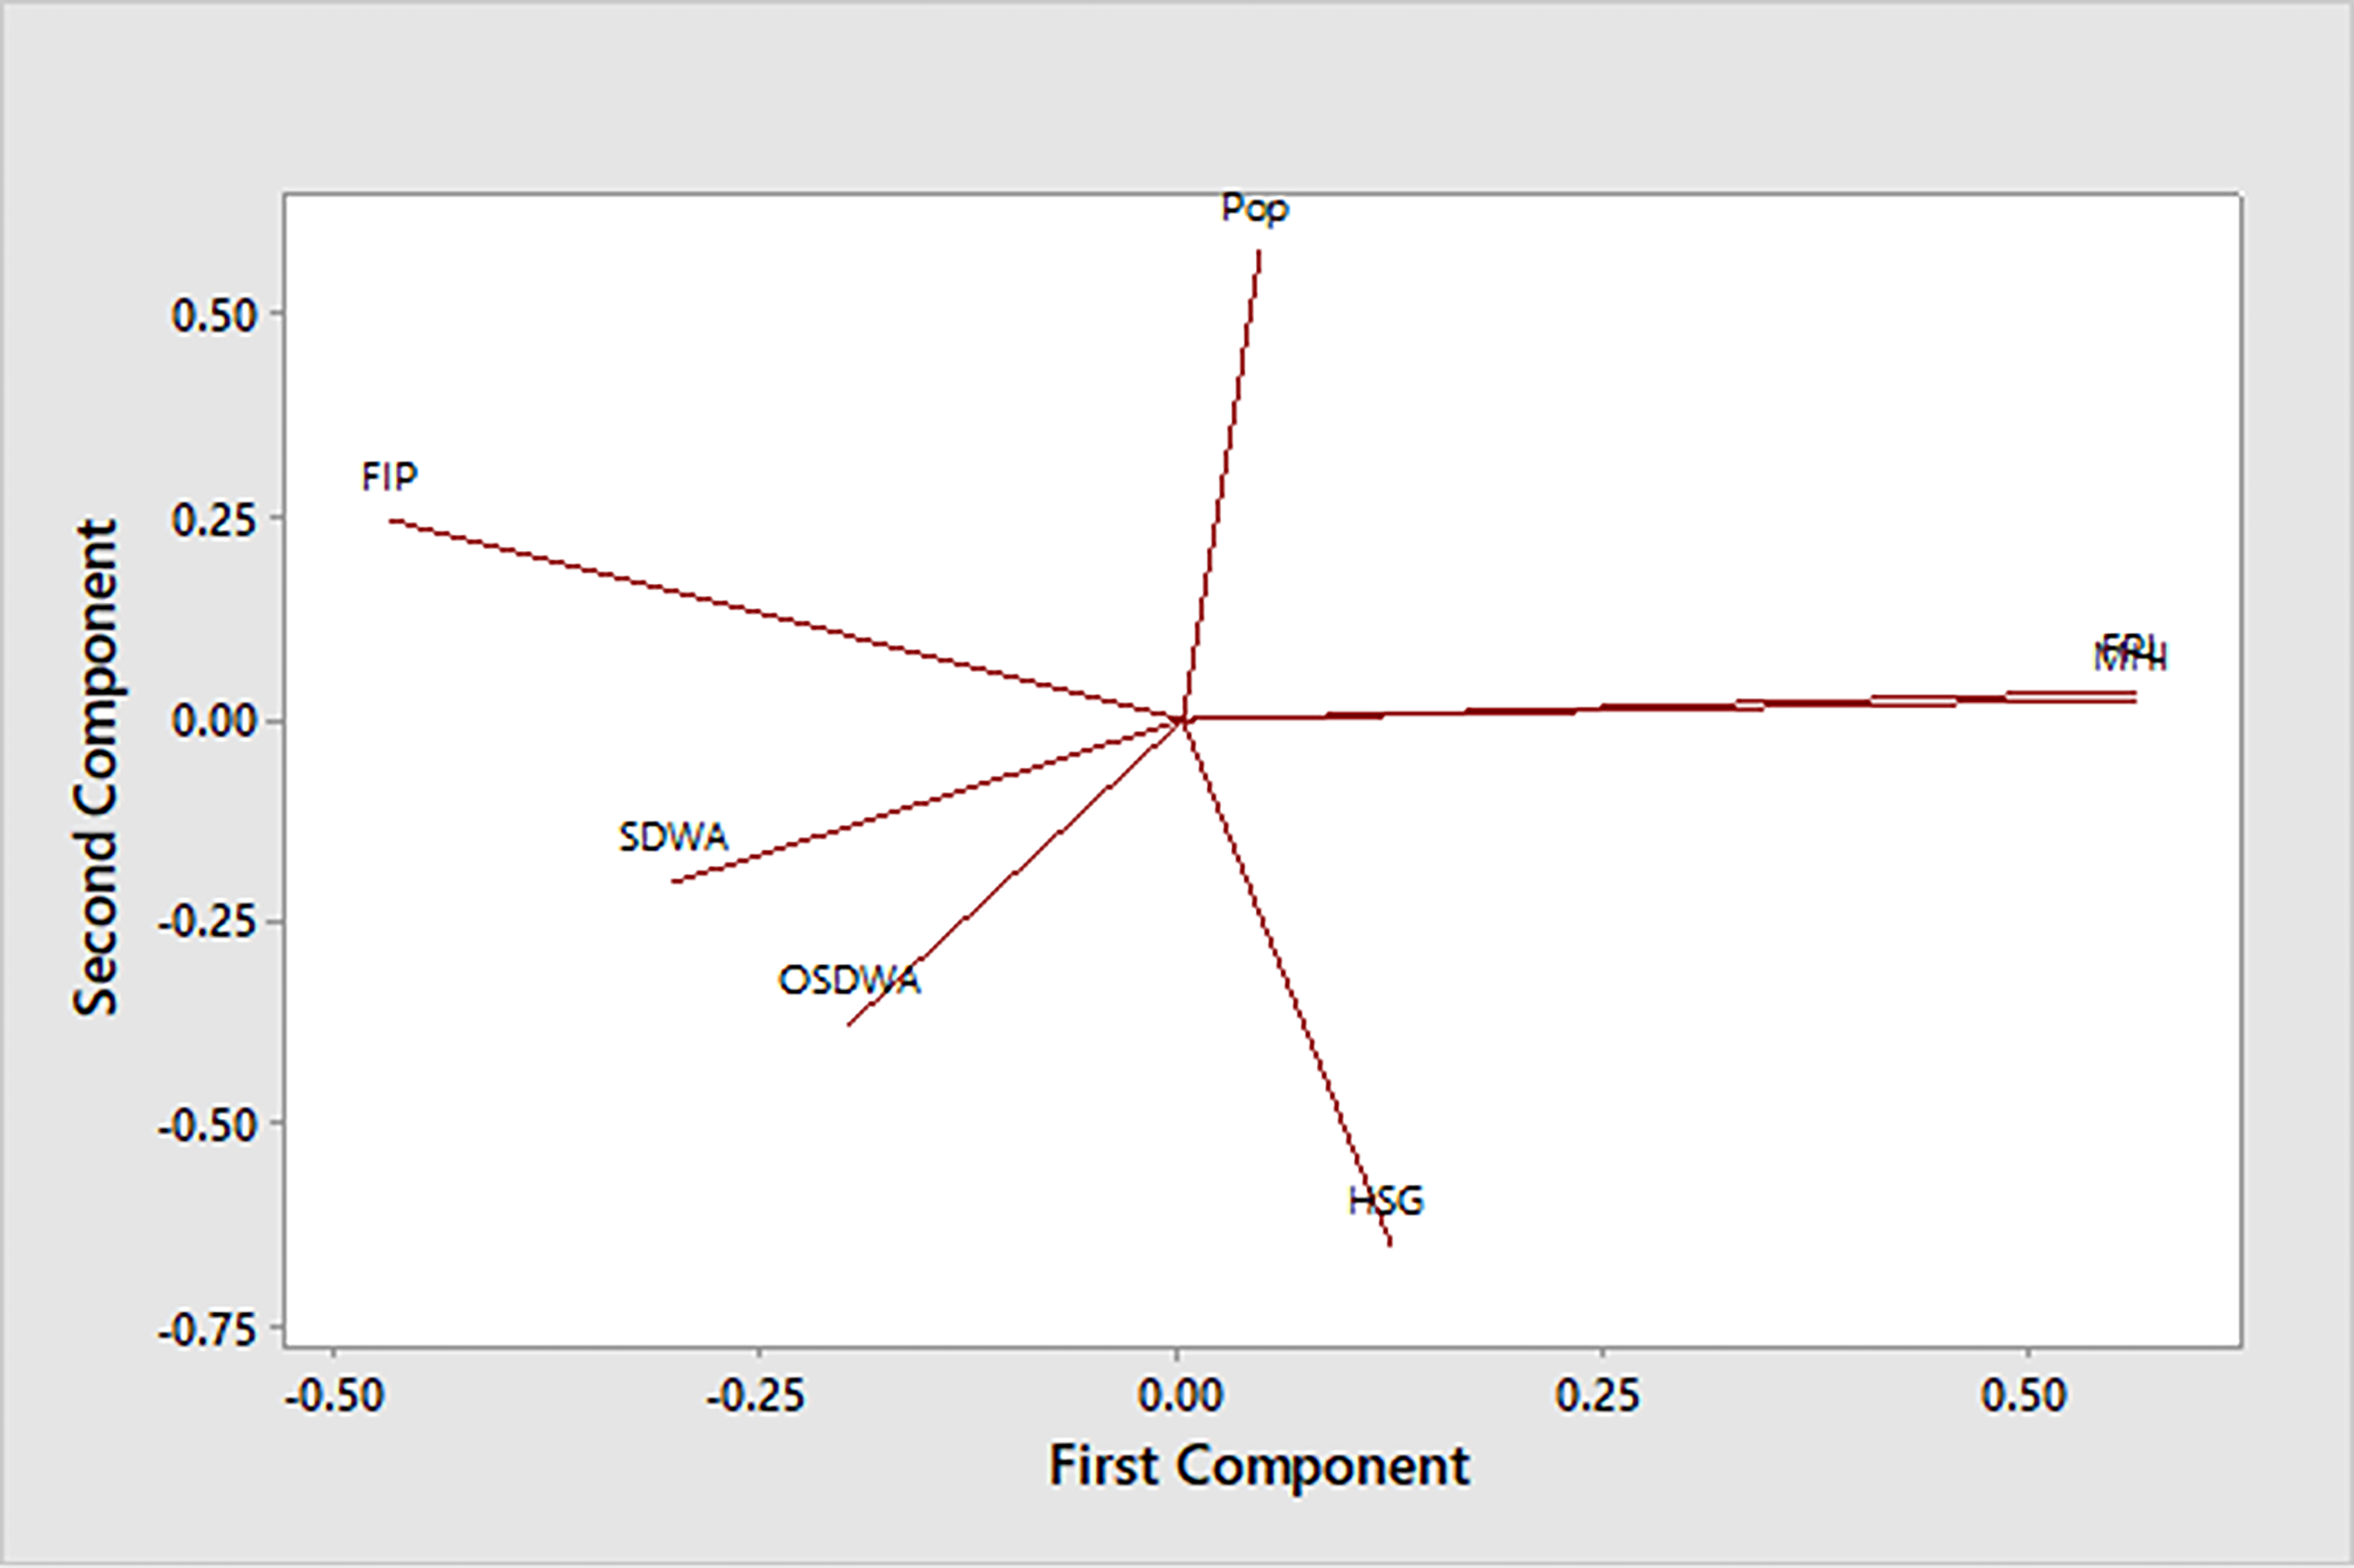
PCA loadings plot for the different economic, demographic, and water quality variables tested in this study (PC1 and PC2 explained 70.4% of the data variance).
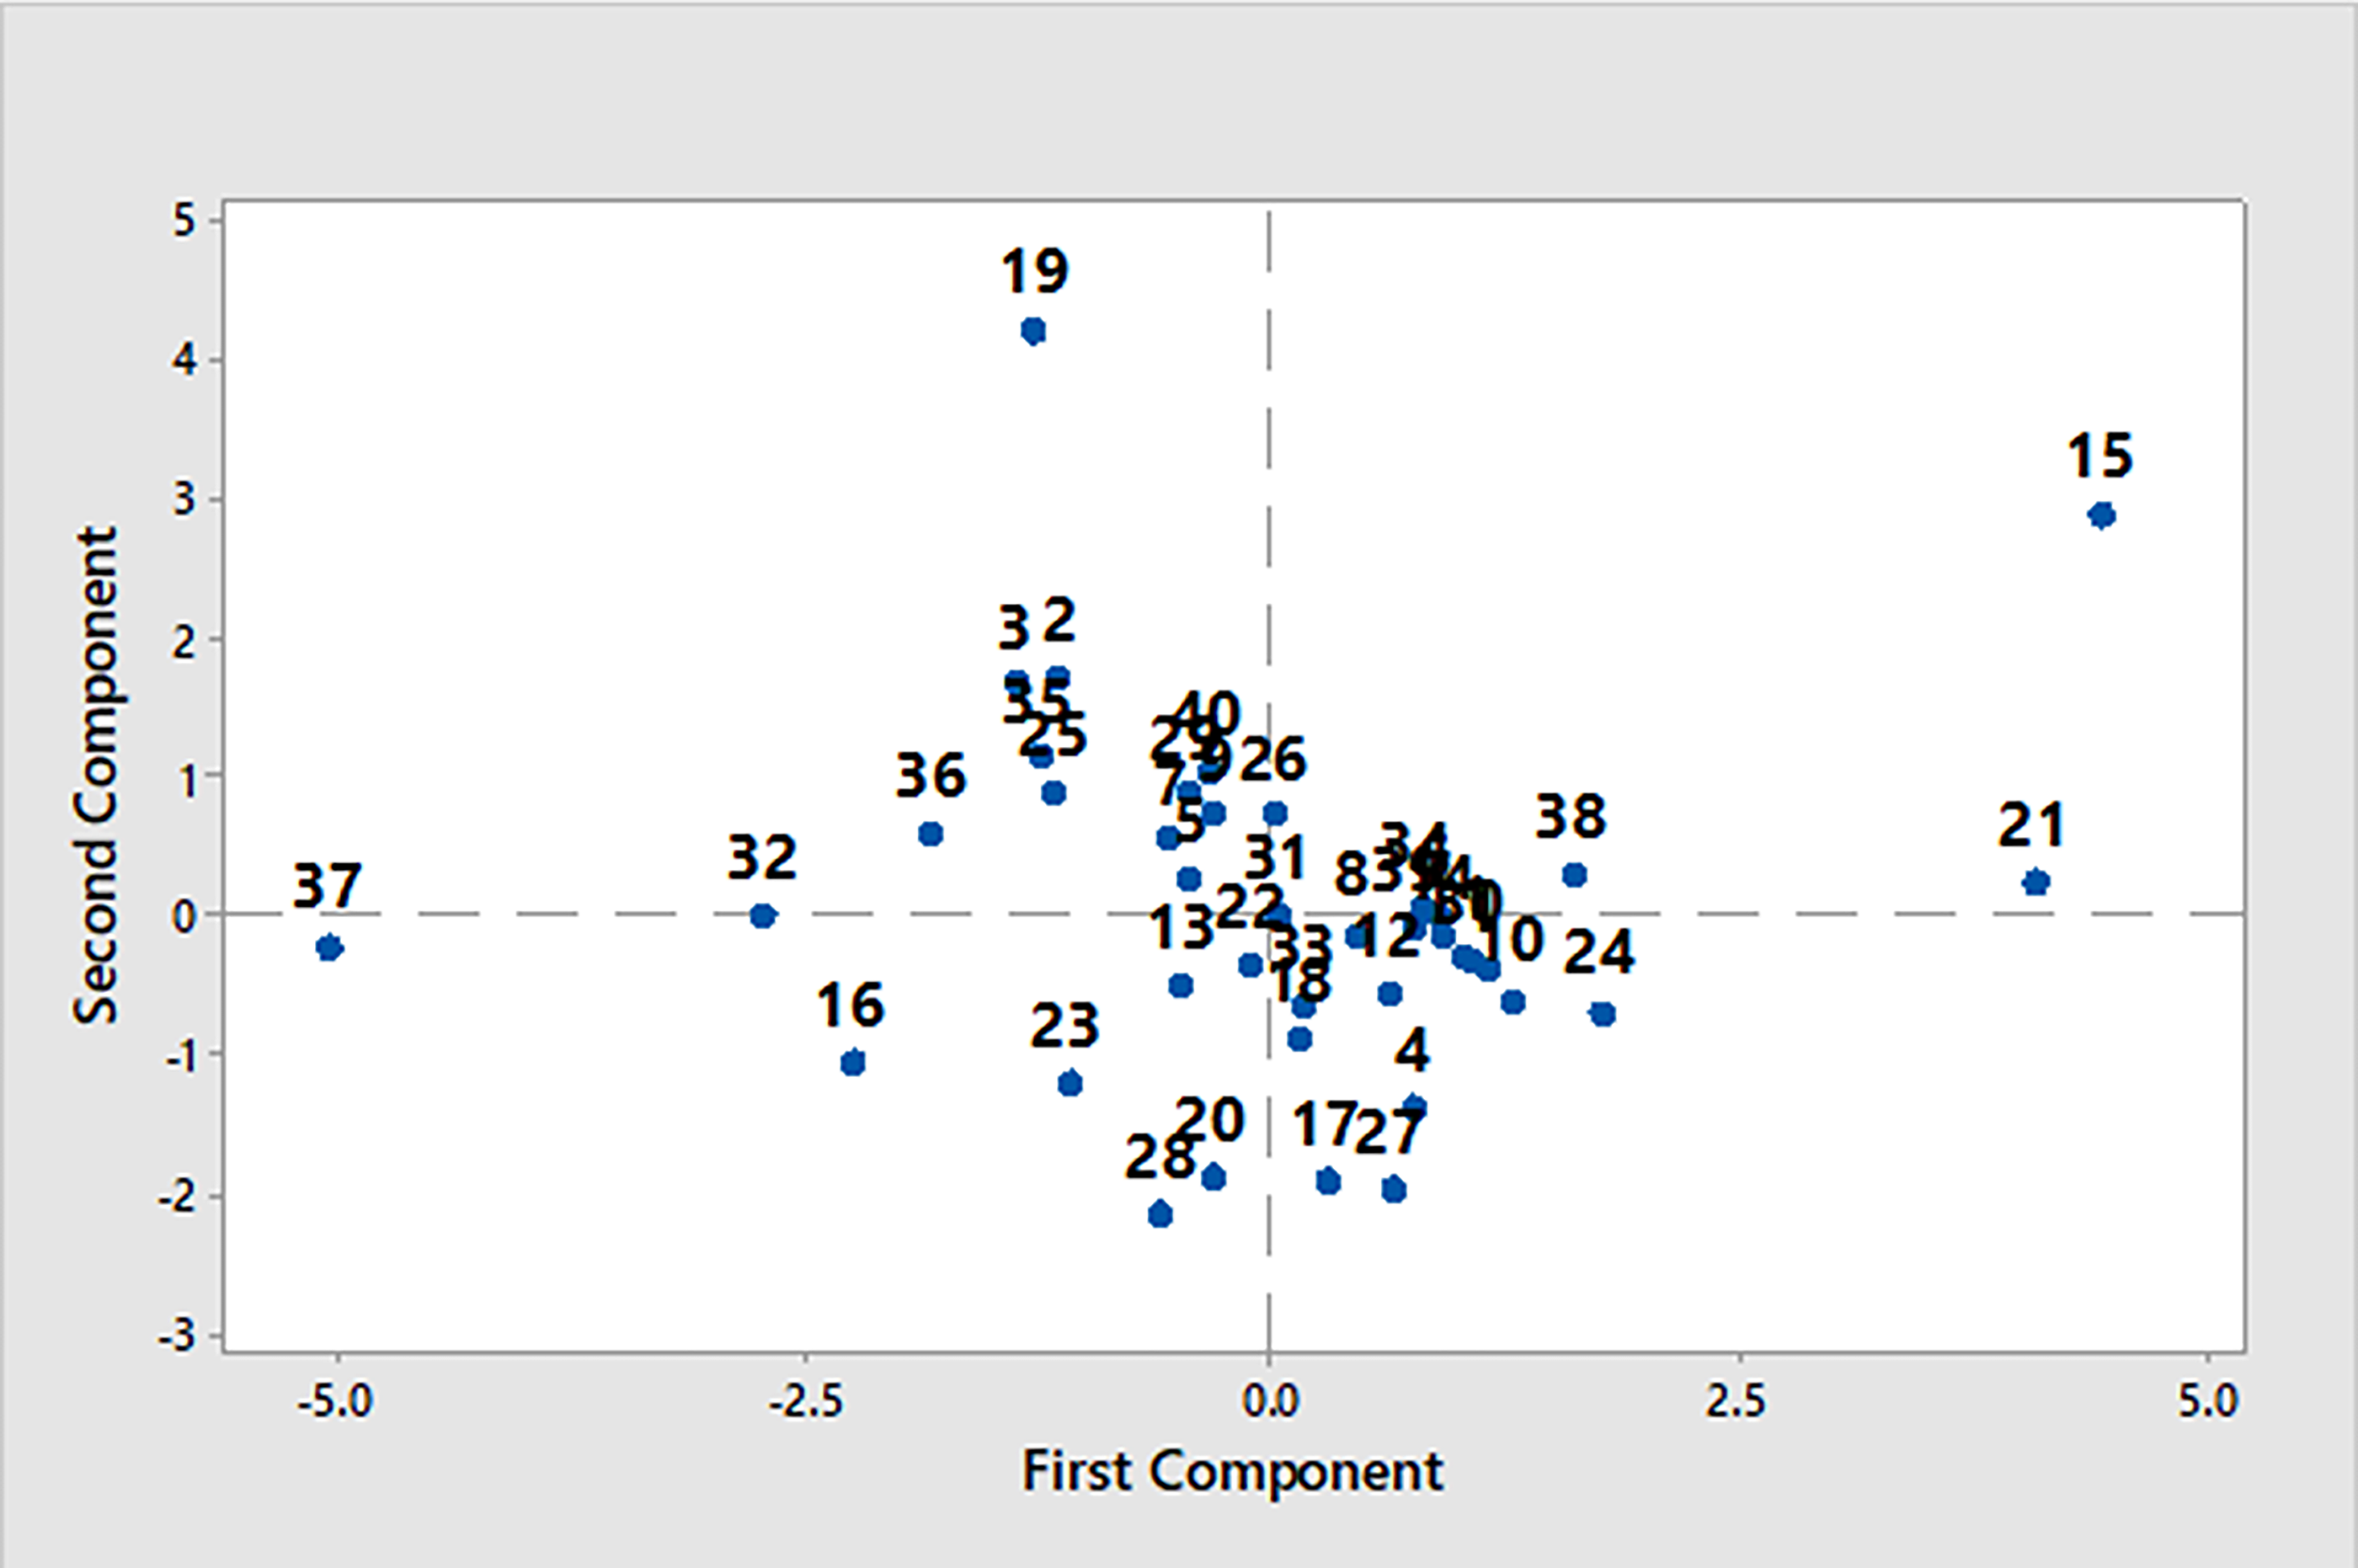
Scores plot showing a comparison of SDWA violations for the different Native American communities.
Bringing Native Americans into a sustainable development context is urgent to avoid serious health and sociopolitical impacts, not only for Native American peoples but for the U.S. more broadly. 36 From an SDG 6 perspective, these socioeconomic gradients highlight the structural inequities that undermine progress toward global water targets in the United States context. SDG 6 emphasizes both water quality (6.1, 6.3) and governance equity (6.b), yet tribal communities face systemic obstacles such as limited political leverage, reduced access to state/federal investment streams, and regulatory frameworks that do not incorporate SDG principles. These limitations illustrate why the United States continues to face challenges in domestically achieving SDG 6, despite its economic capacity.
Hierarchical Cluster Analysis (Fig. 8) supported these results, grouping MHI and %FPL with population, while linking violations with poverty. Education was weakly related, indicating structural barriers rather than individual attainment driving disparities.
Dendrogram showing relationships among different variables on SDWA violations for Native American communities.
GAIA analysis (Fig. 9) identified the Mescalero Apache Tribe, Jicarilla Apache Nation, and Cochiti Pueblo as most impacted per capita. This highlights how intersecting socioeconomic disadvantages and community size elevate risk. Together, the multivariate analyses show that violations are patterned by structural inequities, not random variation. Recognizing these interdependencies is essential for designing policy interventions addressing both infrastructure and socioeconomic vulnerabilities.
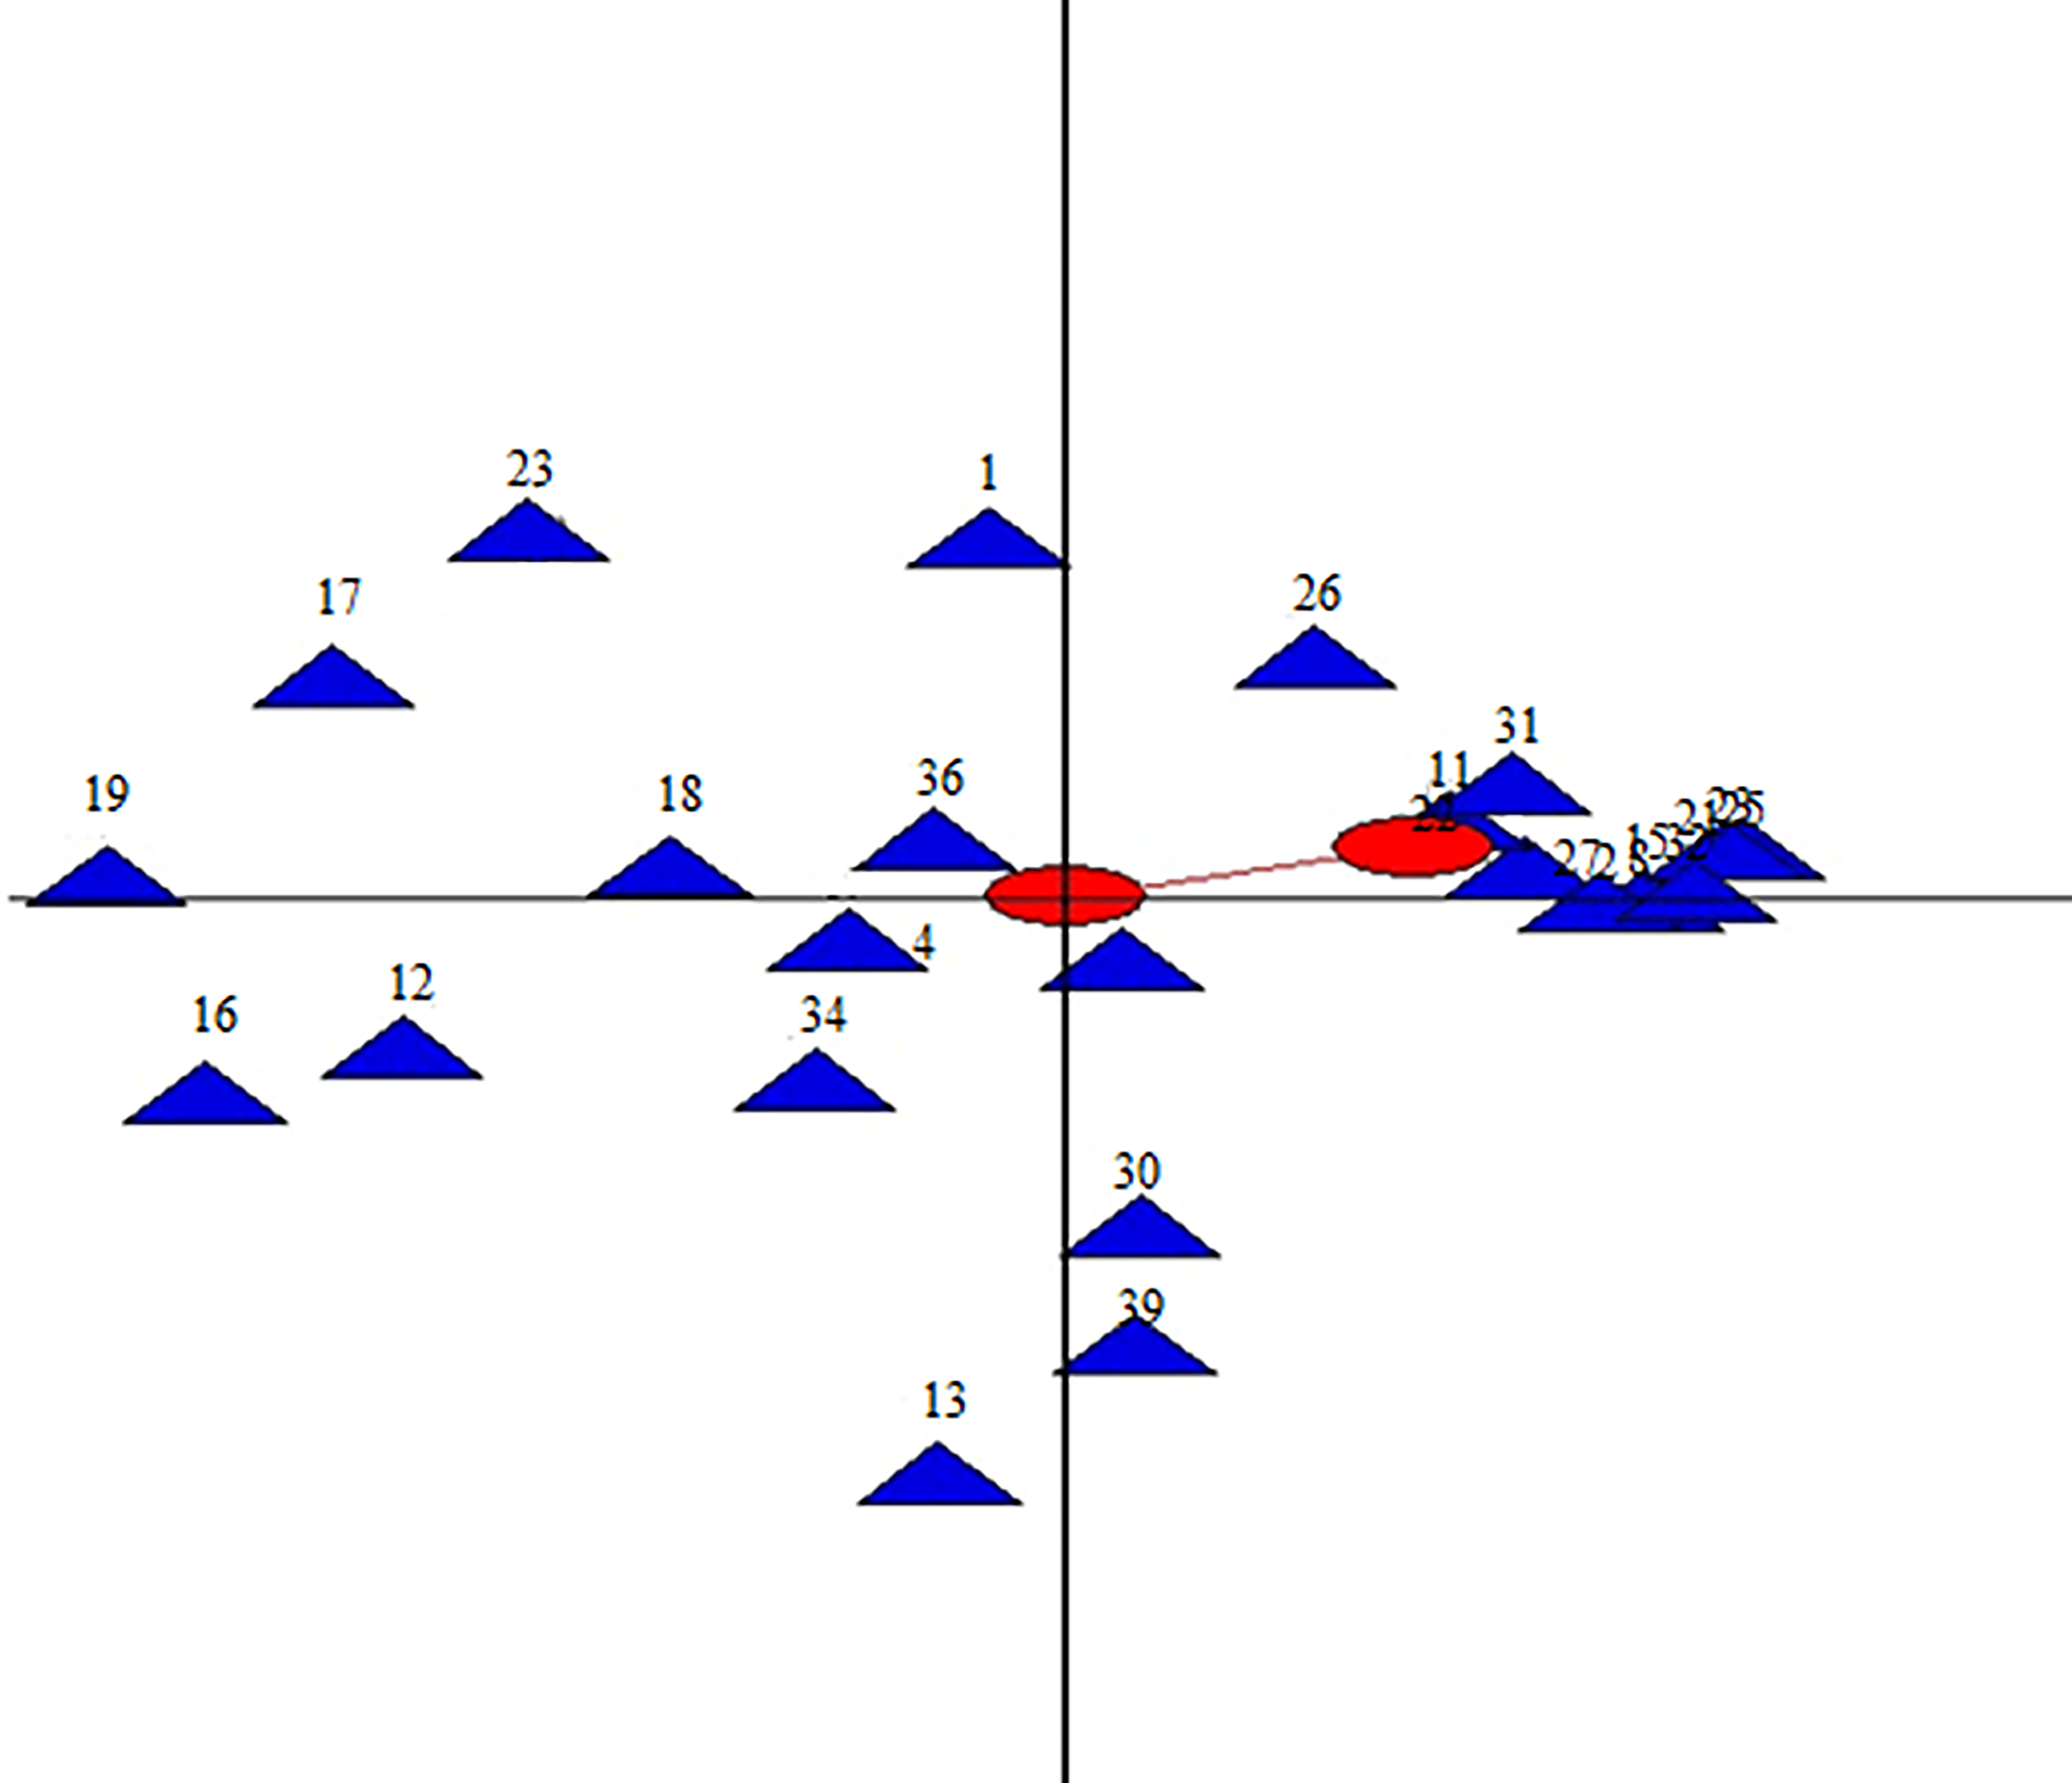
GAIA analysis for native American communities as a function of SDWA violations.
CONCLUSIONS
This study provides a comprehensive multivariate assessment of how socioeconomic and demographic factors shape disparities in compliance with the SDWA across Native American communities. By integrating correlation, PCA, cluster, and GAIA analyses, the findings show that SDWA violations are systematically patterned by structural inequities rather than occurring randomly. Smaller communities and those with lower median household incomes or higher poverty rates bear disproportionately higher burdens of violations, while larger nations benefit from economies of scale and stronger institutional capacity.
Beyond confirming previous evidence of systemic disparities, the analyses provide new quantitative insight into how economic vulnerability interacts with community size to exacerbate water insecurity. Education levels, by contrast, appear less influential, highlighting that structural barriers—such as underinvestment in infrastructure, fragmented governance, and limited political leverage—rather than individual social capital are the main determinants of safe water access. These results reveal how entrenched inequities in infrastructure investment and regulatory oversight perpetuate environmental injustice for Native American nations.
From a policy perspective, the findings underscore the urgent need for targeted federal and state interventions that consider both community size and socioeconomic context when allocating resources for drinking water infrastructure. Approaches limited to technical compliance are inadequate, as addressing violations requires systemic investment that strengthens tribal utilities, enhances political leverage, and embeds equity into governance frameworks. Advancing drinking water equity for Native American communities is thus not only a matter of public health but also of environmental justice and social sustainability for the United States.
Framing these results within the context of SDG 6, particularly targets 6.1 (universal access to safe and affordable drinking water) and 6.b (strengthening community participation in water governance), clarifies their broader significance. Persistent gaps across the four states highlight structural and political challenges the United States faces in domestically aligning with SDG 6, including fragmented governance, insufficient funding mechanisms, and limited integration of global water-equity principles into national regulatory frameworks. By situating U.S. tribal water disparities within the SDG 6 framework, this study emphasizes that achieving water security and equity requires both infrastructural investment and governance reform, reinforcing the global importance of addressing water injustice even in high-income countries.
In summary, the results illustrate that water insecurity in Native American Nations is a multidimensional problem driven by structural inequities. Meaningful progress toward SDG 6 demands integrated solutions that combine infrastructure, governance capacity, and socio-political empowerment, ensuring that all communities—regardless of size or economic status—can achieve safe and equitable access to water.
AUTHORS’ CONTRIBUTIONS
E.R.B.: Conceptualization, writing—original draft, and writing—review and editing. G.A.: Formal analysis, software, and writing—original draft. A.G.: Visualization, writing—review and editing.
Footnotes
ACKNOWLEDGMENTS
This article is based on work supported by the General Frederick West Lander Endowment as administered by the Division of Earth and Ecosystem Sciences at the Desert Research Institute.