
Abstract
Introduction:
The Justice40 initiative was introduced in 2021 to ensure that at least 40% of U.S. federal investments for environmental, energy, housing, and workforce development initiatives are allocated to disadvantaged communities. The Climate and Economic Justice Screening Tool (CEJST) was developed to define disadvantaged communities to meet this goal. However, dichotomous community classification (disadvantaged vs. not) overlooks broad differences in community type, need, and depth of burdens.
Methods:
The authors conducted an assessment of the CEJST dataset within the contiguous United States to identify distinct profiles of community risk and spatial clustering. They assessed the extent of variation of demographic, environmental, and health disparities by comparing quartiles of the total number of Justice40 burden threshold criteria met in each U.S. census tract. The authors then conducted a principal component analysis to identify spatially co-occurring burdens and demographics across urban and rural Justice40 communities.
Results:
At least one Justice40 threshold burden criteria was met by 25,714 census tracts. There were distinct, spatially clustered groupings of community risks centered on eight individual or co-occurring components of socioeconomics, health and minority statuses, environmental burdens, age structures, and climate vulnerabilities. Urban and rural groupings were generally similar but differed by distribution across the United States.
Discussion:
Although Justice40 may not continue, federal funding to benefit burdened and climate-vulnerable communities should be focused on areas with the greatest need. With the authors’ nationwide findings, subsequent local approaches can be tailored to spatial groupings of co-occurring community characteristics and burdens. Data-driven resource delivery in collaboration with disadvantaged communities could enhance the benefits of future investments.
INTRODUCTION
Funds for addressing environmental hazards and climate risks are increasing globally, with an emerging goal to ensure that these funds reach the members of society with the greatest need. The U.S. 2021 Justice40 Initiative (J40) specifies that ≥40% of new U.S. investments in climate change, clean energy, affordable housing, workforce development, remediation and reduction of pollution, and clean water must flow to disadvantaged communities. 1 As of November 2023, there were approximately 510 J40-linked programs. 2 Through direct presidential administration, over $352 billion in U.S. federal funding has been linked to J40.3,4 Approximately $113 billion of this is through the Inflation Reduction Act, in which many programs are subject to J40 guidelines. 5 Furthermore, the recent Bipartisan Infrastructure Law invested over $239 billion into environmental justice (EJ) programs linked to J40. 6 At least 40% of the total funding was allocated to disadvantaged communities, with many programs allocating much more. 7 Although there is no clear total accounting of expenditures currently and likely to be allocated over historical norms, most of this funding has been irrevocably awarded as of December 2024. Thus, J40-linked investments are expected to be at historical levels and oriented toward addressing many longstanding societal, health, and environmental inequities, including up to $220 billion in climate-related benefits by 2030 alone. 8
To help federal agencies meet the J40 goal, a Climate and Economic Justice Screening Tool (CEJST) was developed by the White House Council on Environmental Quality (CEQ) to clearly identify disadvantaged J40 communities across the United States at a census tract scale based on environmental, health, demographic, and economic burdens. 9 By taking a geographic “area-level” approach to identify disadvantaged communities, the CJEST aims to ensure that J40-linked investments are indeed funneled to those most in need. 10 But the tool uses a dichotomous “disadvantaged or not” classification for many different types and extents of disadvantage across widely varied community contexts. As such, the undifferentiated J40 designation of disadvantage must necessarily be the start (not the end) of resource prioritization. Currently, the CJEST identifies 25,714 populated census tracts (34.7%) within the contiguous United States as J40 disadvantaged. These tracts are distributed across every state and encompass an extensive range of demographics, races, ethnicities, cultures, economics, health burdens, environmental conditions, and susceptibilities to climate change.
Designation and terminology for J40 community identification as disadvantaged have been a point of contention. 11 Past research has found that this public, federal designation can increase the stigma surrounding EJ and promote the view of the area as undesirable, which has negative economic and social impacts. 12 The Biden Administration uses terminology including “disadvantaged,” “marginalized,” and “overburdened and underserved” to refer to communities highlighted in the CEJST dataset and the term “burden” for the relevant challenges faced and also as criteria for “disadvantaged” J40 community designation. Some scholars have encouraged the federal government to use terms with less negative connotations, such as “priority community” or “EJ community.” 13
The J40 designation of disadvantaged communities has also been critiqued for its exclusion of race as a burdening factor, despite race being the strongest predictor of environmental hazards and other harms.14,15 One study predicted that reductions of emissions in J40 communities may reduce exposure disparities between income groups but not necessarily between race and ethnicity groups. 16 In addition, CEJST does not aggregate co-occurring burdens nor their types and extents.17,18 As such, others have called for a CEJST feature that accounts for the cumulative burdens each community experiences to display those with the highest need so that funding can be prioritized to the most overburdened communities.19,20
Although CEJST has already been used to designate communities for billions of dollars in investments, little publicly available evidence exists to understand the extent or variation to which resources are being allocated to overburdened and underinvested communities. Because of the concurrent allocation and implementation of these funds, there has been an unmet need for actionable information regarding the extent, co-occurring typologies, and spatial distribution of need among J40 communities. With the current dichotomous classification of disadvantaged status, the nature and depth of disadvantage may be overlooked by many top-down approaches to identifying places for interventions, especially when allocations and designs are made exclusively by community outsiders. Research and tools to facilitate comprehensive needs-based assessments, focused allocations of funding, and holistic design of interventions are needed. Meanwhile, interventions already awarded will proceed, regardless of evidence to optimize allocations and implementation or to minimize unintended harms and waste.
This work seeks to inform better distribution of investments by evaluating trends in demographics and burdens in J40-disadvantaged communities across the United States using the CEJST. The two study goals are (1) to characterize disparities in burden across communities classified as disadvantaged and (2) to identify distinct co-occurring groupings of burdens and demographics and their distribution across the United States. Although the future of Justice40 and CEJST is uncertain, there is a continuing need for evidence-based approaches to distribute resources to communities with the most relevant needs. Timelines are uncertain, but future iterations or predecessors to CEJST are likely. Thus, the authors used the CEJST dataset with the addition of key excluded community demographics to evaluate these research goals and inform future tools for the evaluation of cumulative burdens.
METHODS
Study context
The analysis was restricted to the contiguous United States, including the lower 48 states plus the District of Columbia. This was done because of high rates of missingness for key variables (e.g., PM2.5, flood risk) in the CEJST v1.0 dataset for tracts outside of the contiguous United States. To align with J40 and employ specifically related terminology, the authors mirrored J40 and CEJST language referring to “disadvantage” and “burden” throughout the analysis and discussion.
Data sources
The authors used the CEJST (version 1.0, 2022) from the CEQ for sociodemographic, environmental, health, climate, and related data on equity and burdens.21,22 The tool is a geospatial map and an underlying dataset that illustrates the burdens disadvantaged or marginalized communities face. CEJST also marks Federally Recognized Tribal areas and Alaska Native Villages as disadvantaged. These data are presented in percentiles within the tract boundaries from the 2010 census. Census tracts commonly have around 4000 people, with wide variation. Tracts are identified as disadvantaged by the CEJST v1.0, if they (1) meet the threshold for at least one of the tool’s categories of burden (eight categories in total: climate change, energy, health, housing, legacy pollution, transportation, water and wastewater, and workforce development) and corresponding economic indicator (income or education) or (2) are on the lands of a Federally Recognized Tribe. 23 In this study, the authors retrieved additional sociodemographic data from the 2015–2019 U.S. Census American Community Survey (ACS) to temporally align with CEJST data sources (e.g., 2015–2019 Centers for Disease Control & Prevention PLACES dataset) because CEJST omits race, ethnicity (independent of race), median household income, and the share of renters (representing distinct elements of socioeconomic status and living conditions beyond poverty).24,25 The authors merged these census data with the CEJST dataset using the common tract identifiers of both ACS and CEJST. For all analyses, only the continental 48 states of the United States are included due to substantially different spatial patterns and context among outlying areas. They also removed tracts from the analysis that did not have any permanent residents listed in the CEJST dataset, leaving a total of 72,529 tracts eligible for analysis.
Analysis of CEJST quartiles
The authors divided the census tracts into quartiles of burden level by ensuring each quartile had relatively equal population sizes. This resulted in the following divisions: Quartile 1 (Q1) was composed of tracts meeting/exceeding exactly one CEJST burden threshold (population = 23,749,157; 23.0% of the total CEJST population); Q2 meeting/exceeding two or three burdens (population = 30,769,113; 29.8%); Q3 meeting/exceeding four to six burdens (population = 27,769,175; 26.9%); and Q4 meeting/exceeding seven burdens (population = 21,123,320; 20.4%). For each included CEJST variable, the authors used one-way ANOVA (Analysis of Variance) to test for differences among category means. They then developed an ordinary kriging model to spatially interpolate the total number of threshold criteria of all tracts in the continental United States, resulting in a visual representation of the depth of cumulative burdens.
Principal component grouping analysis
Next, the authors conducted a principal component analysis (PCA) to develop groupings of co-occurring burdens and demographics. Among all tracts, they first excluded other CEJST variables that were binary, percentiles, and those that did not have values for at least 60,000 tracts (e.g., wastewater discharge). To prevent bias in the PCA, they also omitted 13,461 tracts from the overall dataset that had missing values for one or more variables of interest (e.g., life expectancy). To test for consistency between the full dataset and tracts with only complete records, the authors conducted a sensitivity analysis by comparing the quartiles of the full dataset used in the quartile analysis with the equivalent calculations on the PCA dataset that was narrowed to only tracts with complete data. After exclusion of 5044 tracts classified as disadvantaged due to missing data, 20,670 tracts with complete records met one or more threshold criteria for the PCA analysis. Because of well-documented distinctions between urban and rural settings regarding socioeconomic status and burden, the authors separated urban and rural J40-disadvantaged tracts for PCA. They classified 13,904 tracts as urban based on their Rural-Urban Commuting Area classification code of 1, defined as “Metropolitan area core: primary flow within an urbanized area.” 26 Although substantial heterogeneity exists across the urban-rural transect, the authors classified all other eligible disadvantaged tracts, n = 6766, as rural to ensure sufficient sample size and prevent systematic biases introduced by further stratification. They then conducted the PCA on both urban and rural J40-disadvantaged tracts using the psych package in R (v 4.3.2). For the PCA, the authors used a varimax rotation to improve the interpretability of the results.27,28
Principal component spatial clustering analysis
The authors connected the rotated principal component scores (further referred to as grouping scores) with the spatial point centroid location of 2010 census tracts in ArcGIS Pro (v 3.1.3), aligning with the census geoidentifiers in the CEJST. To test for significant spatial clustering of each factor among urban and rural tracts, the authors used Getis-Ord Gi* hotspot analysis tool in ArcGIS Pro, with the Euclidean distance method and a fixed-distance band. The tool calculates and outputs Gi* @@@statistic with a corresponding z-score and p-value. There is also an output field of confidence levels for hot (positive) and cold (negative) spots. To visualize the spatial trends in significant clusters of each grouping, the authors then used simple, ordinary, universal, and empirical Bayesian kriging models to spatially interpolate tract-level z-score results from the hotspot analysis.
RESULTS
Demographics, environments, and health of burdened communities
The authors found progressively higher levels of burdens, lower socioeconomic statuses, and higher shares of minority residents in tracts meeting higher numbers of J40 burden thresholds. They found that the differences between the mean of each group were highly significant (p < 0.001) for all variables. The most burdened tracts (J40Q4) had higher shares of socioeconomically disadvantaged residents than non-J40 tracts or less-burdened tracts (J40 Q1–Q3). For example, J40Q4 had over twice the poverty rate and unemployment rate of Q1. Approximately half of residents living in these most burdened tracts (J40Q4) were Black or Hispanic, compared with 21% of Q1 (Table 1).
Demographics and Cumulative Burdens by Quartiles of CEJST Threshold Criteria
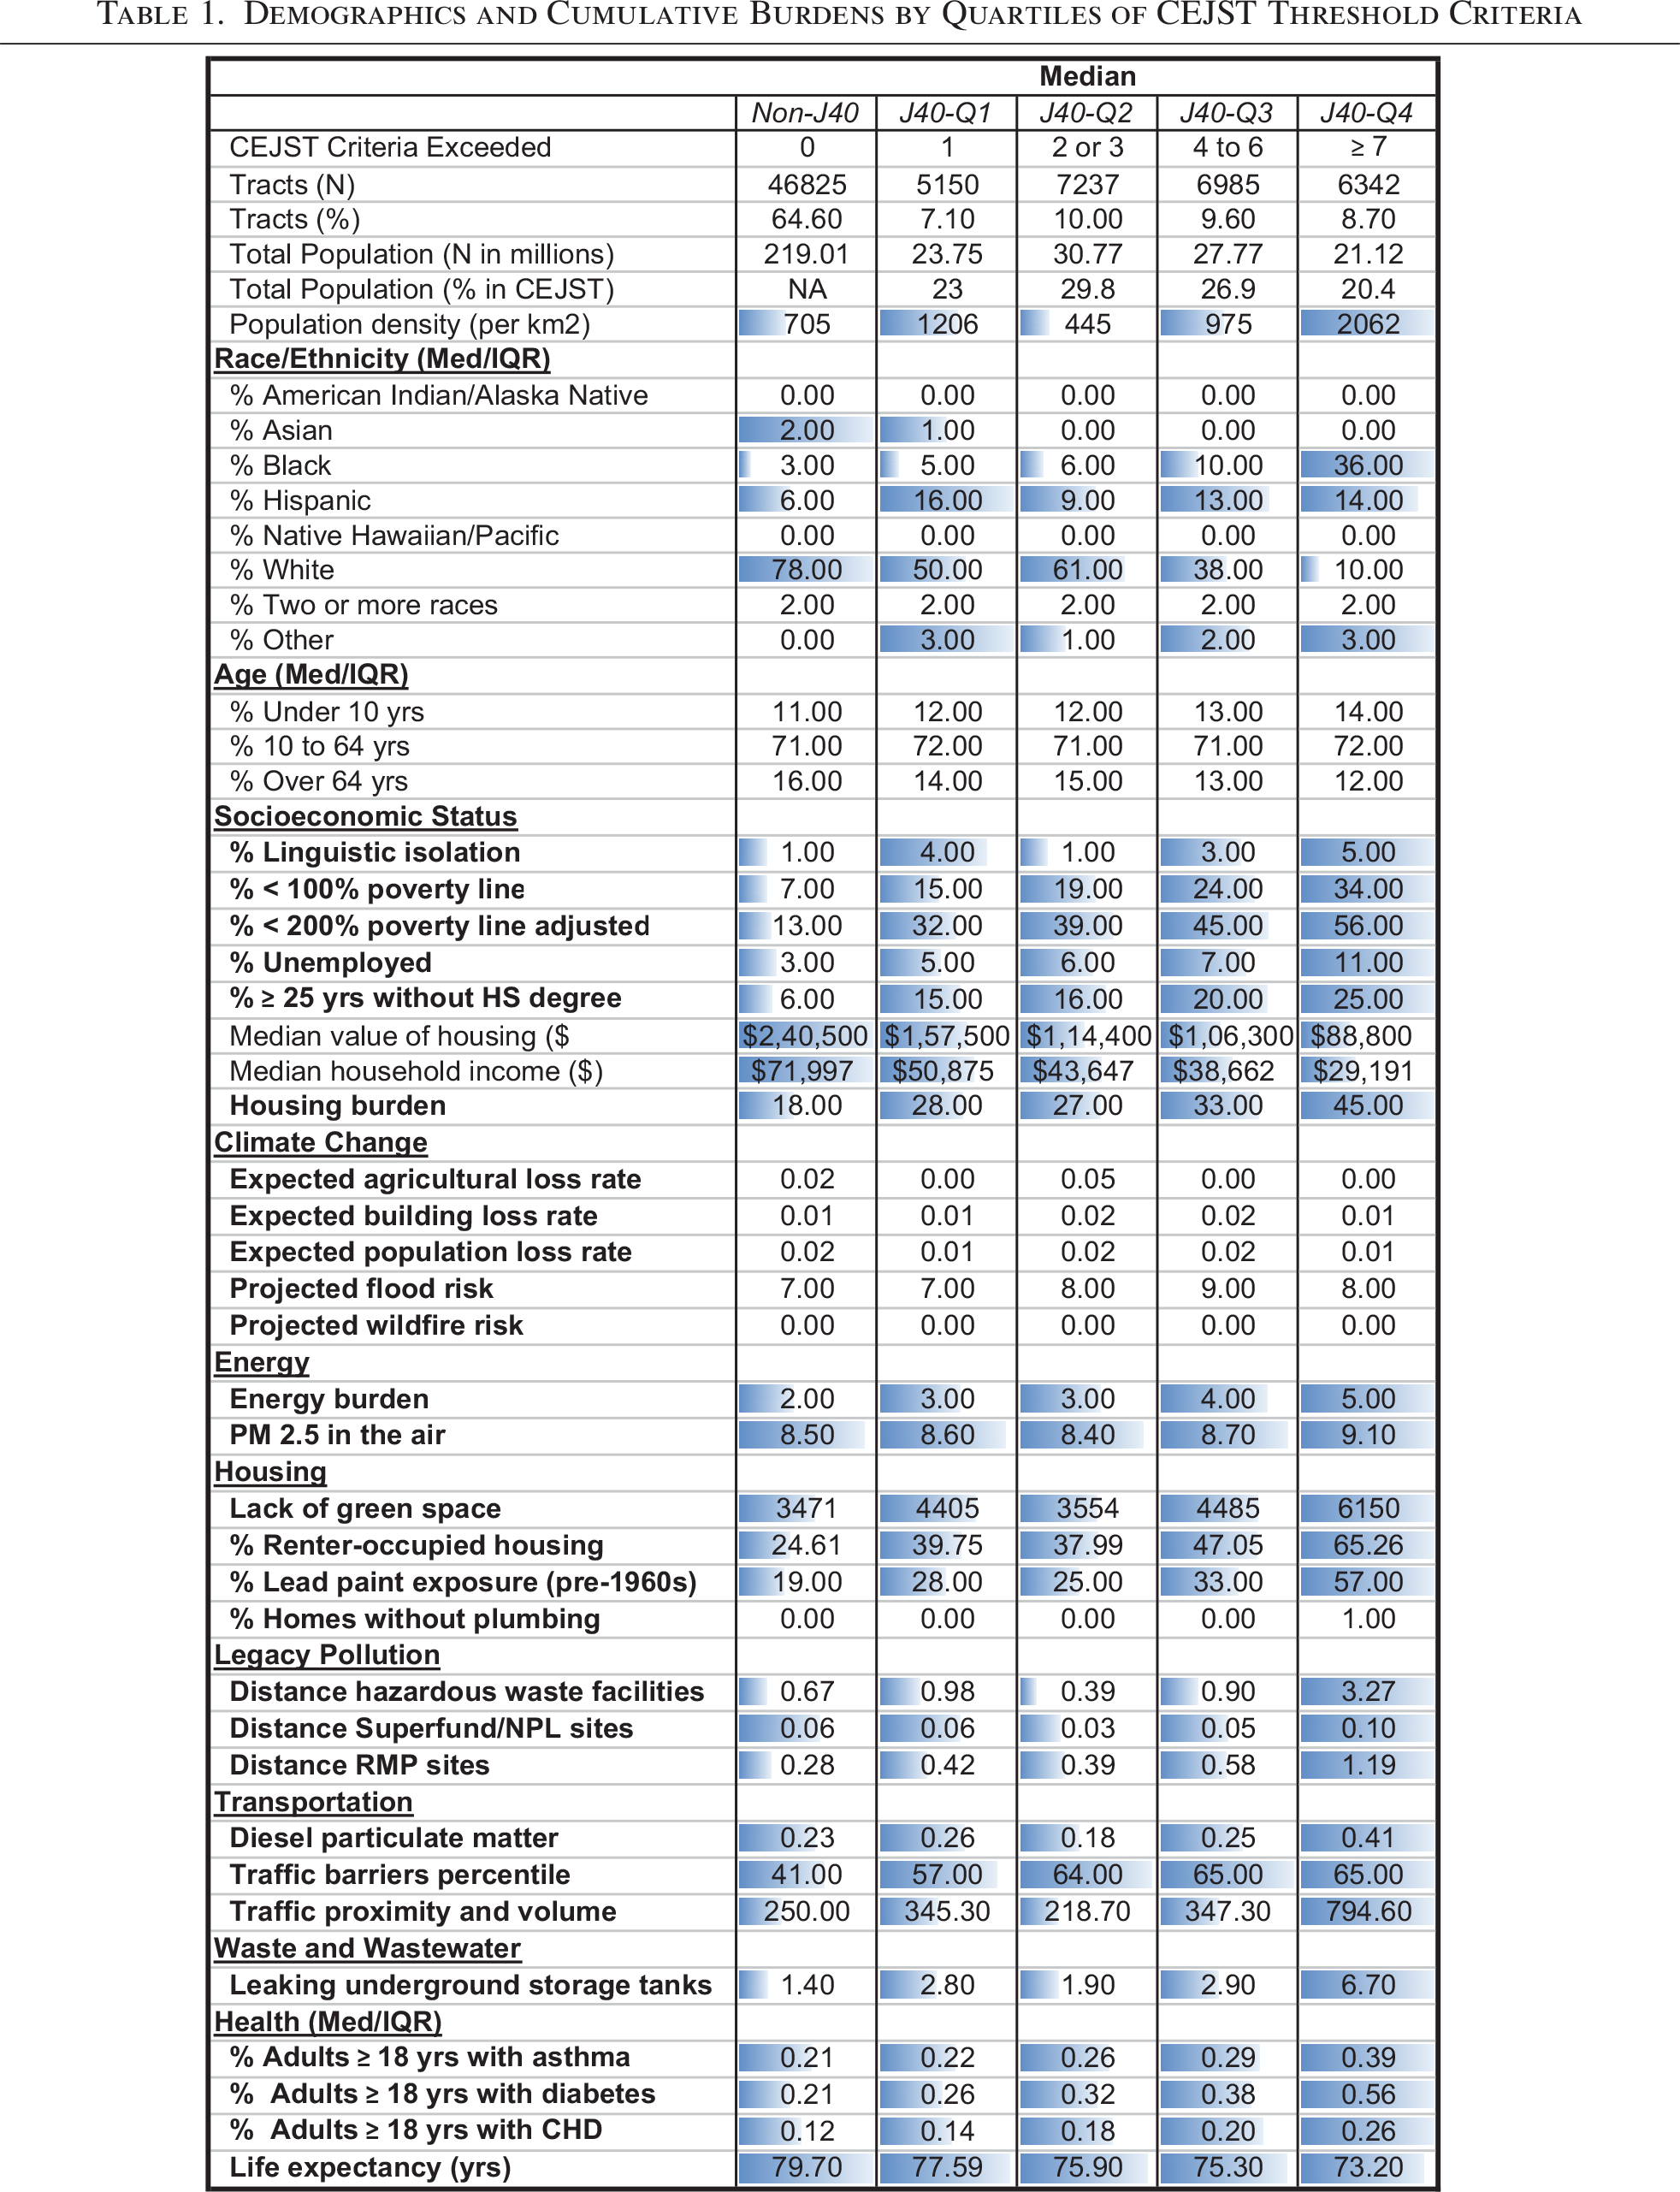
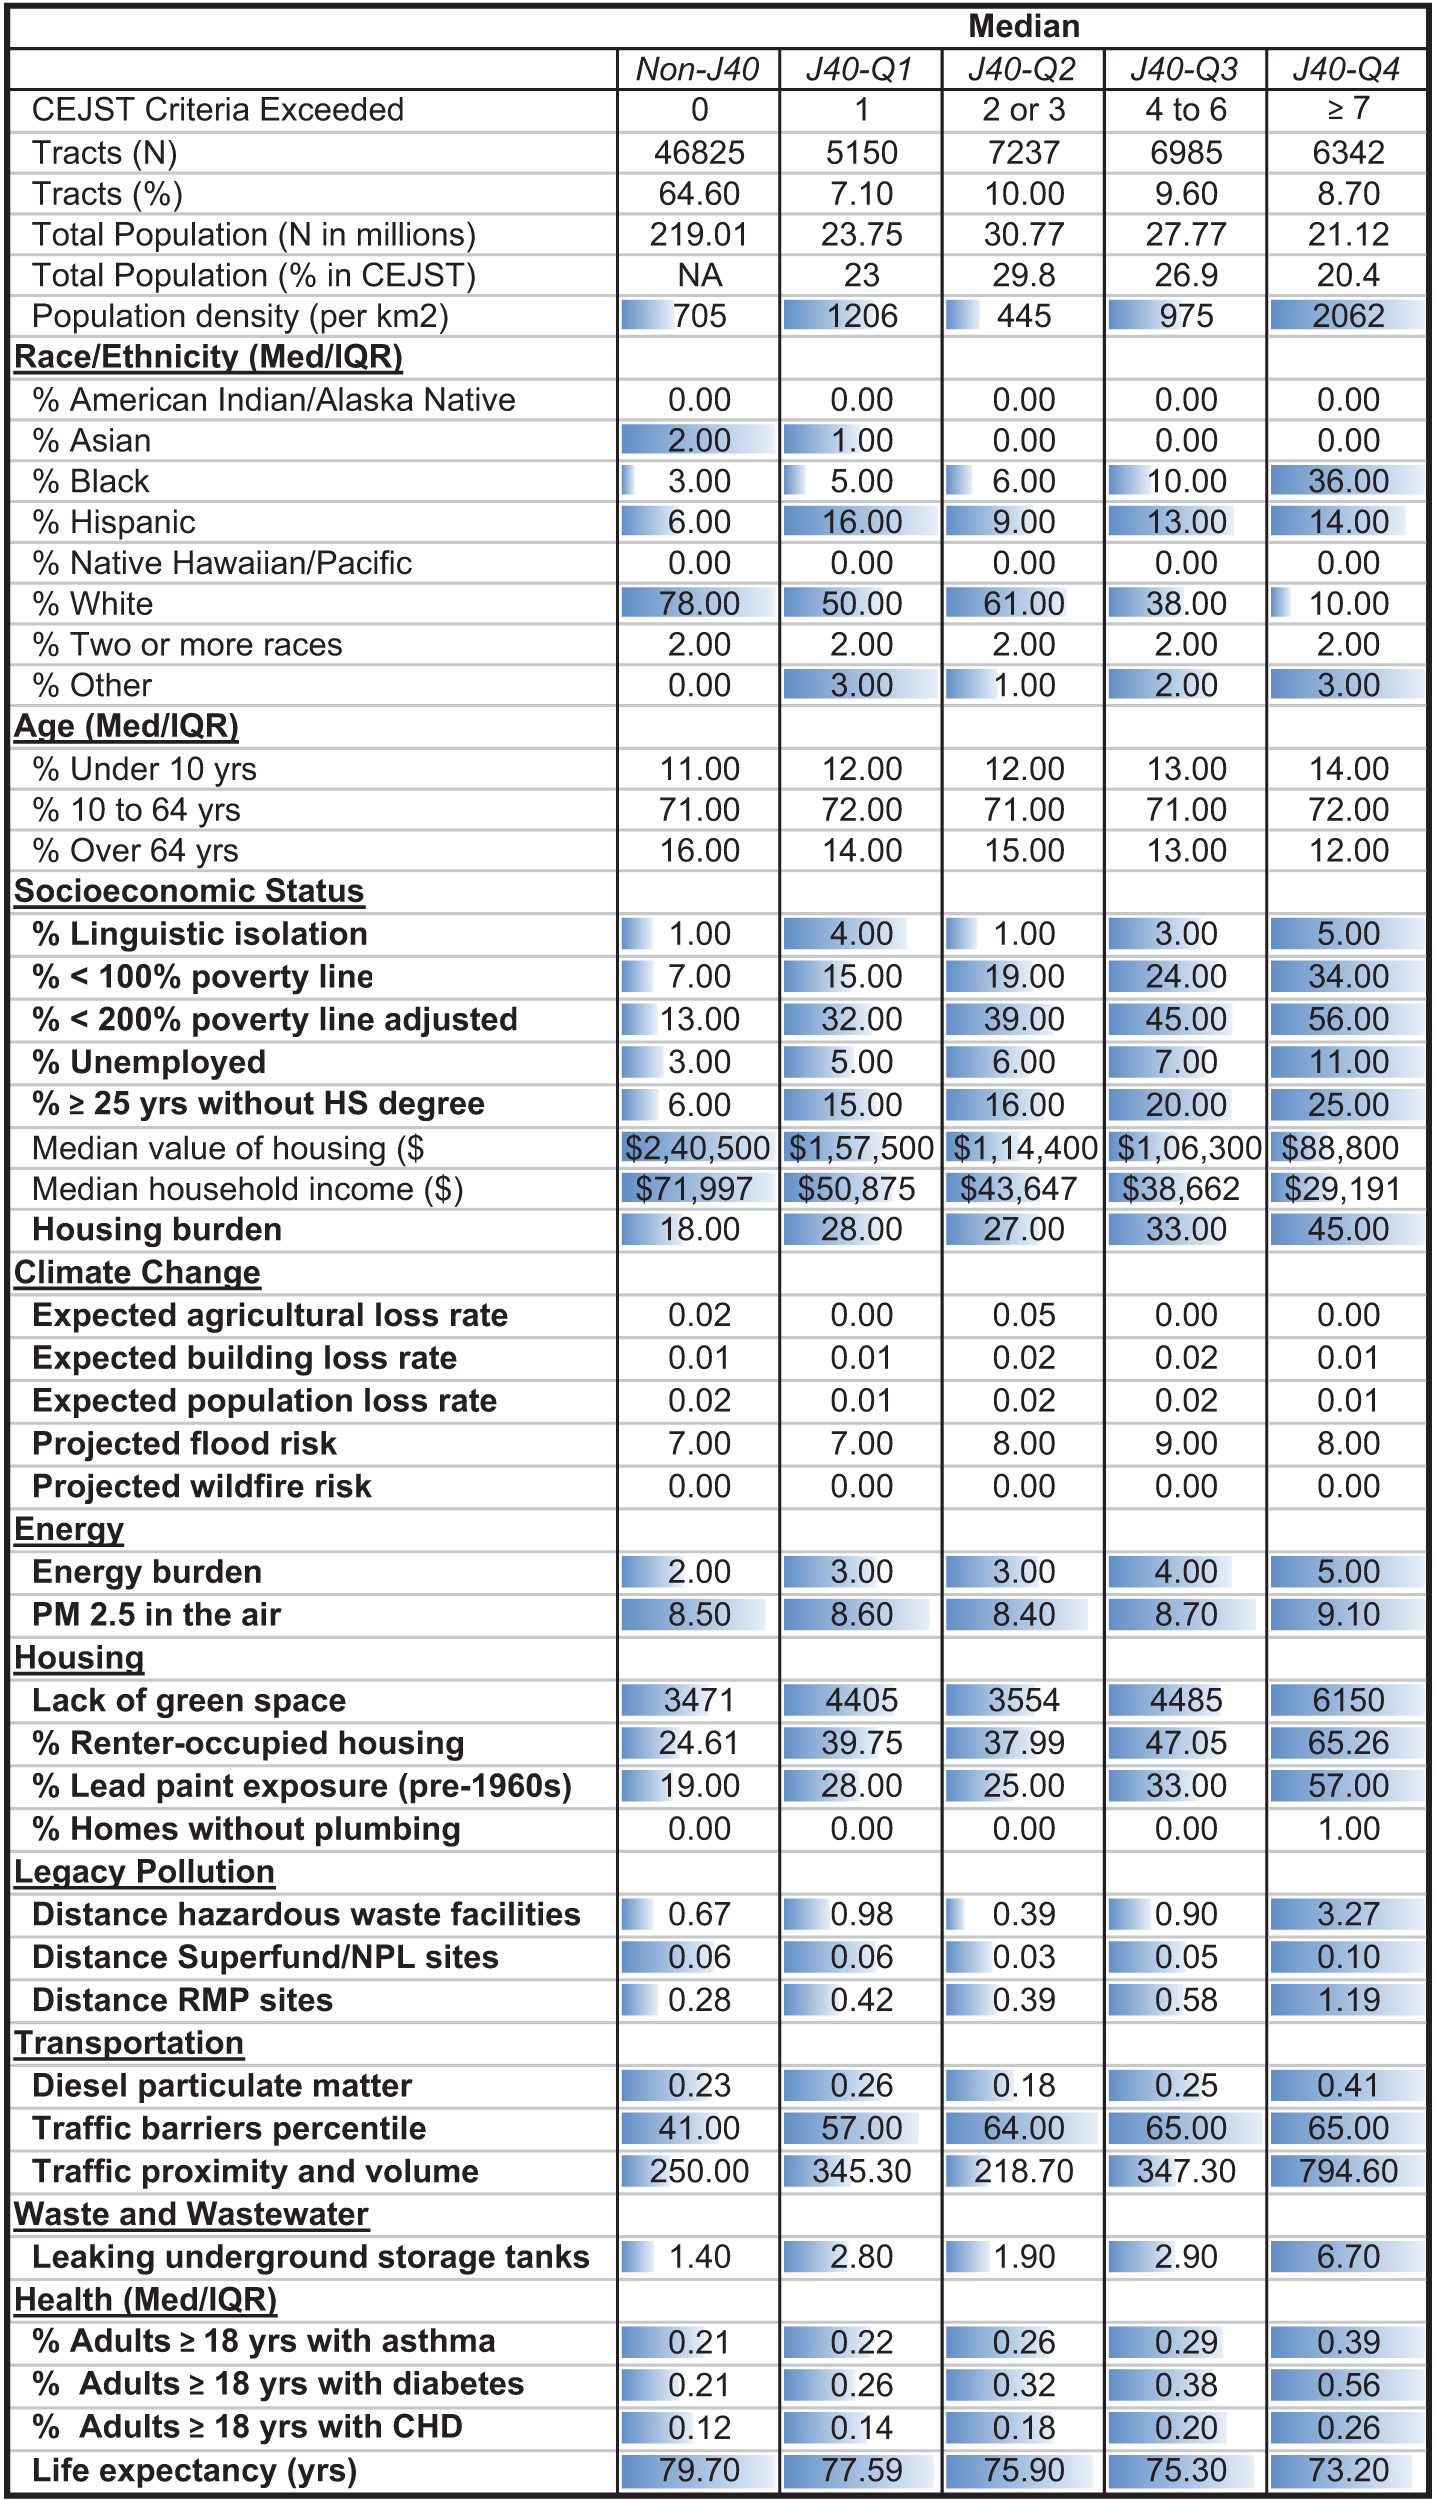
Data bars illustrate increasing or decreasing values across quartiles (n = 72,539). Cells containing the highest median value for each variable have the longest data bar. Percents represent shares of the population within each quartile. Variables that represent CEJST inclusion criteria are in bold.
CEJST, Climate and Economic Justice Screening Tool; NA, Not Applicable; IQR, Interquartile Range; CHD, coronary heart disease; HS, high school; J40, U.S. 2021 Justice40 Initiative; NPL, national priority list hazardous waste sites; PM2.5, particulate matter of a diameter under 2.5 microns; RMP, risk management plan facilities processing hazardous materials.
As with demographics, the authors found progressively higher shares of residents living in J40 tracts who were affected by environmental burdens. In the most burdened tracts (J40Q4) residents experienced higher energy burdens, levels of PM2.5, and travel barriers (67%, 6%, and 15% higher, respectively). These Q4 residents were also more likely to live near a hazardous waste facility, Risk Management Plan site, high traffic volume, and leaky underground storage tanks than Q1 residents (330%, 300%, 230%, and 240%, respectively). Moreover, residents living in the most burdened tracts (J40Q4) experienced higher rates of health burdens than those in non-J40 tracts or less burdened tracts. For example, asthma, coronary heart disease, and diabetes were more prevalent among adults in the most burdened Q4 tracts than burdened tracts of Q1 that met only one threshold criterion (24%, 49%, and 26% higher rates, respectively). Similarly, life expectancy was 4.8 years lower among the most burdened tracts than Q1 tracts that met one of the threshold criteria and 7 years lower than tracts that did not meet any threshold criteria (Table 1). The authors found little difference between these findings among the full set of tracts and the narrowed set of tracts with complete data (Supplementary Table S3).
Spatial clustering of cumulative burdens
When assessing spatial patterns of all tracts across the United States, the authors observed highly concentrated and spatially isolated extents of cumulative burdens. They found widespread areas of high disadvantage in the Southwest, South, and Appalachia, along with more isolated areas throughout the country. Many metropolitan cores contained high concentrations of cumulative burdens surrounded by low levels of burdens (Fig. 1).
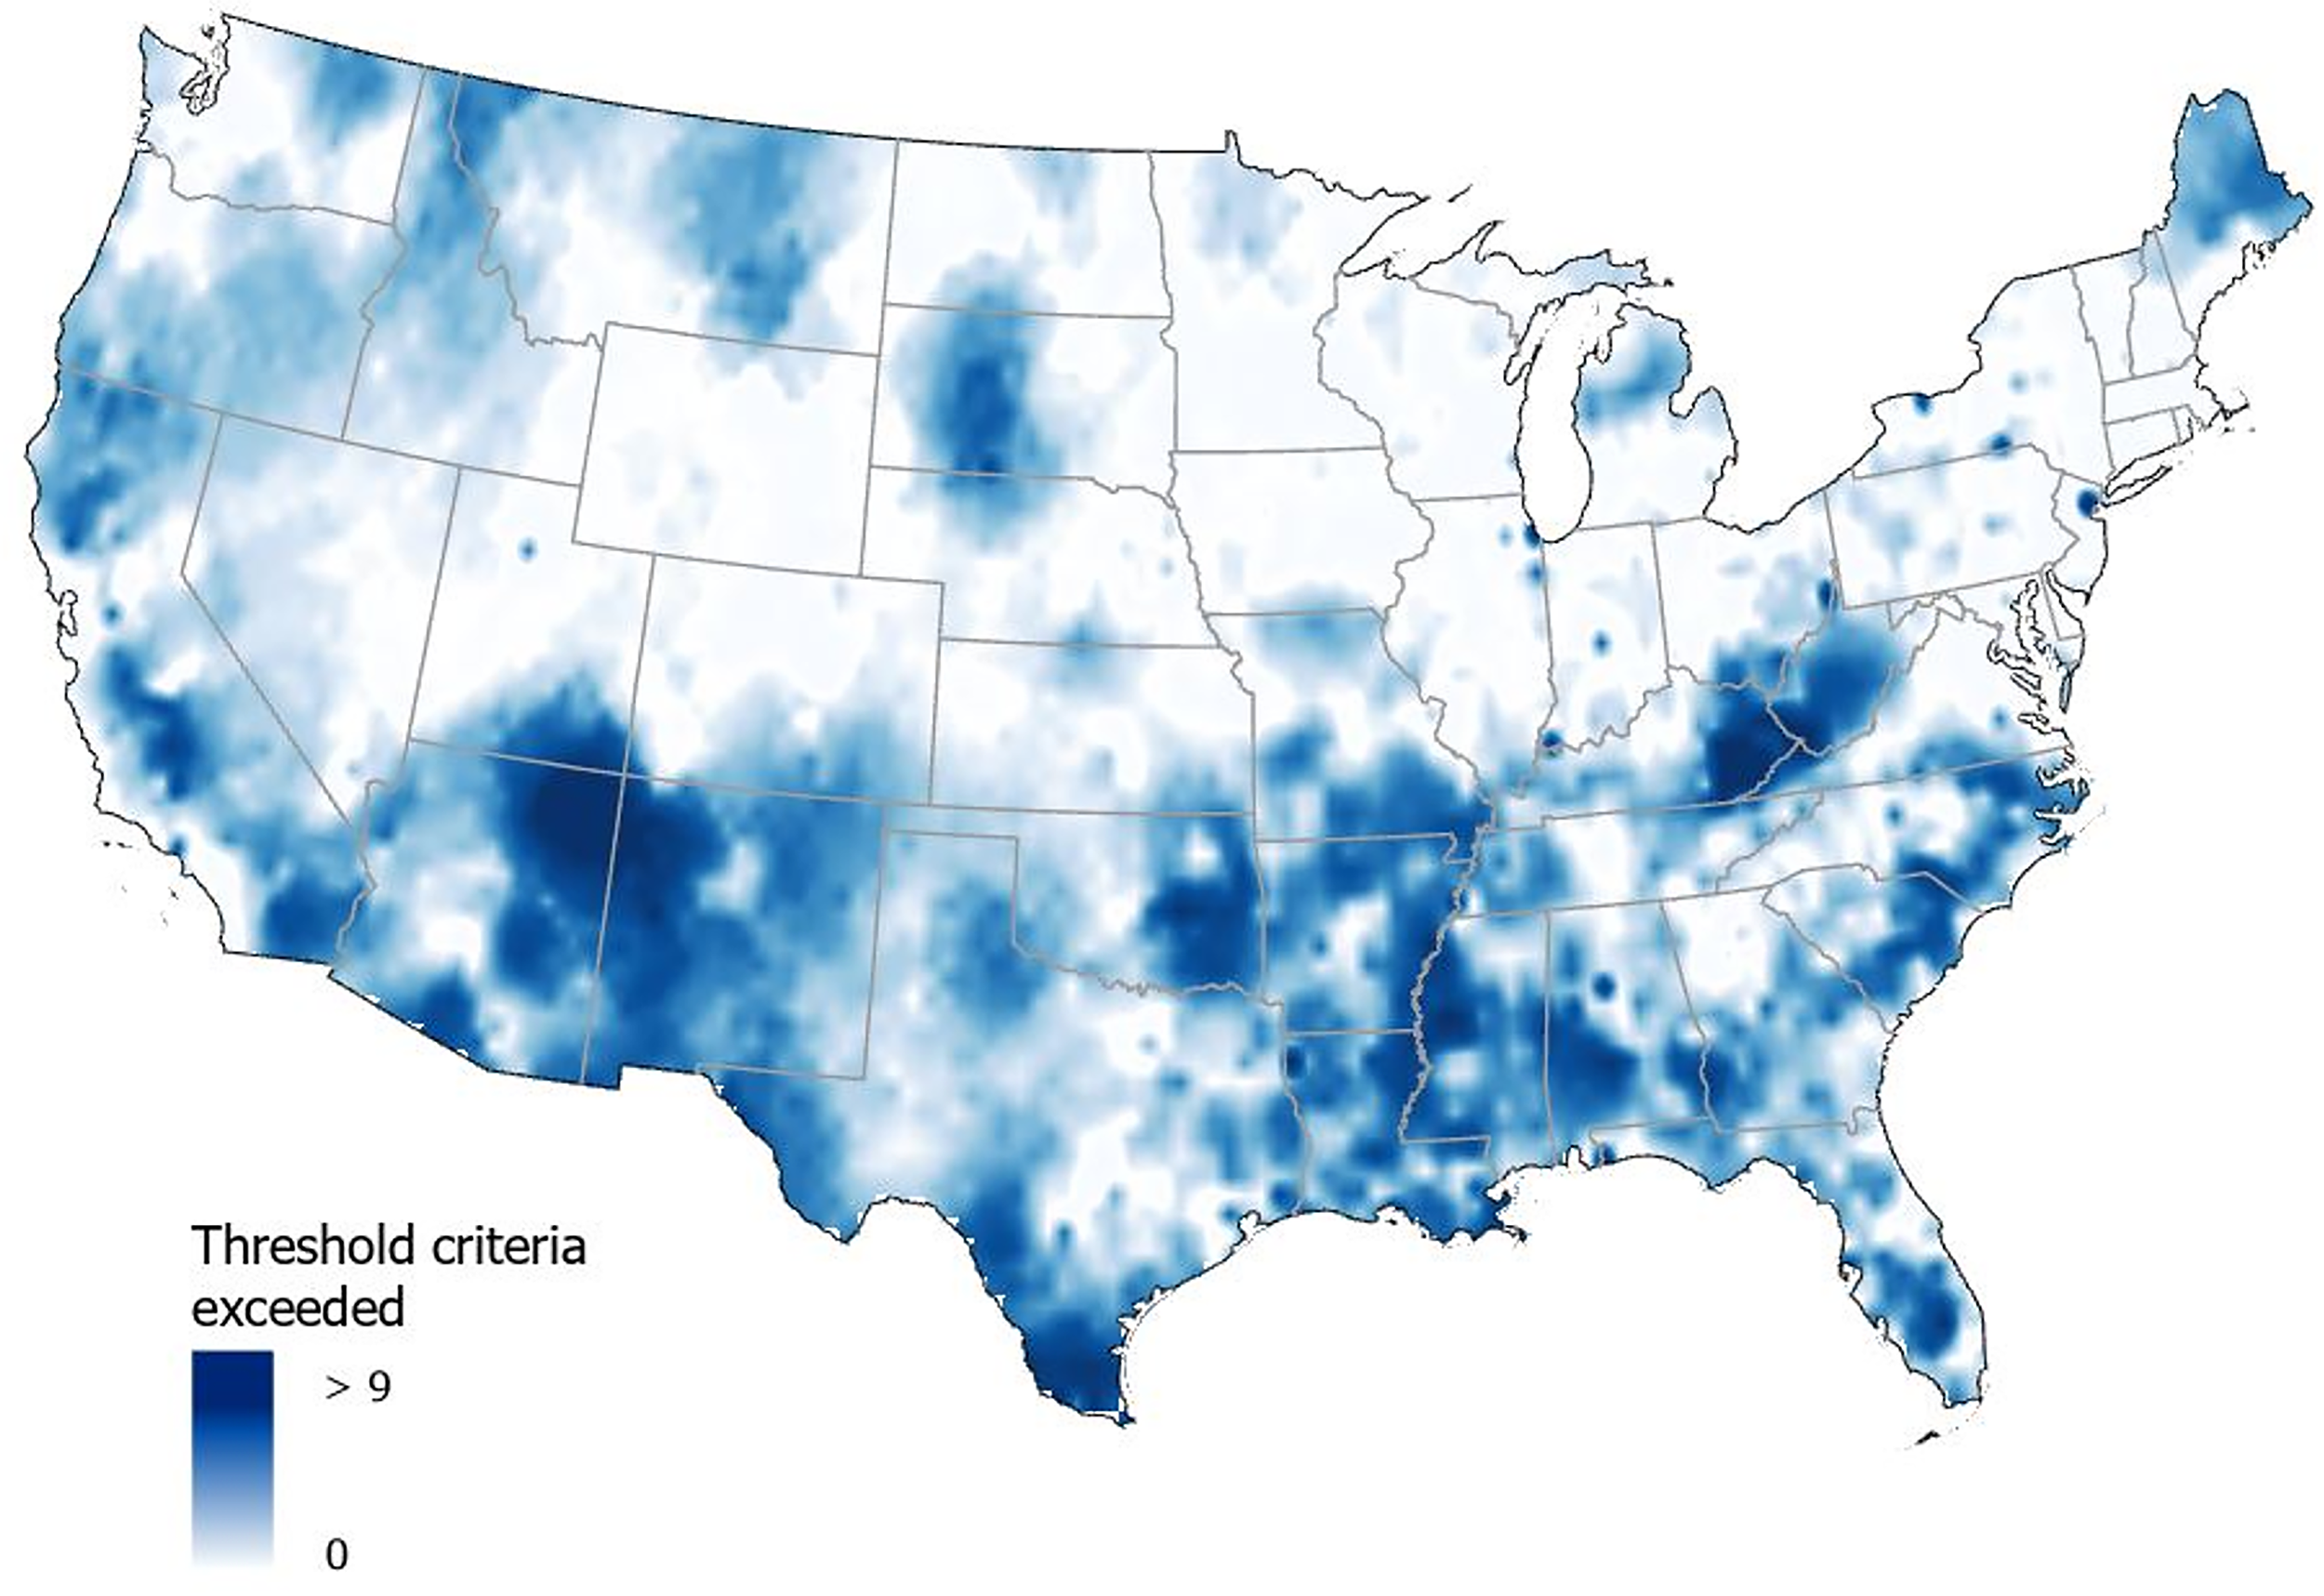
Spatial clustering of communities with increasing levels of burden. Threshold criteria exceeded refers to the number of CEJST criteria exceeded within a tract. Clusters of tracts with a high number of criteria exceeded were smoothed for visual clarity using spatial interpolation. Interpolated values were classified with the standard deviation method. Dark blue areas represent concentrations of tracts with the highest number of threshold criteria exceeded, whereas tracts in light blue areas exceeded a lower number of threshold criteria.
PCA of co-occurring burdens in urban and rural communities
Table 2 presents the burdens that co-occur in groupings of urban and rural communities. Variables are presented in the structure of the CEJST dataset for ease of interpretation: socioeconomic, health, race/ethnicity, age, climate, environment, and other. Grouping 1 in both urban and rural communities described tracts with similar levels of socioeconomic status and Black residents. Grouping 2 in urban areas and 3 in rural areas described communities with similar diesel particulate matter levels and socioeconomic statuses. Grouping 3 in urban areas and 4 in rural areas described communities with similar shares of Hispanics and residents over 25 without a high school degree. Grouping 4 in urban areas and 5 in rural areas described communities with a high percentage of residents over age 64. Grouping 5 in urban areas and 8 in rural areas described communities with similar combinations of climate-related burdens. Grouping 6 in urban areas and 2 in rural areas described communities with similar health statuses. Grouping 7 in urban areas and 6 in rural areas described communities with similar racial/ethnic compositions. Finally, grouping 8 in urban areas and 7 in rural areas described communities with similar racial/ethnic compositions as well as climate-related burdens.
Co-Occurring Burdens in Urban and Rural Communities Based on Principal Component Analysis Factor Loadings
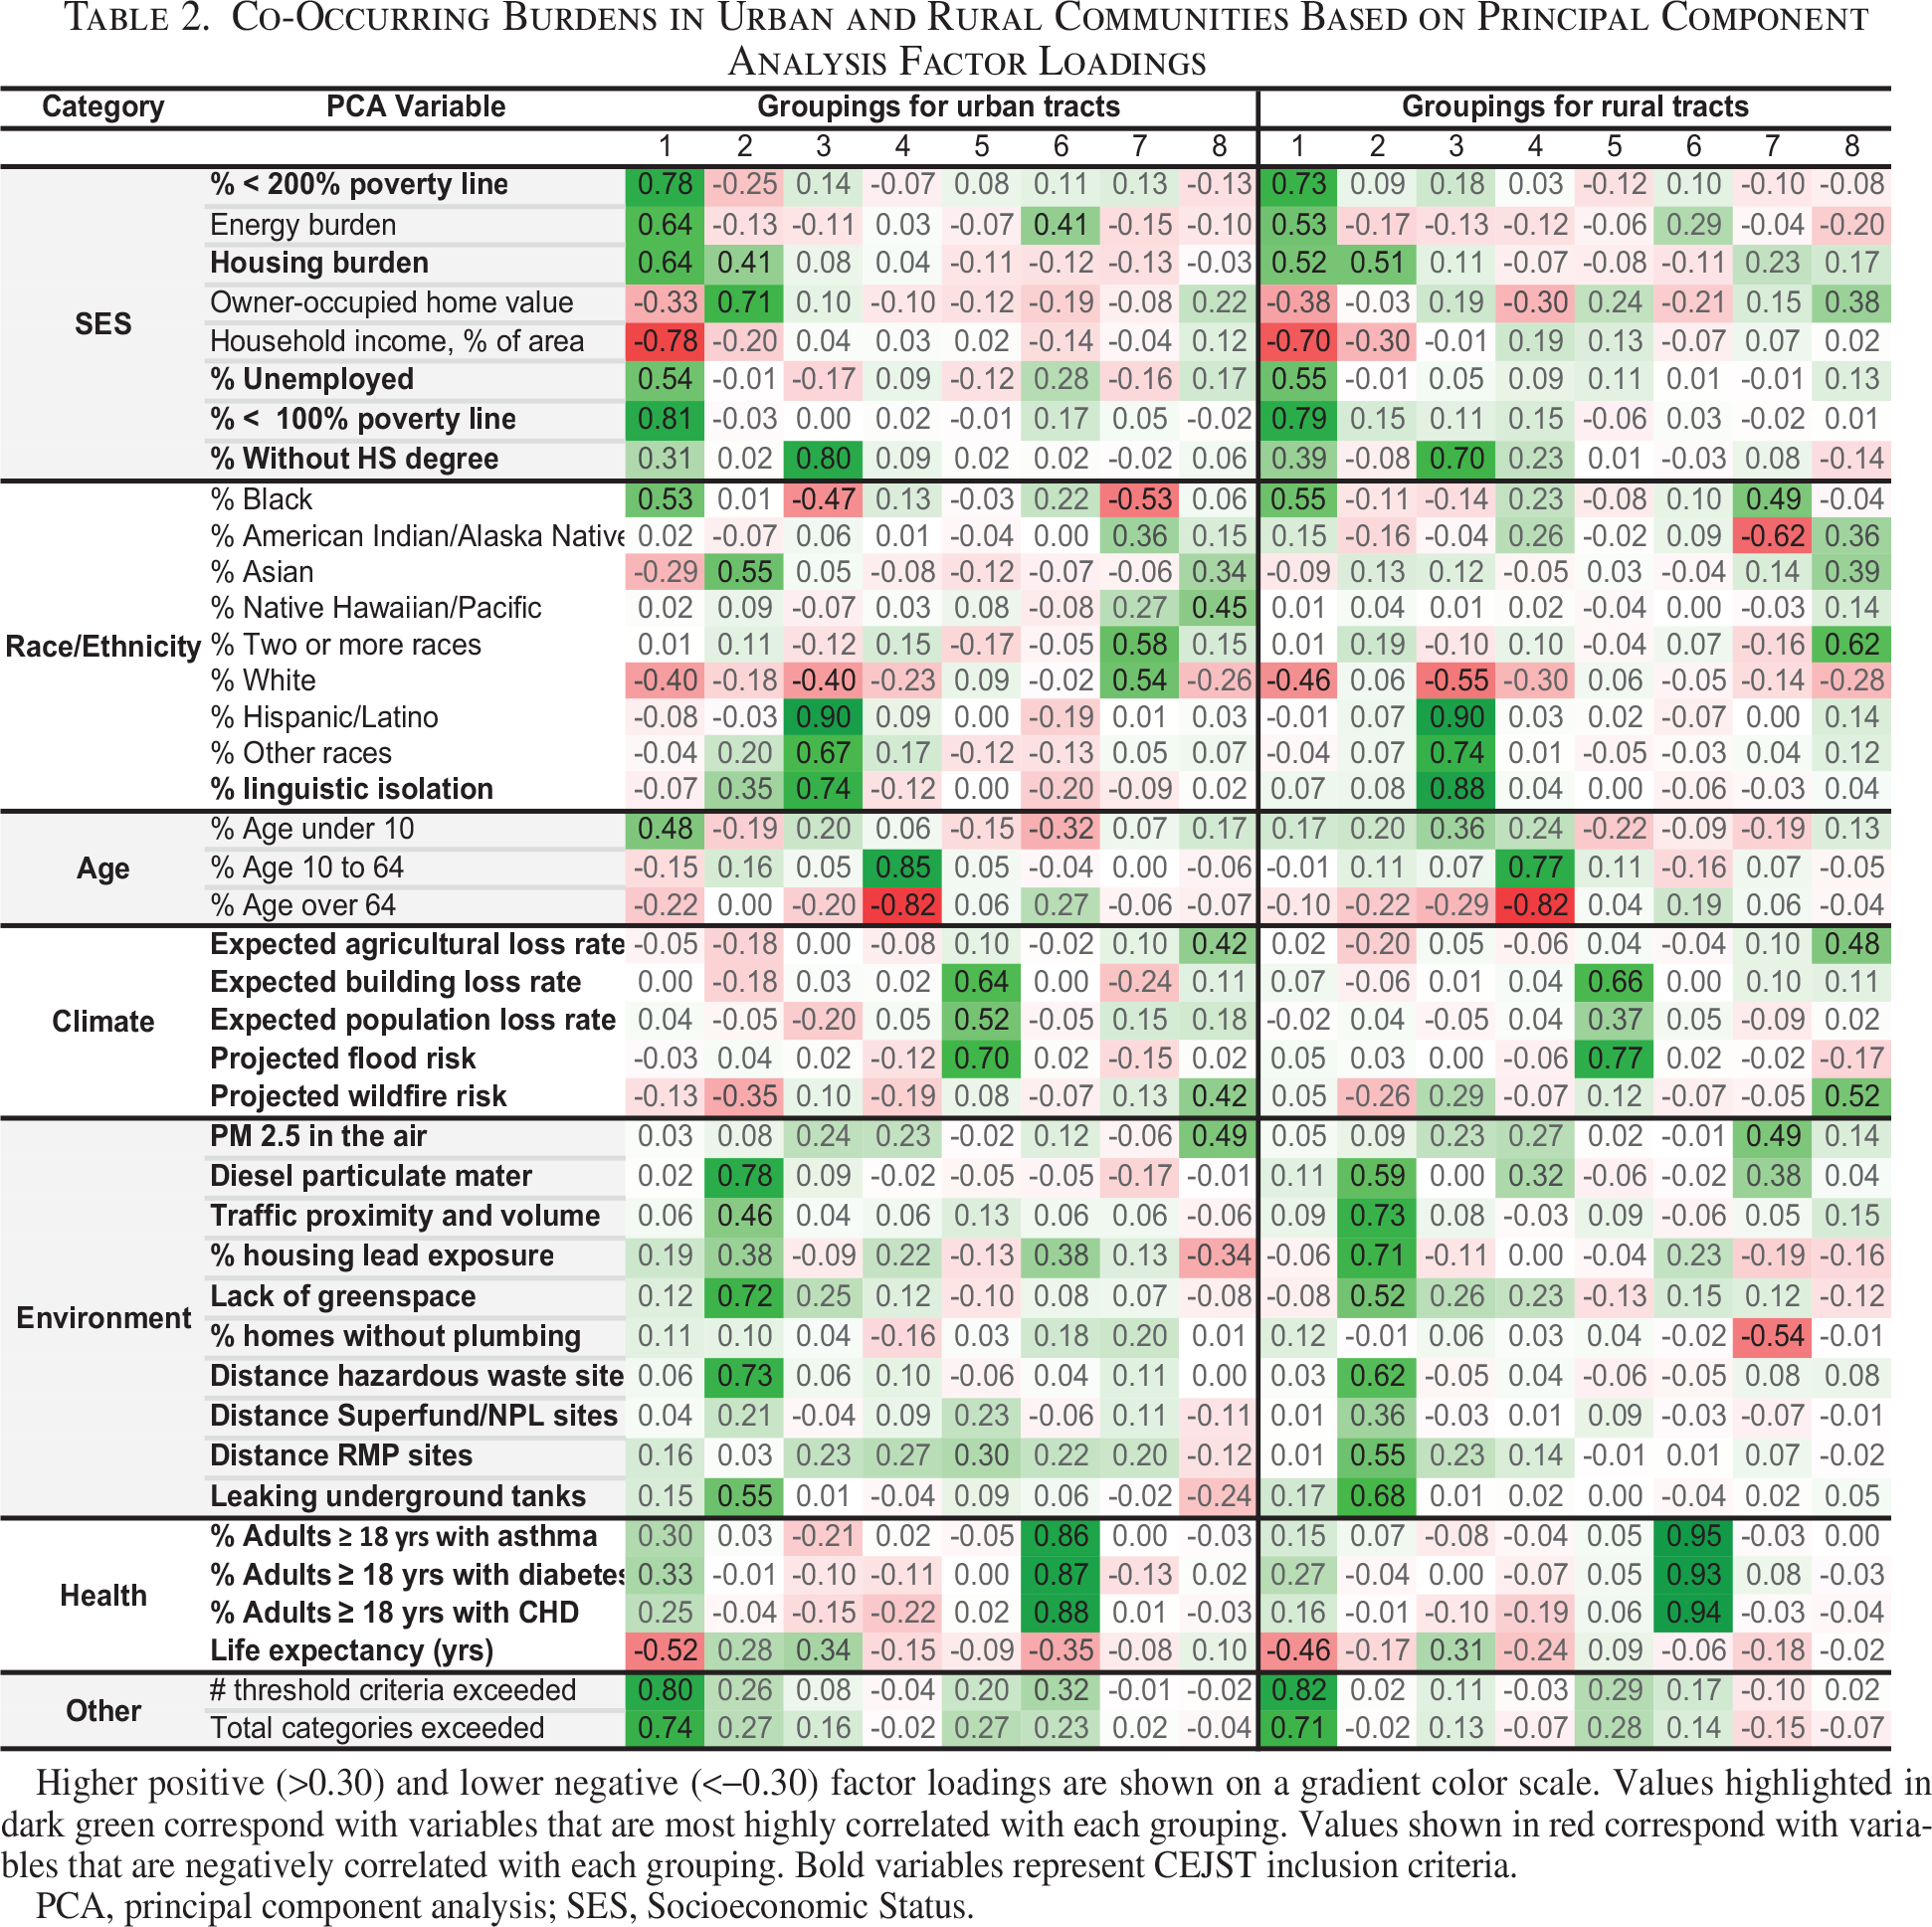
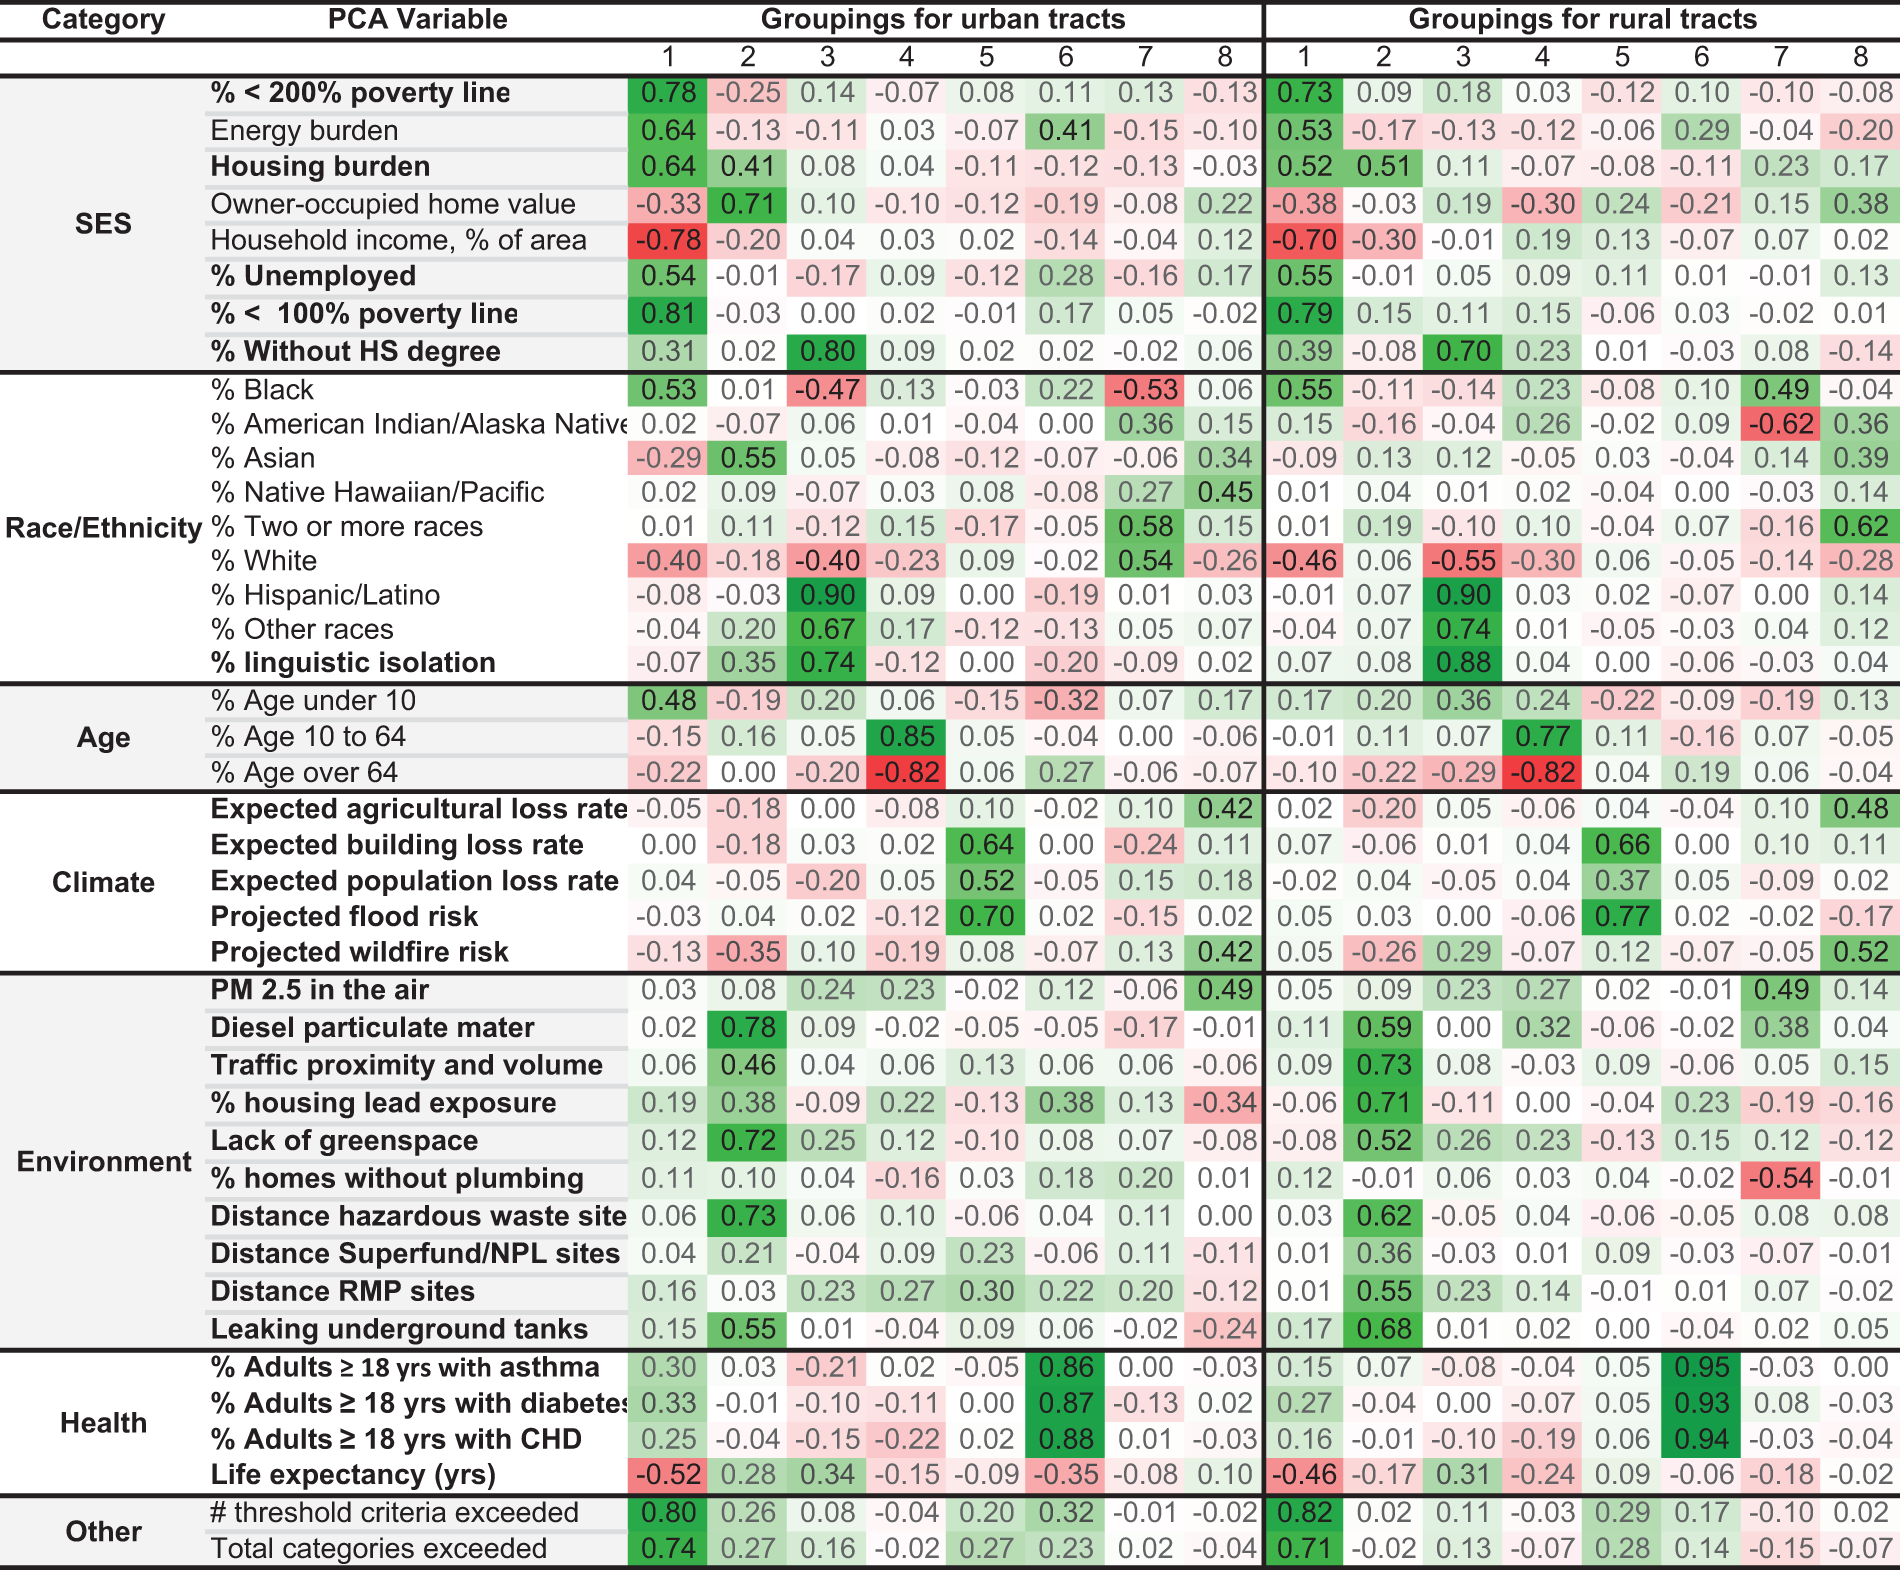
Higher positive (>0.30) and lower negative (<−0.30) factor loadings are shown on a gradient color scale. Values highlighted in dark green correspond with variables that are most highly correlated with each grouping. Values shown in red correspond with variables that are negatively correlated with each grouping. Bold variables represent CEJST inclusion criteria.
PCA, principal component analysis; SES, Socioeconomic Status.
The first eight rotated principal components (groupings) accounted for approximately half of the cumulative variance in the CEJST dataset (urban = 0.58, rural = 0.55). When comparing PCA results of urban and rural tracts, the authors found similar groupings of demographics and burdens (Table 2). In urban tracts, grouping 1 explained 25% of the variance, whereas groupings 2, 3, and 6 explained 18%, 15%, and 15%, respectively. The proportion of variance explained by rural groupings 1 through 4 was similar (1 = 22%, 2 = 16%, 3 = 17%, 6 = 14%), and the range for all other groupings was 6%–9% for rural and urban census tracts.
Spatial clustering of co-occurring burdens in urban and rural communities
Groupings of urban and rural communities with co-occurring burdens were located in unique hotspots across the United States. Grouping 1 communities were concentrated in urban rust belt areas of the Midwest, Atlantic coast, and Mississippi river corridor as well as the rural Southeast. Grouping 2 communities were concentrated in urban areas of the Northeast and West Coast as well as rural areas of the Midwest and Northeast rust belt. Grouping 3 communities were concentrated in urban and rural areas of the Southwest. Grouping 4 communities were concentrated in urban Midwest areas and the Mississippi river corridor as well as the rural Southeast. Grouping 5 communities were distributed across many urban areas in the Central United States. In contrast, grouping 5 communities in rural areas were concentrated along the West and Gulf Coasts and in the upper Appalachian Mountains. Grouping 6 communities were located in urban areas throughout the Central United States for both urban and rural areas. Grouping 7 communities were sporadic, but rural clusters were present in the Southeast and along the West Coast. Grouping 8 communities were mostly distributed toward the Southern and Western United States (Fig. 2).
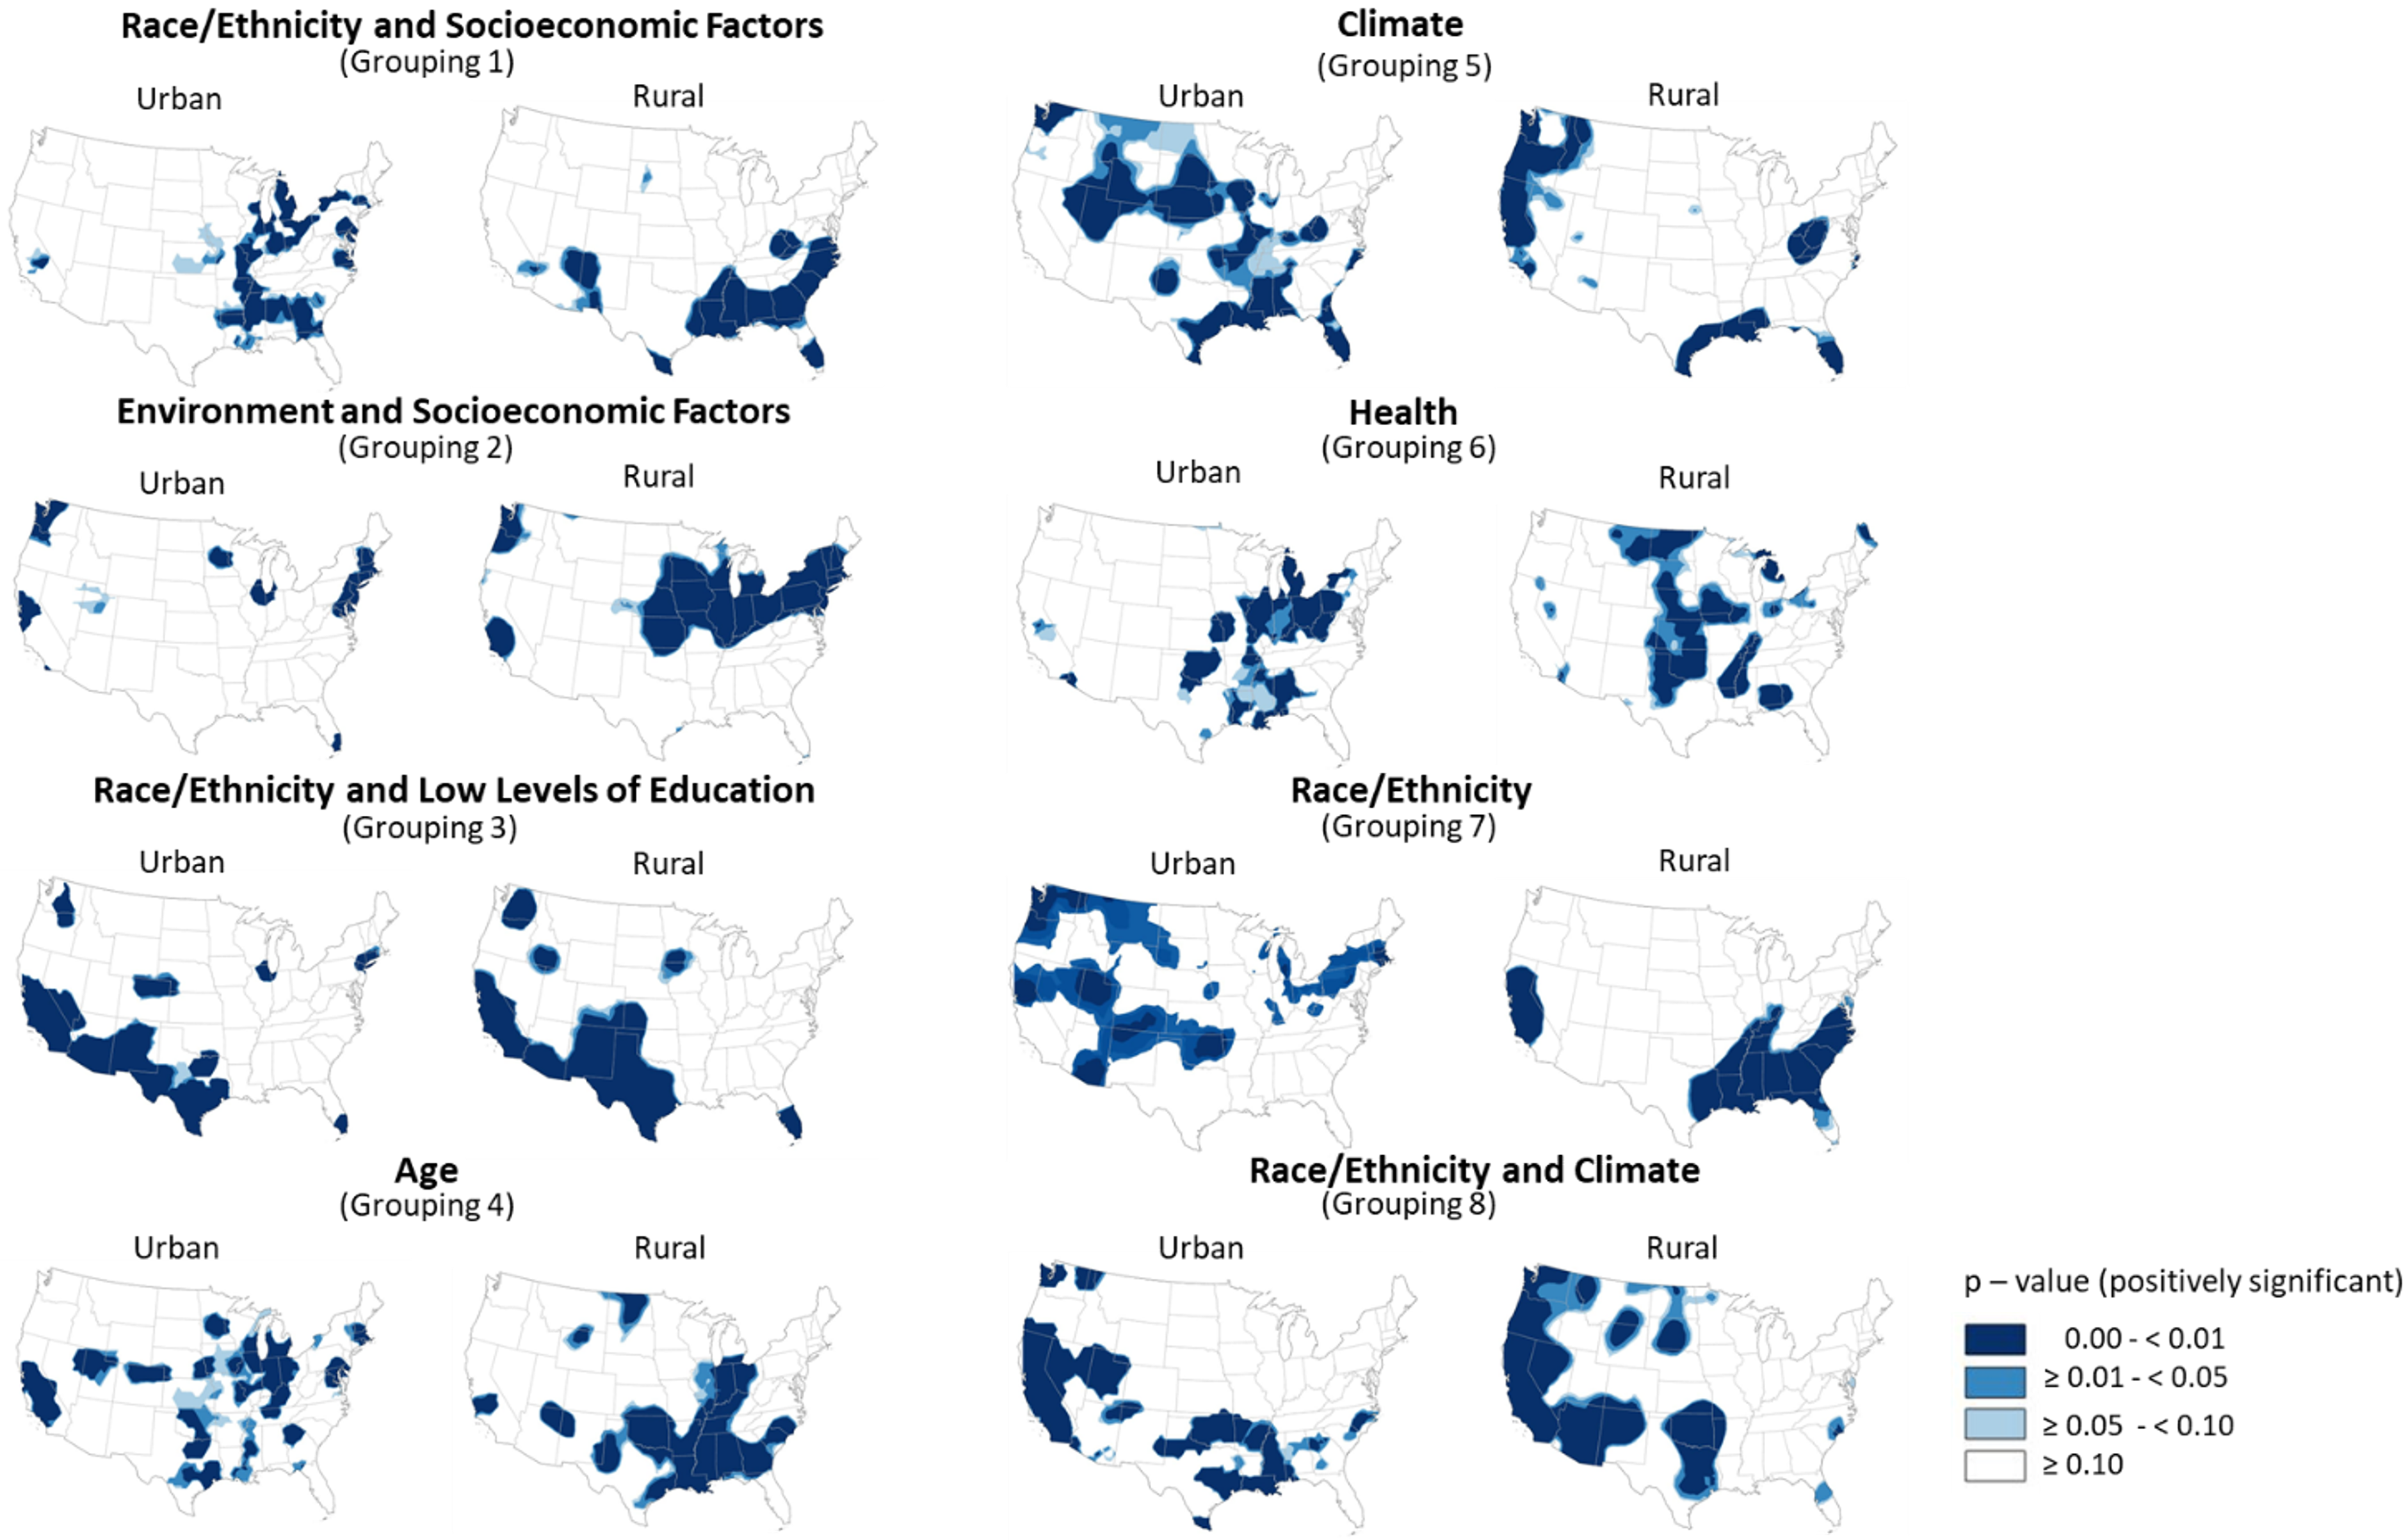
Spatial clustering of co-occurring burdens in urban and rural communities based on interpolated hotspot z-scores. Dark blue areas correspond with clusters of tracts that had a high positive grouping score and were identified as hotspots with a 99% confidence interval. These tracts had the lowest p-values and highest positive z-scores. Clusters of tracts that were hotspots with a 95% and 90% confidence interval are shown with successively lighter shades of blue. p-Values increased, and z-scores decreased as confidence intervals widened. Cold spots, or clusters of tracts with a negative grouping score, and areas without significant clustering are shown in white.
DISCUSSION
In this nationwide analysis of Justice40 burdens and demographic clustering in the United States, the authors identified stark differences across the communities labeled as disadvantaged. Funding priorities are ostensibly driven by this dichotomous classification (disadvantaged or not). However, the results demonstrate that the shares of minority residents, levels of environmental burden, ages, and sociodemographics vary extensively across disadvantaged communities based on the number of CEJST burden thresholds met. For example, tracts meeting seven or more burden thresholds in the CEJST had 80% higher proportions of non-White residents, 57% of the median household income, and 220% more residents living near a hazardous waste facility compared with tracts meeting only one threshold in the CEJST. For many measures of burden, disparities among the tracts labeled as disadvantaged communities in the CEJST were greater than disparities between the tracts labeled as disadvantaged communities or not disadvantaged. In other words, disparities were greater when looking within the range of disadvantaged communities than when looking between disadvantaged and non-disadvantaged communities. Examples of variables where these differences in disparities were observed included household income, traffic, several types of pollution, lack of greenspace, percentage of residents experiencing poverty, percentage unemployed, percentage without a high school degree, and all CEJST health indicators.
As the intensity of burdens varied J40-defined disadvantaged communities, so too did the nature of burdens, which co-occurred into geospatial clusters based on sociodemographic and environmental burdens. Across the country, the authors identified and mapped the distribution of burden clusters for both urban and rural tracts. Some, like those predominantly related to old age and climate risk in the Rust belt, indicated tracts where more senior citizens may be at risk from heat stress than in other areas. By interpolating the total number of tract-level CEJST burden thresholds met, the authors developed a baseline understanding of geographic variability in the depth of comprehensive disadvantage across the United States, as opposed to single-category or dichotomous trends. The authors interpreted PCA-based clustering of CEJST variables based on central underlying themes of burden that have been described by academic research and policy makers.29,30,31 They found that the primary theme of burden was socioeconomics and human health. Other themes, in order of the proportion of variance explained, included race, ethnicity, and socioeconomics; environmental quality and socioeconomics; health (in isolation); race, ethnicity, and education; age (in isolation); climate (in isolation); race and ethnicity; and climate, race, and ethnicity.
With a high level of variability in the nature and depth of burden between communities, J40-linked funding could be proposed and allocated toward specific types and extents of need beyond the current J40-designated disadvantages. Climate interventions can be focused on places of greatest threat-specific need combined with social vulnerability. As examples, housing interventions can focus on communities of historic discrimination and high housing costs; nature-based interventions can be focused on areas of high pollution and heat risk; and transportation investments can be focused on communities with the least access to, but the highest environmental burden from, transportation facilities. Such focus on resources is likely to yield multiples of greater effects to equitably alleviate community burdens and risks.
After the initial announcement of Justice40 and the release of the CEJST dataset, other analyses have been performed to evaluate cumulative burdens and recommend prioritization of relevant funding. Notably, a 2024 National Academies report evaluated CEJST and recommended transparent indicator selection and integration, rigorous validation that burden assessment reflects real-world circumstances, and thorough analysis and documentation of methodological choices to designate burden. 32 A separate review of environmental health and justice screening tools, including CEJST, emphasized the needs for localized screening approaches that overcome limitations of broadly applied tools, the potential uses for locally sourced data, and the need for carefully assigned and relevant indicator weights. 33 In accordance with the analysis, the limitations of existing screening tools to truly reflect extensive variation in the depth and types of cumulative impacts, and implications for action, was also emphasized. 34 A promising area for advancement of screening tools is the potential for high-resolution assessments using satellite data to characterize sources and environmental disparities in heat, green space, and air pollution. 35
Strengths and limitations
A key strength of the analysis is the use of the nationwide CEJST dataset. The dataset includes a wide array of risks and burdens related to disadvantages across communities and enabled the classification of the nature, distribution, and extent of disadvantage across the United States. The CEJST classification into 23 topic-specific burden thresholds enabled the use of these criteria to classify the extent of cumulative risks in communities. By comparing population quartiles by number of thresholds met, the authors were able to delineate the widely varied extent of disparities within J40-designated communities. The use of PCA methods enabled objective groupings of co-occurring metrics of disadvantage. Furthermore, for the PCA analysis, the authors included race and ethnicity to examine how and where J40-defined burdens coincide with racial and ethnic makeup. The use of hotspot cluster analysis allowed for the identification of statistically significant spatial clusters of risk types.
The analyses provided a broad nationwide overview of the extent of variation in, nature, depth, and distribution of burdens. Although the primary analysis did not include all census tracts due to missing data in the CEJST dataset, the sensitivity analyses demonstrated little difference in results between the full dataset and the narrowed dataset with complete data. The results are not immediately actionable and cannot be extrapolated to specific communities or activities. For this, the authors recommend a similar assessment of specific funding goals to elucidate the communities that would likely receive the greatest benefits of specific investments. This could be conducted by both grant applicants and by granting agencies, to better identify relevant communities of need and allocate funding accordingly. The authors also recommend prioritization of federal needs assessments and technical assistance to inform the design and implementation of holistic interventions that are tailored to the burdens, environmental, and social contexts of specific communities. Although there are many strengths of the CEJST dataset, it is limited to a relatively small number of metrics to represent disadvantage and burden. Furthermore, although the total number of community J40 inclusion criteria met provides an objective framework to assess the extent of community disadvantage, these dichotomous designations do not reflect the extent of each disadvantage type.
Future directions
This analysis provides a framework for much needed focus and tailoring of funding resource allocation to address the most pressing needs of communities. Topic-specific analyses could assist communities and agencies in the design of actions based on community contexts. Such analyses could be performed to understand nationwide trends and assess intra-city variation in depth and types of burdens. Although funding is allocated at the agency level, often to address specific outcomes, prioritization of interventions that simultaneously address cumulative burdens may yield much larger overall impacts for environmental equity. The authors also call for research to understand the benefits of investment in disadvantaged communities to enable evidence-based refinement of interventions and their implementation to maximize benefits.
CONCLUSIONS
The authors documented that the types and depth of disparities characterized by the CEJST dataset vary extensively across the United States and are not captured by dichotomous disadvantaged classification. In many cases, the levels of burden across CEJST communities are more stark than between J40-disadvantaged and non-J40-disadvantaged communities. Therefore, this analysis highlights the opportunity to focus and tailor funding to address relevant issues in communities of greatest need. These findings may inform future cumulative burden and funding models that improve upon CEJST and Justice40. However, additional analyses are needed to consider place-based burdens and community contexts. By considering the place-based extent and makeup of cumulative risks, interventions can be designed, located, and implemented in ways to improve the cumulative benefits of resources allocated to equitably promote economic justice and climate resilience.
AUTHORS’ CONTRIBUTIONS
M.H.E.M.B.: Conceptualization, data curation, funding acquisition, investigation, methodology, project administration, resources, software, supervision, validation, writing—original draft, writing—review and editing; K.Z.: Data curation, formal analysis, investigation, methodology, software, validation, visualization, writing—original draft; O.M.: Conceptualization, investigation, methodology, writing—original draft, writing—review and editing; S.O.: Data curation, formal analysis, investigation, validation, visualization, writing—original draft, writing—review and editing; S.E.: Data curation, formal analysis, methodology, visualization, writing; K.M.T.: Data curation, formal analysis, investigation, methodology, visualization, writing—original draft, writing—review and editing; A.R.: Investigation, methodology, visualization, writing—original draft, writing—review and editing; R.Y.: Conceptualization, data curation, formal analysis, funding acquisition, investigation, methodology, project administration, resources, software, supervision, validation, visualization, writing—original draft, writing—review and editing.
Footnotes
AUTHOR DISCLOSURE STATEMENT
All authors declare no competing interests.
FUNDING INFORMATION
This study was supported, in part, by funding provided by the National Institute of Environmental Health Sciences (NIEHS P42 ES023716, P30 ES030283) and the Owsley Brown II Family Foundation.
Supplemental Material
Supplementary Material
Please find the following supplemental material available below.
For Open Access articles published under a Creative Commons License, all supplemental material carries the same license as the article it is associated with.
For non-Open Access articles published, all supplemental material carries a non-exclusive license, and permission requests for re-use of supplemental material or any part of supplemental material shall be sent directly to the copyright owner as specified in the copyright notice associated with the article.