
Abstract
Warthog (Phacochoerus africanus) plays a key ecological role in African savannas, yet its population status remains poorly documented in South Sudan. This study present the first standardized, protocol-based assessment of warthog density and sightings predictors in Nimule National Park (NNP), South Sudan. It also examine its density variations across the continent. The line transect sampling method was employed to assess the population. A total of 20 transects were laid in three habitat types covering a distance of 264km in 2015 and 2016. DISTANCE sampling estimated approximately 4,000 warthogs within the 256 km2 core zone during 2015–2016, substantially exceeding the 265 individuals recorded in 2000, although remaining below historical estimates from 1987. Warthog sightings and abundance increased 16–22-fold between survey years, indicating strong interannual fluctuations likely linked to environmental conditions and forage availability. GLMs identified burrow availability as a significant predictor of both sightings and abundance, whereas human disturbance showed no significant effect. Comparative GLMM analyses across Africa demonstrated that local site-level factors were more influential than broader macrogeographical effects in shaping density patterns. Although the modeled density at Nimule in 2015-2016 ranked high among continental populations, comparisons revealed considerable variation in warthog densities among sites within countries. The NNP supports one of the highest warthog densities in Africa, emphasizing its conservation importance and the value of long-term, standardized monitoring to better define management strategies for savannah ungulates under variable ecological and anthropogenic pressures. Despite currently high densities, warthog populations in Nimule National Park show strong interannual variability and dependence on burrow-rich dry-season refugia, indicating that sustained multi-year monitoring, habitat protection, and consistent local management are essential to maintain their favourable conservation status.
Introduction
The common warthog (Phacochoerus africanus) is a widespread and habitat-tolerant African suid (Butynski & de Jong, 2017) that occupies a broad range of savanna ecosystems (Cumming, 1999). As a predominantly grazing species, warthogs play an important ecological role in shaping grassland structure and function. Their grazing and soil-rooting activities contribute to maintaining open grassland patches, enhancing nutrient cycling, and creating foraging pits that are subsequently used by other species (Cumming, 1982). Owing to these ecological functions, understanding warthog population dynamics is important for interpreting savanna ecosystem processes.
Warthog ecology and population dynamics have been investigated in several African landscapes (e.g., Edossa et al., 2020, 2021; Somers et al., 1994; Teklehaimanot & Balakrishnan, 2017). Reported densities and group sizes vary considerably across regions, reflecting differences in habitat structure, rainfall regimes, predation pressure, and anthropogenic influences (e.g., Edossa et al., 2022; White, 2010). Such regional variation highlights the importance of site-specific assessments. Population size and habitat characteristics form the foundation of wildlife ecology, providing critical insight into species status, ecosystem function, and long-term population trends (Barnes, 2016; Knight, 1981; Koons et al., 2016; Ogutu et al., 2017; Prasanai et al., 2012; Rieman, 2001; Wakeley, 1982). This information assists the effective management of protected areas (IUCN and World Commission on Protected Areas (WCPA), 2016; IUCN ESARO, 2020), informs strategies to mitigate human–wildlife conflict (Knight, 1981), supports wildlife-based tourism and habitat stewardship (Bertram, 1979, 2008; Norton-Griffiths, 1978; Prasanai et al., 2012), and guides anti-poaching interventions (Bertram, 2008; Western and Grimsdell, 1979).
To generate reliable estimates and identify ecological predictors of population patterns, wildlife ecology employs a range of population-estimation methods, including total counts, sample and index counts, and more advanced statistical approaches (McCleery et al., 2022; Sutherland, 1996). These techniques may involve foot, vehicle, or aerial surveys and incorporate road counts, distance sampling, mark–recapture, migration counts, or colony counts (Sutherland, 1996; Thomas et al., 2002). Habitat-use evaluation similarly relies on stand-based or species-based analytical frameworks (Bowman and Robitaille, 2005; Sethy and Chuanhan, 2016). Selecting an appropriate method requires balancing methodological assumptions and limitations against ecological characteristics, terrain, available resources, and study objectives (McComb et al., 2010; Western and Grimsdell, 1979).
Despite the growing body of research across eastern and southern Africa, important geographic gaps remain. In South Sudan, and particularly within Nimule National Park (NNP), no comprehensive population assessment of warthogs has been conducted. The only available estimate originates from an unpublished report (Morjan et al., 2000), which suggested a population of 265 individuals (1.04/km2) based on a line-transect survey carried out during peak rainy-season vegetation growth. Dense vegetation during this period likely compromised visibility and may have violated key assumptions of the distance-sampling method used to derive the estimate (DISTANCE sampling). Additionally, another unpublished report documented high-mortality events in 1987, 1988, and 2014 that were suspected to be disease-based density-dependent (Reuben et al., 2014), yet no systematic, peer-reviewed evaluation of these events has been produced. Consequently, at the onset of this study, both the warthog population size in NNP and the ecological or anthropogenic factors influencing it remained largely unknown.
Historically, large carnivores such as lions (Panthera leo) and leopards (Panthera pardus) likely played an important role in regulating warthog populations. Although warthogs fall below the preferred prey-weight range of lions, they are nevertheless taken in proportion to their availability (Hayward & Kerley, 2005), and they are similarly documented among the prey species of leopards (Hayward et al., 2006). Both predators were extirpated from NNP in the 1970s as a result of intensive trophy poaching (John Hakim Lado, Chief of Olikwi Village, Nimule Payam, pers. comm., 2016). This historical context therefore provides an opportunity to evaluate whether warthog populations can reach comparatively high densities in protected areas where natural predators have been absent for several decades.
The primary objective of this study was to quantify warthog abundance and associated sighting predictors in Nimule National Park (NNP) and to evaluate population fluctuations in 2015-2016 compared to previous surveys, with implications on the conservation status of the population. To provide the first systematic assessment of warthog abundance and distribution in NNP and place it in a broader continental context, the study focuses on the following guiding questions: (i) What was the abundance and density of warthogs in NNP in 2015-2016 versus previous estimates? (ii) How does warthog abundance in NNP compare with available estimates for conspecific populations elsewhere in Africa? (iii) What ecological and anthropogenic factors, including human disturbances, influence warthog distribution within surveyed areas? (iv) How do warthog abundance and sightings vary between years, and what factors drive these temporal patterns? (v) What is the broader continental context of warthog densities, and how do regional variations inform the interpretation of NNP’s population status?
Including a continental review of warthog densities allows us to situate NNP’s population within the wider African context, providing a comparative framework to assess whether observed densities are unusually high, typical, or low relative to other populations. This perspective strengthens the conservation relevance of the study by highlighting both local and regional management priorities, and it ensures that recommendations for NNP are informed by broader ecological patterns across the species’ range.
Materials and Methods
Study Area
NNP is located along the South Sudan–Uganda border, extending from 3°35′3″ to 3°49′2″ N and 31°48′3″ to 32°2′2″ E, with a total area of 410 km2, including 256 km2 of core parkland and 154 km2 of buffer zone (Figure 1). Natural barriers isolate the park from surrounding landscapes: the Kayu and Nile Rivers form the northern boundary, the Nile River marks the southern and eastern boundaries, and the Illungwe Mountain range forms the western boundary (Luard and the World-Wide Fund, 1985; Morjan et al., 2000). Elevation ranges from 500–800 m above sea level, with annual precipitation of 1000–1200 mm during the rainy season (April–October). The dry season spans November–March with elevated temperatures. Topography is hilly with seasonal streams, and grass height ranges from 1.2–2.5 m. Mean daily temperature is 27°C, peaking at 29°C in March. Map of the study area in South Sudan
Three principal habitat types were distinguished within the study area: (a) Riverine woodland occurs along the Nile River, its tributaries, and seasonal drainage lines and is characterized by relatively dense, closed to semi-closed woody vegetation dominated by broad-leaved species such as Ficus, Acacia, and Combretum, with moist soils supporting a lush understory of grasses, forbs, and riparian shrubs. (b) Bushy grassland represents an intermediate habitat composed of tall to medium-height grasses interspersed with moderately dense shrubs, including genera such as Grewia, Dichrostachys, and smaller Acacia species; it typically forms a mosaic between open grassland and wooded areas and is influenced by seasonal fire and grazing. (c) Wooded grassland, by contrast, consists of open savannah with widely spaced trees such as Terminalia, Combretum, and scattered Acacia, a ground layer dominated by short to medium-height grasses, minimal shrub cover, limited shade, and relatively high horizontal visibility. However, these habitats were too much homogeneous in general to be used in our statistical models.
The park is accessible only on foot due to the absence of roads and the presence of the continuously flowing Nile River, crossable only by motorboat or canoe (Morjan et al., 2000).
NNP was established in 1954 to conserve the threatened northern white rhinoceros (Ceratotherium simum), which became extinct between 1955 and 1972 due to horn poaching (Morjan et al., 2000; MWCT and AWF, 2014). NNP still hosts notable populations of African elephants (Loxodonta africana) and common hippopotamus (Hippopotamus amphibius) (Demaya et al., 2024), along with other ungulates including Cephalophus monticola, Tragelaphus scriptus, Alcelaphus buselaphus, Kobus ellipsiprymnus, Ourebia ourebi, Kobus kob, and Kobus kob leucotis.
Data Collection Protocol
Transects were randomly established across the study area. Numbers of observed warthogs were recorded along line transects in the NNP (Figure 2). In June 2015, 10 transects were sampled (2 at 4 km and 8 at 2 km), totalling 24 km. In 2016, each transect was 4 km long, with repeated surveys (twice per month from March–May) totalling 240 km. Combined effort for both years was 264 km. The surveyed area was 52.8 km2, representing approximately 21% of the core park area (256 km2). The open savannah-woodland structure justified line-transect application (Buckland et al., 1993). Warthogs observed during the line transect surveys at Nimule National Park, South Sudan
Line transect sampling (Anderson et al., 2001) was employed to quantify: (1) relative abundance and distribution of warthogs, and (2) abundance and distribution of burrows utilized by warthogs. Stratified sampling was conducted across the three above-mentioned habitat strata based on vegetation physiognomy: (a) riverine woodland, (b) bushy grassland, and (c) wooded grassland (Ministry of Wildlife Conservation and Tourism of South Sudan & African Wildlife Foundation, 2014). DISTANCE sampling methodology was applied to estimate warthog population abundance (Buckland et al., 1993, 2004; Plumptre, 2000; Thomas et al., 2010; Thorp, 2012). Ground counting was used, following key line-transect assumptions: (1) all objects on or near the transect are detected with certainty (g(0) = 1), (2) animals are detected at their initial positions before any movement, (3) distances are measured accurately, and (4) sightings are independent (Buckland et al., 1993). Adherence to these assumptions minimized observer disturbance. Line-transect distance sampling was implemented on foot throughout NNP, as the rugged terrain and absence of an established road network precluded vehicle-based surveys. Transects were designed and surveyed in accordance with standard distance-sampling procedures to meet key methodological assumptions.
For methodological consistency and comparability, survey timing and detectability considerations were explicitly taken into account. In this context, it is noteworthy that an earlier survey conducted in 2000 during peak vegetation growth may have been affected by reduced visibility and potential violation of detectability assumptions (Morjan et al., 2000). The present study therefore applied standardized distance-sampling procedures under conditions designed to optimize detectability and ensure robust baseline estimates for future monitoring in NNP.
One observer and two accompanying rangers participated in the transect surveys. The surveys were conducted when visibility was good and animals were in the field, and started shortly after sunrise to 12:00 PM and from 4:00 PM to sunset.
Accompanying rangers were trained in field protocols, including camouflage use, silent movement, and single-file traversal behind the observer to prevent premature disturbance of animals. Transects of fixed width (0.1 km on either side) were used.
Observers recorded number of observed warthogs, their sex, type of activity, and environmental features, including human disturbances. GPS coordinates (GARMIN GPSMAP64) were used to map transect segments and features. Perpendicular distances were measured using a Bushnell laser rangefinder or a 50 m tape. Binoculars (Nikon Action EX 8x40, 8.2°) and cameras (Olympus Stylus 24X or Nikon 20.1 MP) documented observations.
Statistical Analyses
Candidate covariates influencing warthog abundance included vegetation type, temporary ponds, Nile River, burrows, ranger posts, and poaching locations. Distances from detected warthogs to these features were calculated using ArcGIS 10.5 (“Near” tool) and incorporated into detection function models in Distance 7.1 software (Buckland et al., 2001; Thomas et al., 2010).
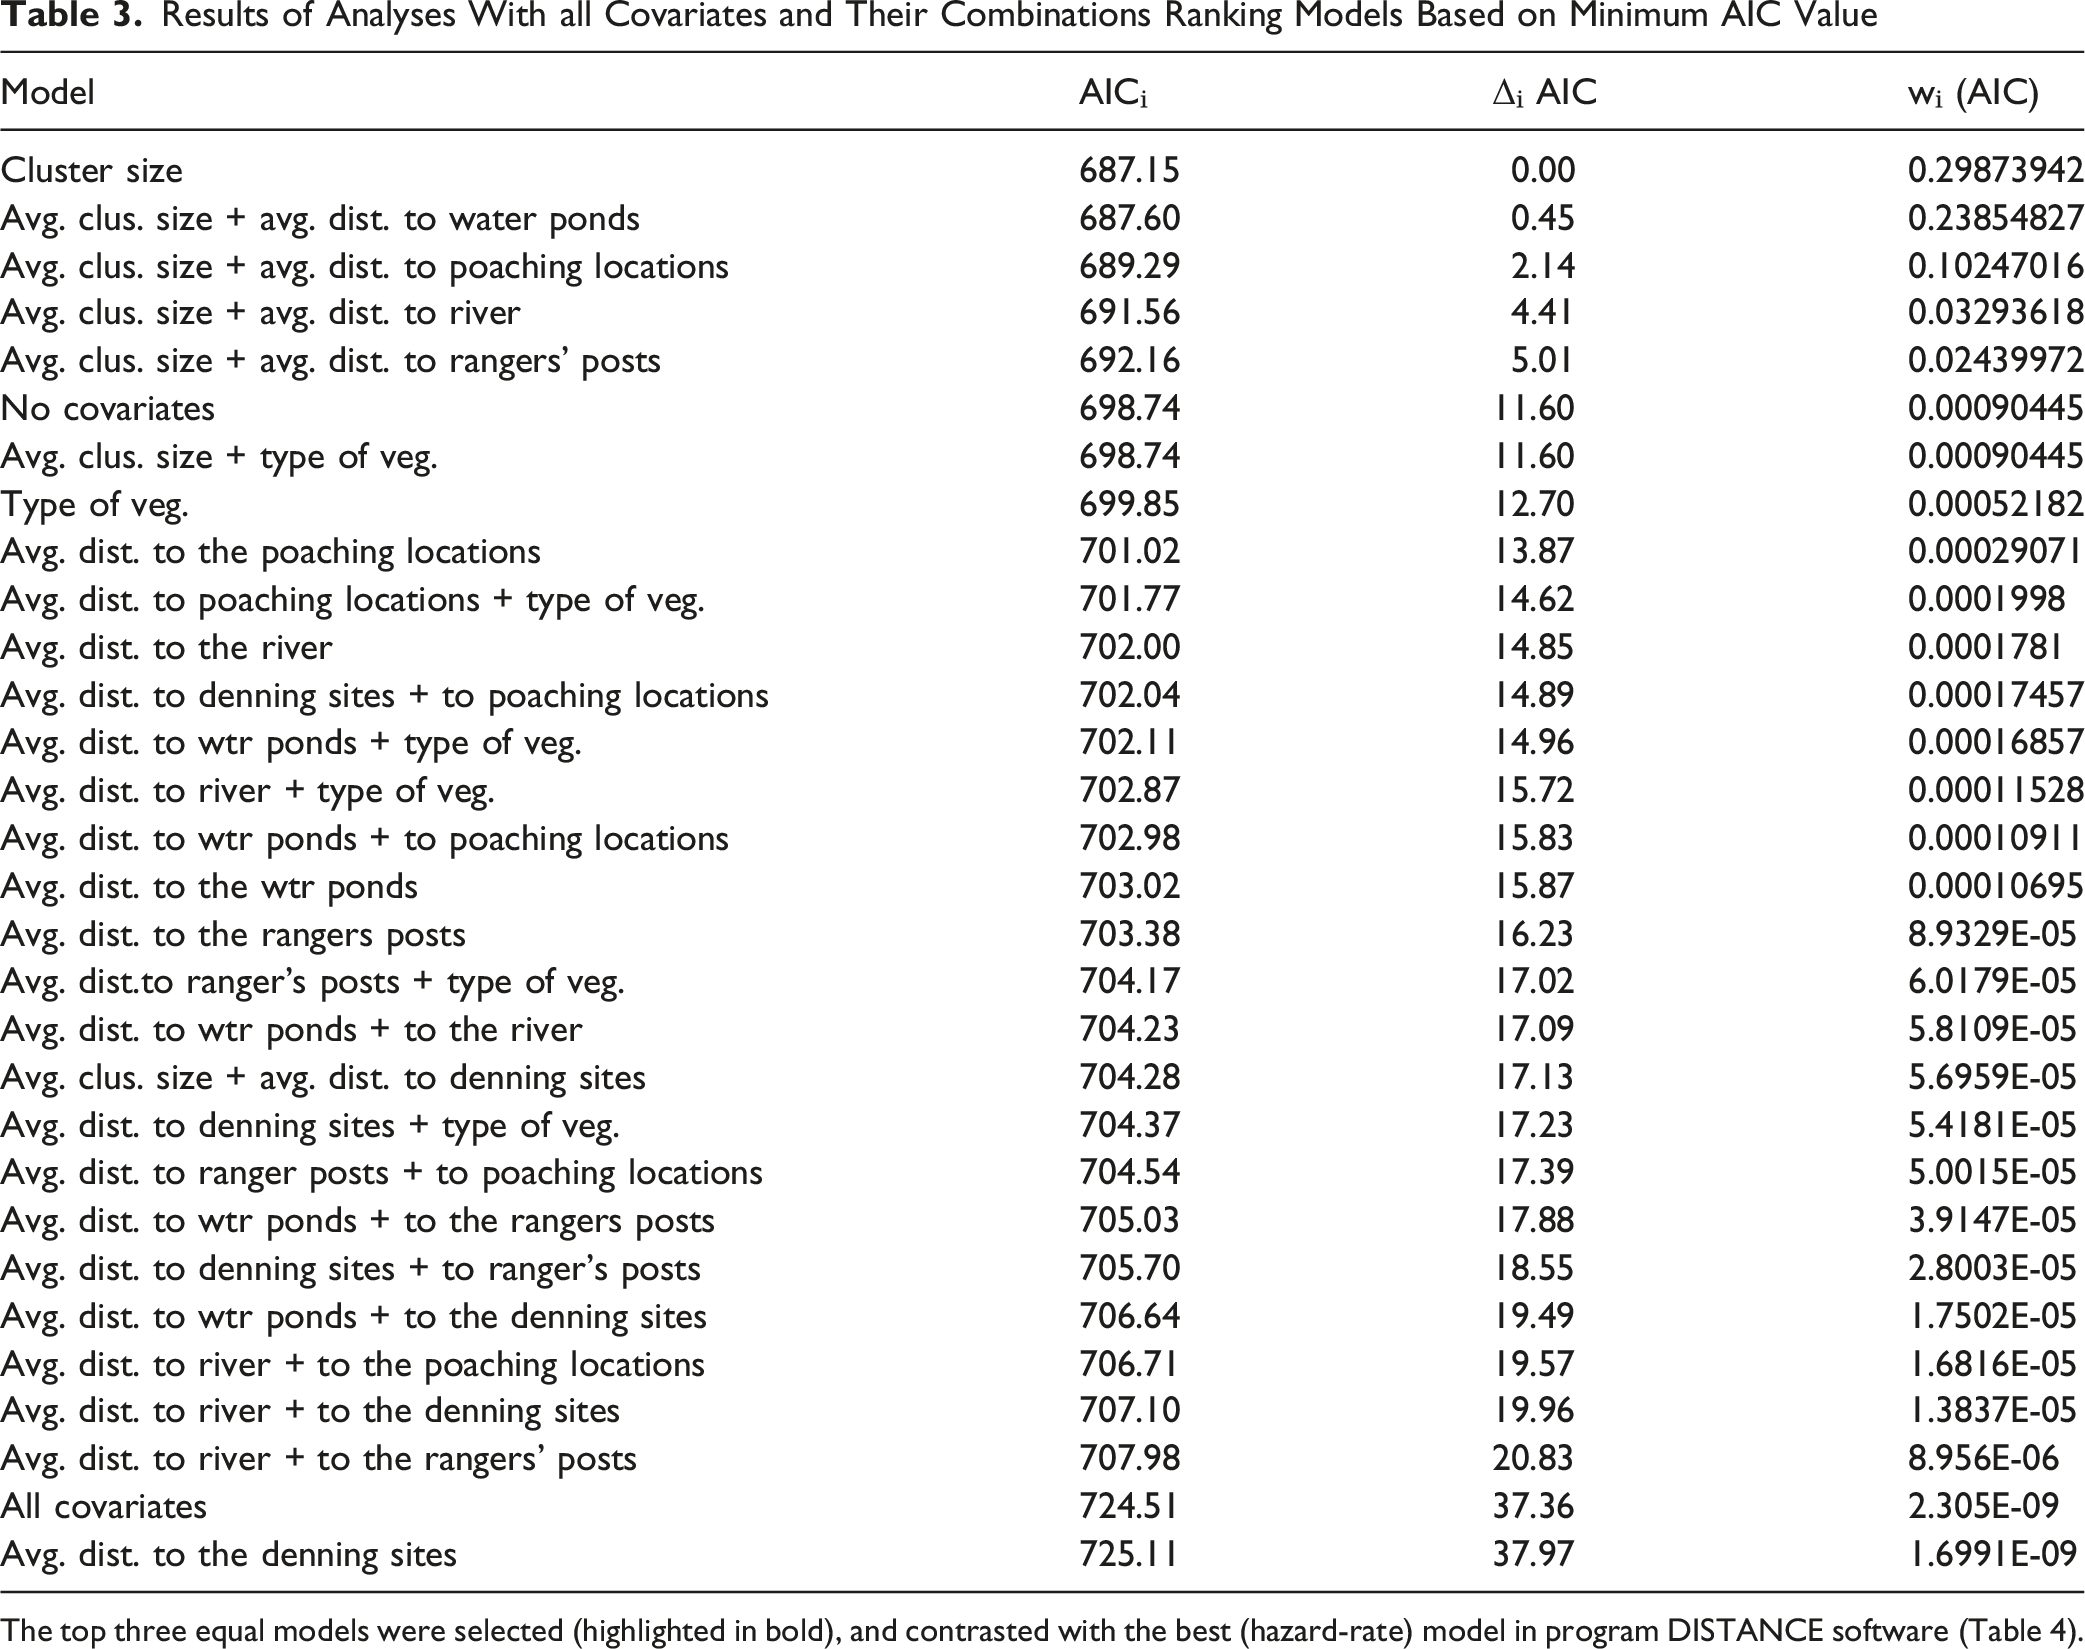
Detections beyond 0.1 km or with centers outside the fixed width were excluded. Twenty transects served as the sample size. Conventional DISTANCE Sampling (CDS) estimated warthog density using exact perpendicular distances, with initial models including half-normal with cosine adjustment, uniform with simple polynomial, and hazard-rate with Hermite polynomial (Thomas et al., 2010). In fact, among the candidate models, the hazard-rate detection function without adjustment terms provided the best fit to the data (AIC weight = 0.999) and was therefore selected to estimate detection probability and population density. Model selection was based on Akaike’s Information Criterion (AIC).
We analysed factors influencing warthog occurrence and abundance using generalized linear models (GLMs) based on data collected during 2015–2016 (Online Supplemental Table S1). Two count-based response variables were examined: (1) the number of warthog sightings per transect and (2) the total number of individuals recorded per transect. Because the data were discrete and exhibited pronounced variance heterogeneity—characterized by many zero counts in 2015 and relatively high counts in 2016—we fitted Negative Binomial GLMs with a log link function. Overdispersion tests indicated that the Poisson alternative was unsuitable (ratio of Pearson residual deviance to degrees of freedom > 1.5).
To account for differences in sampling effort among transects (0.4 km2 vs. 0.8 km2), transect area was incorporated as an offset term using the natural logarithm of surveyed area (log[area]; Table S2), standardizing counts to density-like estimates while retaining the discrete count structure. Based on ecological relevance, three explanatory variables were included: (1) Year (2015 vs. 2016), treated as a categorical factor to evaluate interannual variation; (2) number of burrows per transect, a continuous predictor reflecting habitat suitability or prior warthog activity; and (3) human disturbance, also continuous, representing the number of disturbance indicators (e.g., livestock, human activity, paths) recorded along each transect. Cluster size was initially considered as a predictor to account for group-level detection effects but was later excluded in a separate analysis to assess the influence of other covariates independently. Burrow availability was included as a predictor because warthogs frequently use pre-existing burrows dug by other species or groups (for instance Aardvarks (Orycteropus afer) (White & Cameron, 2009), so burrow density reflects habitat suitability rather than merely the presence of the observed individuals, avoiding a circular effect in the analysis.
All GLMs were fitted using maximum likelihood estimation. Model evaluation included inspection of residuals, leverage, dispersion parameters, log-likelihood, and Akaike’s Information Criterion (AIC). Competing Poisson and Negative Binomial models were compared, with the Negative Binomial consistently providing better fit and controlling for overdispersion. Parameter estimates are reported with standard errors, z-values, and two-tailed significance tests.
In addition to analyzing warthog populations at the Nimule National Park (NNP) scale, we compiled published data on warthog population densities from across Africa to provide a broader comparative context. To achieve this, we conducted a literature search using Google Scholar on 21 November 2025, focusing on peer-reviewed articles, reports, and other reliable sources that reported density estimates for Phacochoerus africanus populations in different regions. The keywords
In order to analyze the data obtained from the literature, Generalized Linear Mixed Models (GLMMs) were implemented in R (version 4.3.1) using the lme4 package to assess factors influencing warthog density across spatial scales (survey area and country). Warthog counts per survey area were modelled assuming a Poisson distribution with a log link function, appropriate for count data while preserving the discrete nature of observations. Country was included as a fixed effect to evaluate national-level differences in warthog density, while survey area was included as a random effect to account for spatial clustering and site-specific heterogeneity within countries. This structure allowed the model to separate broad-scale variation attributable to national context from fine-scale ecological or management-driven variation within study areas. Model parameters were estimated using maximum likelihood estimation, and model performance was assessed through residual analysis, evaluation of dispersion parameters, and goodness-of-fit statistics. Confidence intervals and standard errors for fixed effects were calculated to assess precision, and z-values with two-tailed significance tests were used to evaluate the contribution of each predictor. The GLMM approach provided a robust framework for quantifying warthog density while accounting for both hierarchical spatial structure and overdispersion inherent in ecological count data. For continental comparisons, Benin was used as the reference country, and the density of warthogs in each other country was expressed relative to this value. Positive indices indicate densities higher than the reference, whereas negative indices indicate densities lower than the reference, allowing standardized comparison across published studies.
Results
Density of Warthogs in Nimule National Park
Number of Warthogs and Environmental Features Sighted by Transects in Nimule National Park in 2015 and 2016

Symbols: T1 to T10: line transects; L(km): transect length; A(km2): area; NO: number of observations; N: number sighted; B: burrow; H: Human disturbance.
The detection function curve of DISTANCE data for warthogs is given in Figure 3. Warthog estimated density by DISTANCE in 2015-2016 was of 15.704 individuals/km2, giving an estimate of approximately 4,000 individuals in the whole protected area. The summary of detection models used and corresponding delta AIC and AIC values are given in Table 2. Hazard-rate without adjustment provided the best fit (AIC = 705.4), outperforming half-normal and uniform models (ΔAIC > 4). Multiple Covariate Distance Sampling (MCDS) included cluster size and distances to ponds, Nile River, burrows, ranger posts, poaching locations, and vegetation type. Top models included cluster size alone and combined with distance to ponds or poaching sites (Table 3). χ2 goodness-of-fit values were acceptable (p > 0.05), with AIC weights of 0.426, 0.340, and 0.146, respectively. Hazard-rate without adjustment had an AIC weight of 0.999, Kolmogorov–Smirnov GOF p = 0.91, and χ2 probability p = 0.72, confirming its suitability. Detection function curve of DISTANCE data for warthog in Nimule National Park Summary of Detection Models Used and Corresponding Delta AIC and AIC Values Symbols: Δᵢ (AIC) = Delta AIC; Wᵢ= AIC weights calculated using the formula wᵢ = exp(−½Δᵢ)/∑exp(−½Δ); D/km2= Density calculated by program Distance; CV% = coefficient of variations; 95% = lower and upper confidence intervals. Results of Analyses With all Covariates and Their Combinations Ranking Models Based on Minimum AIC Value The top three equal models were selected (highlighted in bold), and contrasted with the best (hazard-rate) model in program DISTANCE software (Table 4).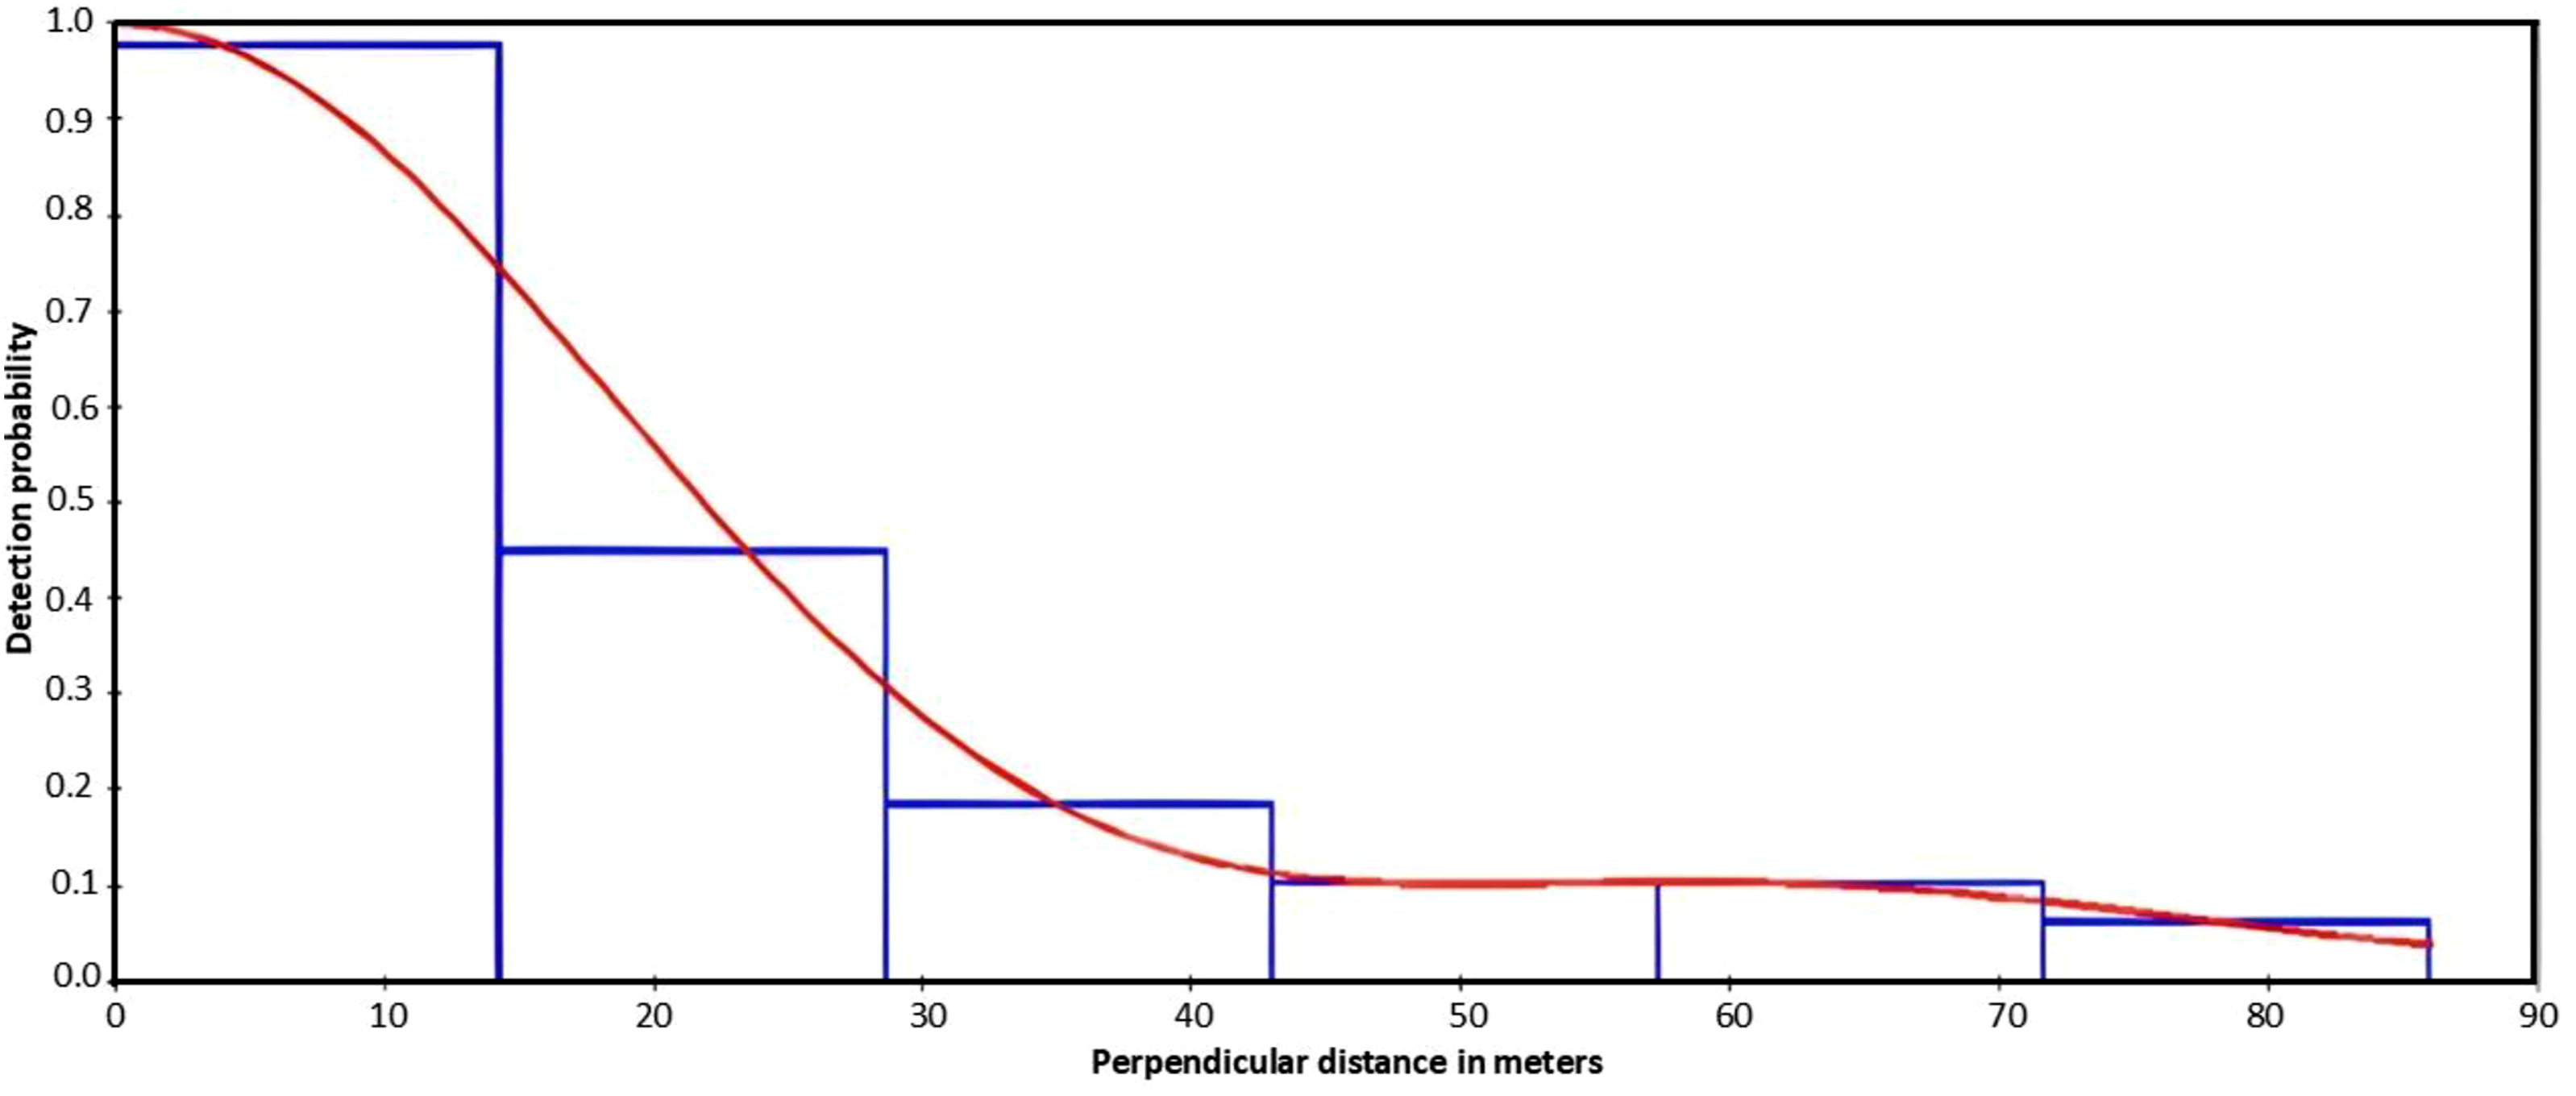

Warthog Detection Patterns
Parameter Estimates From Negative Binomial Generalized Linear Models Evaluating the Effects of Year, Burrow Abundance, and Human Disturbance on the Number of Warthog Sightings Recorded per Transect, With Transect Area Included as a Log-Offset

Estimates are presented with standard errors, z-values, and significance levels. Positive coefficients indicate increased warthog occurrence or abundance with increasing predictor values.
The number of burrows along transects was also positively and significantly associated with sightings (Table 4). Transects containing more burrows tended to yield more sightings, suggesting that burrow presence reflects habitat suitability or recent warthog activity. In contrast, human disturbance showed no significant effect on the number of sightings (Table 4). Although the coefficient for disturbance was negative, the effect size was small and statistically non-significant, indicating that the low-to-moderate levels of disturbance recorded did not strongly influence detection rates during surveys. Negative Binomial models provided a better fit than Poisson models, with lower AIC values and dispersion parameters close to 1, indicating that overdispersion was adequately accounted for (Table S2). Residual diagnostics showed no evidence of lack of fit or violation of model assumptions.
Patterns were similar also for the abundance of individuals recorded per transect: the year 2016 again showed a highly significant positive effect (z = 10.7, p < 0.001), with model estimates indicating that the number of individuals increased roughly 20–22 times compared to 2015. This substantial increase aligns with the descriptive data, which showed no individuals detected in several 2015 transects but consistently high counts in 2016. Burrow numbers were positively associated with the number of individuals (z = 2.2, p < 0.05), reinforcing the relationship between burrow presence and warthog abundance. As with the sightings model, human disturbance did not significantly influence the number of individuals (p > 0.50).
When cluster size was excluded from the MCDS models, the overall ranking and significance of other covariates remained largely unchanged. Burrow proximity remained the strongest predictor of warthog detections, with a hazard-rate regression coefficient of β = –0.35 ± 0.11 (z = –3.18, p = 0.001), indicating higher detection probability in areas closer to burrows. Distance to ponds (β = 0.21 ± 0.10, z = 2.10, p = 0.036) and distance to poaching locations (β = 0.17 ± 0.09, z = 1.89, p = 0.059) retained comparable effect sizes. Model fit metrics were similar to those of the original models including cluster size (AIC = 706.2), and χ2 goodness-of-fit remained acceptable (p = 0.68). These results indicate that the main ecological predictors influenced warthog detectability independently of group size.
Warthog Density Variations Across Africa
Summary of the Data Available on the Density of the Genus Phacochoerus Across Africa
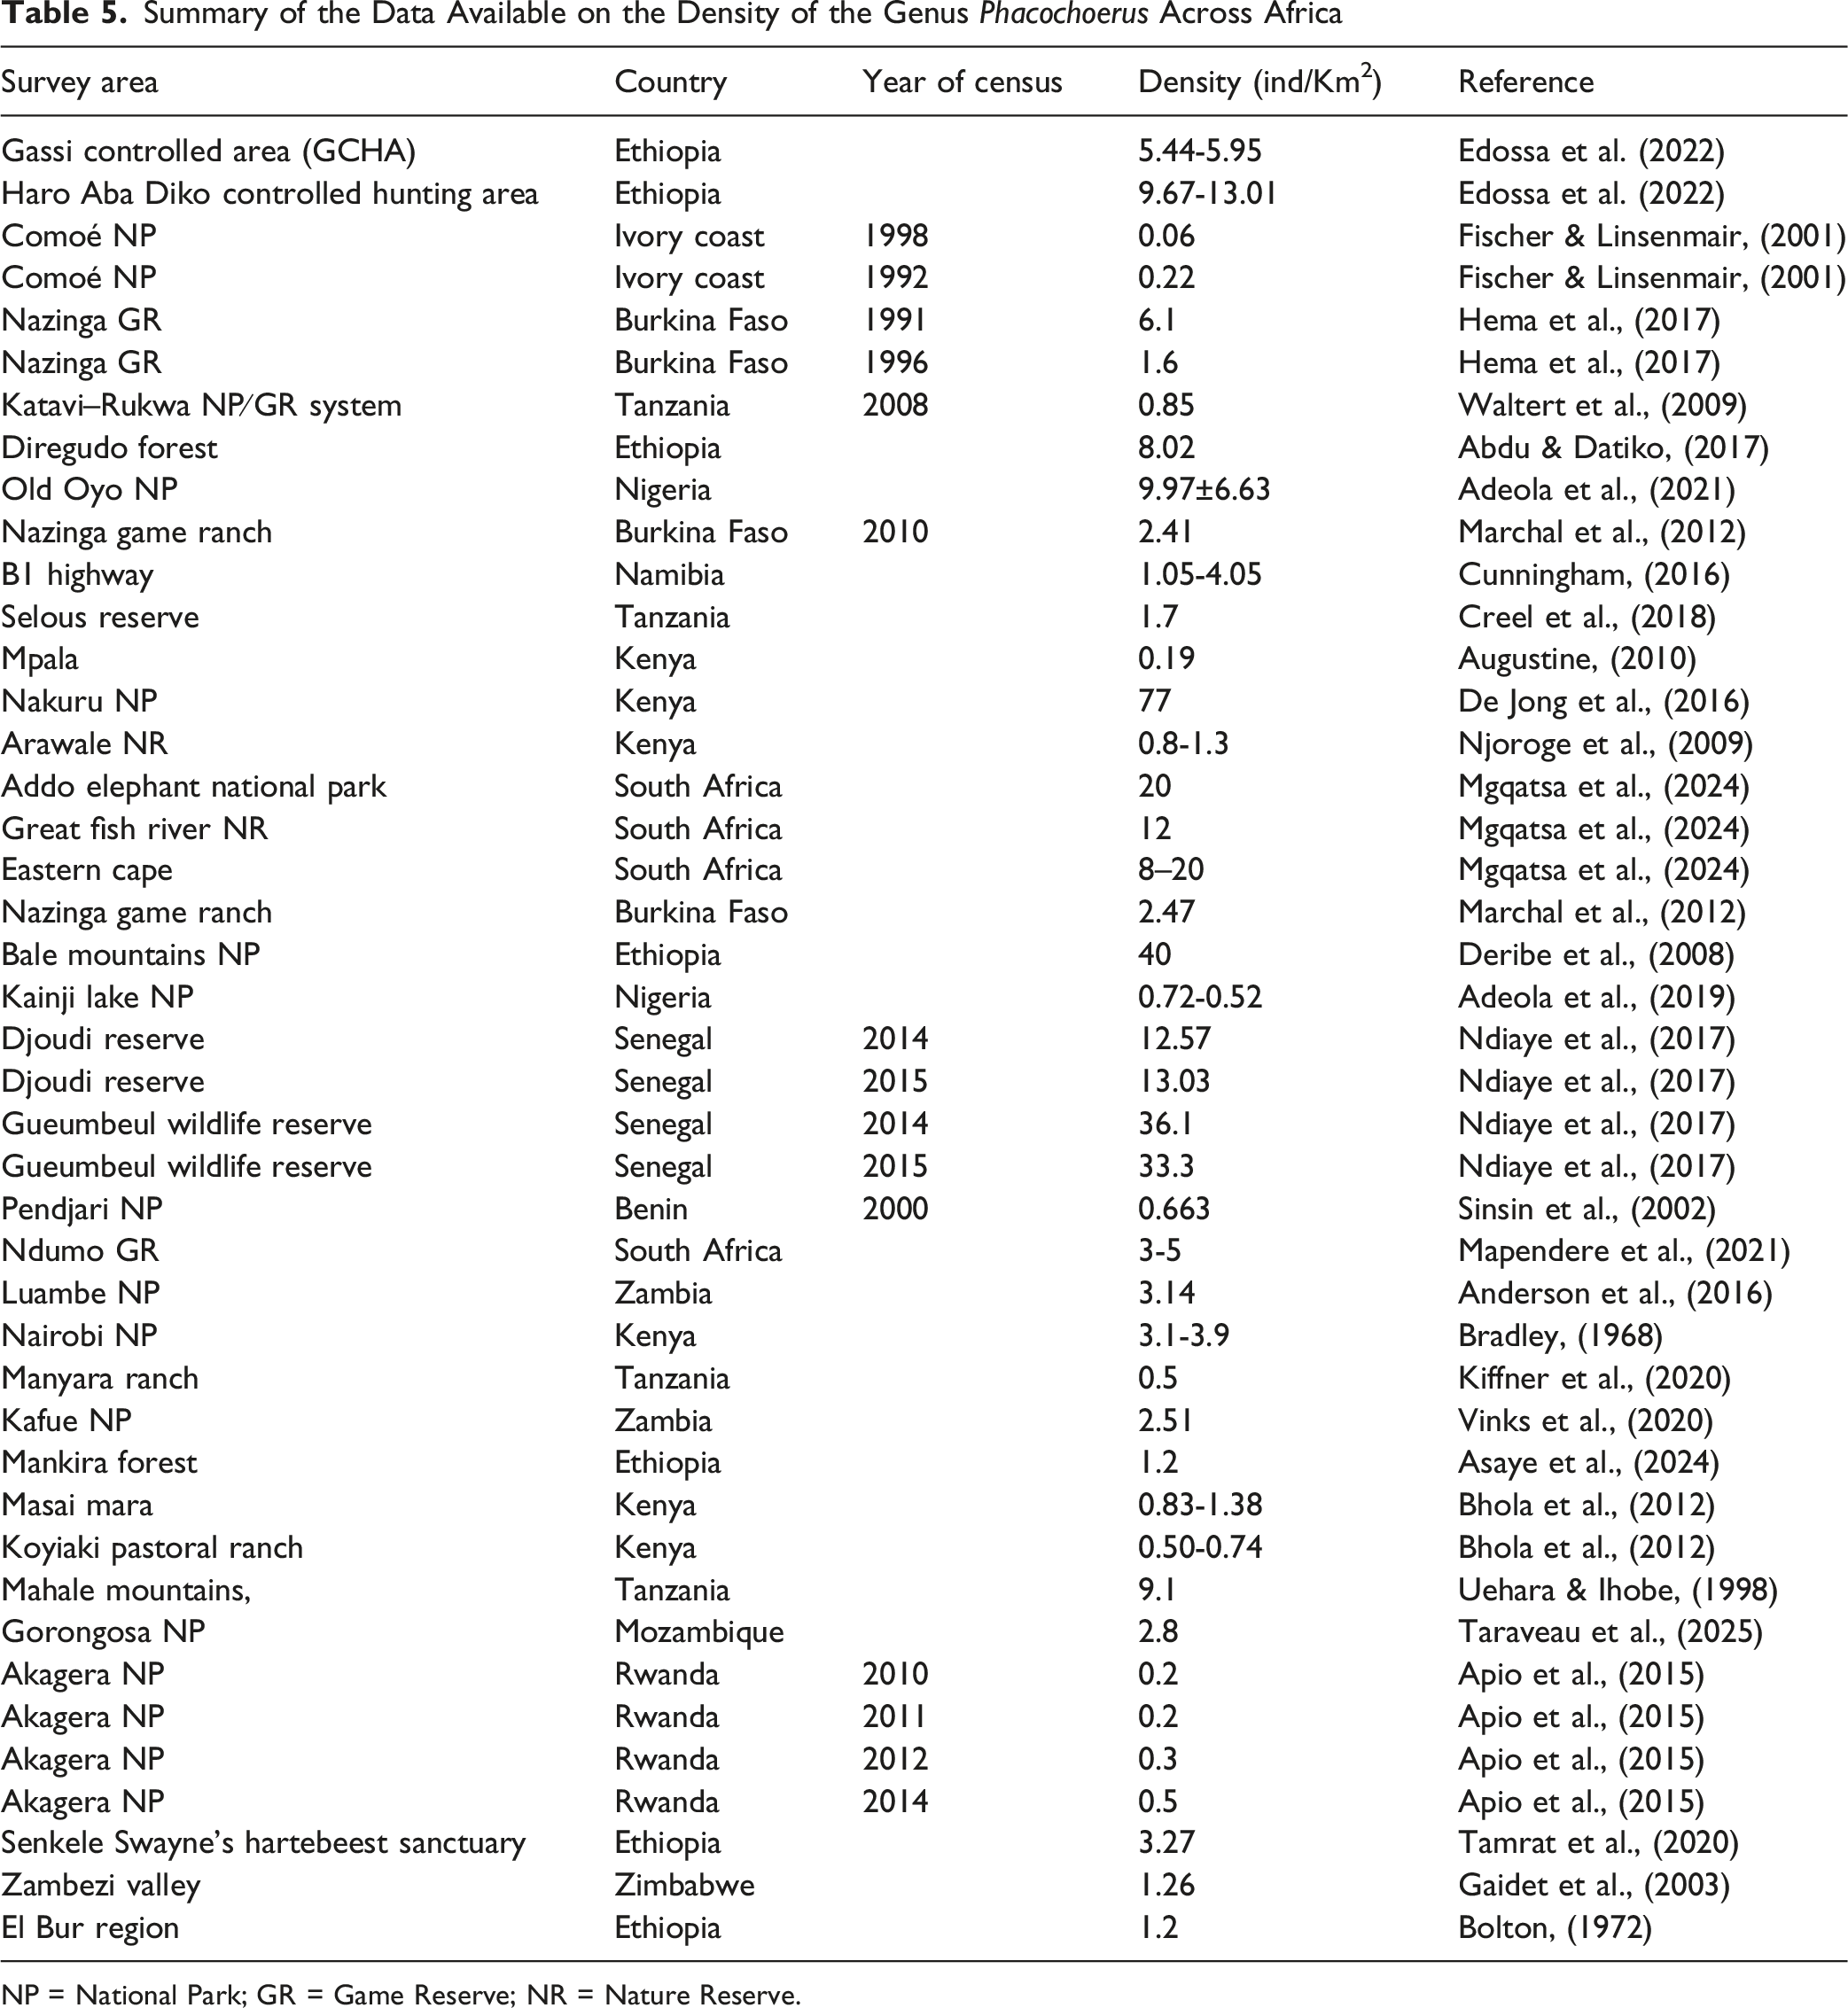
NP = National Park; GR = Game Reserve; NR = Nature Reserve.

Density comparisons (number of individuals per km2) of warthogs across Africa. Original references for the various data sources are given in Table 1
Mixed-Effects (GLMM) Model Results Testing the Effect of Country on Warthog Density, With Study Area Included as a Random Intercept. The Response Variable is Log-Transformed Density (Individuals/km2). Benin is the Reference Level

In this analysis, Benin was used as the reference country, meaning that all other countries’ coefficients represent the difference in log-density relative to Benin. Positive coefficients indicate densities higher than the Benin reference, whereas negative coefficients indicate densities lower than Benin. After accounting for study-area variation, most country effects were not statistically significant, although several showed substantial positive effect sizes. Senegal was the only country with a statistically significant positive effect, with a coefficient corresponding to an approximately 32-fold increase in expected warthog density relative to Benin (exp(3.459) = 31.8). South Africa showed a marginally non-significant positive effect, consistent with its higher observed densities, but variability among study areas reduced statistical confidence. Ethiopia, Kenya, Mozambique, Namibia, Nigeria, and Zambia also exhibited positive but non-significant coefficients, while Ivory Coast and Rwanda had negative coefficients, indicating lower densities than the Benin reference, though these were not statistically significant (Table 6).
Discussion
Estimating Abundance of Warthogs in Nimule National Park
Our DISTANCE sampling analysis based on line transects conducted in 2015–2016 estimated approximately 4,000 warthogs in the 256-km2 core zone. This estimate was substantially higher than the 2000 estimate of 265 individuals (Morjan et al., 2000), yet lower than the 1987 estimate of 7,449 individuals (Abdullah, 2015). Moreover, even within our two consecutive years of surveys, GLM analyses revealed a striking 16–22-fold increase in sightings and individual counts from 2015 to 2016 after accounting for transect area. The pronounced year-to-year differences observed in 1987, 2000, 2015 and 2016 likely reflect genuine historical fluctuations, influenced by post-2000 recovery following the major 2014 mortality event (Reuben et al., 2014), as well as the use of survey methods with varying levels of reliability. Although the precision of the 1987 and 2000 estimates was probably lower than that of the 2015–2016 survey, the magnitude of variation is substantial enough to suggest that these changes represent true interannual population fluctuations. This interpretation is further supported by the marked variation detected within the 2015–2016 period itself, for which identical, robust survey procedures and density-modelling techniques were applied. Overall, the evidence indicates that warthog populations in South Sudan exhibit pronounced year-to-year density fluctuations, as also observed in Burkina Faso (Hema et al., 2017).
Such annual fluctuations are common in savannah ungulates and often linked to rainfall, forage availability, and human pressures (James et al., 2022; Ogutu et al., 2008, 2014). Although habitat quality and rainfall were not directly quantified, environmental conditions in 2016 likely favoured higher warthog activity. Historical predator extirpation, including lions and leopards in the 1970s, may also have contributed to rapid population responses to favourable conditions.
In NNP, seasonal conditions strongly influenced detection rates. The highest encounter rates occurred in April 2016, coinciding with post-farrowing emergence and improved forage following early rains. In contrast, detection declined sharply in June 2016, when dense wet-season vegetation reduced visibility. These patterns demonstrate how vegetation phenology and climatic variability shape warthog detectability and distribution, emphasizing the need for carefully timed surveys. Comparable patterns have been documented elsewhere: in the Maasai Mara National Reserve (Kenya), the abundance of newborn warthogs was strongly correlated with rainfall over the preceding five to six months (Ogutu et al., 2008), and in the Dabena Valley Forest (Western Ethiopia), warthog densities varied both seasonally and spatially across study sites (Edossa et al., 2022).
The observed adult sex ratio was even, more consistent with selective poaching for meat rather than trophies, while piglets constituted 27% of observations, suggesting still strong recruitment in 2015-2016 after past mortality events. This contrasts with patterns seen in Tanzania, where die-offs disproportionately affected adults (Boshe, 1984; Creel, 2005). Overall, these results highlight the sensitivity of warthog populations to short-term environmental variation and reinforce the importance of multi-year monitoring to capture population dynamics.
During the civil war in South Sudan (1983–2005), the management and conservation of warthog populations, alongside other wildlife species, were severely neglected. In the absence of effective wildlife management and regulatory oversight, uncontrolled hunting emerged as a significant threat, primarily driven by the demand for bushmeat among local communities, armed groups, and parties involved in the conflict (https://www.aa.com.tr/en/africa/famine-war-forces-south-sudan-to-go-for-bushmeat/773481, last accessed 20th December 2025). Consequently, it is highly probable that substantial numbers of warthogs were lost or became locally extirpated during this period, although precise population estimates remain unavailable due to the breakdown of monitoring systems and the widespread insecurity caused by the civil war. This unregulated exploitation likely had cascading ecological impacts, affecting both predator-prey dynamics and the broader ecosystem stability in affected regions.
Ecological Factors Influencing Occurrence and Abundance
In NNP, burrow availability emerged as a key determinant of both warthog sightings and individual abundance. Active burrows, including termite mound dens and shallow pits beneath shrubs or trees, were concentrated in the southern and south-eastern portions of the park (our unpublished data). Shallow pits became more common following fires or during dry periods, likely reflecting thermoregulatory adaptation in the absence of deeper burrows. This mirrors findings from other East African ecosystems, where warthog distribution is closely tied to abandoned aardvark (Orycteropus afer) burrows (Treydte et al., 2006). In NNP, burrow density effectively indicates habitat suitability and recent activity, reinforcing its ecological significance.
Influence of Human Disturbance
Contrary to expectations, human disturbance did not significantly affect warthog abundance or sightings in NNP. Several factors may explain this pattern. First, the intensity of recorded disturbance was likely below the species’ tolerance threshold; warthogs are behaviourally flexible and can coexist with moderate human presence (Edossa et al., 2020; Hjertlöv, 2015). Second, temporal avoidance, adjusting activity schedules rather than spatial displacement, may have reduced detectability of disturbance effects (Gaynor et al., 2018). Third, the pronounced interannual variation in abundance, particularly the sharp increase in 2016, may have obscured subtle effects of human disturbance. Large year-to-year population fluctuations can introduce variance far greater than that associated with localized disturbance, effectively increasing “noise” in the data and making it difficult for models to detect weaker drivers. In 2016, the population surge likely generated spatial patterns dominated by expansion, including broader habitat use, higher encounter rates across all areas, and reduced differentiation between disturbed and undisturbed sites. Such expansion can lead to spillover into previously avoided areas, further diluting behavioural avoidance signals. Consequently, predictors related to disturbance become relatively weak compared with the overriding effect of population growth, causing demographic shifts to mask smaller behavioural or distributional responses and resulting in non-significant statistical effects. Nonetheless, this does not imply that human activity is inconsequential; even low-to-moderate disturbance, particularly snare-based poaching, remains non-selective and could have significant impacts on long-term population dynamics (Denny et al., 2025).
Density Variability Across Africa
Compared to other African landscapes (43 sites across multiple countries), the estimated warthog density in NNP for 2015–2016 was relatively high, indicating that its conservation status remains favourable. Country-level patterns in warthog density, as revealed by our GLMM analyses, were largely overshadowed by local, site-specific effects. For example, although Senegal exhibited significantly higher densities than Benin, most country-level differences were not statistically significant once intra-country heterogeneity was accounted for. This highlights that fine-scale ecological conditions and local management practices, rather than broad geographic context, are the primary determinants of warthog densities. Consistent with this, Hema et al. (2017) demonstrated that in Burkina Faso, management type directly influenced warthog population size over the period 1985–2012. Notably, shifts between autonomous and centralized management phases likely affected conservation activities, particularly anti-poaching measures, thereby influencing warthog abundances and densities over time. However, it should be noted that the studies included in the GLMM analysis differed in their statistical methodologies (though DISTANCE sampling was widely applied), introducing the possibility of some bias in cross-site comparisons.
Implications for Conservation
The relatively high warthog density recorded in Nimule National Park (NNP) during the 2015–2016 survey period suggests that, at that time, the park functioned as an important refuge for the species in South Sudan. However, the marked interannual variation observed between 2015 and 2016, together with fluctuations reported in earlier accounts, underscores the importance of multi-year monitoring. Single-season assessments may provide only a snapshot of population status and risk misrepresenting longer-term demographic trends. Moreover, because these data were collected a decade ago, current conditions may differ due to changes in climate, land use, protection effectiveness, wildlife movements, or human activities. The estimates presented here should therefore be interpreted as a historical baseline against which contemporary and future surveys can be compared.
Burrow availability emerged as a key predictor of warthog occurrence and abundance (and this finding has unlikely changed in recent years), highlighting the conservation value of habitats that facilitate burrow formation, such as termite mound complexes, lightly wooded savannahs, and fire-influenced areas. Management interventions that degrade these habitats or intensify late-dry-season fires could consequently have disproportionate negative impacts on local populations. Although human disturbance was not statistically significant during the 2015–2016 study period, this finding should not be interpreted as evidence of negligible risk. The region’s history of armed conflict and bushmeat hunting indicates that warthog populations may decline rapidly if protection weakens. In addition, the concentration of individuals in riverine areas during drought periods may increase susceptibility to localized hunting pressure, reinforcing the importance of targeted anti-poaching patrols and the protection of dry-season refugia.
Overall, while the study period indicated favourable conditions for warthogs in NNP in 2015-2016, sustained local management, habitat protection, and continued application of standardized monitoring protocols will be essential to evaluate temporal changes and to maintain—or restore, if necessary—the park’s conservation status under potentially shifting ecological and socio-political conditions.
Supplemental Material
Supplemental material - Predictors of Warthog Abundance and Sightings in Nimule National Park (South Sudan), with a Continental Review of Population Densities
Supplemental material for Predictors of Warthog Abundance and Sightings in Nimule National Park (South Sudan), with a Continental Review of Population Densities by Majango Jambo Gonja Wura, Malik Doka Morjan, Thomas Francis Lado, Fabio Petrozzi, Gift Simon Sarafadin Demaya, Luca Luiselli in Tropical Conservation Science
Footnotes
Funding
Support for this study was provided by the University of Juba and the United States Agency for International Development (USAID) under the Feed the Future initiative CGIAR Fund, award BFS-G-11-00002 and the Food Security and Crisis Mitigation II grant (award EEM-G-00-04-00013). LL research in South Sudan was supported by National Geographic, Mohamed Bin Zayed Species Conservation Fund, IDECC, Turtle Survival Alliance, USAID, and Rainforest Trust. Gratitude is extended to Paul Peter Awol for research problem identification and access, and to Dean Stauffer for guidance in DISTANCE data analysis.
Declaration of Conflicting Interests
The authors declared no potential conflicts of interest with respect to the research, authorship, and/or publication of this article.
Supplemental Material
Supplemental material is available online.
References
Supplementary Material
Please find the following supplemental material available below.
For Open Access articles published under a Creative Commons License, all supplemental material carries the same license as the article it is associated with.
For non-Open Access articles published, all supplemental material carries a non-exclusive license, and permission requests for re-use of supplemental material or any part of supplemental material shall be sent directly to the copyright owner as specified in the copyright notice associated with the article.