
Abstract
Covering the largest sample of countries to date, this study examines the effect of three country-specific factors on the tone of electoral campaigns across Europe: electoral system disproportionality, party system fragmentation, and the polarization of the electorate. We use an original dataset of statements made by political actors during eighteen electoral campaigns in nine European countries. Our multinomial logit model suggests that increasing disproportionality slightly increases negativity, while thanks to parties competing on the same market, less polarized electorates invite more negative political campaigns. Finally, we find a U-shaped relationship between party system fragmentation and negativity: Increasing the number of parties, negativity decreases first, only to start increasing again once the party system becomes very fragmented. We explain this with parties altering their coalition strategies with the changing number of parties: Less fragmentation makes it more likely to having to step into coalition with the competitors, thus decreasing negativity, while in very fragmented systems, parties not needed to any potential coalitions become easy targets to negative campaign.
Introduction
Negative campaigning is considered a campaign technique that is built on attacking political competitors along the lines of their personality, views, or performance. Although negative campaigning faces considerable criticism, it is considered a viable and regularly used strategy among political parties, and the literature discusses its effects a great deal.
It has been shown that negative messages depress turnout (Ansolabehere and Iyengar 1995; Ansolabehere et al. 1994), reduce trust and interest in politics and increase cynicism (Cappella and Jamieson 1997), polarize voters (Ansolabehere and Iyengar 1995), and cause decline in campaign discourse (Jamieson 1992). On the other hand, there is also substantial evidence to the contrary (Lau et al. 2007). The literature suggests that the decline in turnout is not that severe as initially thought (Brooks 2006; Wattenberg and Brians 1999), the exposure to negative messages mobilizes voters (Brooks and Geer 2007; Freedman and Goldstein 1999; Jackson and Carsey 2007), and negative messages are not only more informative than positive ones (Mark 2009), but they encourage voters to seek out additional information about the candidates (Marcus et al. 2000). It seems that regarding its effects, negativity is neither specifically good nor bad, but it definitely influences various aspects of politics. Keeping this in mind, it is of great importance that we identify circumstances under which negative campaign prevails.
The literature generally focuses on single-country cases, covering only one or few elections. Up to now, there have been very few comparative studies about negative campaigning, and existing work is typically restricted to a maximum of three counties (see, for example, Desposato 2008; Vliegenthart et al. 2011; Walter 2014a). In addition, despite the fact that negativity is not only characteristic to the United States, the vast majority of the studies address the issue of negative campaigning in the context of the U.S. elections, which leads to a one-sided development of theories in the field (Walter 2014a: 43). Due to the limited number of cases in the studies, authors rarely make inference on the effects of factors measured on the level of countries, such as party system characteristics or political system features.
Thus, it remains unexploited, what is suggested by anecdotal evidence, namely, that the tone of political campaigns shows considerable variation across countries: In some countries, the dominant style of political communication is rather moderate, while in other countries, a sharper style of communication prevails. The question is if these differences are systematic, or only occur by chance. This article aims to fill this gap and tests whether key country-level factors such as the disproportionality of the electoral system, party system fragmentation, and the polarization of the electorate affect negativity. While answering the main question, our data also offers an opportunity to investigate whether micro-level theories widely discussed in the literature can travel to political contexts outside the United States.
The reason for neglecting the country-level driving factors of negative campaigning lies most probably in the lack of comparative data: The construction of campaign datasets is extremely time and effort intensive, and data collection can hardly be carried out without—preferably—native country expert coders. The Comparative Campaign Dynamics Dataset (Debus et al. 2016) overcomes this obstacle by describing electoral campaigns based on a standardized coding scheme in nine European countries (the Czech Republic, Denmark, Germany, Hungary, the Netherlands, Poland, Portugal, Sweden, and the United Kingdom) at two elections each, covering the widest range of cases as of yet. The sample is sufficiently large to test not only party- but also system-level hypotheses, which strongly contributes to the understanding of negative campaigning in a comparative context. Furthermore, as the dataset uses articles to get a picture of campaigns, we also obtain knowledge on the newspaper coverage of election campaigns with respect to the tone of political messages. This is particularly important, because voters are most likely to follow the campaign from the media, and thus media influences voting decisions by highlighting certain topics or tone, while smothering others.
Negative Campaigning
Negative campaigning has long been considered an attractive strategy of gaining attention, media coverage, and votes. In recent years, the increase in negativity is registered not only in the United States (Fowler and Ridout 2013; Geer 2012; Jamieson et al. 2000; Johnston and Kaid 2002) but also worldwide (Ceron and d’Adda 2016; Curini 2011; Momoc 2010; Sullivan 2008, 2009). Although voters may not find negativity appealing (Carraro et al. 2010; Fridkin and Kenney 2011; Jasperson and Fan 2002), and the evidence about the effectiveness of negative campaigns is mixed, there are some reasons for parties to apply this strategy.
First of all, negative campaign messages are considered to be more memorable (Fridkin and Kenney 2011; Lau 1985; Perloff and Kinsey 1992). Second, they are sometimes the only tool for competitors to draw voter and media attention (Nooy and Kleinnijenhuis 2013). Mark (2009) suggests that while incumbents might want to campaign with positive messages, challengers have no other choice but to criticize incumbent parties to point out the flaws in policies and offer alternatives. Third, Mattes and Redlawsk (2015) argue that voters are not always negative about negativity. While personal attack is likely to backfire, voters accept negativity about party programs or ideological positions (Carraro and Castelli 2010). Mark (2009) argues that if they are presented “in a factual manner,” voters value information on differences between parties, and establishing clear differences between competitors is easily done by applying negativity. Furthermore, contrary to positive messages (Mark 2009) by providing valuable information, negative ads significantly lower the information cost of voting (Fridkin and Kenney 2011; Geer 2006; Mattes and Redlawsk 2015; Sullivan 2009).
Anyhow, negative campaigning is a strategic decision based on its expected utility relative to the possible downsides (Peterson and Djupe 2005). The utility of such strategies often depends on institutions and the political context. Under certain circumstances, negative campaign tone pays off, while under different incentives parties have to refrain from attacking others.
Moreover, while the communication strategy of the sender of a certain message is crucial, the tone of campaigns is also dependent on how the media select and interpret party messages. Therefore, the level of negativity in a country is very well the function of some macro-level characteristics combined with party-level features. Due to the lack of comparative data, however, when studying the determinants of negative campaigning, the literature discusses mostly micro-level (candidate-, party-, and campaign-level) features, and country-level explanatory factors have remained out of the reach of investigation. Therefore, any study that wishes to theorize the effect of country-level factors on negative campaigning can only rely on very few comparative works and the often-contradicting results of single-country studies.
The Effect of Country-Level Features on Negative Campaigning
The electoral system, and particularly its capacity to produce proportional results, is one of the most important features of a country’s political system that is interrelated with a fairly large number of institutional characteristics from the number and size of parties through the practice of governing in coalition to eventually the type of democracy. Due to the dominance of single-country studies in the field, our knowledge about how electoral rules may affect campaign negativity is limited to say the least.
The most important feature of majority electoral systems is that they “provide a winner’s bonus for the party in first place, while penalizing others” (Norris 1997: 307), and sometimes leaving the supporters of small parties with no representation. It has been shown that in a majority electoral system, which is characterized by disproportional electoral results, a party winning 37.5 percent of the votes could secure the majority of seats in parliament, while in a proportional system, it would need the 46.3 percent of the votes (Lijphart 1994; Norris 1997). These numbers suggest that not only can winners win big, but losers become also seriously underrepresented in majority systems. Under such circumstances, prospective winners and losers are both encouraged to pursue negative campaigns. The more disproportional the electoral system, the larger the benefit for winners, and thus, the more important it is for small parties to somehow lessen this advantage. Winners send negative messages on competitors to ensure majority in parliament in the first place and to maximize this majority as a bonus. Losers instead (or small parties) must send negative messages to the voters on winners (or large parties) to lessen the winning margin of the latter, and decrease their own disadvantage that originates from disproportionality.
Moving on, parties have to take coalition strategies into account when setting the tone of their campaigns. As Walter and Van der Brug (2013) and Hansen and Pedersen (2008) highlight, in a multi-party context, where coalition governments prevail, negative advertising might be beneficial to maximize votes, but it is not an effective office-seeking strategy. Going negative against prospective coalition partners is unproductive, as it makes the future cooperation difficult, and reduces the chances of the sender to be included in a governing coalition. Moreover, multi-party contexts offer fewer incentives to use negativity. In a two-party system, negative campaign yields votes to the sender, or alternatively, decreases the mobilization potential of the competitor. However, in a multi-party system, demobilizing the target party’s voting base does not automatically guarantee a larger vote share (Hansen and Pedersen 2008; Ridout and Walter 2015; Walter and Van der Brug 2013).
Nevertheless, the literature also makes a contradicting argument in connection with the effect of party system fragmentation. Evidence suggests that the higher the number of quality competitors (Peterson and Djupe 2005), and the more close the race, the more parties are willing to go negative (Desposato 2008; Hale et al. 1996; Wicks and Souley 2003). Others, on the other hand, find no evidence regarding fragmentation (Walter et al. 2014). Based on these, we argue that the effect of party system fragmentation is not linear. To ensure the continuity of governance parties should minimize the potential for conflict within the coalition. All else being equal, the potential for conflict is the smallest with the smallest number of parties participating in the coalition that still has a stable majority. Thus, one could expect that the incentive for negativity decreases with the increasing number of parties in the party system only up to the point where it gets too fragmented to maintain stable coalitions. After this point, more parties produce more negativity, as there are more parties that are not needed in a coalition.
The previous two factors touch on the features of the political system. However, campaigns may also align to certain characteristics of the electorate—which of course are hardly independent from political system features. Studies about the United States recurrently find evidence to a growing level of polarization between Democrats and Republicans, and some scholars link increasing negative campaigning to growing ideological divisions (Geer 2006; Hetherington 2008). Nevertheless, European democracies are characterized by multi-party competition, where the effect of polarization on negativity gets a spin.
Spatial models of rational choice theory suggest that in less polarized political systems, parties are ideologically more similar than under more polarization simply because they have “less space” to spread across. For parties that have ideologically similar competitors, it is crucial to differentiate themselves from others; otherwise, it is difficult for voters to tell the difference between parties. If parties seem similar to voters, there is nothing keeping them from switching parties. In such situations, one option for parties to keep their voters away from competitors is to go negative against ideologically similar parties, to help establish an “us and them” narrative. Attacking competitors along valence characteristics creates a moral advantage, which can be crucial when there are otherwise little differences between parties (Carraro et al. 2010; Curini 2011; Curini and Martelli 2010). Thus, in countries where the electorate is not polarized, in other words, where parties have to compete for the votes of the same voters (Doron and On 1983), negativity is expected to increase. Conversely, with increasing polarization, the market for votes spreads out, which makes negativity unnecessary as there is no overlap between the “hunting grounds” of the competing parties.
Using data from Dutch electoral campaigns, Walter (2014b) shows that ideologically proximate parties are indeed more likely targets of negative messages, and Curini (2011) comes to similar conclusions analyzing data from Italy and Japan. Thus, we argue that in a European context characterized by multi-party competition, the prevalence of negativity is lower in ideologically more polarized countries.
Data and Variables
The analysis relies on a content analysis of newspaper articles covering a one-month period before the national elections in nine European countries. Consequently, it focuses on a period of intense campaigning and high media attention on politics. The data are taken from the Comparative Campaign Dynamics Dataset (Debus et al. 2016), which codes a text corpus that includes front page articles and a random 5 percent sample of all election-related articles (but at least sixty) from a right- and a left-leaning daily newspaper in each participating country. Newspapers are selected by teams of country-experts. The sample covers nine countries, eighteen elections, and 1,128 articles, and includes elections between 2005 and 2014. Table 1 contains the list of participating countries, elections, and newspapers.
The List of Participating Countries, Elections, and Newspapers.
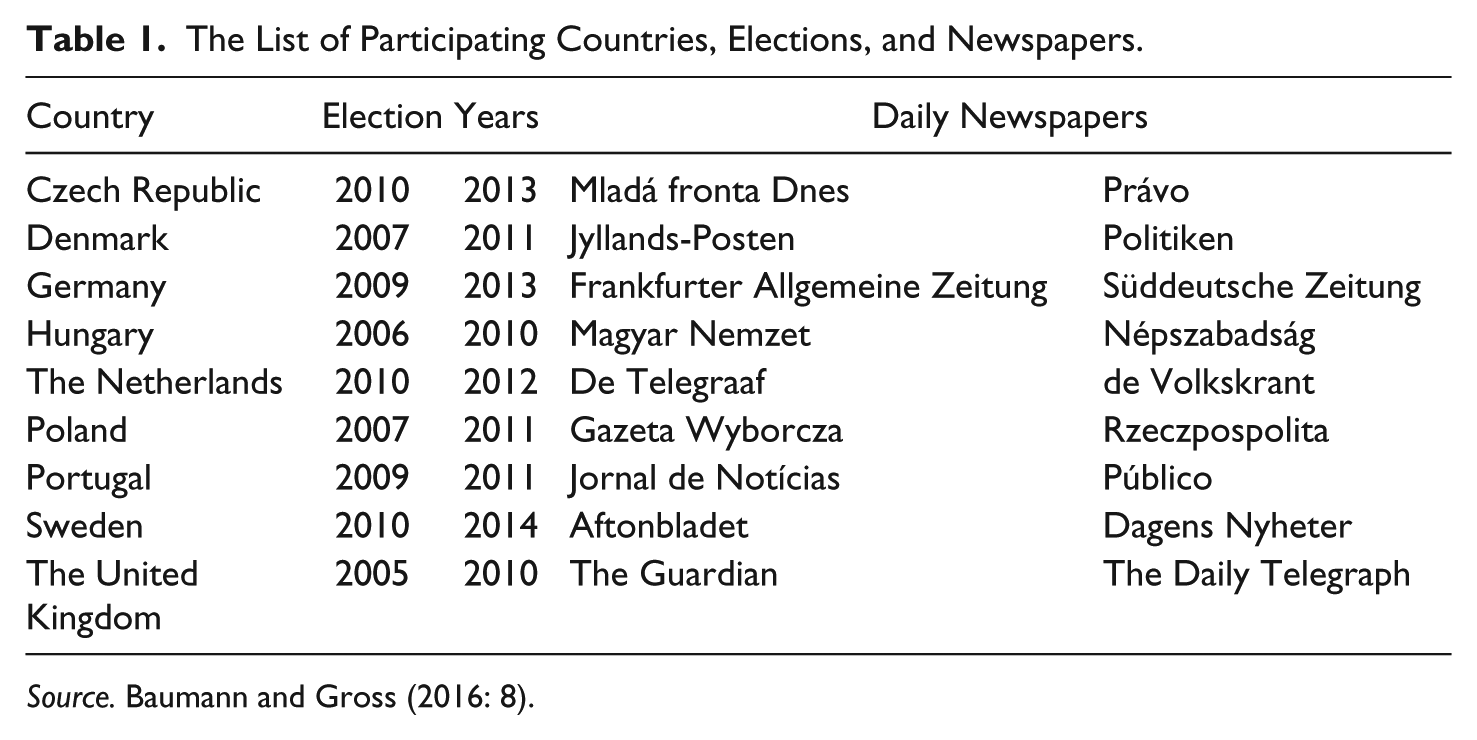
Source. Baumann and Gross (2016: 8).
Articles were independently coded by native undergraduate and graduate students, three in each country. Coding units were statements that parties made about themselves and their competitors. Each article was coded as many times as there were parties mentioning other parties or themselves in the article. Following the classification of Stokes (1963: 373), statements were categorized into two groups. While “position issues” include policy-related statements about the target party’s policy positions, pledges, or decisions, “valence evaluations” are non-policy-related or unspecified evaluations about the competence, performance, integrity, honesty, and so on, of the targeted party or politician.
To ensure reliability, coders were asked to indicate how confident they were about their coding decisions by using a scale of “fully confident,” “somewhat confident,” or “not confident.” The final dataset only includes statements that have been (1) unanimously coded by the three coders regardless the level of confidence in their coding decisions, (2) unanimously coded by two coders who were at least “somewhat confident” in their decisions, and (3) coded by one coder who was “fully confident” in her coding decision. For more details on the data, see Baumann and Gross (2016).
Dependent Variable (DV)
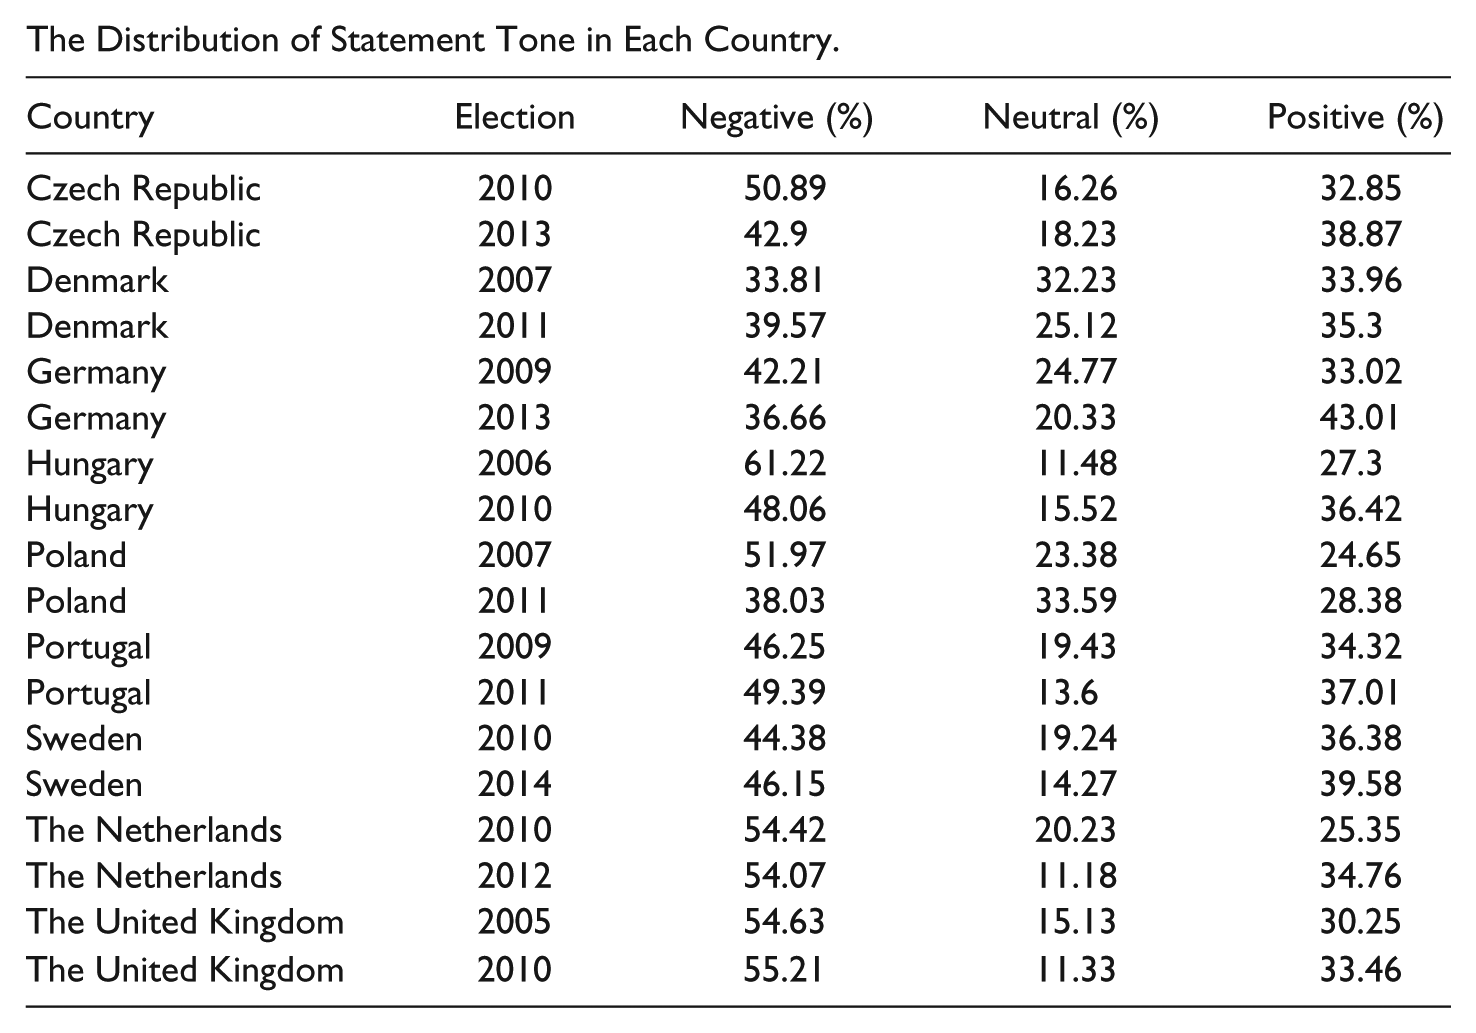
In our article, we test the effects of electoral system disproportionality, party system fragmentation, and the polarization of the electorate on campaign negativity. The DV Statement tone is measured on a nominal scale and differentiates between (1) negative, (2) neutral, and (3) positive tones. Negative and positive tones indicate negative or positive evaluations about the target. Neutral tone is used when the party/politician mentioned another political actor or itself without any evaluating statement, or when the direction of the statement was not clearly detectable. In total, 46.8 percent of all the statements are negative, 19.4 percent neutral, and 33.8 percent positive. For the country-level distribution of statement tone, see Appendix A. Out of the nine countries in our sample, parties in Denmark and Germany pursue the least negative campaigns, while the proportion of negative statements was the largest in the cases of Hungary, the United Kingdom, and the Netherlands. In some countries, the prevalence of negativity considerably varies from one election to the other: The difference between the share of negative statements at the two elections exceeds 10 percentage points both in Hungary and Poland.
Independent Variables
First, to measure the disproportionality of the electoral system, we use the Gallagher index, which shows the aggregate difference between votes cast for the parties and the number of seats the parties won in parliament. The index ranges from 0 to 100, where larger numbers indicate more disproportionality. This variable is borrowed from the Comparative Political Data Set (CPDS; Armingeon et al. 2016). Second, to control for party system fragmentation, we include the CPDS variable on the effective number of parties at the elections calculated based on Laakso and Taagepera (1979). To account for the nonlinear effect of this variable, we include its squared form into our model. Third, to measure the polarization of the electorate, we use the left-right variable (0–10) from the European Social Survey (Norwegian Centre for Research Data 2014), and calculate the distance of medians of left- (0–4) and right-wing (6–10) blocks in each country. Respondents who put themselves to the middle (five) are excluded.
Pearson correlation coefficients reveal only moderate relationships between the independent variables. As one can expect, the correlation between the effective number of parties and electoral system disproportionality is the largest (r = −.39; p = .00) but still not substantial. 1 The relationship between the effective number of parties and the polarization of the electorate is also significant but remains at a very low level (r = .06; p = .00). Finally, there is no significant connection between electoral system disproportionality and polarization (r = −.01; p = .09).
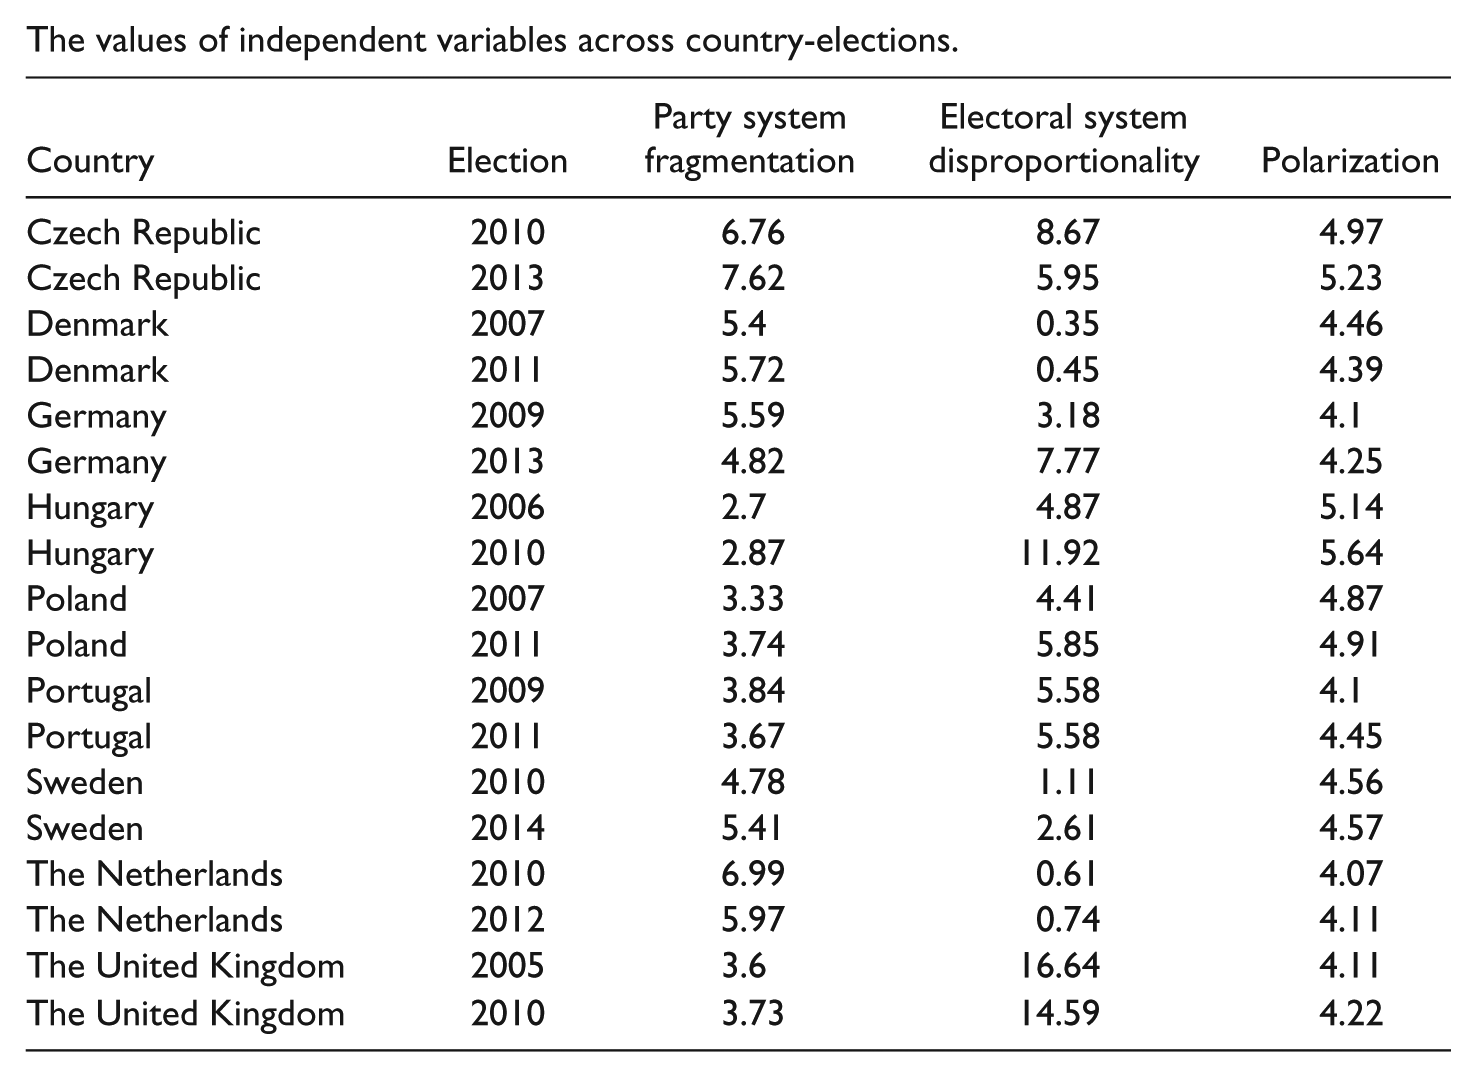
As shown by Appendix B, the values of the independent variables vary both across countries and—to a smaller extent—elections within countries. The most fragmented party systems are the Czech Republic and the Netherlands, while the 2011 Danish election also scored in the highest quartile (>5.68). In addition, the effective number of parties is higher than the average in Germany (both elections), Denmark in 2007, and the 2014 Swedish election. As to the disproportionality of the electoral system, it is no surprise that the United Kingdom’s first-past-the-post system scored the highest. Both mixed-member systems, Germany and Hungary produced relatively disproportional results in 2013 and 2010, respectively. Interestingly, these systems show also the largest level of fluctuations: In both countries, the results of the other election (2009 and 2006) in the sample are considerably more proportional, not even reaching the mean value of the index (5.6). In the case of the polarization of the electorate, we do not see big differences within countries. The electorates of the three Eastern European countries (the Czech Republic, Hungary, and Poland) are the most polarized along the left-right scale, but Sweden scores also above the average (>4.56).
Control Variables
To be able to show the net effect of macro-level factors, we include several control variables into our model. We control for the “usual suspects” of the literature and for variables that are specific to our data. When studying the determinants of negative campaigning, the literature discusses mostly micro-level (candidate-, party-, and campaign-level) features. Micro-level factors are generally broken down into sender- and target-level characteristics. Sender-level characteristics are features of parties who use negativity as a campaign tool, while target-level characteristics are properties of parties who get attacked. In our article, the focus is on the circumstances under which parties may opt for negativity. As our question concerns the behavior of the “active participant,” and not the target of negativity, we take only contextual and sender-level variables into account.
First and foremost, we control for whether the statement was made about another party (0–1). In addition, we include government status (0 = challenger, 1 = government). The literature suggests that incumbents tend to focus on the achievements of the previous electoral term, while challengers try to point out the flaws of incumbents (see, among others, Elmelund-Præstekær2010; Hale et al., 1996; Nooy and Kleinnijenhuis 2013; Sullivan and Sapir 2012; Theilmann and Wilhite 1998; Walter 2014b). Party size is measured with the share of seats the party held at the previous parliament. Skaperdas and Grofman (1995) argues that small parties are more likely to attack large ones, while others find no effect (Nooy and Kleinnijenhuis 2013; Walter and Van der Brug 2013). A further important factor in the literature is time until the election. It is argued that with the elections approaching, the incentive to go negative increases (Damore 2002; Haynes and Rhine 1998).
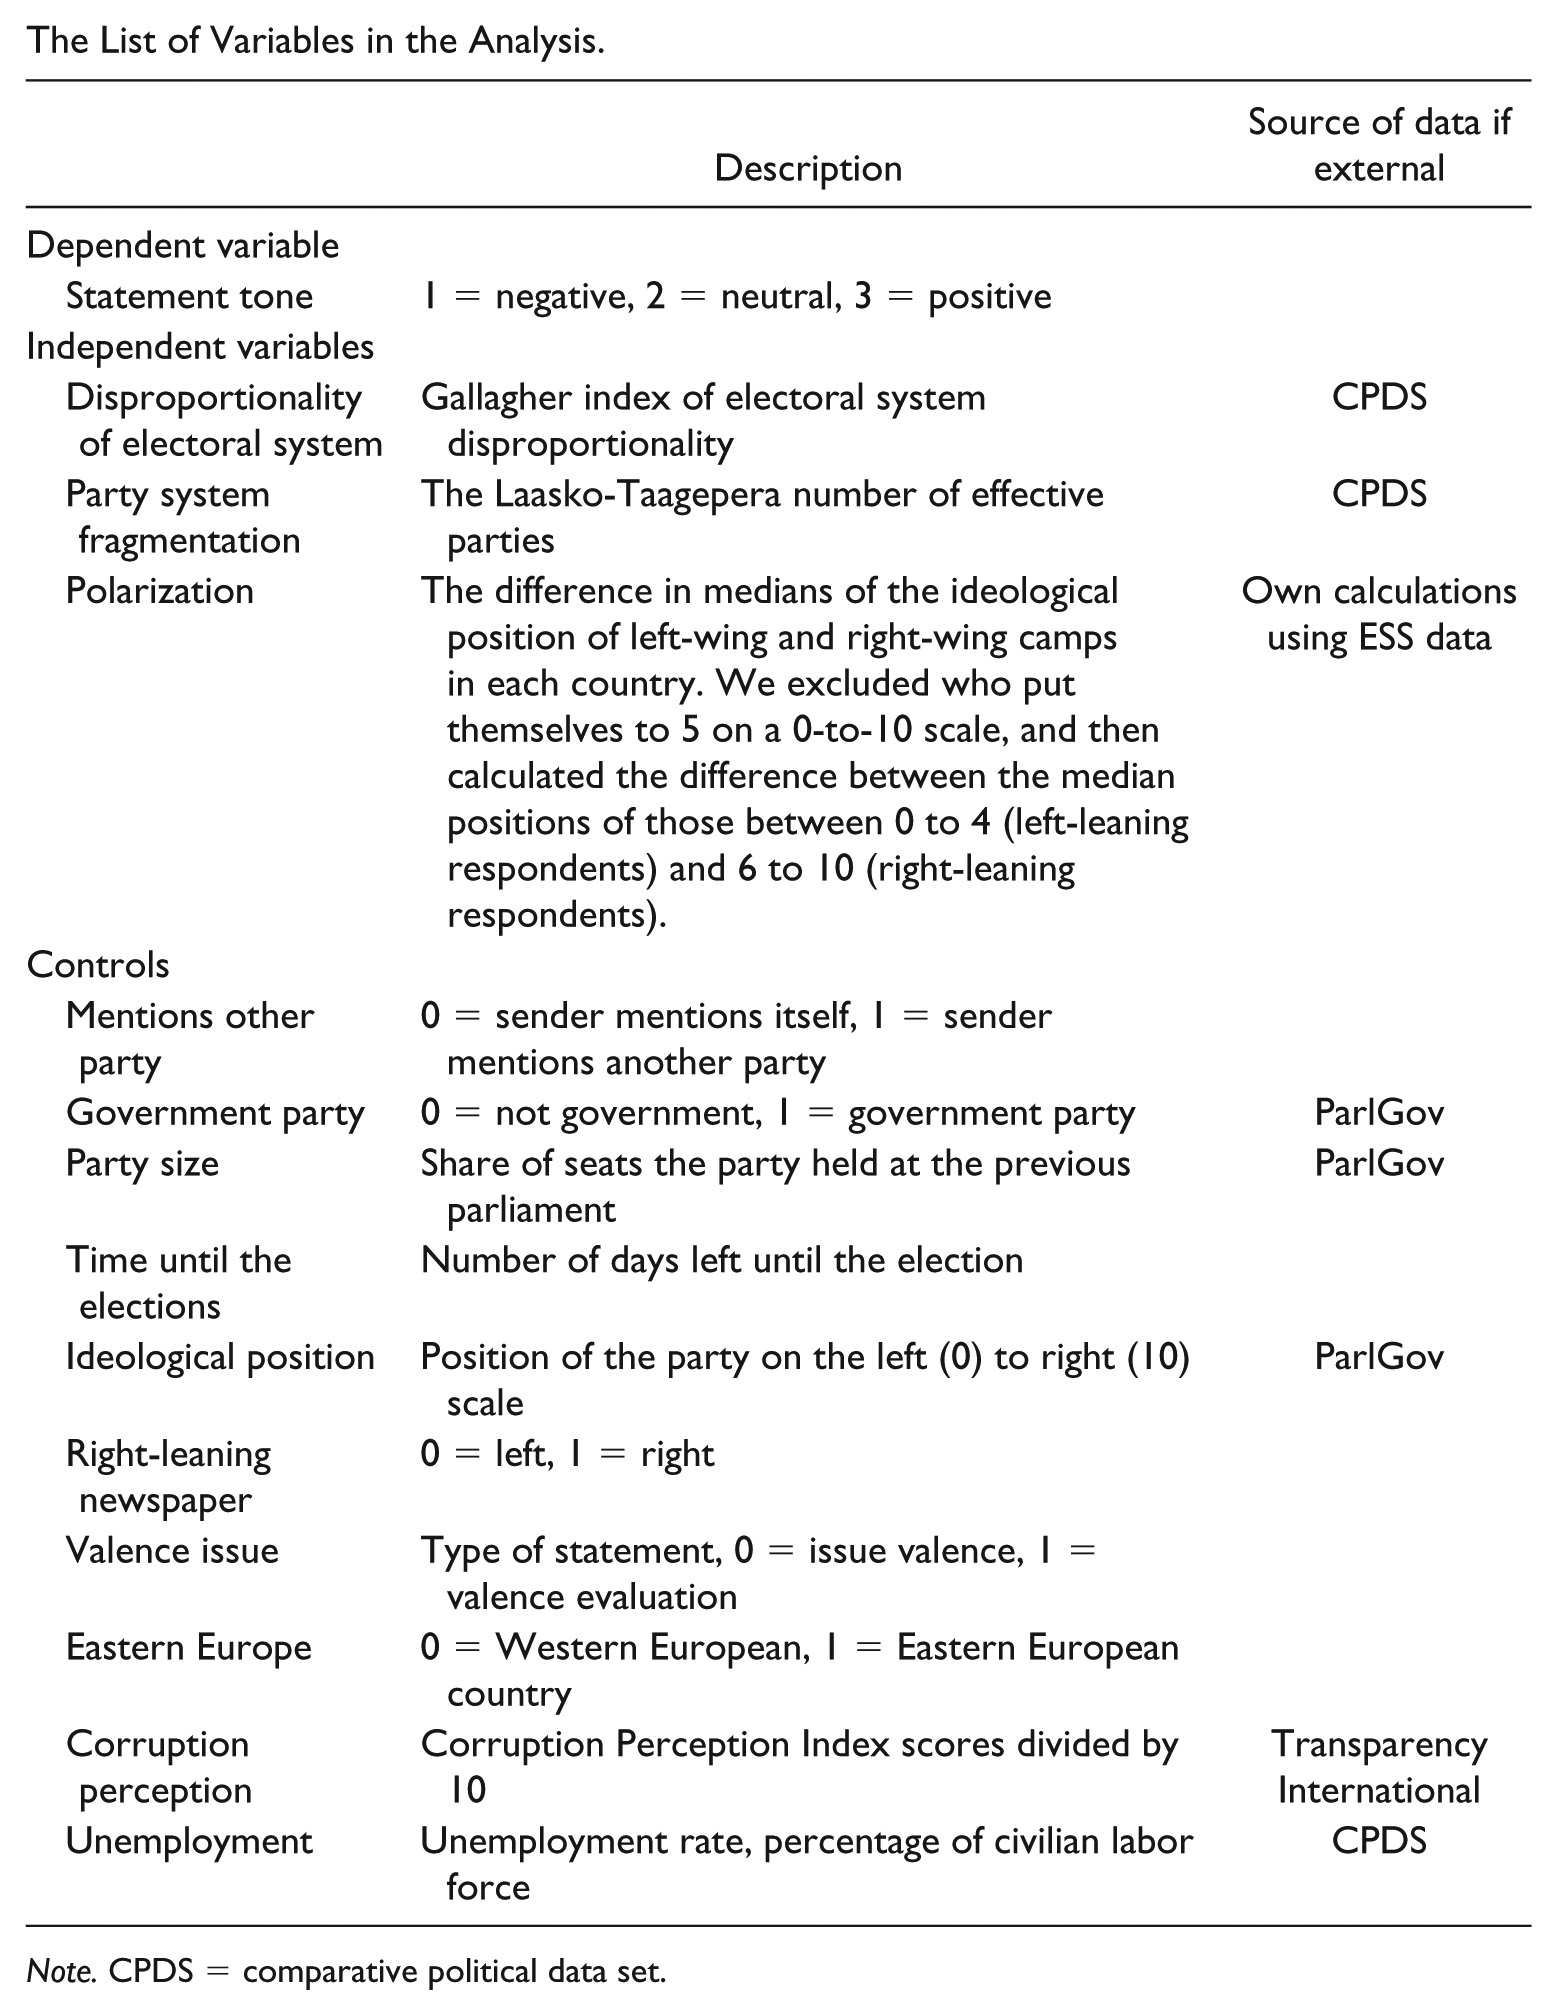
We also control for the parties’ ideological positions, measured on a left-right scale (0–10), the newspapers’ political leaning (0 = left, 1 = right), and statement type (0 = valence on a policy issue, 1 = valence evaluation). On the country level, we control for the levels of corruption (using the corruption perception index of Transparency International) and economic performance (using the unemployment rate variable from CPDS), 2 as high corruption and low economic performance might foster negativity. To capture differences in political culture, we control for the region of the country (0 = Western, 1 = Eastern Europe). Information on government status, party size, and party ideology come from the Parliaments and Governments (Döring and Manow 2016) dataset. For the full list of variables, see Appendix C.
Analysis
To test the effects of the independent variables on statement tone, we use logit regression with multinomial outcome (negative, neutral, and positive statements) applying country-clustered standard errors. 3 The control category for the DV is negative tone. Results of our main model are shown in Table 2.
Multinomial Logistic Regression Model Explaining Statement Tone.
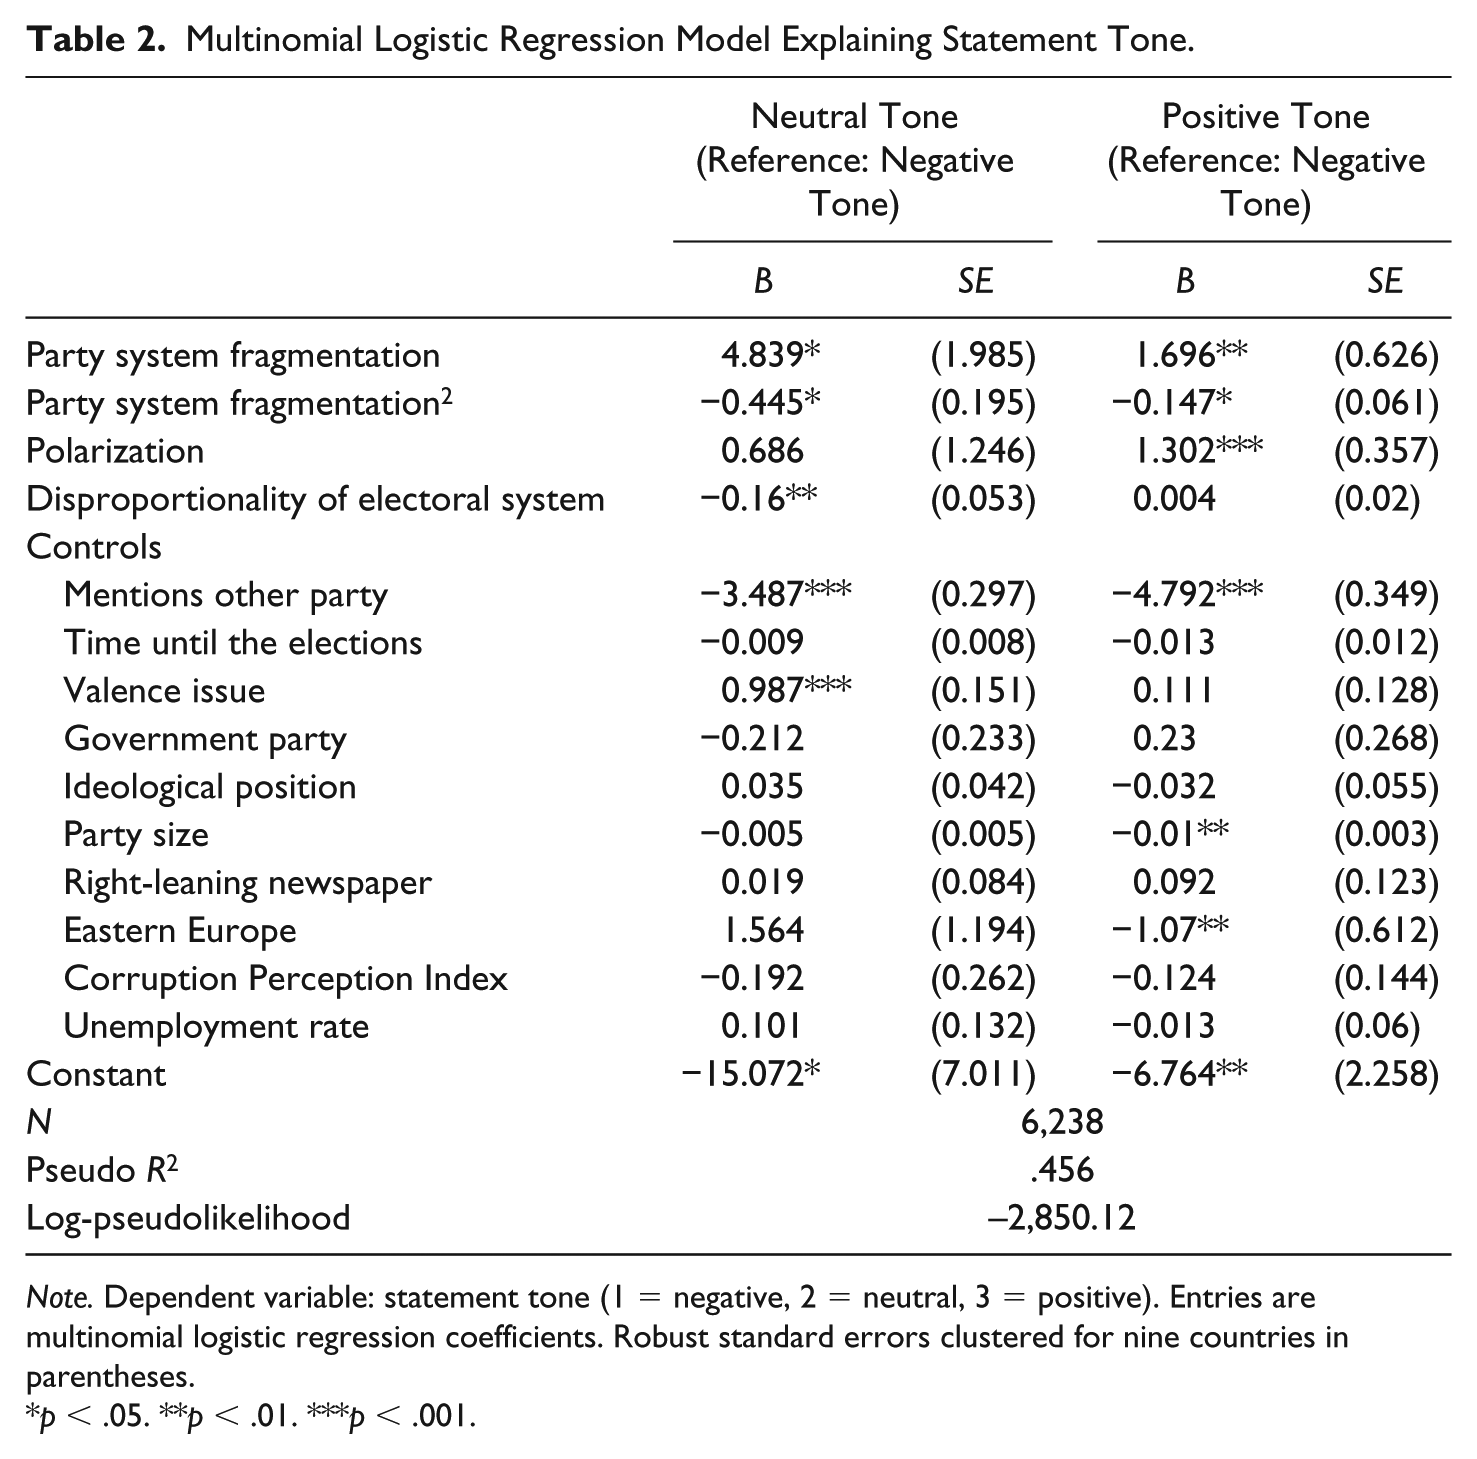
Note. Dependent variable: statement tone (1 = negative, 2 = neutral, 3 = positive). Entries are multinomial logistic regression coefficients. Robust standard errors clustered for nine countries in parentheses.
p < .05. **p < .01. ***p < .001.
Taking a look at the predicted probabilities, all variables set to their means, the probability of a statement being negative is 0.62 as opposed to 0.06 and 0.32 in the cases of neutral and positive ones, respectively. It is no surprise that the probability of negative messages is significantly larger in the case of parties targeting others (.9) than parties talking about themselves (.1).
Looking at the effect of electoral system disproportionality (H1) moving from the most proportional end of the scale (Denmark in 2007) toward more disproportional systems (the United Kingdom in 2005), the probability of negativity slightly increases from .59 to .63 (see Figure 1). Oddly, the same can be observed in the case of positive messages: The probability increases from .28 to .35. The probability of neutral messages on the other hand decreases from .12 to .1 between the two ends of the disproportionality scale. Based on this, and the results of Table 2 (namely, that there is a significant difference only between negative and neutral statement tone), it seems that parties in countries with more proportional electoral systems such as Denmark, the Netherlands, or Sweden consider neutrality as the alternative of negative: While parties in countries with disproportional electoral rules (the United Kingdom, Hungary in 2010, the Czech Republic) tend to go positive about themselves, proportional electoral systems keep parties neutral in this regard. 4 Although these changes are by no means considerable, the direction of the effects supports our first hypothesis.
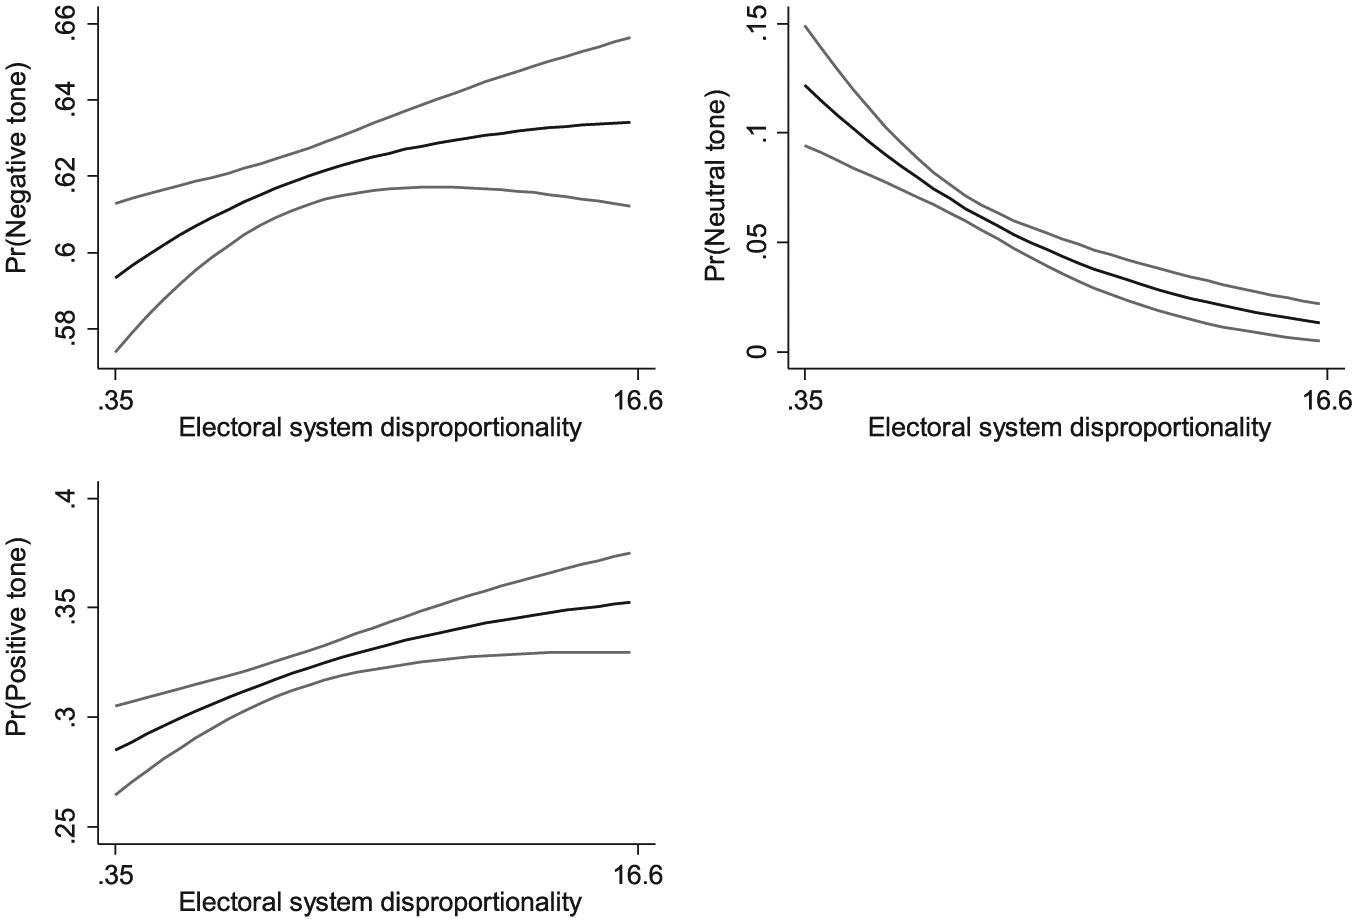
Predicted probabilities of statement tone in light of electoral system proportionality.
As to our second hypothesis, namely the nonlinear (U-shaped) effect of party system fragmentation on the likelihood of negativity, results appear to support our argument. Disentangling the effect of the squared term, Figure 2 shows that negativity decreases with increasing fragmentation only to a point, from where it starts to increase. In the first segment of the graph, the level of negativity is relatively high. Looking at the level of fragmentation, these are elections where one-party governments are likely to be formed. Here, we find countries such as the United Kingdom, Hungary, and Portugal in 2009. As fragmentation increases—and with that the likelihood of setting up a one-party government decreases—the probability of sending negative messages decreases. Countries like Poland, Sweden, and Denmark in 2007 fall onto this part of the graph.
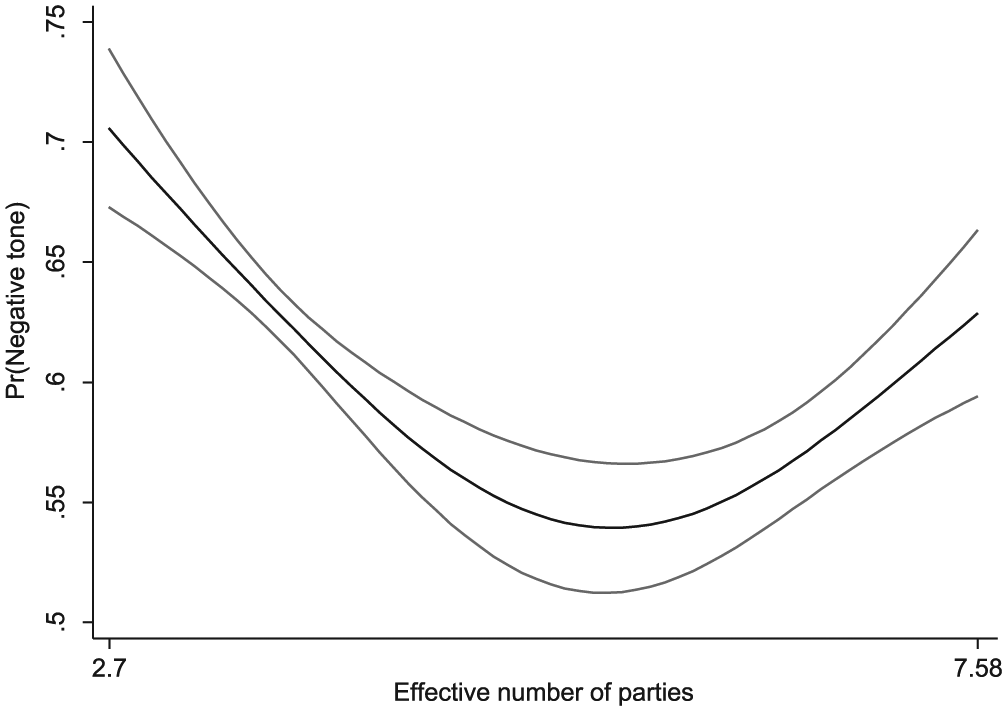
The predicted probability of negative tone in light of party system fragmentation.
On the second part of the figure, the effect of excess fragmentation on negativity shows that once there are too many parties competing, negativity again becomes an inviting tool. The Czech Republic, Denmark in 2011, Germany in 2009, and the Netherlands have particularly fragmented party systems allowing for a larger level of negativity according to our model. The turning point is at an average value around 5.5 parties. This means that regarding our sample, in party systems where the effective number of parties at the elections is larger than this value, an additional party in the party system will increase the probability of negative messages. However, in party systems with a lower number of parties, an extra party causes negativity to decrease. In light of our argument, this also implies that in party systems with a higher number of parties than 5.5, the possibility that a party is not needed in the coalition increases, removing the incentive for parties to moderate their campaigns in fear of creating conflict with potential coalition partners. The changes in the probabilities of negativity are also quite substantial. Its value between party systems with 2.7 and 5.5 players drops from .7 to .53, from where it increases up to .63 at the most fragmented end of the scale.
With regard to our third hypothesis, polarization makes a difference in choosing between positive and negative campaign messages, and the effect points to the expected direction. As Figure 3 suggests, increasing polarization decreases negativity while it increases the occurrence of positive statements. The probability of negativity decreases from .66 to .48 in the case of the least (the Netherlands in 2010) and most polarized (Hungary in 2010) countries, while positive statements are considerably more likely in the case of maximum polarization (p = .45) than at the lowest end of the scale (p = .27). Thus, the role of polarization in European parties’ campaign strategy is in line with the prediction of rational models (Doron and On 1983), namely, that smaller polarization (i.e., parties competing on the same market) encourages parties to attack each other to differentiate themselves from ideologically similar competitors. This is just the opposite of what has been found in the United States, where polarization and negativity increase hand in hand (Geer 2006).
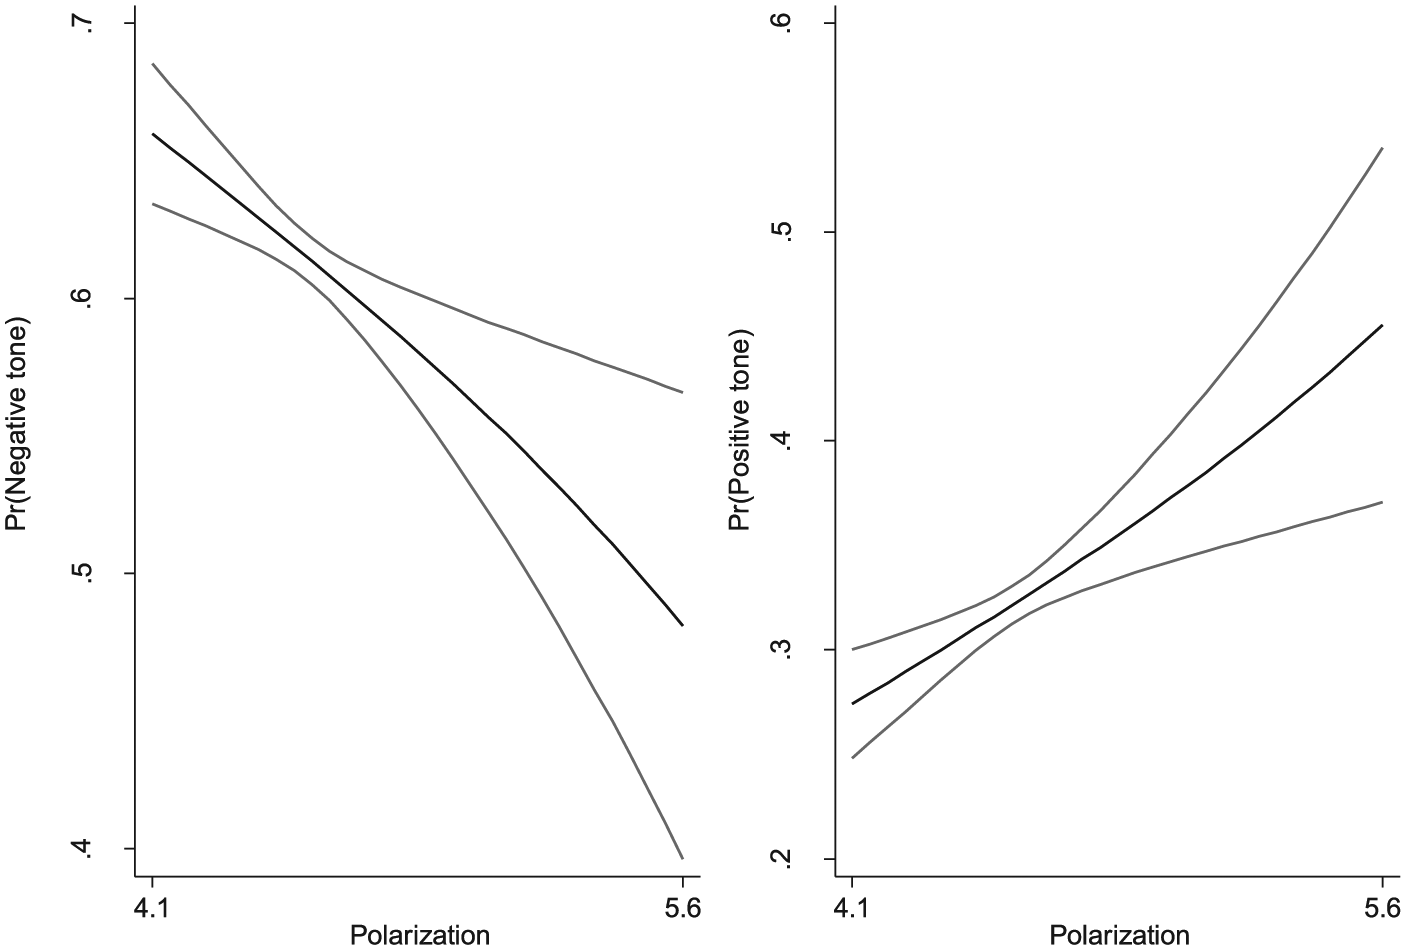
Predicted probabilities of negative tone in light of the polarization of the electorate.
The connection between the region (Eastern Europe vs. Western Europe) and polarization is substantial (r = .88, p = .000), which raises the problem of disturbing multicollinearity in the model. Indeed, the variance inflation factor (VIF) value for the region exceeds 10, the commonly argued threshold of collinearity. Nested models suggest that the direction of the effects are not sensitive to removing or including the region variable into the model. However, the significance of the effect of polarization vanishes in the model with region when estimating the difference between the probabilities of a statement being negative or neutral. Nevertheless, predicted probabilities do not change to an extent to alter conclusions. We checked also the relationship between the changes in polarization and negativity per country from one election to the next. Although the sample size becomes tiny, resulting in a statistically insignificant relationship, the correlation coefficient corroborates the results of our models (r = −.447, p = .227), that is, when polarization increases, negativity tends to decrease. In other words, although polarization and regionality are strongly correlated in our sample, the results on polarization are unlikely to be driven by the effect of the Eastern versus Western divide. Therefore, as we consider the region variable vital in explaining the differences in negativity, we decided to present models that include both variables.
Turning to the “usual suspects” of the literature, government status, party size, and time until the election are not significant. Being in government decreases the probability of negative statements only by .01 (from .62 to .61). As to party size, a ten-seat gain during the previous parliament increases the probability of negativity by .01, which again does not corroborate the results of single-country studies. Finally, with every five days with which the elections get closer, the occurrence of negativity becomes .05 points less likely.
In addition, we find that statements about policy issues are more likely to be negative than those regarding general valence content, and, last but not least, Eastern European parties prefer neutral tone as opposed to negative messages. The perceived level of corruption and the unemployment rate do not play any role in setting the tone for the campaign. To sum up, our results do not offer support for the majority of usual suspects in the literature. To further elaborate on this claim, we ran multinomial logit models separately for each country. Appendix D visualizes the effects of the party- and statement-level variables on the probability of making a negative statement. First, the government status of the sender party is only significant in about half of the country cases. In one case (the Czech Republic), the effect is positive, indicating that Czech government parties are more likely to go negative than the opposition. In addition, we also see a positive effect in Sweden, although the Swedish results must be handled with care due to estimation problems. In the remaining significant cases (Germany, Hungary, and Poland), the effect of government status is as expected. And finally, dismissing two popular hypotheses of the literature, in all countries, neither party size nor the closeness of the election have any effect on negativity.
Conclusion
The aim of this study was to show that countries vary regarding the negativity of electoral campaigns, and the differences can be accounted to various country-level features, such as electoral system disproportionality, party system fragmentation, and the polarization of the electorate. We used a unique dataset of statements made by political actors before the elections in eighteen electoral campaigns in nine European countries. We applied a multinomial logit model to explain the tone of the statements made by political actors reported in leading daily newspapers. Our DV distinguished between positive, neutral, and negative tone. We found that country-level factors indeed affect the probability of campaigns going negative. In line with our hypotheses, first, the likelihood of negativity increases with the increasing disproportionality of electoral results. However, although significant, the effect size is rather moderate. Second, negativity in campaigns decreases with increasing fragmentation only to take a U-turn and start to increase in countries with excess fragmentation. Third, in countries with less polarized electorates, political actors are more likely to campaign with negative statements to increase perceived differences between essentially similar competitors.
As to micro-level factors, we found no support for the literature’s results with regard to the effects of “usual suspects.” These insignificant results hardly change when running the models separately for the different countries. Although it was not the focus of our article, these results suggest being very cautious when building theory based on evidence found in single-case studies, and especially when generalizing American results to European multi-party contexts. This implies that connections between a wide range of variables and negativity rest on the context of the campaigns. Furthermore, it is very important to note that our results may be different than those published on the “usual suspects” by the reason of using data generated from newspaper articles, instead of messages directly coming from parties. At last, although macro-level variables significantly change the occurrence of negative messages, we must stress that this does not change the picture in the absolute sense. While its level is dependent on a wide range of factors, negativity remains the dominant tone of political campaigns.
As in the case of all empirical work, our study has also its limitations. Most importantly, the choice of analyzing newspaper articles is crucial in evaluating our results. First, besides the original party message, the tone and content of an article is strongly influenced by the selection and interpretation of news, and thus, our results reflect the characteristics of party messages and the media at the same time. As former research has shown, the amount of negativity differs between communication channels, and newspapers especially tend to give priority to negative news over positive or neutral ones (Hansen and Pedersen 2008; Walter and Vliegenthart 2010). On a positive note, however, getting a picture of the newspaper coverage of campaigns also brings us closer to voter perceptions of these campaigns, which perceptions arguably influence their decisions at the ballot box to a greater extent than messages coming directly from parties. Second, as television and the Internet are shown to reach a larger number of voters, these two sources also need attention in the future. Finally, mainstream media might discriminate niche parties, which introduces bias into the sample.
To conclude, while we could not confirm some currently popular assumptions about micro-level factors, our results point to a solid effect of country-level variables on negative campaigning. Therefore, it is well grounded to investigate the topic from a comparative perspective in the future, and to focus on the institutional determinants of negative campaigning.
Footnotes
Appendix A
The Distribution of Statement Tone in Each Country.
| Country | Election | Negative (%) | Neutral (%) | Positive (%) |
|---|---|---|---|---|
| Czech Republic | 2010 | 50.89 | 16.26 | 32.85 |
| Czech Republic | 2013 | 42.9 | 18.23 | 38.87 |
| Denmark | 2007 | 33.81 | 32.23 | 33.96 |
| Denmark | 2011 | 39.57 | 25.12 | 35.3 |
| Germany | 2009 | 42.21 | 24.77 | 33.02 |
| Germany | 2013 | 36.66 | 20.33 | 43.01 |
| Hungary | 2006 | 61.22 | 11.48 | 27.3 |
| Hungary | 2010 | 48.06 | 15.52 | 36.42 |
| Poland | 2007 | 51.97 | 23.38 | 24.65 |
| Poland | 2011 | 38.03 | 33.59 | 28.38 |
| Portugal | 2009 | 46.25 | 19.43 | 34.32 |
| Portugal | 2011 | 49.39 | 13.6 | 37.01 |
| Sweden | 2010 | 44.38 | 19.24 | 36.38 |
| Sweden | 2014 | 46.15 | 14.27 | 39.58 |
| The Netherlands | 2010 | 54.42 | 20.23 | 25.35 |
| The Netherlands | 2012 | 54.07 | 11.18 | 34.76 |
| The United Kingdom | 2005 | 54.63 | 15.13 | 30.25 |
| The United Kingdom | 2010 | 55.21 | 11.33 | 33.46 |
Appendix B
The values of independent variables across country-elections.
| Country | Election | Party system fragmentation | Electoral system disproportionality | Polarization |
|---|---|---|---|---|
| Czech Republic | 2010 | 6.76 | 8.67 | 4.97 |
| Czech Republic | 2013 | 7.62 | 5.95 | 5.23 |
| Denmark | 2007 | 5.4 | 0.35 | 4.46 |
| Denmark | 2011 | 5.72 | 0.45 | 4.39 |
| Germany | 2009 | 5.59 | 3.18 | 4.1 |
| Germany | 2013 | 4.82 | 7.77 | 4.25 |
| Hungary | 2006 | 2.7 | 4.87 | 5.14 |
| Hungary | 2010 | 2.87 | 11.92 | 5.64 |
| Poland | 2007 | 3.33 | 4.41 | 4.87 |
| Poland | 2011 | 3.74 | 5.85 | 4.91 |
| Portugal | 2009 | 3.84 | 5.58 | 4.1 |
| Portugal | 2011 | 3.67 | 5.58 | 4.45 |
| Sweden | 2010 | 4.78 | 1.11 | 4.56 |
| Sweden | 2014 | 5.41 | 2.61 | 4.57 |
| The Netherlands | 2010 | 6.99 | 0.61 | 4.07 |
| The Netherlands | 2012 | 5.97 | 0.74 | 4.11 |
| The United Kingdom | 2005 | 3.6 | 16.64 | 4.11 |
| The United Kingdom | 2010 | 3.73 | 14.59 | 4.22 |
Appendix C
The List of Variables in the Analysis.
| Description | Source of data if external | |
|---|---|---|
| Dependent variable | ||
| Statement tone | 1 = negative, 2 = neutral, 3 = positive | |
| Independent variables | ||
| Disproportionality of electoral system | Gallagher index of electoral system disproportionality | CPDS |
| Party system fragmentation | The Laasko-Taagepera number of effective parties | CPDS |
| Polarization | The difference in medians of the ideological position of left-wing and right-wing camps in each country. We excluded who put themselves to 5 on a 0-to-10 scale, and then calculated the difference between the median positions of those between 0 to 4 (left-leaning respondents) and 6 to 10 (right-leaning respondents). | Own calculations using ESS data |
| Controls | ||
| Mentions other party | 0 = sender mentions itself, 1 = sender mentions another party | |
| Government party | 0 = not government, 1 = government party | ParlGov |
| Party size | Share of seats the party held at the previous parliament | ParlGov |
| Time until the elections | Number of days left until the election | |
| Ideological position | Position of the party on the left (0) to right (10) scale | ParlGov |
| Right-leaning newspaper | 0 = left, 1 = right | |
| Valence issue | Type of statement, 0 = issue valence, 1 = valence evaluation | |
| Eastern Europe | 0 = Western European, 1 = Eastern European country | |
| Corruption perception | Corruption Perception Index scores divided by 10 | Transparency International |
| Unemployment | Unemployment rate, percentage of civilian labor force | CPDS |
Note. CPDS = comparative political data set.
Appendix D
Acknowledgements
We are grateful to Marc Debus, Zeynep Somer-Topcu, and Margit Tavits for organizing the project Comparative Campaign Dynamics as well as Markus Baumann and Martin Gross for meticulously cleaning the dataset that we used in this article. The paper was presented at the 113th Annual Meeting and Exhibition of the American Political Science Association in 2017 in San Fransisco, California, and at the General Conference of the European Consortium for Political Research in 2017 in Olso. We thank all participants for their valuable comments. We are especially grateful to Vlastimil Havlík, Fruzsina Nábelek, Wojciech Rafalowski, Maria Laura Sudulich, Zeynep Somer-Topcu, Margit Tavits and Annemarie Walter for their insight.
Authors Note
Veronika Patkós is also affiliated with the Hungarian Academy of Sciences, Hungary.
Declaration of Conflicting Interests
The authors declared no potential conflicts of interest with respect to the research, authorship, and/or publication of this article.
Funding
The authors disclosed receipt of the following financial support for the research, authorship, and/or publication of this article: This research was funded by the German Research Foundation (DFG) Grant DE 1667/4-1. Zsófia Papp is a recipient of the János Bolyai Research Scholarship.