
Abstract
Although political polls show stability over short periods of time, most media coverage of polls highlights recurrent changes in the political competition. We present evidence for a snowball effect where small and insignificant changes in polls end up in the media coverage as stories about changes. To demonstrate this process, we rely on the full population of political polls in Denmark and a combination of human coding and supervised machine learning of more than four thousand news articles. Through these steps, we show how a horserace coverage of polls about change can rest on a foundation of stability.
The news coverage in the mass media is decisive for how citizens perceive politics (Ladd and Lenz 2009; Walgrave et al. 2008). An important feature of the political coverage in both nonelection and election times is how parties and politicians stand in the polls. This coverage provides the public and politicians with information on the nature of political competition, shapes the public’s attitudes, and matters for political outcomes (Ansolabehere and Iyengar 1994; Rothschild and Malhotra 2014; Searles et al. 2018; van der Meer et al. 2016; Westwood et al. 2018).
The coverage is often dominated by news stories about changes with political reactions and debates about the far-reaching implications of even a single poll. This happens despite the fact that most polls show no or little change over short periods of time. As Murray Goot, quoted in Jackman (2005), puts it: Fundamentally, the press plays up differences which are otherwise insignificant because it has to. Its only alternative is to say that what a poll found today is not significantly different from what it found yesterday; and under most (though not all) circumstances, that sort of news is no news at all. (p. 500, emphasis in original)
Political journalists have to select the most novel political events and decide how to report these events, often times with the imperative to meet a demand for horserace political coverage (Iyengar et al. 2004; Matthews et al. 2012). How can journalists select and report opinion polls to meet the demand for horserace political coverage when such opinion polls rarely provide evidence for novel changes?
Previous studies explaining the coverage of opinion polls fall into two broader categories. First, scholars have studied under what circumstances polls are more likely to be selected by the news media (Groeling 2008; Groeling and Kernell 1998; Searles et al. 2016). Second, a wide range of studies have focused on the characteristics of the reporting of opinion polls (Andersen 2000; Bhatti and Pedersen 2016; Paletz et al. 1980; Weaver and Kim 2002). Both categories of research have provided valuable insights on the coverage of opinion polls, but they relate to theoretically distinct stages of how the media cover opinion polls. We argue that the choices of selecting and reporting opinion polls are related to each other with implications for how individual opinion polls are transformed from descriptive snapshots into newsworthy stories.
To demonstrate this, we study the coverage of opinions polls in a country with a relatively neutral political coverage and no partisan leanings in the media outlets, Denmark (Hallin and Mancini 2004). First, with help from media outlets and polling firms, we tracked down the population of opinion polls from 2011 to 2015 and their media coverage. Second, we used a combination of human coding and supervised machine learning for the content analysis of more than four thousand articles to understand the systematic characteristics of the coverage. We show that polls deviating from previous polls are selected at a higher rate and by more news outlets. This bias toward change travels further into the reporting as well. First, when being reported, polls are highlighted as being about change. Second, even small changes are amplified through political reactions with no rectifications using information about uncertainty.
The Coverage of Opinion Polls
Mass media works as a gatekeeper in relation to which political events should be reported (Groeling and Kernell 1998; Helfer and Aelst 2016; Soroka 2012). Studies have examined how journalists perceive the importance of different events (Stromback et al. 2012), and among the properties that are most relevant to journalists are those revolving around deviations from similar events. The greater the narrative potential for writing about changes related to an event, the more likely it is considered newsworthy (Lamberson and Soroka 2018). As Soroka et al. (2015) write, “[n]ovelty and change are defining features of newsworthiness” (p. 460). In the coverage of the competition between politicians and political parties, this is rooted in the demand for horserace political coverage (Iyengar et al. 2004; Matthews et al. 2012).
Not all political events obtain the same level of attention in the media (Greene and Lühiste 2018; Kostadinova 2017; Meyer et al. 2017). Key to the study of the coverage of political events is defining the population of comparable political events that might be selected. Specifically, we are not able to make inferences related to the coverage of political events vis-à-vis the absence of coverage, often leading to the problem of an unobserved population (Groeling 2013; Hug 2003).
Although previous studies have demonstrated how certain characteristics make events more likely to be selected (Andrews and Caren 2010; Meyer et al. 2017; Niven 2001), we do not fully understand how the focus on change in the horserace coverage can guide both the selection and reporting of political events. When certain events are more likely to be selected, the reporting can accommodate potential biases, for example, by putting emphasis on the unrepresentative nature of the events, but such biases can also be exaggerated and lead to an even more unrepresentative coverage.
Concentrating on vote intention opinion polls provides advantages compared with other political events in the study of horserace political coverage. Opinion polls are seen as newsworthy as they are up-to-the-moment (Paletz et al. 1980) and they come at a high frequency, allowing us to study substantial variation in the coverage of such events. Furthermore, they are quantifiable, thus enabling us to calculate measures of the changes. They are directly comparable as the question wording in the polls on vote intention is identical over time and exogenous to the political context. As opinion polls differ due to random sampling, we are able to study distinct events over time while ruling out confounding factors. Finally, information from opinion polls, such as change and statistical uncertainty, are important features that can be further identified and studied in the reporting.
Some polls are more likely to be selected for coverage by the news media (Groeling 2008; Groeling and Kernell 1998; Matthews et al. 2012; Searles et al. 2016). However, while the literature finds that polls showing greater changes from comparable polls from the same polling firm are expected to be selected, these studies tell us little about how much coverage these polls get and, importantly, how they are being reported on.
In a parallel body of literature, studies have analyzed how journalists present information from polls and concluded that journalists make mistakes in their interpretation of changes between polls (Bhatti and Pedersen 2016; Larson 2003; Toff 2019; Tryggvason and Strömbäck 2018). However, the studies interested in the selection of in-house opinion polls pay limited attention to the reporting and the studies looking at the reporting of political polls do not consider the extent to which the reporting might be related to considerations of the selection of polls.
A Framework to Study Opinion Poll Coverage
Combining the selection and reporting of opinion polls into a single framework can show how both are driven by specific poll characteristics. This allows us to examine the endogenous nature of the opinion poll coverage and provide expectations about what type of coverage we will see.
A poll that is easier to turn into a story about change will be more likely to be selected. The easiest proxy for such potential lies in the property of a poll: does it suggest change and, if so, how large of a change? If this motivation for selecting polls is shared by journalists, it implies an abundant coverage of polls showing large changes. Thus, our first hypothesis is that polls showing greater change will be selected more often (Hypothesis 1).
Once an opinion poll is selected for coverage, we expect that there will be a focus on change in the reporting. When looking at the coverage of opinion polls, while the population of opinion polls shows great levels of stability, the media will rather report stories about change in the political competition. Accordingly, we should see that the reporting will be about change despite multiple polls showing stability when taking the margin of error into account (Larson 2003). If a poll was deemed suitable for reporting, the actual magnitude of change is less relevant for the coverage. Independent of the actual change between polls, we will see a focus on change in the reporting. Our second hypothesis is that change rather than stability reporting is more likely for the selected polls (Hypothesis 2).
Exploring the Characteristics of Reporting
So far, we argued that there is a discrepancy between the actual change and what the news coverage will suggest in terms of the volatility of party support. It is possible that the reporting will rectify the resulting selection bias, or on the contrary, further amplify it. In this section, we explore ways in which this could be reflected by the content of reporting.
One possible rectification would be dedicating space to the uncertainty these polls come with. As Bhatti and Pedersen (2016) outline, the demand for horserace coverage can lead to unsubstantiated poll stories with errors in the uncertainty reporting (see also Larson 2003). However, we do not know whether the uncertainty reporting is related to the size of the changes between polls.
On one hand, if journalists take the margin of error into account, we could expect that uncertainty will be more likely to be reported for polls showing greater changes. This is because the margin of error will underpin the change story for polls showing significant changes. Furthermore, for smaller changes, the uncertainty might be omitted to not raise doubts about the change narrative. Both these observations would point to a positive relationship between change and uncertainty reporting. However, as we know that polls rarely show significant changes (cf. Bhatti and Pedersen 2016), we can make no strong predictions about such dynamics. On the other hand, if journalists pay greater attention to changes, this can crowd out methodological details such as uncertainty. Accordingly, the margin of error can be one detail of greater relevance for the change narrative when less actual change is present. Thus, this would point toward a negative relationship between change and uncertainty reporting.
Second, journalists can stress the importance of a poll by including responses to the poll from specific sources (Gaskins et al. 2019; Jerit 2009; Tiffen et al. 2014). Specifically, more reactions to a poll indicate higher newsworthiness. Previous research shows that news sources are included in the reporting as means to underscore the political competition and conflicts between parties (Brewer and Sigelman 2002; Dimitrova and Strömbäck 2012). Reactions from experts, commentators, and most importantly politicians confer additional importance to the poll. Such reactions could be more likely to be included when the changes in polls are greater. Moreover, reactions and comments to changes can further feature as independent stories themselves, and such stories are more likely to arise when changes are large and invites reactions. Overall, this would lead us to believe that reporting of polls with larger changes will contain more references and quotes. Alternatively, reporting on polls with smaller changes might require additional validation from external sources to underscore the change narrative. However, this is less consistent with the expectation that any actual change, once a poll is selected, will be reported as change.
In sum, rather than proposing specific hypotheses, we will approach these features of the reporting in relation to change as questions. The answers to these content-related features are important because they can help us better understand whether there is any sort of correction or rather amplification of the reporting. As journalists have different opportunities to use the reporting to rectify or (in)voluntarily amplify biases, we make no strong theoretical predictions about the expected empirical pattern.
Interestingly, some of the mechanisms described above have the potential to add up to a snowball effect. Despite the lack of statistical significance, small changes from one poll to the next are deemed newsworthy and distinct processes can turn polls showing a large degree of stability into a news coverage dominated by stories about recurrent changes in the political competition. In addition, greater changes could affect the level of attention to methodological details as well as political reactions.
Data and Measures
Polls and Change in the Polls
We use the full population of opinion polls in Denmark (n = 487) conducted by eight polling firms on vote intention for eight political parties from 2011 to 2015. 1 For information on the parties in the polls in this period, see the Supplementary Information File 1 (SI1). The period covered begins after the 2011 national election and stops prior to the 2015 national election campaign. To ensure that all polls were collected, especially polls not reported, the data set was developed in collaboration with media outlets and polling firms. Denmark, a multiparty Western European democracy, is characterized by a high newspaper circulation and a neutral commercial press (Hallin and Mancini 2004) with extensive reporting of opinion polls (Bhatti and Pedersen 2016).
To measure change in a poll, we rely on the difference between the poll and the last poll from the same polling firm expressed as volatility and measured by the Pedersen index (Pedersen 1979). 2 The measure—theoretically ranging from 0 (no change at all) to 100 (all previous parties that received support have no support)—provides a direct measure of change in the political competition in a multiparty system. It is calculated as the sum of gains or losses in absolute terms across all parties and divided by 2. 3
Identifying Mentions
We collected news articles from nine different newspapers, their webpages and the webpage of two national TV companies. 4 Aggregated, the newspapers had a readership of 1,864,000 (5,643,000 total population) on a normal weekday in the second half of 2014. Four of the newspapers do not have any formal arrangement with a polling firm, whereas the other outlets commissioned polls through the firms used in the analyses. 5
We collected the news articles using the digital archive from Infomedia, containing all online and print articles in the nation-wide coverage. For each opinion poll, we searched for articles mentioning the polling firm and any party in the articles published within a period of six days after the poll was collected. The time span of six days assures that we focus on the reporting of specific polls as news.
The initial search returned 6,350 articles. We removed all non-Danish reports (a few English language summaries in online editions). Next, we searched the articles for mentions of numbers from the poll to which they were assigned to (such as 16,9, for example, both with decimal comma and point). In addition, we searched for the Danish translation of the bi-grams “new poll” and “new opinion poll.” We define an article as being pertinent if either of these two filters return a positive search result, resulting in a total of 4,147 pertinent articles spread across 412 polls. These steps ensure that we do not include old polls and polls covering other topics than vote intention, such as prime minister preference.
Content Coding
For the content of reporting, we used human coding combined with supervised machine learning. Three research assistants were trained to code five hundred randomly selected articles. Before this coding, we evaluated content coding quality by having a subset of articles coded by multiple coders. Summaries are reported in Table 1 and additional details for the content coding are reported in SI3.
Human Coding Reliability and Machine Learning Performance.
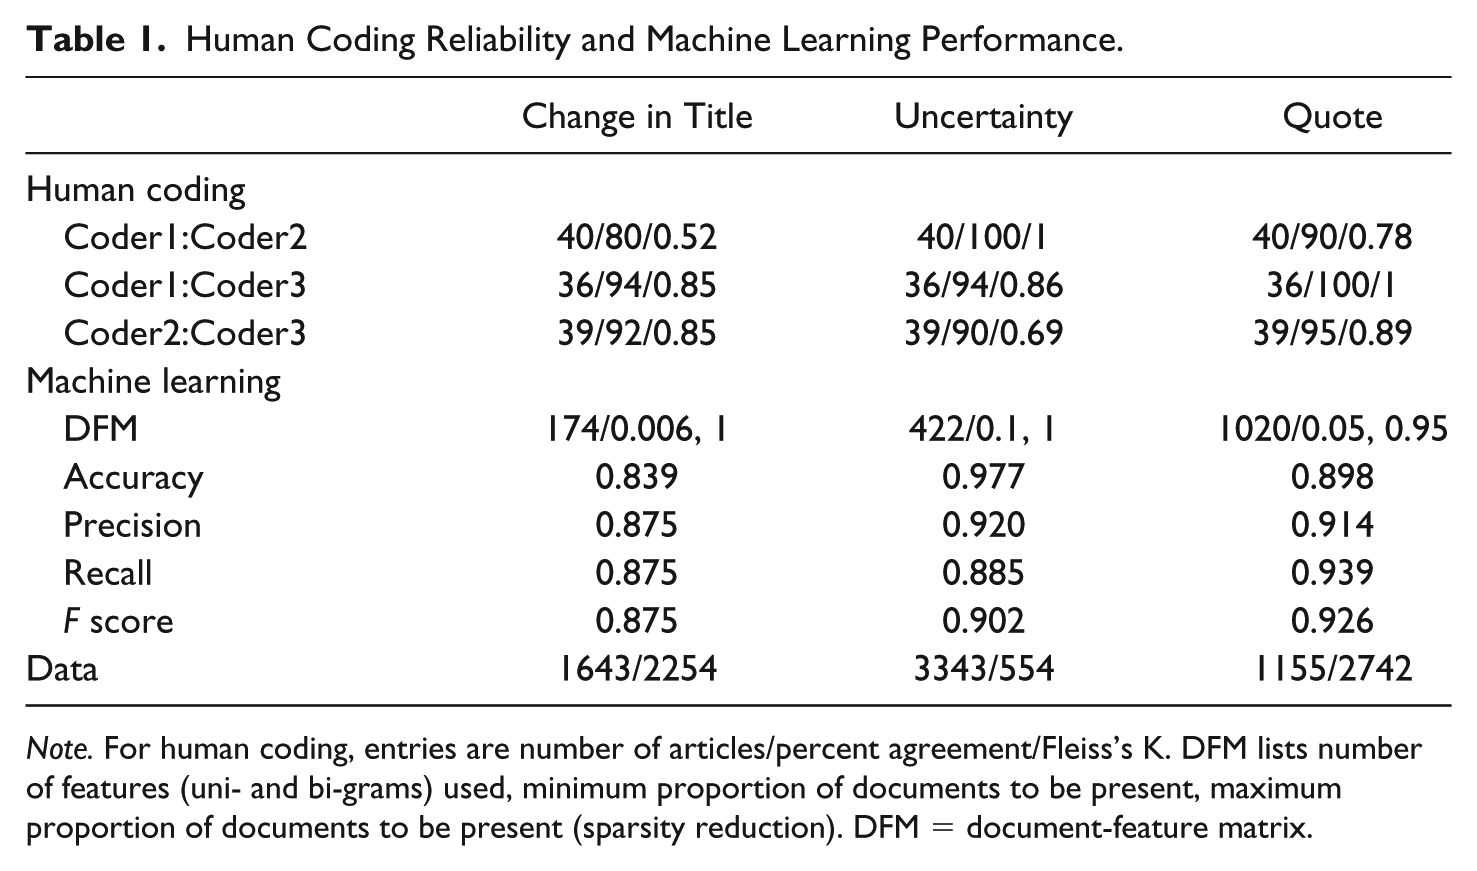
Note. For human coding, entries are number of articles/percent agreement/Fleiss’s K. DFM lists number of features (uni- and bi-grams) used, minimum proportion of documents to be present, maximum proportion of documents to be present (sparsity reduction). DFM = document-feature matrix.
Coders were first shown the title of the article. Titles provide the frame of the article and highlight what has been deemed important. Quantitatively this should be a conservative measurement of reporting change. There might be articles that mention change in the full text, but they do not highlight that in the title, whereas the opposite is unlikely. 6 We code change coverage in the title as 1, if it contains an explicit mention of some actors (parties or party blocks) gaining or losing votes compared with previous opinion polls, 0 otherwise. We found high average inter-coder agreement regarding this feature (88 percent).
The only potential bias favoring confirmation of our hypothesis could appear if the article is not overwhelmingly focused on change while the title mentions change. It is difficult for humans as well as machines to quantify how salient change should be for the article to be only about change. However, most of these articles with change in title actually focus on change and we present empirical checks in SI3 using the full article text where we would predict much higher change reporting. This suggests that the focus on titles do not systematically bias our analysis of the actual reporting.
After coding the title, coders read the article and answered a set of questions related to the content. 7 The two reporting features of interest are (1) whether there was any mention of statistical uncertainty/margin of error of the poll (coded 1 for yes, 0 otherwise), and (2) whether any persons were quoted (coded as 1 for politician [left block or right block], or researcher with university affiliation, or political commentator; 0 otherwise). In both cases, we found high agreement and good reliability (around 95 percent average agreement for both).
Using the labeled text, we apply supervised machine learning to extrapolate human coding to unlabelled articles. The title text corpus was transformed into a document-feature matrix (DFM) used for change in title task, whereas the full content of the articles was used to build the DFM for the uncertainty and quote-related task. We carried out stemming and removed most Danish stopwords with the exception of those that signal directionality (going up or down, for example). We also removed weblinks and punctuation, 8 grouped all numbers into a common token, and carried out the same for party names and party leaders. Although numbers and party names can help with labeling, we limit potential over-fitting to particular names (such as the prime minister) or specific polling numbers. We used both uni- and bi-grams in our analysis.
Using cross-validation, we trained three binary classification models on 80 percent of the labeled documents using gradient boosting (ensemble of decision trees) implemented in
Additional Variables
There is some regularity in the timing and frequency of polls, but the intervals between the polls are not constant. These fluctuations can mean longer hiatus of polls or high frequency of polls in a short period of time. To assure that none of these possibilities conflate the results, we control for the distance in days from the last poll by the same polling firm. Although no national election campaign is included in our sample, the period provides variation in the salience of party competition by having campaigns such as the European Parliament elections in 2014 and local elections in 2013. We use a dichotomous variable to control for campaign, taking the value 1 if the poll was released in the three weeks prior to an election, local or European, and 0 otherwise.
Given that our data span across several years, we include a year control in our models. Finally, in subsequent models, we account for potential relationships between polling firms and media outlets using a partnership variable, coded 1 if they had an official agreement.
Results
Polls Showing Change Are Selected More Often
In Figure 1, we summarize changes in polls throughout the period. Although there are two polls with high volatility (discussed in detail in SI1), we see a remarkable stability throughout the period. Beyond stability of the change magnitude, these values indicate small changes. Ninety percent of the polls are below 5.46 percent in terms of volatility, that is, a total of 5 percent electoral support changed in between parties. For reference, between the 2011 and 2015 national elections, this value was 15.97 percent.
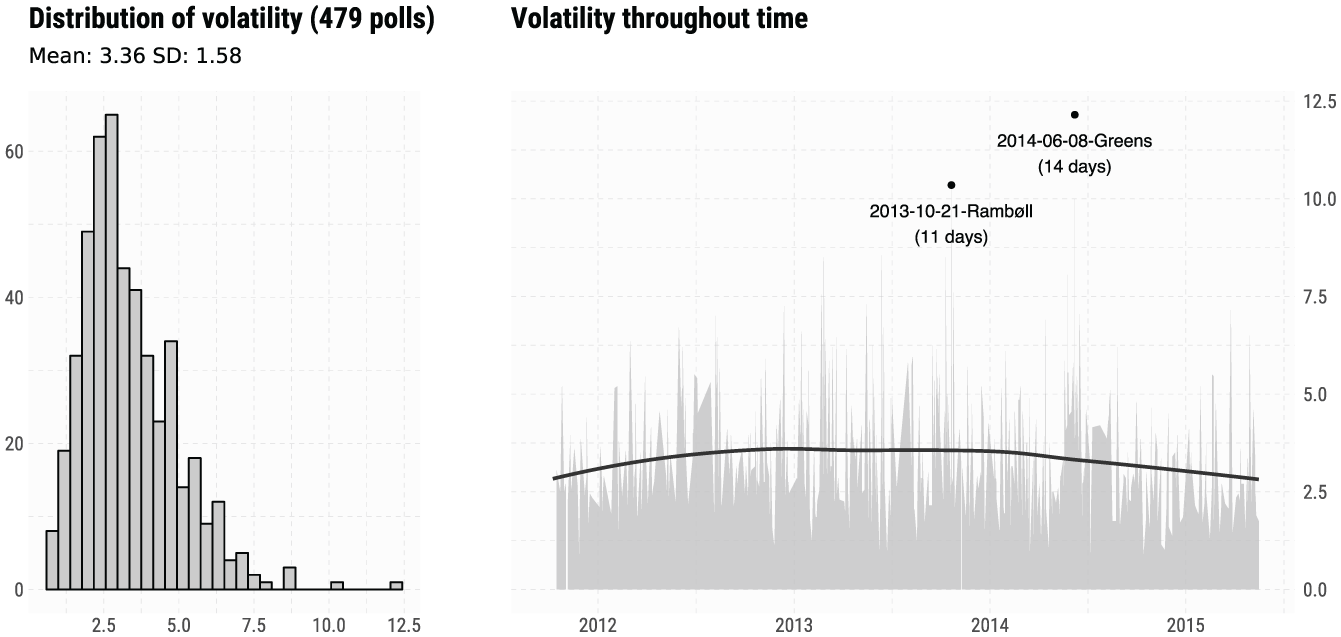
Change in the polls, 2011–2015.
Once the margin of error is considered, we can assess whether the changes between two polls for any of the parties were statistically significant. 9 As we are looking at changes between two proximate polls, we find that 82 percent of the polls had no significant changes for any of the parties compared with the previous poll, and 15 percent had one or two out of eight potential changes that were statistically significant. Overall, our starting point is a picture of stability in the polls.
In terms of selection, seventy-five polls were not covered, whereas the other polls had mentions ranging from one (forty-one polls) to 131 (one poll) articles. 10 The mention count is summarized in Figure 2. Two polls should be highlighted regarding the high number of mentions. The 2014-05-20-Megafon poll has eighty-eight mentions. This poll falls under the European Union (EU) election campaign period, which we control for. The 2012-05-31-Megafon poll has 131 mentions. This poll attracted additional attention because it listed the Social Democrats—one of the two major parties, also having the prime minister at that point—at a historical low of 16.9 percent.
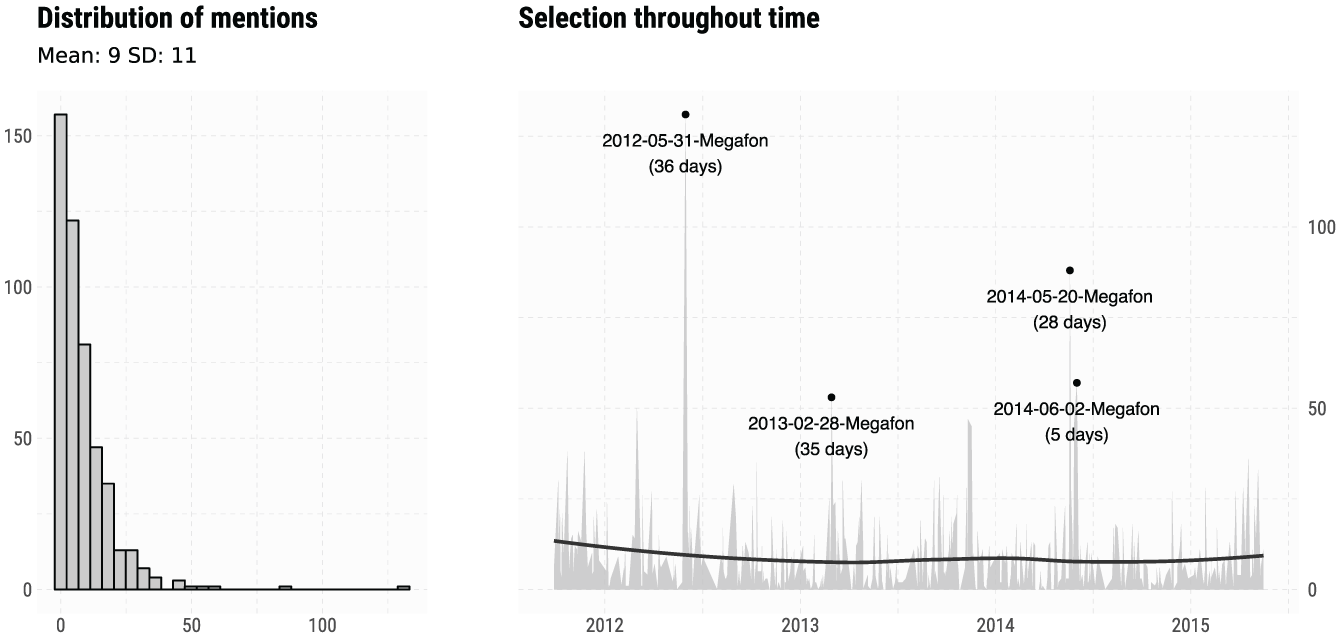
Selection of polls by the media, 2011–2015.
To test Hypothesis 1, that is, that change translates into higher selection rates, we regressed the count of articles in the media associated with each poll on change and the control variables. Given that the quantity of interest is an overdispersed count, we fitted a negative binomial model to the data. Model 1 in Table 2 summarizes our results and Figure 3 displays the core relationship of interest.
Change and Selection.
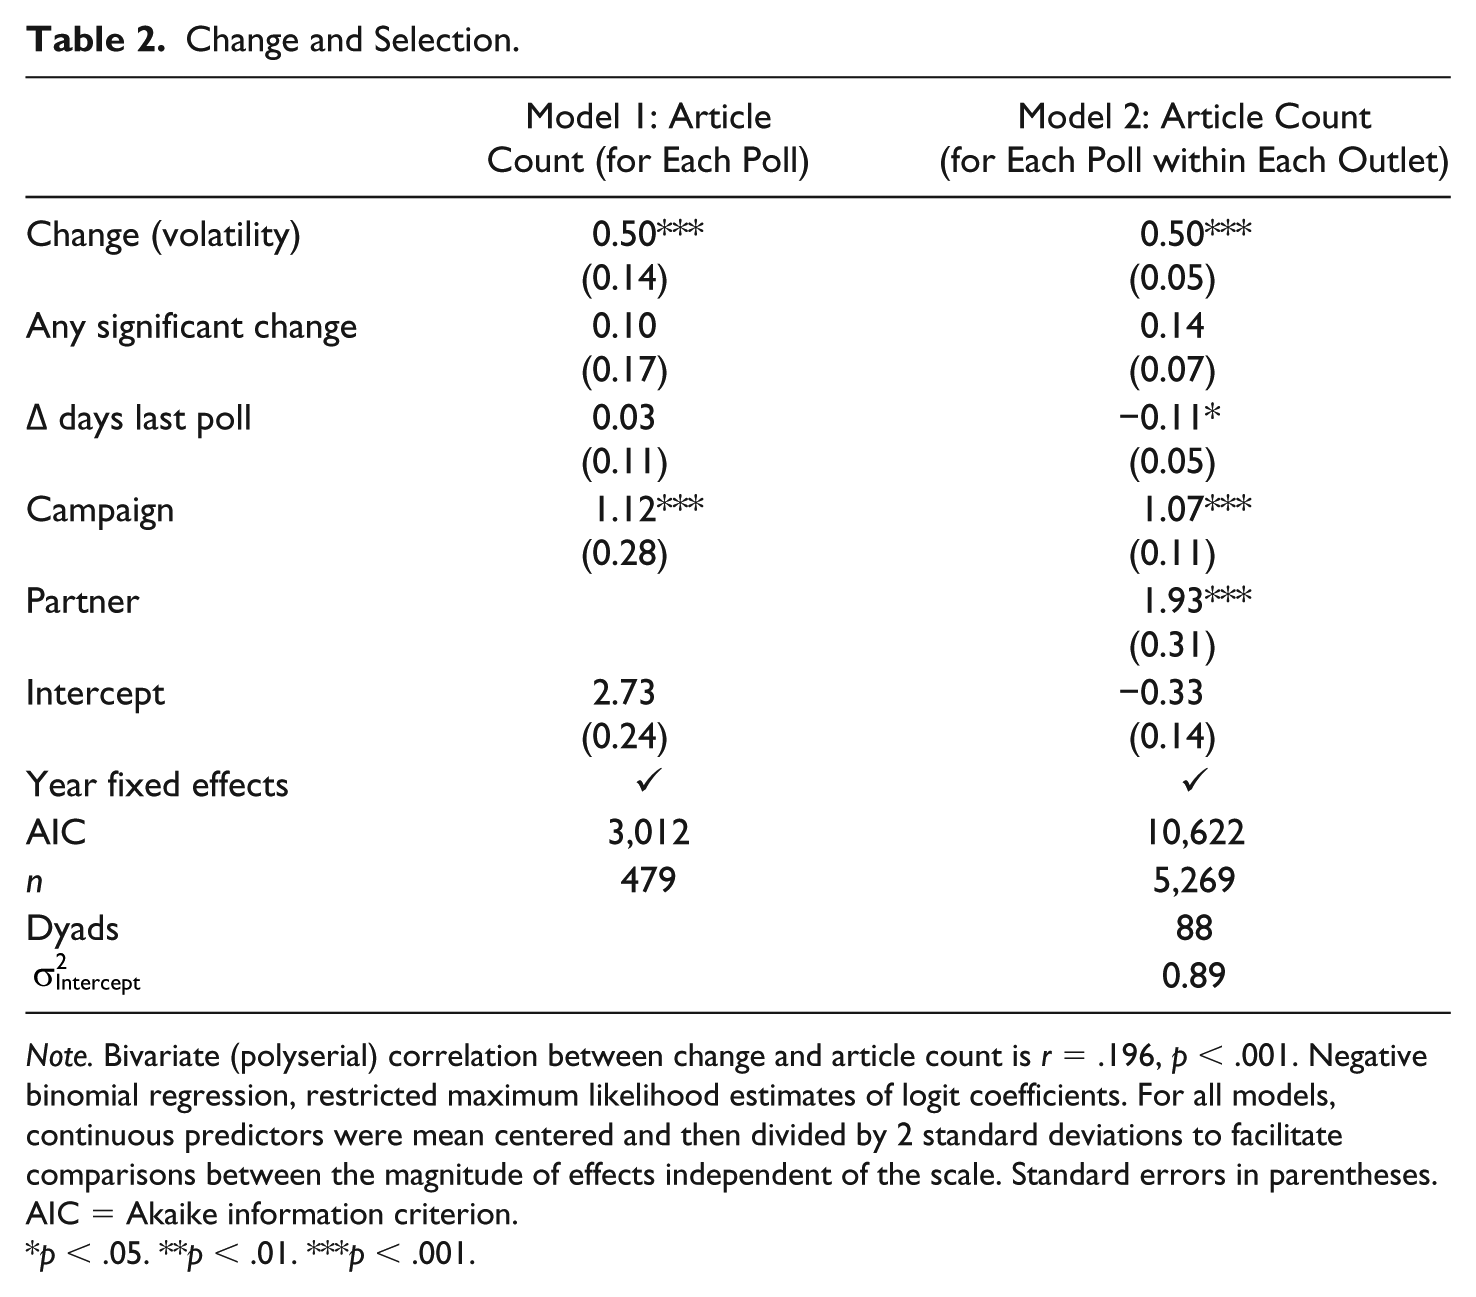
Note. Bivariate (polyserial) correlation between change and article count is r = .196, p < .001. Negative binomial regression, restricted maximum likelihood estimates of logit coefficients. For all models, continuous predictors were mean centered and then divided by 2 standard deviations to facilitate comparisons between the magnitude of effects independent of the scale. Standard errors in parentheses. AIC = Akaike information criterion.
p < .05. **p < .01. ***p < .001.
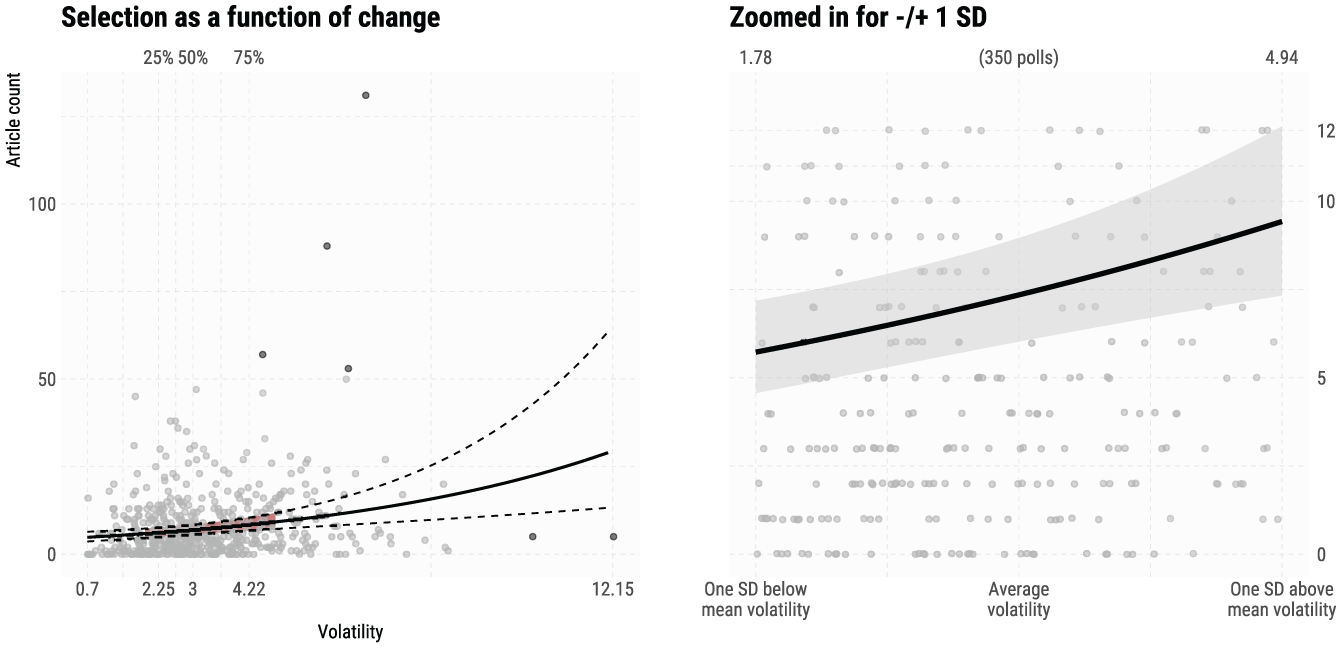
The relationship between change and selection.
There is systematic variation in the selection of opinion polls. Larger changes are selected more often, indicating that such polls attract more attention from the mass media. We estimate close to twice as many articles (9.41 [7.31, 12.09]) for polls 1 standard deviation above the volatility mean (4.94 percent) compared with those 1 standard deviation below the mean (1.78 percent, 5.72 [4.58, 7.18]).
This ±1 standard deviation range encompasses 350 polls with the median of the highest gain or loss between polls any party registered being 1.7 percent. Most importantly, in 315 polls (90 percent), there were no statistically significant changes for any of the parties, that is, an overwhelming majority of these changes were within the margin of error. Finally, this level of volatility (+1 standard deviation above the mean, 4.94 percent) is less than one-third of the actual electoral volatility (15.97 percent) between the 2011 and 2015 general elections, and the difference in volatility (±1 standard deviation, 3.16 percent) is one-fifth of this value. Thus, we see quite some stability, yet, reliance on these differences in limited changes results in twice as many articles.
Next, to account for outlet and polling firm-specific differences, for each poll, we keep the separate counts for the eleven outlets. Thus, we expand our data set, and one poll will have eleven count entries. We account for the hierarchical structure by creating a grouping variable that identifies the combination of the polling firm and the news outlet, a dyad with eighty-eight possible values (8 × 11). We fit a hierarchical varying intercept negative binomial model to the data and can control now for whether the polling firm and the outlet were partners. The results are reported as Model 2 in Table 2.
There is no evidence for differences across outlets or firms. The positive relationship between change and selection is identical even when we account for outlet- and firm-related heterogeneity. Media outlets select polls that stem from firms with which they have a partnership more often, but we find no evidence that change matter differently in such scenarios. 11
We make two additional remarks here (described in detail in SI2). First, we find the same relationship between change and selection frequency when refitting the models on the subsample of 392 polls with no significant changes. Accordingly, whether the changes are within the margin of error does not matter for the selection practices. Second, for each poll, we looked at the number of different media outlets selecting it and found that, again, change matters in the same way. Polls indicating higher change will spillover to different outlets and not only be disseminated to the readers of the outlet ordering the poll. In sum, we find strong support for Hypothesis 1.
Reporting Change Instead of Stability, Reactions Instead of Uncertainty
In a majority of the cases, the reporting should be about stability. However, 58 percent of the articles mention change in their title. Furthermore, while 82 percent of the polls have no statistically significant changes, 86 percent of the articles does not mention any considerations related to uncertainty.
To test Hypothesis 2 and further examine the content characteristics of the reporting, we employ three hierarchical binomial logit models where change mention in title, uncertainty mention in text, and quotes in text are modeled as the function of poll characteristics as before. 12 The grouping unit is the poll, as one poll can have multiple associated articles. 13 The results are summarized in Table 3 and Figure 4.
Change and Reporting.
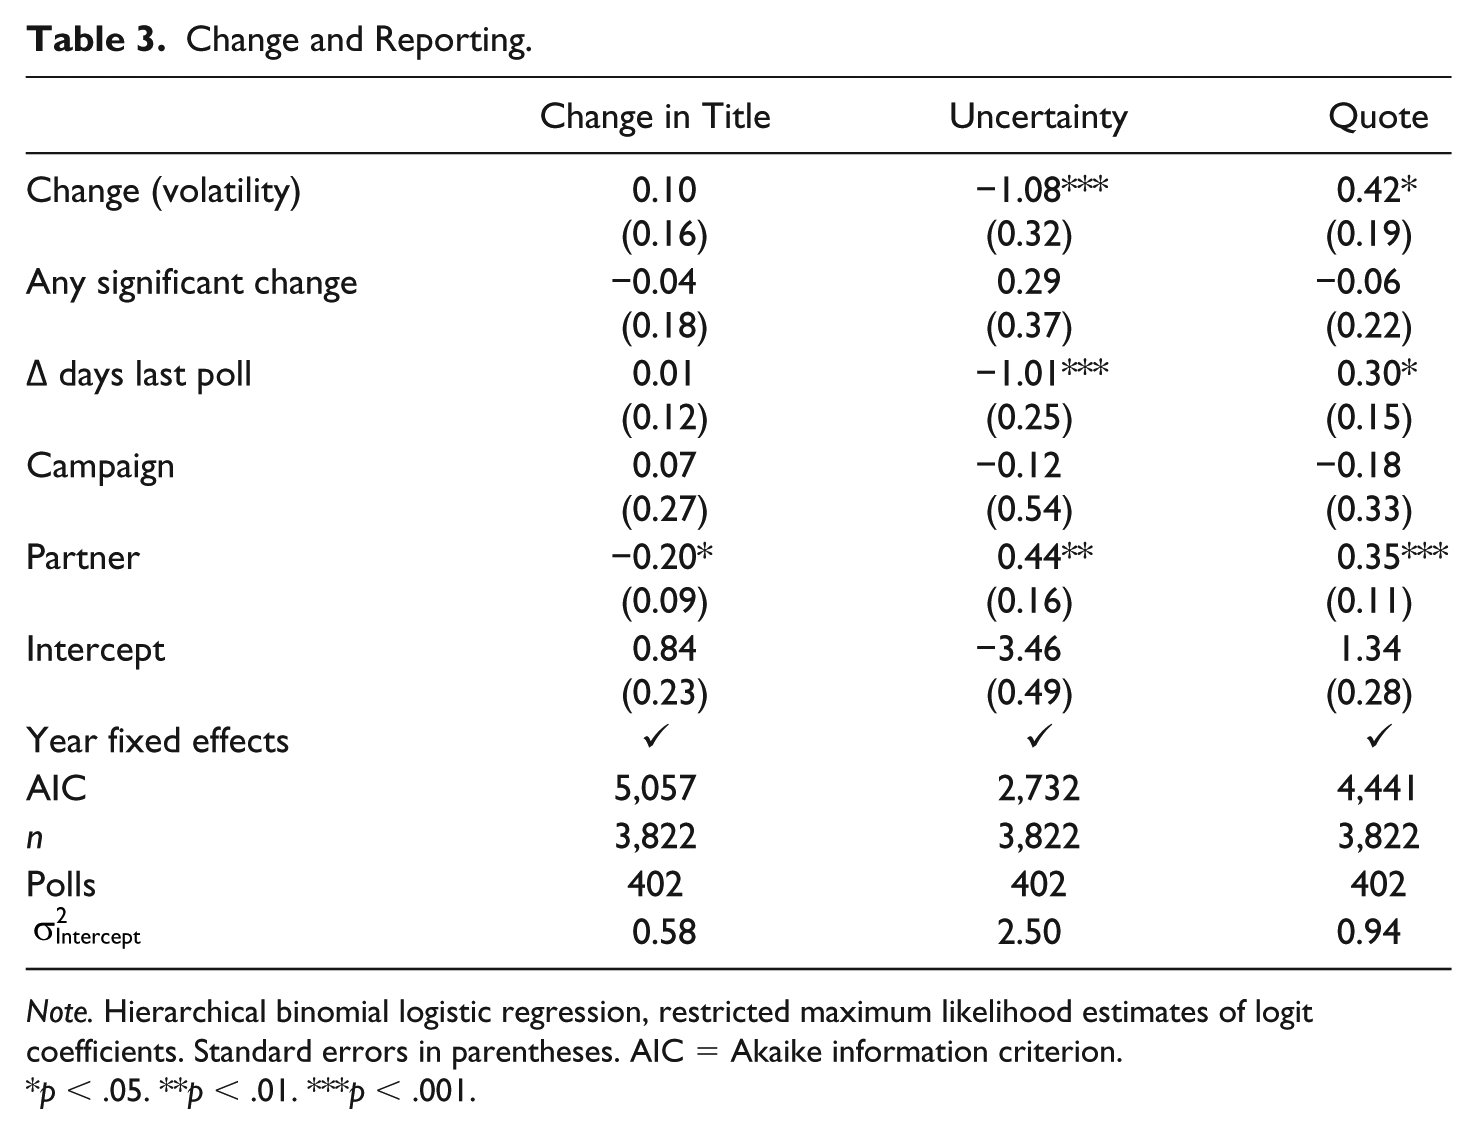
Note. Hierarchical binomial logistic regression, restricted maximum likelihood estimates of logit coefficients. Standard errors in parentheses. AIC = Akaike information criterion.
p < .05. **p < .01. ***p < .001.
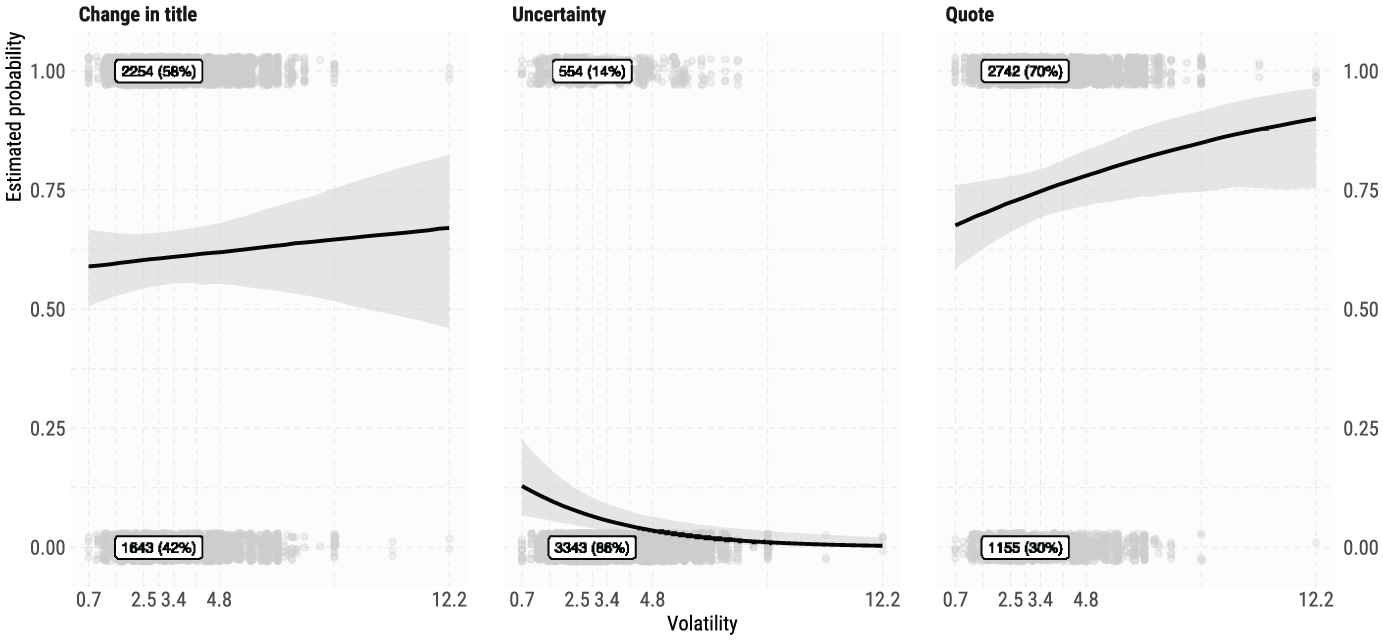
The relationship between change and features of reporting.
Although there is an increase in the probability of titles highlighting change along the poll change continuum, this effect is not statistically significant and substantively quite small. Thus, the amplification mechanism indicated by our results so far is that any volatility level can be sufficient for a change reporting, once selected. In sum, the coverage is dominated by a reporting about change, but this is not exclusive to high change polls, rather a feature of most selected polls. Thus, we find evidence that there is a focus on change rather than stability in line with Hypothesis 2.
Next, interestingly, our results show that reporting of polls with greater change is less likely to make references to uncertainty and the margin of error. Uncertainty is generally not discussed but reporting of high change polls is even less likely to contain such references. Finally, polls showing greater change are reported using more quotes from experts and politicians. Thus, the bias in the selection of the polls travels into fundamental features of the reporting in the form of reactions. In SI3, we report detailed analyses and show that reporting of higher change polls is more likely to quote politicians (effect of 2 standard deviations change is 0.44 [0.19], compared with no quote or other types of quotes). For the content characteristics, the findings demonstrate a pattern where greater changes lead to more political reactions and less focus on the methodological details.
Discussion and Conclusion
The public, politicians, and journalists pay attention to opinion polls as an important source of information (Kerby and Marland 2015; Wichmann and Brettschneider 2009). To understand how such polls are reported in the news media, we have taken an important step forward in understanding the processes polls travel through from their initial collection to their final coverage available to the public. Although polls are often considered newsworthy in nature, we find that there are systematic patterns in how journalists turn these polls into an illusionary political horserace. The overall finding confirms that biases in whether or not polls are covered are not mitigated in the actual reporting but, on the contrary, amplified in the coverage.
We find that selected polls are more likely to be about changes rather than stability. This is despite the fact that most polls show no significant changes. Furthermore, high change poll reporting will focus more on politician voices and commentary and less on important methodological details. As commentators often point out, single outlier polls get a lot of attention. Our results indicate that a thorough consideration and highlight of uncertainty is not part of the coverage that could compensate for such distorted pictures. In other words, the bias in the selection of newsworthy polls is present in the reporting as well.
The findings presented here provide systematic evidence for how the journalistic preference for change has substantial implications for different aspects of the political reporting. Although the model proposed here is useful to make inferences about the political coverage of opinion polls, it can be applied to other types of political coverage. The emphasis on change is not limited to the coverage of polls but matters for the media coverage of other issues such as the economy (Soroka et al. 2015).
There are different ideals for how to report polls as news. One possibility is to report everything, independent of changes and including all information, or potentially reporting only those polls where the indicated changes are significant. Although there are other ideal expectations, these two example scenarios would satisfy the idea of unbiased reporting, but these would generate very different representations of political competition. The media cannot devote attention to all polls, but even if they could, the public demand for horserace coverage would lead to some polls getting more attention than others, especially in competitive media systems.
The dynamics illustrated above have substantial implications for contemporary democracies. Opinions polls have been shown to be the single most important predictor of people’s expectations of parties’ electoral success (Zerback et al. 2015) and can affect the perceived closeness of parties (Cushion et al. 2016). Such perceptions have implications for not only whether people will show up and vote on election day but also for what types of parties that people vote for, especially when voting strategically. When news articles focus on notional changes in public opinion, such changes can have substantial political implications. Although we do not examine the effects of such an emphasis on changes, we see important questions for future inquiry related to the behavioral and attitudinal implications of these dynamics.
The findings presented here corroborate findings in studies from other countries, including the United States. However, some caveats are important to keep in mind. First, the data are collected in a context with limited polarization and largely nonpoliticized news media. We cannot rule out that the effects can be further amplified when additional motivations are included in the framework. For example, the coverage of opinion polls in Denmark from 2011 to 2015 was chosen to provide a relatively homogeneous set of media outlets with no partisan connections or leanings. Although the journalistic preference for change is present in all media systems, future research will have to examine the conditional nature and relative relevance of the preference for change vis-à-vis other motivations. In addition, while the Danish setting outside a context of an election campaign provides a conservative test of our argument as the horserace coverage is less prominent here, additional evidence is needed to substantiate the generalizability of the findings beyond the period studied here.
Finally, our data does not allow us to analyze the mechanisms of why journalists interview sources and avoid reporting information on the margin of error. For the margin of error, Pétry and Bastien (2013) suggest that journalists follow the interpretations put forward by the polling firms. However, if journalists mainly rely on materials from their partner organizations, we should not see the widespread and outlet independent finding at both stages.
Although the increase of public opinion polls has decreased the uncertainty politicians deal with when assessing the state of public opinion (Geer and Goorha 2003), somewhat ironically this decreased uncertainty comes with a potentially stronger bias in the coverage. As shown in the paper, this intertwined process highlights an ever-growing challenge for political journalists. They need to meet the demand for horserace journalism while selecting and reporting opinion polls in a factual and representative manner.
Supplemental Material
_online_supp_-_poll-ijpp-si – Supplemental material for Transforming Stability into Change: How the Media Select and Report Opinion Polls
Supplemental material, _online_supp_-_poll-ijpp-si for Transforming Stability into Change: How the Media Select and Report Opinion Polls by Erik Gahner Larsen and Zoltán Fazekas in The International Journal of Press/Politics
Footnotes
Acknowledgements
We thank Maja Laundrup Christensen, Maria Clara Verdich, and Joachim Jan Pulawski Legh-Smith for excellent research assistance. For valuable feedback, we thank Lars Gylling, Morten Skovsgaard, Martin Ejnar Hansen, Federico Vegetti, Sebastian Popa, Rasmus Tue Pedersen, Yosef Bhatti, Erik Albæk, Kim Andersen, Bjørn Høyland, Arjen van Dalen, the editor, and three anonymous reviewers at the International Journal of Press/Politics.
Authors’ Note
Both authors contributed equally.
Declaration of Conflicting Interests
The author(s) declared no potential conflicts of interest with respect to the research, authorship, and/or publication of this article.
Funding
The author(s) disclosed receipt of the following financial support for the research, authorship, and/or publication of this article: The text coding was funded by the Departmental Grant Scheme at the Department of Political Science and Public Management, University of Southern Denmark.
Supplemental Material
Supplemental material for this article is available online.
Notes
Author Biographies
References
Supplementary Material
Please find the following supplemental material available below.
For Open Access articles published under a Creative Commons License, all supplemental material carries the same license as the article it is associated with.
For non-Open Access articles published, all supplemental material carries a non-exclusive license, and permission requests for re-use of supplemental material or any part of supplemental material shall be sent directly to the copyright owner as specified in the copyright notice associated with the article.