
Abstract

Students are often taught that quantitative analysis is about numbers while qualitative research is about language. Other types of content from these two alternatives, such as visual images, makes research analysis difficult, confusing, or even disorienting. Consequently, an initiate to learning qualitative research may be both eager and confident, but at the same time hesitant to work with images as they remain an undefined terrain. Choosing the unknown implies discomfort (Skukauskaite, Noske & Gonzales, 2018). Opting for a research method that deviates from more conventional analytical approaches can be scary. Consequently, it feels safer to use visual material when they adhere to the linguistic conventions of qualitative research and constrain the use of images solely to support narrative findings.
Visual images can easily support traditional qualitative concepts of research. Afterall, as the adage goes, a picture – and visual material more broadly - is worth a thousand words. There is an increasing interest from researchers in a variety of different disciplines to use images as data. They have certain advantages, especially for participatory types of research where participants are asked to create their own the images, as these images can assist both researchers and participants in “structuring, assessing or explaining their thoughts” (Clark, 2017, p.197). Hence, it would make sense that visual analysis is most suited to certain research questions that use visual materials as a prompt for interviewing or a method to document concrete artifacts that can be immediately discovered and seen. However, in addition to the functions of linguistic elaboration and notation, visual material holds an intrinsic meaning that goes beyond what can be immediately verbally expressed. As depicted in Figure 1, it is often difficult to know how to get started on this next level of visual research for the novice social science researcher, especially without an extensive training in art on how to read visual images. Where does one begin?
The Analytical Apparatus for Visual Imagery (AAVI) proposed here by Hannes & Siegesmund encourages us to think about how to best grasp the meaning of visual material that is not immediately linguistically obvious. This necessitates understanding an image’s tacit knowledge and implies thinking in ways that we are not practiced or trained.
Depiction of confusion when looking at an image.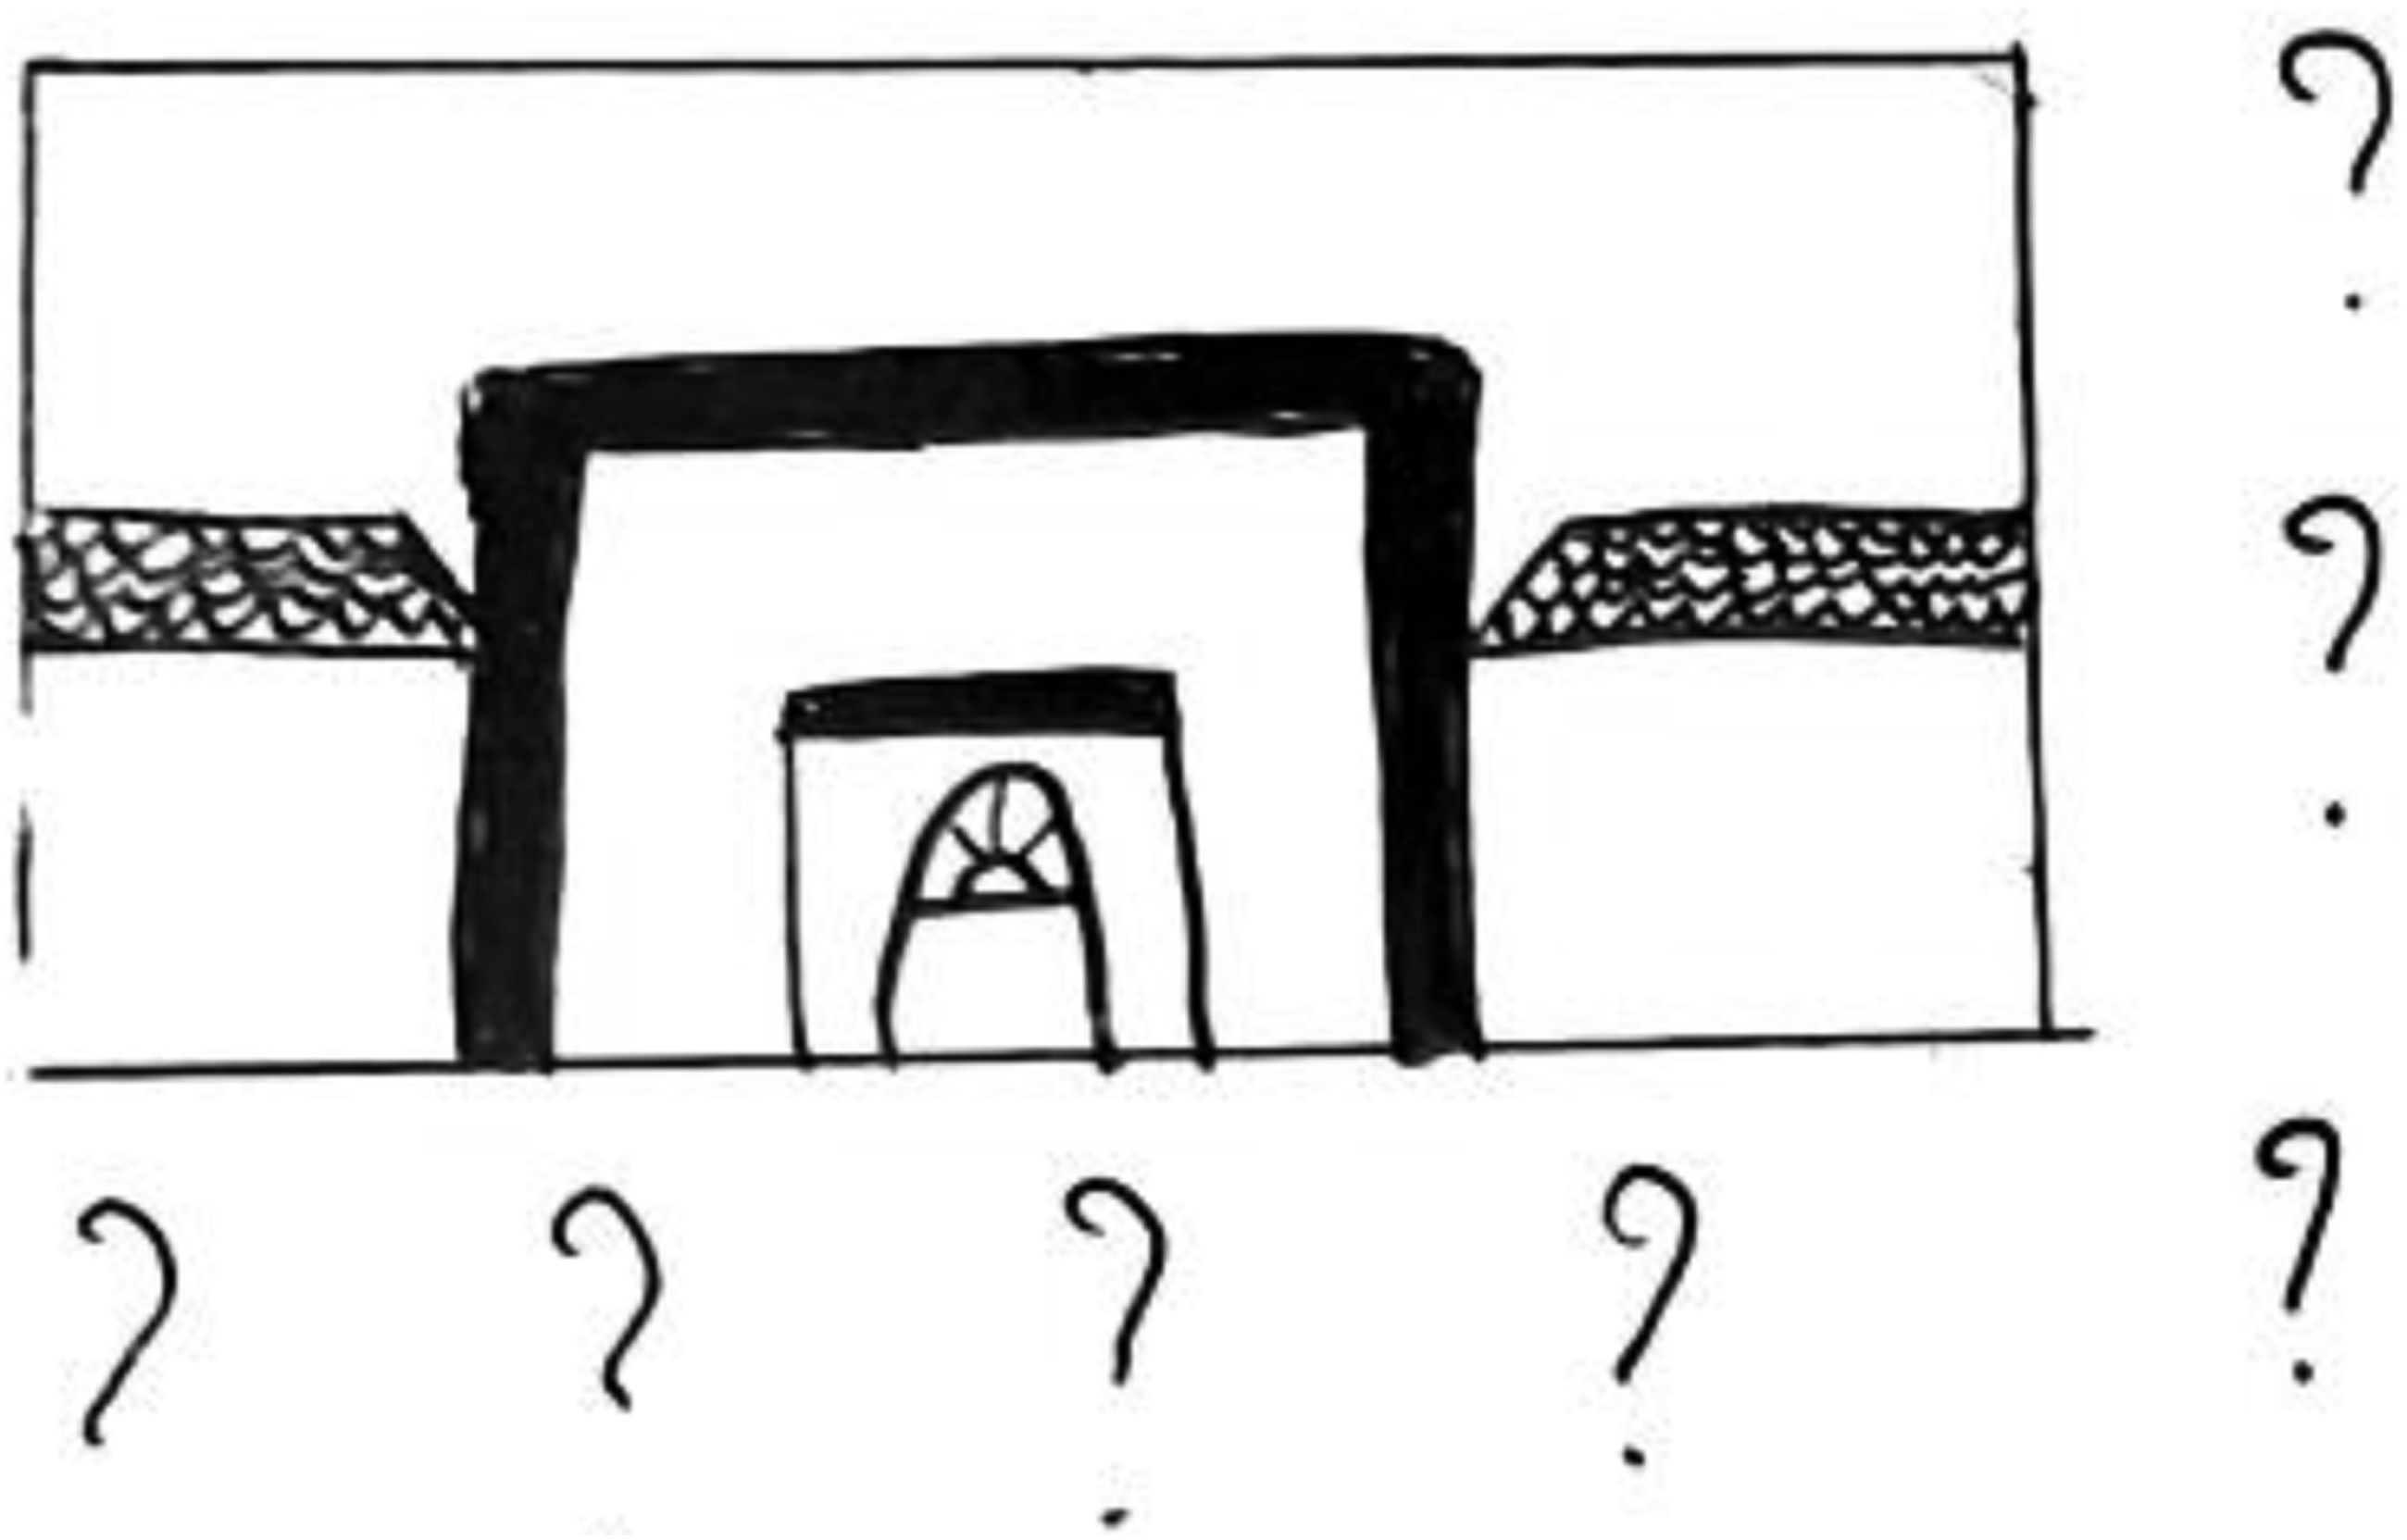
AAVI offers a starting point for young researchers. As illustrated in Figure 2, it provides a much-needed entry for understanding how visual material holds meaning in itself and how to make sense of the intrinsic qualities of images. The good thing is that neither the researcher nor the participants they involve in their research have to be great at things such as making photographs, creating paintings or art installations nor do the researcher or the participants need to have an artistic background. The aim is not to make a great work of art or to make an artistic evaluation of the visual material. The authors simply invite researchers to consider the principles of art and design to scientifically analyze visual data to restore the balance between narratives and images in terms of analytical and interpretive power to create a more comprehensive interpretive storyline. It allows researchers, participants, and audiences to fill-in the entire content depicted in an image.
AAVI’s analytic application draws on methods from the humanities to bodily perceive and associate meaning with aesthetic qualities. By focusing on the sensory and aesthetic level of information embedded in images, AAVI gives an arts-based twist to visual research, especially the notion of somaesthetics (Shusterman, 2006). AAVI provides a useful framework to guide analytical processes in the reading and reporting of visual data by applying the elements of art and principles of design to discern the tacit knowledge base on display, but which may initially be difficult to verbalize. It not only focuses on what is depicted, but also how things are depicted: the visual materiality of an image works beyond the mere symbols displayed to create added layers of meaning and understanding. AAVI focusses on these added layers of images and considers them as a theoretical point that can be referenced.
Visual images, applied in research as documentary evidence, do not show how something really is, but how it is perceived by others and holds meaning for participants and audiences (Clark, 2017). Visual images are interpretive experiences, for the image creator and the viewer. AAVI provides tools to pose questions to participants about their images that help them explain its meaning. It also helps to analyze visual data differently.
Depiction of how AAVI offers clarification.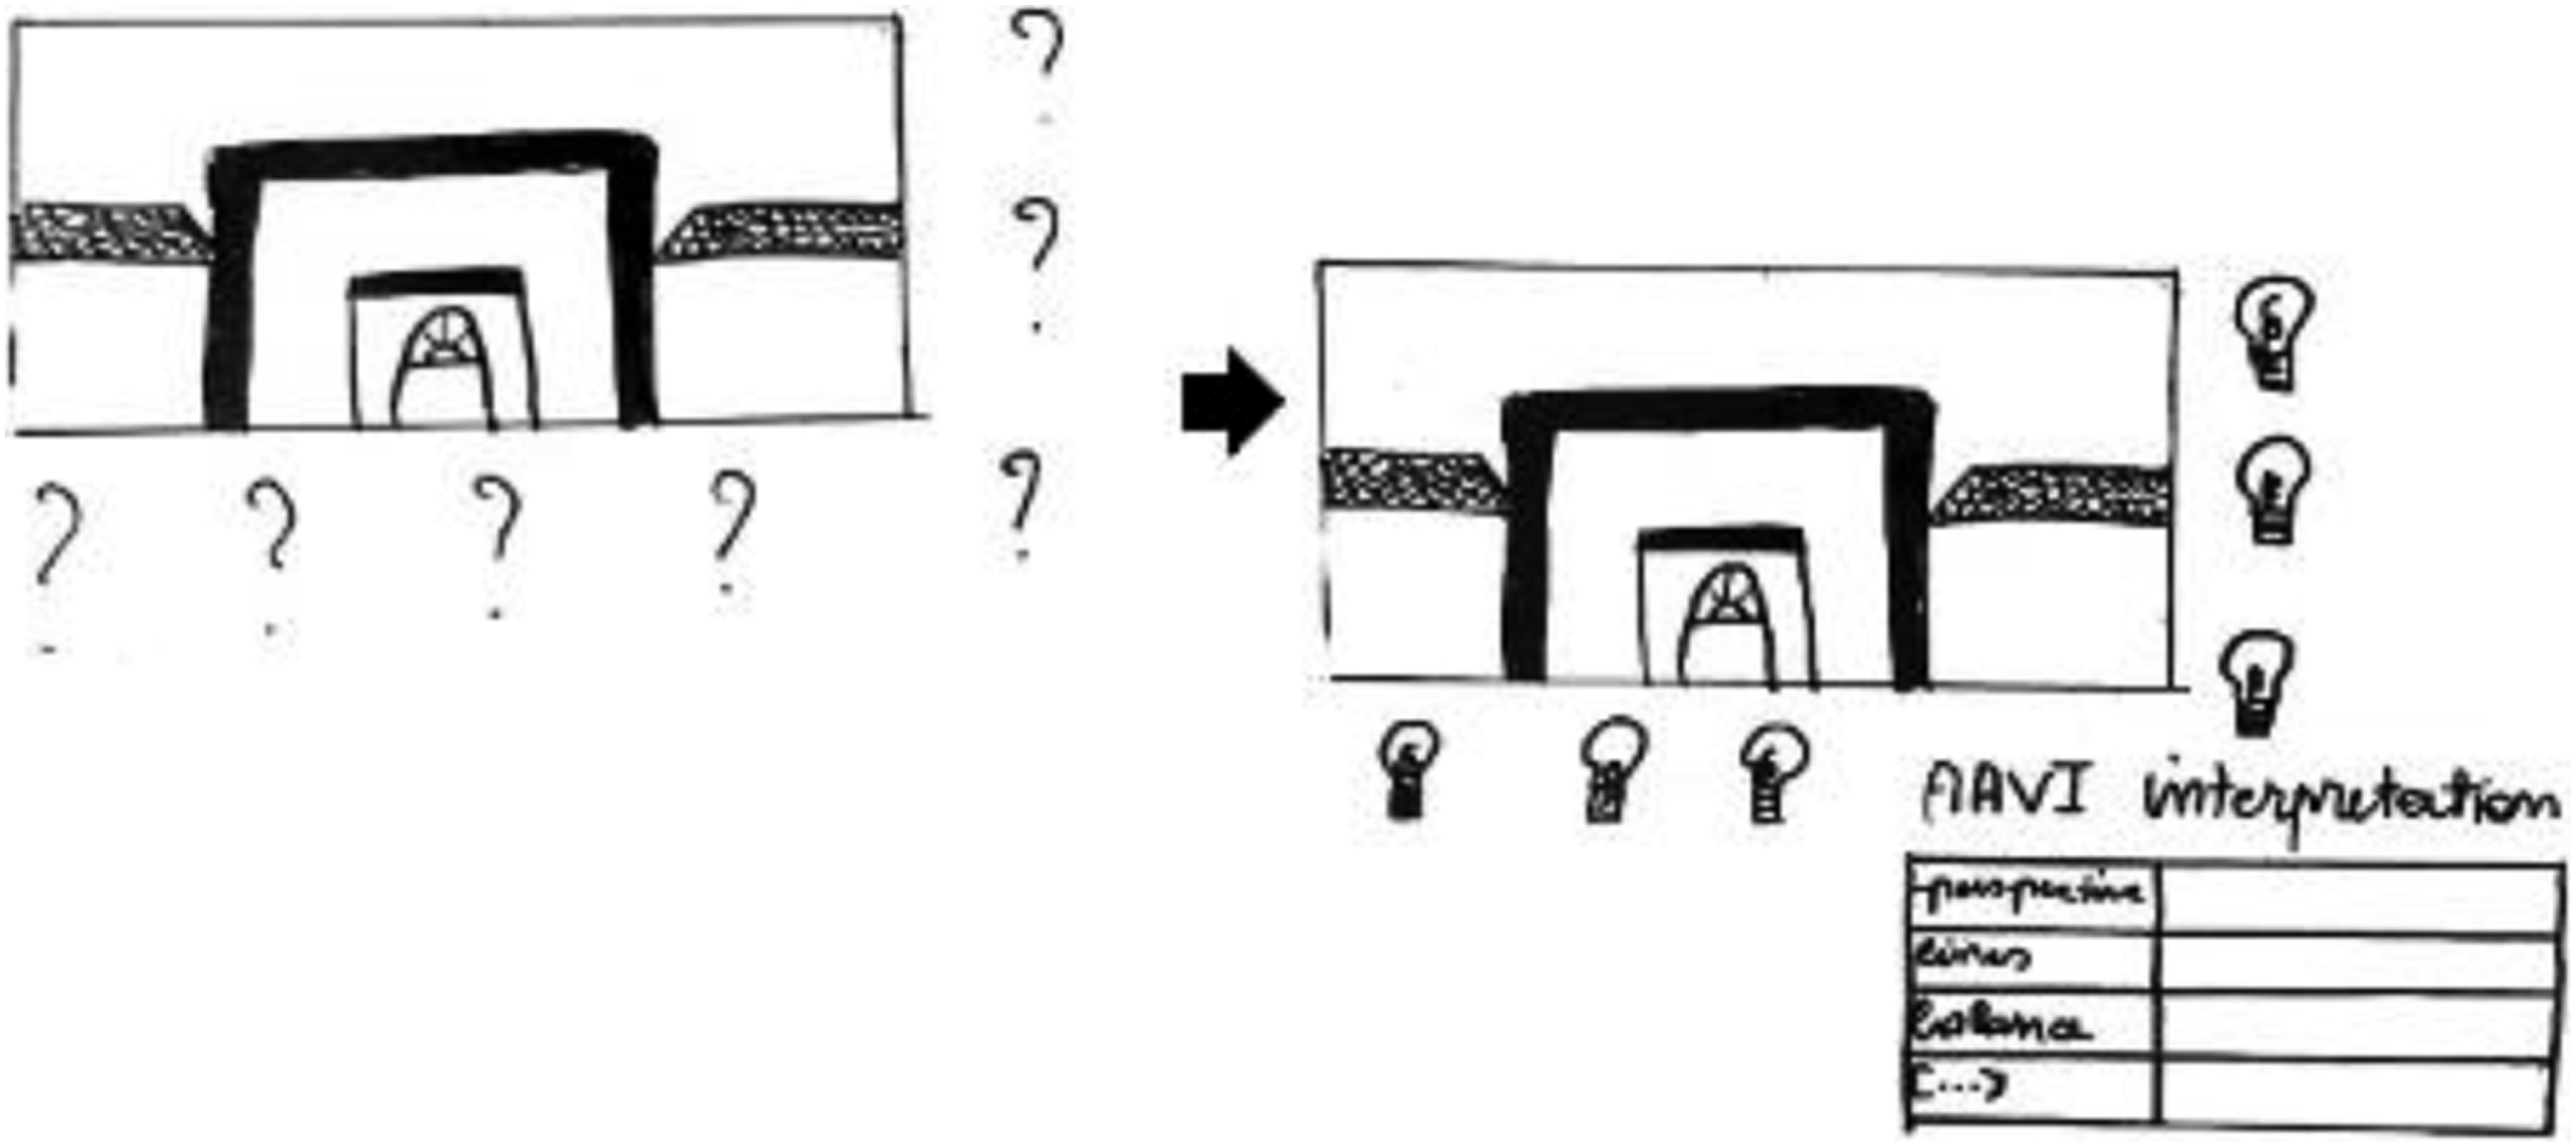
In my own master’s thesis (Weytjens, 2021), I looked at how cultural and aesthetic elements of neighborhoods attract different groups of people. In order to do so, a walkabout approach was used. By interviewing respondents during a walk through their neighborhood, it becomes possible to experience place in a multi-sensory way. Additionally, images were taken by the researcher, which were used to facilitate the representation of the research findings, especially the sensory impression of the neighborhoods that were described by the respondents.
It often occurred that the respondents were unable to translate a certain feeling about their neighborhood into words. For example, when one respondent noted that we crossed the border of the neighborhood, he asked “I don’t know if you felt it?”. Another respondent addressed that being in the neighborhood during the pandemic was not the same, “it's such a shame that you can't feel the atmosphere now, I would find it hard to do a thesis or research on it now because you can't feel it.” Often, the respondents were unable to bring these feelings into words.
In my thesis project, the notes on the sensory experience of the walkabouts that were taken during the interviews and the images that captured some of these sensory elements were only used to provide context for the interpretation of the interviews and representation of the results but were not approached as a data source in themselves. However, using AAVI could have revealed an extra layer of information, especially when the images would have been taken by the respondents themselves. For example, although border lines are invisible, elements of an image such as perspective, color or emphasis can capture and materialize how a person feels and experiences the border that marks the end of their neighborhood.
Some things are difficult – or even impossible – to grasp with the more traditional ways of doing research. Cultural and aesthetic elements of neighborhoods are an example of this. The aesthetics of a neighborhood are about feelings and emotions based on sensory experiences, which are difficult to translate into numbers or words. However, instead of changing the research question it is also an option to search for ways in which it does become possible to get a better understanding of it. It becomes possible to know things that would have otherwise stayed unknown.
Footnotes
Acknowledgements
Thanks to Richard Siegesmund and Karin Hannes for their valuable response to my questions that informed this response letter.