
Abstract
Background:
Reductions in muscle size are common after anterior cruciate ligament reconstruction (ACLR) and may contribute to suboptimal patient outcomes. However, few studies have quantified postoperative alterations in muscle quality and evaluated its associations with patient-reported function.
Hypotheses:
Rectus femoris cross-sectional area (CSA) will decrease postoperatively but improve at return to activity (RTA), rectus femoris muscle quality (percentage fat [PF]) will increase postoperatively and be greater at RTA compared with preoperative values, and rectus femoris CSA and PF will be associated with International Knee Documentation Committee (IKDC) scores at both postoperative time points.
Study Design:
Case series.
Level of Evidence:
Level 4.
Methods:
A total of 26 individuals who sustained an ACL injury and underwent reconstructive surgery were evaluated preoperatively (T0), 9 weeks post-ACLR (T1), and at RTA. Rectus femoris CSA and PF were evaluated bilaterally via ultrasound imaging, and patient-reported function was assessed using the IKDC score.
Results:
Bilateral reductions in rectus femoris CSA were noted from T0 to T1 (P < 0.01). Only the uninvolved limb returned to preoperative CSA (P = 0.80), as the involved limb failed to return to preoperative levels at RTA (P = 0.04). No significant changes in rectus femoris PF were observed across time points (P > 0.05). Lesser PF (P < 0.01) but not CSA (P = 0.75) was associated with higher IKDC score at T1. Lesser PF (P = 0.04) and greater CSA (P = 0.05) was associated with higher IKDC score at RTA.
Conclusion:
Substantial atrophy occurs bilaterally after ACLR, and the involved limb does not return to preoperative muscle size despite the patient completing rehabilitation. Quadriceps muscle morphology is associated with patient-reported function and may be an important rehabilitation target after ACLR.
Clinical Relevance:
Quadriceps atrophy and poor muscle quality may contribute to suboptimal patient functioning and quadriceps dysfunction and may be important in RTA decision making. Assessing muscle morphology using ultrasound may be a feasible and clinically beneficial tool in patients after ACLR.
Approximately 250,000 anterior cruciate ligament (ACL) tears occur annually, with the majority of patients electing reconstructive surgery (ACLR) and subsequent postoperative rehabilitation. 22 Optimizing patient outcomes after ACLR through targeted rehabilitation is an important clinical goal; yet, many individuals consistently report reductions in quality of life and self-perceived knee function at the time of return to activity (RTA).18,28 Substantial quadriceps muscle weakness and morphological alterations are well-documented consequences of injury and reconstruction and are hypothesized to contribute to the suboptimal outcomes reported after ACLR. A wealth of research has established the relationship between indices of quadriceps strength and patient-reported function after ACLR,1,4,28 while less is known about the relationship between muscle morphology and patient-reported function after ACLR.
Quadriceps muscle weakness after ACLR is partially attributable to morphological changes (eg, muscle size and composition) within the muscle.26,32 Muscle atrophy is one of the most notable peripheral morphological alterations after ACLR, with considerable interlimb deficits in muscle size present in the early postoperative phases 11 and later in the recovery process (up to 12 months). 20 Early quadriceps atrophy is attributed to neurological inhibition, limb unloading, and immobilization, 41 while lingering atrophy beyond RTA may reflect the inability of traditional rehabilitation to resolve the substantial early changes in muscle morphology.11,15,25 Unresolved muscle atrophy after postoperative rehabilitation is problematic, as it has been shown to contribute to poor patient-reported knee function observed after ACLR.16,20 In addition to atrophy, alterations in muscle structure and composition (ie, muscle quality) have also been found to contribute to muscle weakness and suboptimal patient function in those with ACLR; yet, far fewer data exist to support this tenet. Currently, there is a dearth of research directly evaluating the effect of ACLR on muscle quality, and it is not well understood whether muscle quality is an additional contributor to patient-reported function in conjunction with measures of muscle size.
Of the few studies examining changes in muscle quality in ACLR patients to date, Noehren et al 24 reported changes in muscle fiber type and cellular alterations after ACLR, while others have showed muscle quality decline (ie, fibrotic infiltration) after ACL injury.6,27 Muscle quality has been studied more frequently outside of individuals with ACLR through measures of intramuscular fat percentage (PF), which estimates the amount of fatty infiltration and noncontractile tissue components in the muscle.8,17,42 Intramuscular PF, independent of muscle size, is related to the overall ability of a muscle to generate force. Muscle with a greater proportion of fibrotic and noncontractile components, such as fat, will have lower force-generating capabilities compared with a muscle with greater amounts of active contractile tissue.7,10 In fact, patients with knee osteoarthritis, who demonstrate quadriceps muscle weakness similarly to ACLR patients, have a higher proportion of intramuscular PF compared with healthy controls.8,12,17 Given that quadriceps muscle size and quality are associated with overall muscle strength, patient-reported function, quality of life, and functional ability in young healthy adults,14,23 individuals with obesity, 40 and the elderly,8,31,37 it seems plausible that a similar relationship may exist in patients after ACLR. Therefore, further study on postoperative alterations in quadriceps size and quality (ie, intramuscular fat content) may expand our understanding of potential contributors to poor patient outcomes after ACLR.
Evaluation of muscle size and quality throughout rehabilitation may be a clinically beneficial assessment of quadriceps function that may aid in identifying individuals who require extended care. Typical assessment of quadriceps function (eg, maximal strength testing) is important for clinical monitoring of rehabilitation progress and for determining readiness to RTA. Strength testing is limited, however, in that it only provides an overall estimate of maximal force production without identifying the intramuscular factors that contribute to the muscle’s force-generating capabilities. As such, identifying additional contributors to overall quadriceps function (eg, intramuscular PF and muscle size) may complement traditional strength assessments, thereby offering a more holistic and objective evaluation of quadriceps function in individuals after ACLR.Unfortunately, methods typically employed to assess muscle quality and size restrict the feasibility of widespread implementation of these measures within the clinical setting. For example, quadriceps muscle size (ie, cross-sectional area [CSA] and muscle volume) are commonly examined using magnetic resonance imaging (MRI) in patients after ACLR.16,25,38 However, MRI-based assessments of muscle morphology are extremely costly and thus are not widely available in the clinical setting. Thigh circumference measurements, on the other hand, are regularly used by clinicians to assess quadriceps size given the ease of measurement; however, evidence suggests that circumference measures may underestimate or lack sensitivity to detect subtle, atrophic changes in the muscle. Furthermore, thigh circumference measurements provide no information regarding muscle quality (ie, intramuscular PF). 10 Conversely, ultrasonography (US) is a portable, cost-effective, and reliable alternative and has been used to quantify both skeletal muscle size and quality in healthy and older adults.8,23,37 Yet, US measures of quadriceps muscle size and quality have not been extensively used in individuals with ACLR. Therefore, assessing quadriceps muscle size and quality (ie, intramuscular PF) via US imaging may provide a cost-effective and clinically feasible tool to longitudinally evaluate quadriceps muscle morphology prior to and after ACLR and requires further study.
As such, the purpose of this study was to evaluate rectus femoris (RF) muscle morphology (CSA and intramuscular PF) using US at 3 time points: preoperative (T0), 9 weeks postoperative (T1), and RTA. In addition, we sought to evaluate the associations between RF muscle morphology and self-reported function as measured by the International Knee Documentation Committee (IKDC) score. We hypothesized that RF CSA and PF of the involved limb would be lower at T1 compared with T0. Furthermore, we posited that CSA would increase from T1 to RTA, but that CSA at RTA would remain smaller when compared with T0. Finally, we hypothesized that RF CSA would be smaller and PF would be greater in the involved versus uninvolved limb across time points and that RF CSA and PF would be associated with IKDC scores at all time points.
Methods
Participants
A total of 26 participants with primary unilateral ACLR were recruited preoperatively for this study (mean age, 16.6 ± 2.7 years.; mean weight, 71.8 ± 17.7 kg; 64% female; 18 bone–patellar tendon–bone, 2 quadriceps tendon, 6 hamstring tendon). Participants were included in this study if they were (1) between 14 and 30 years of age and (2) scheduled to undergo ACLR with bone–patellar tendon–bone, quadriceps tendon, or hamstring tendon graft. Participants were excluded on the following criteria: (1) previous ACL injury or surgery to either limb, (2) current ACL injury that occurred more than 48 hours prior to reporting to their physician, or (3) other ligamentous rupture accompanying the ACL injury (grade I and II medial collateral ligament and lateral collateral ligament injuries were eligible for inclusion in the study). Each participant completed a total of 3 data collection points: preoperative (T0), 9 weeks postoperative (T1), and at RTA. Participants completed testing for each time point at an average of 2.0 ± 2.3 weeks preoperatively (T0), 8.8 ± 2.6 weeks postoperatively (T1), and 40.5 ± 7.7 weeks postoperatively (RTA). Mean IKDC scores at each time point were 56.4 ± 14.4 (T0), 50.5 ± 9.7 (T1), and 85.9 ± 8.5 (RTA). All individuals and the legal guardian(s) of participants younger than 18 years provided informed written consent. All aspects of this study were approved by the University of Michigan Medical School Institutional Review Board.
Postoperative Rehabilitation and Return to Activity Determination
All participants in this study completed postoperative standard-of-care rehabilitation consisting of 2 or 3 sessions per week at a single University of Michigan–affiliated clinic. The standard-of-care protocol was initiated at the first postoperative appointment and was completed approximately 7 to 9 months postreconstruction. To be cleared to RTA, patients were required to exhibit appropriate joint laxity, with no effusion, and to possess full knee joint range of motion. Additionally, patients were required to complete and pass a leg-press test and a single-leg hop test before clearance. To successfully complete the leg-press test, patients were required to perform 15 unilateral leg-press repetitions with the ACLR limb and load equal to 100% of body weight. Successful repetitions were recorded if the patients achieved 90° of knee flexion and returned to a neutral resting position. For hop testing, patients were required to complete a single-leg forward hop at 80% or greater of their height with good control/form. After passing both the leg-press test and single-leg hop, all patients underwent 3 weeks of progressive agility training that consisted of skipping and running (forward and backward), cariocas, cutting movements, shuttle runs, and double-leg hops. Patients were cleared from the agility program if they could complete all sets and repetitions of each exercise at the highest degree of difficulty without pain or swelling in the involved limb. Patients who did not successfully complete the leg-press test, hop test, or agility program were not cleared for RTA and resumed rehabilitation and the agility program until they met acceptable criteria.
Quadriceps Ultrasonography
US image acquisition was performed while participants lay supine on a padded treatment table. RF CSA and intramuscular PF were assessed in the involved and uninvolved limb at 15 cm proximal of the superior border of the patella, on a line from the anterior superior iliac spine (Figure 1) using a GE LogiqE US (GE Healthcare). 21 The transducer was aligned in the transverse plane, and split-view images were placed together to view the entire muscle (10 MHz; gain, 46; depth, 4.5 cm); scans were repeated on each limb. All images were acquired by a single investigator who was not blinded to limb status, and 1 image from each limb was used for analysis and rated by a separate blinded investigator. Intra- and interrater reliability has been established for RF CSA and echo intensity (intraclass correlation coefficient [ICC], all >0.8). 9 Additionally, intersession reliability has been previously established for US assessment of RF CSA and PF (ICC, 0.988 and 0.980, respectively) and standard error of measurement (SEM, 7.01%, and 3.07%, respectively). 2
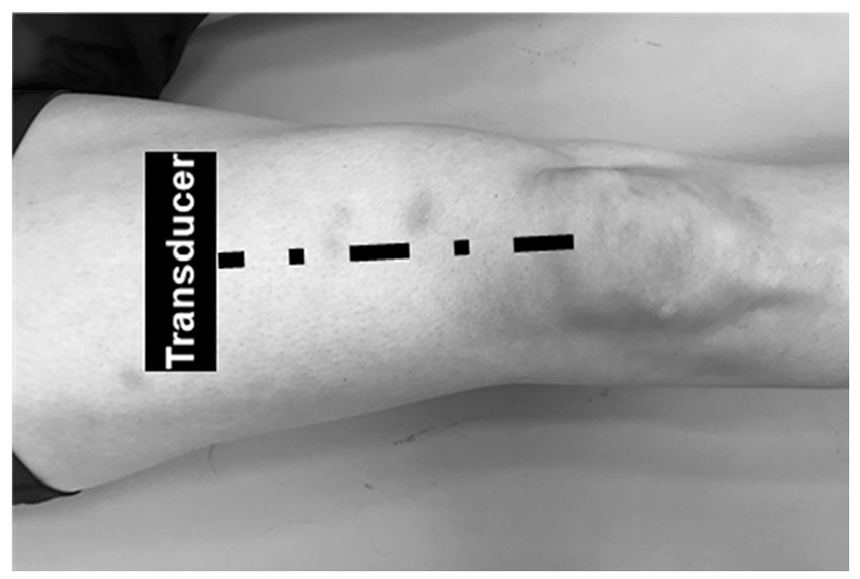
Experimental setup of rectus femoris ultrasonography acquisition. Dashed line represents 15 cm proximal of the superior border of the patella, on a line from the anterior superior iliac spine. The transducer (black box) was aligned in the transverse plane, and careful care was taken to minimize compression on the skin and underlying muscle.
Patient-Reported Outcomes
Self-reported knee function was assessed using the IKDC score, which has been validated for use in individuals with knee pathology. 13 The IKDC assesses perceived knee joint function in tasks ranging from activities of daily living to sport-related movements. IKDC was assessed at all data collection time points prior to completing any US testing. IKDC scores were graded on a scale from 0 to 100, with 100 indicating higher levels of subjective knee function.
Data Reduction
All US images were analyzed using Image J software (National Institutes of Health), and each image was scaled from pixels to centimeters prior to all measurements. For each variable, 3 separate measurements were completed and averaged together for analysis. RF region of interest (CSA) was selected by tracing the muscle cross section from US images while excluding the hyperechoic fascia (Figure 2); RF CSA was normalized to body mass for analysis (cm2/kg). 14 To calculate PF, subcutaneous fat thickness was measured using the straight-line function in ImageJ between the skin-muscle interface and the superior border of the muscle’s aponeurosis at 3 sites (lateral, center, medial), and the mean was used for analysis (Figure 2). Echo intensity was measured by analyzing the grayscale of all the pixels within the region of interest (scale, 0 [black] to 255 [white]) and represents the amount of noncontractile components and fatty infiltration within the muscle.29,42 For reference, greater echo intensity values (ie, lighter areas) are representative of higher fibrotic or noncontractile tissue content, whereas muscle appears darker and has lower echo intensity values. However, subcutaneous fat thickness independently influences muscle echo intensity values, as greater fat thickness may result in greater US attenuation subsequently resulting in lower echo intensity values (ie, darker).30,42 Thus, correction equations developed by Young et al 42 were employed in our study to account for this confounding factor. To calculate RF intramuscular PF, we inputted subcutaneous fat thickness and echo intensity measurements derived from US images into sex-specific regression equations, which have been shown to improve the relationship between muscle echo intensity and intramuscular PF derived from gold-standard MRI techniques. 42 The methods used to construct regression equations from US images are described in detail elsewhere. 42 For the sex-specific equations listed below, y corresponds to RF intramuscular PF, z corresponds to subcutaneous fat thickness, and x corresponds to echo intensity. 42
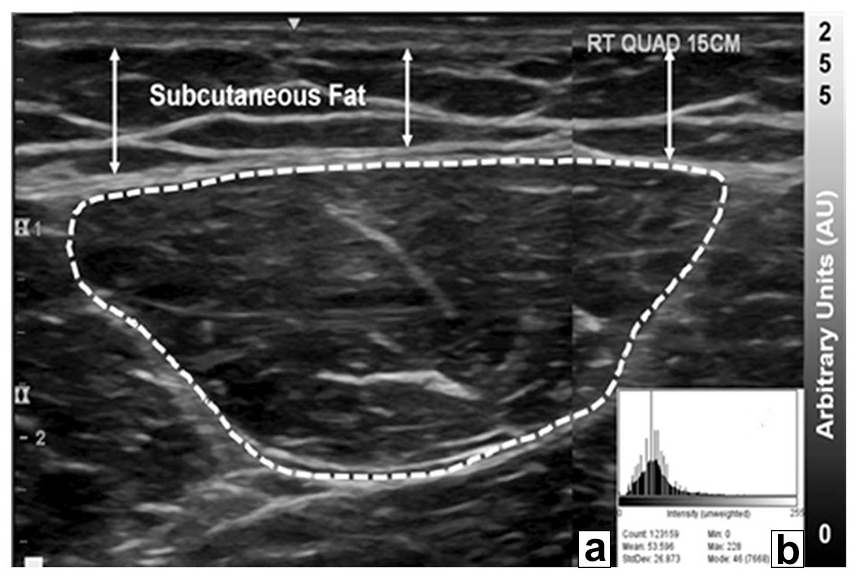
Representative image of rectus femoris ultrasonography acquisition. Key: In image A, arrows denote the locations where subcutaneous fat thickness was measured from the skin-muscle interface to the superficial border of the muscle’s aponeurosis using the ImageJ straight-line function. The dashed line represents the traced region of interest (ROI) of the rectus femoris using the polygon function on ImageJ. Rectus femoris cross-sectional area (cm2) and echo intensity (0-255 arbitrary units) were obtained from within the dashed ROI. The range of echo intensity values are depicted on the grayscale to the right of the image. For reference, muscle on ultrasonography images show as anechoic, or darker on the grayscale, and fibrotic and/or noncontractile tissues show as hyperechoic, or lighter on the grayscale. Image B is the plotted range of echo intensity within the entire ROI using the ImageJ histogram function and shows the heterogeneity of echo intensity values within a muscle.
Statistical Analysis
Statistical analyses were performed using SPSS (Version 24; IBM Corp). Separate 2 × 3 repeated-measures analysis of variance was used to compare dependent variables (RF CSA and PF) between limbs and across time points (T0, T1, and RTA). Significant interactions were followed up post hoc with Bonferroni multiple comparison procedures. Separate linear regressions (enter method) were used at each time point to evaluate the associations of variables of interest (RF CSA and PF) on IKDC scores. Alpha levels on all statistical techniques were set at α ≤ 0.05.
Results
RF CSA and PF
Means and standard deviations for dependent variables can be found in Table 1. A time-by-limb interaction was found for RF CSA (F = 3.662; P = 0.04) (Table 2) but not for PF (F = 3.188; P = 0.06). P values from significant interactions are shown as Bonferroni adjusted, and significance was evaluated as α ≤ 0.05. Post hoc analyses of the interaction showed that the involved limb RF CSA decreased from T0 to T1 (P < 0.01) and increased from T1 to RTA (P = 0.03). RF CSA for the uninvolved limb also decreased from T0 to T1 (P < 0.01) but was not different between T1 to RTA (P = 0.41). At RTA, involved limb RF CSA was significantly smaller compared with T0 (P = 0.04), while the uninvolved limb was not (P = 0.80). Involved limb CSA was not smaller compared with the uninvolved limb at T0 (P = 0.53). However, involved limb CSA was significantly smaller than the uninvolved limb at T1 (P < 0.01) and at RTA (P = 0.01). No significant differences in RF PF were found across time points or between limbs (P > 0.05 for all).
Average rectus femoris ultrasonography measures across time points, mean (SD)
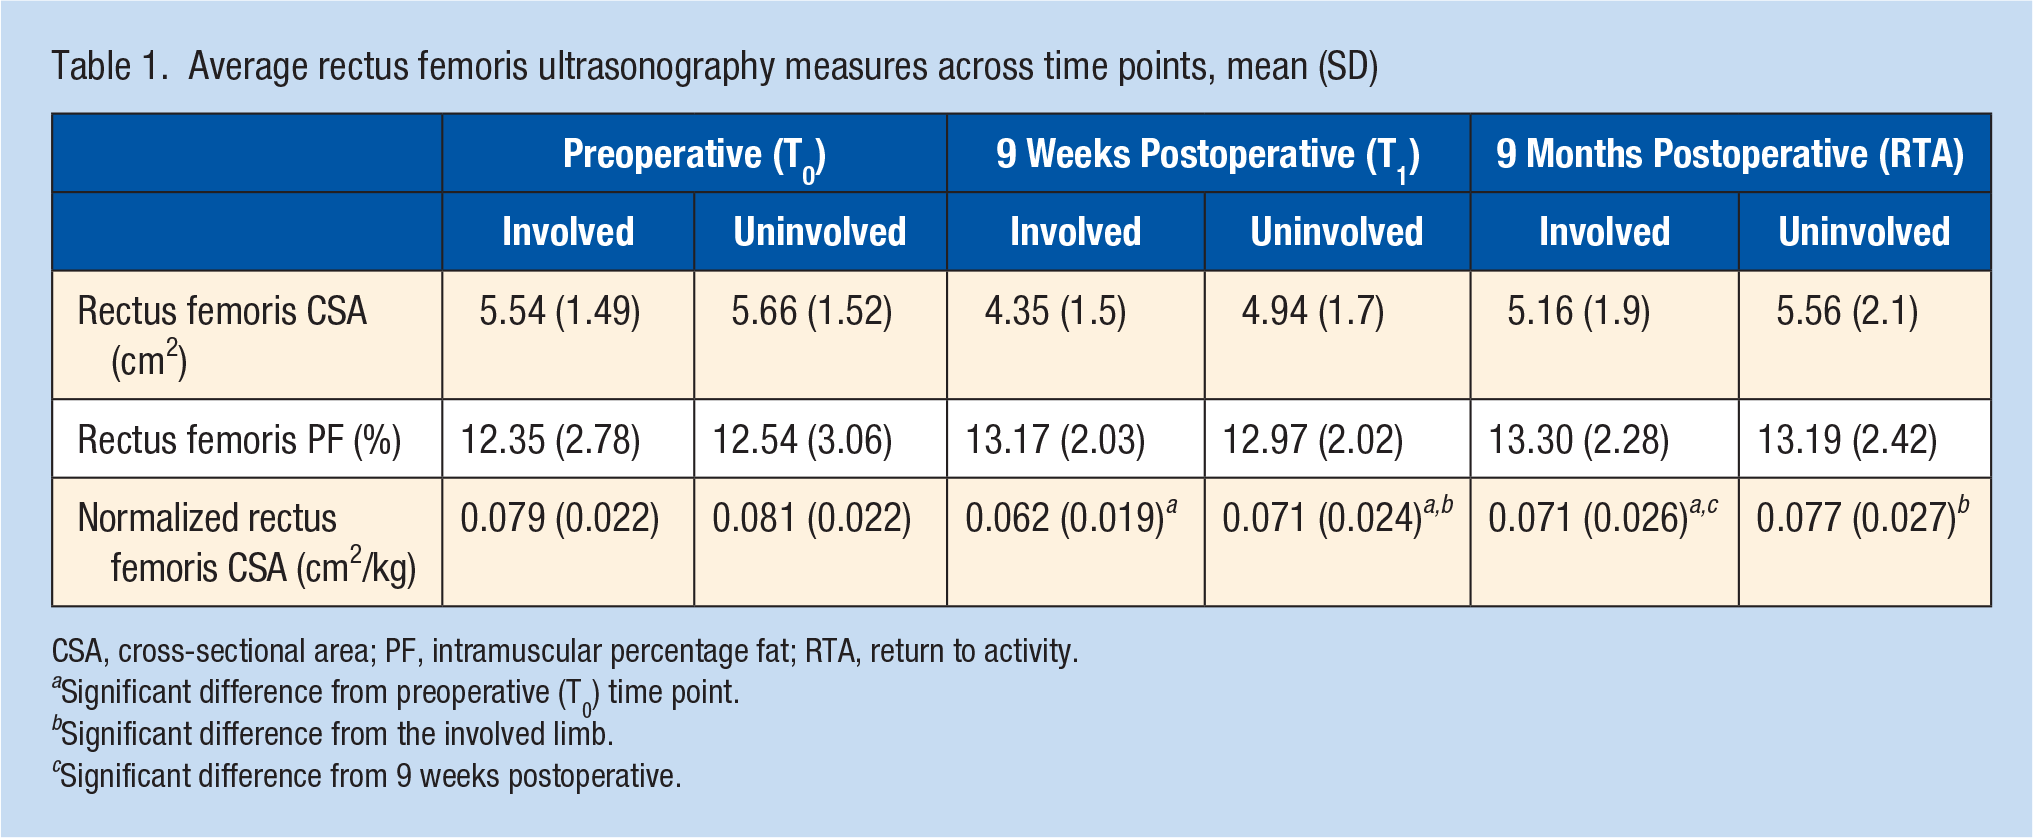
CSA, cross-sectional area; PF, intramuscular percentage fat; RTA, return to activity.
Significant difference from preoperative (T0) time point.
Significant difference from the involved limb.
Significant difference from 9 weeks postoperative.
Relationship Between RF CSA, PF and IKDC Score
Linear regression results for RF CSA and PF can be found in Table 2. No associations were found between RF CSA and PF at T0 (P = 0.76 and P = 0.37, respectively). At T1, RF CSA and PF were entered into the regression model but only PF was associated with IKDC score and explained a total 37.7% of the variance (F1, 25 = 14.502; P < 0.01). At RTA, RF CSA and PF were associated with IKDC score (ΔR2 = 0.124; P = 0.05 and ΔR2 = 0.165; P = 0.036, respectively). At RTA, the addition of both RF CSA and PF in the final model explained a total 28.9% of the variance in IKDC scores (F2,24 = 4.887; P = 0.017). The variance inflation factor of the 2 factors did not suggest multicollinearity; thus, both variables were retained in the model.
Linear regression results examining the associations between rectus femoris morphology and IKDC scores (N = 26)
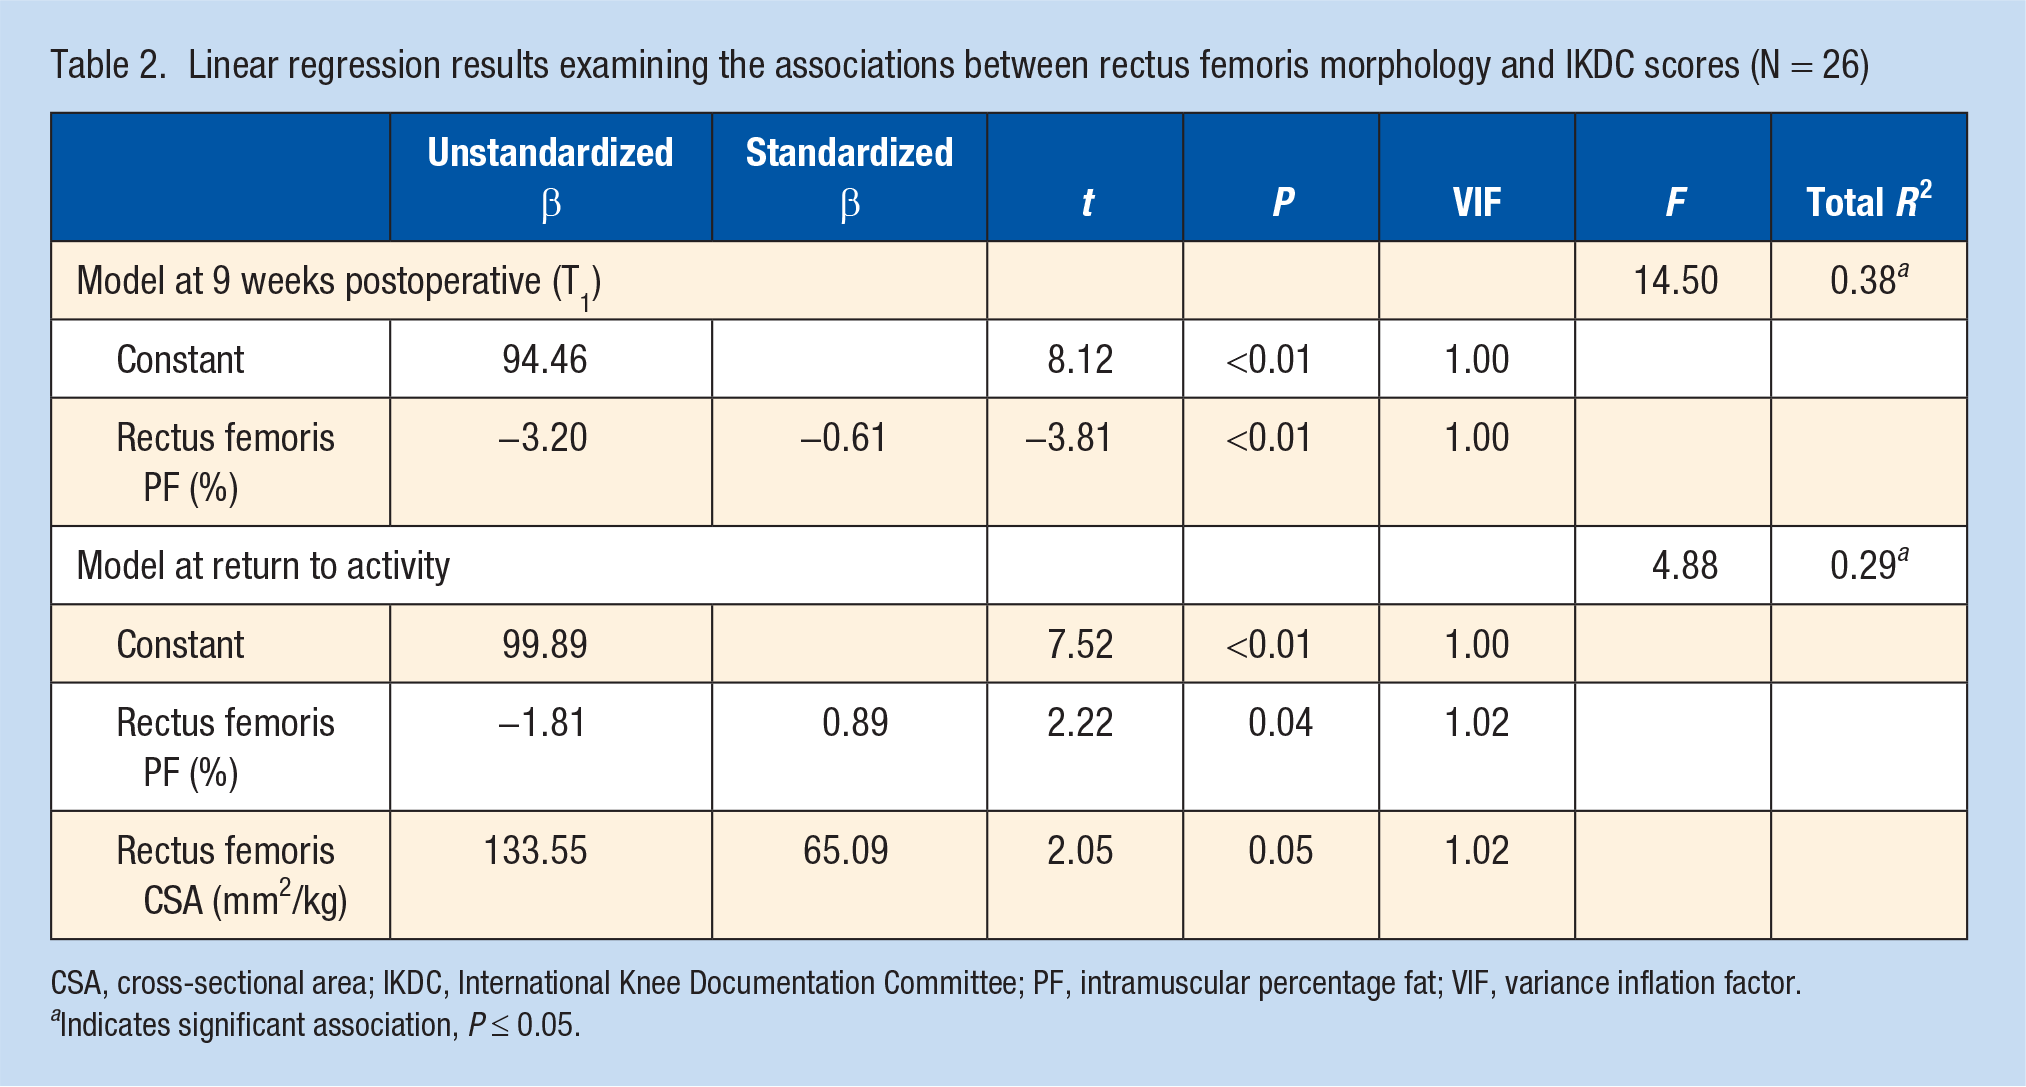
CSA, cross-sectional area; IKDC, International Knee Documentation Committee; PF, intramuscular percentage fat; VIF, variance inflation factor.
Indicates significant association, P ≤ 0.05.
Discussion
The purpose of this study was to evaluate US-derived measures of RF CSA and intramuscular PF before and after ACLR and to determine the association between RF size (CSA) and quality (PF), measured via US and patient-reported function assessed with the IKDC. Substantial RF atrophy occurred bilaterally after ACLR and was not restored at the time of RTA. Additionally, better RF muscle composition (ie, lesser PF) was associated with higher IKDC scores at 9 weeks postoperative (T1) and at RTA. Greater RF CSA was associated with higher IKDC scores only at RTA.
Results of this study indicate that significant RF atrophy occurs bilaterally early in the postoperative phase after ACLR (ie, first 9 weeks). Specifically, we observed atrophy of 21.5% in the involved limb and 12.3% in the uninvolved limb at 9 weeks post-ACLR compared with preoperative values. Grapar Žargi et al 11 reported postoperative atrophy in the involved limb of approximately 17.4% at 4 weeks post-ACLR, which is slightly less than our observed values (21.5%) but at an earlier time point. However, the authors did not observe significant atrophy in the uninvolved limb, which is contrary to our results. 11 Additionally, we observed significant increases in RF CSA bilaterally from T1 to RTA, yet the involved limb remained significantly smaller than preoperative values at RTA (10.12%). As such, our results suggest a failure to restore involved limb quadriceps muscle morphology at the time of RTA clearance.
Deconditioning of the quadriceps femoris through joint unloading and immobilization contribute substantially to early postoperative muscle atrophy after ACLR. 41 Additionally, diminished quadriceps voluntary activation occurs bilaterally after ACL injury and reconstruction, which may contribute to bilateral atrophic changes in muscle morphology in the first few months after surgery. 26 In the current study, while both limbs demonstrated atrophy at 9 weeks, only the uninvolved limb improved to similar preoperative values at the time of RTA, which may indicate a differential response between limbs to rehabilitation exercises. This may be explained by recent evidence in which a lower number of satellite cells were observed in the involved quadriceps compared with the uninvolved quadriceps in those with ACLR.6,24 Satellite cells are critical for regenerating skeletal muscle and implicated in how muscle may adapt in response to resistance exercise.6,7 Therefore, the failure of traditional rehabilitation exercise to restore quadriceps size after ACLR may be partially due to underlying reductions in muscle satellite cell content. Future research is needed to understand if and/or how to facilitate satellite cell recovery in the involved limb quadriceps muscle, either through therapeutic exercise or other modalities.
Interlimb deficits in RF CSA existed throughout all postoperative time points (13.3%T1 and 6.8%RTA, respectively), while no significant interlimb deficits existed preoperatively at T0 (2.5%). Nonetheless, evaluating limb symmetry values is common in clinical decision-making criteria, which often use cutoff values of 90% of the uninvolved limb to monitor progress in rehabilitation and evaluate readiness for RTA. However, the efficacy of using the uninvolved limb as a valid comparison has been challenged, as voluntary activation and strength deficits are seen bilaterally after ACLR. 39 Similarly, our cohort of participants displayed RF CSA values that exceeded this commonly used threshold (93.2% limb symmetry index), but they still presented with substantial atrophy (10.12%) compared with preoperative values. While limb symmetry index cutoffs have been established for quadriceps strength and hopping measures, symmetry standards or cutoffs have yet to be established for quadriceps muscle size. Data from young, recreationally active individuals suggest minimal asymmetry in knee extensor size (average, 0.5% ± 4.5%), perhaps suggesting that muscle size symmetry is a characteristic of healthy individuals. 33 Therefore, restoring quadriceps muscle symmetry may be an appropriate and important target during rehabilitation post-ACLR to restore healthy quadriceps function. Future research is warranted to understand whether improving quadriceps muscle size symmetry in individuals with ACLR will lead to improved patient outcomes.
Our data suggest that unresolved quadriceps muscle atrophy and muscle size asymmetry exist at the time of RTA. Importantly, these deficits exist despite a patient’s passing RTA criteria, which may indicate that either more rigorous or additional criteria are needed to evaluate these factors throughout rehabilitation and at the time of RTA. Nonetheless, ameliorating muscle atrophy and asymmetry should continue to be an important target during postoperative rehabilitation after ACLR. High-intensity eccentric exercise has been touted as superior to eliciting muscle hypertrophy over concentric exercise, partially due to a greater recruitment of high-threshold type II muscle fibers, which are selectively atrophied after ACLR.5,19 However, substantially less is known about the effect of high-intensity exercise (either concentric or eccentric) on muscle intramuscular PF, which would be particularly important information for clinicians and researchers. Cadore et al 3 reported reductions in vastus lateralis echo intensity (a surrogate for intramuscular PF) after 6 weeks of progressive isokinetic exercise, but they noted that the magnitude of improvements did not differ between eccentric or concentric training groups. Thus, an opportunity exists for future work to aid in identifying potential rehabilitation strategies that directly target improving quadriceps intramuscular PF in individuals after ACLR.
A major critical barrier to the widespread clinical use of muscle morphological assessments is the substantial cost commonly associated with these methodologies. Multiple studies have endorsed the use of US imaging as an alternative to traditional MRI,36,42 yet few studies exist in individuals with ACLR despite the substantial cost-effectiveness of the measure. Results from our study may support the use of US measures of quadriceps morphology, as all observed changes across time points were greater than previously established between-session SEM in RF US (7.1%). 2 Furthermore, we observed similar percentage differences in quadriceps CSA in comparison with previous MRI assessments of muscle volume. For example, Grapar Žargi et al 11 revealed a 17.4% decrease in involved limb quadriceps muscle volume from preoperative to 4 weeks postoperative, while our cohort displayed a 21.5% decrease in CSA at 9 weeks. Additionally, Konishi et al 15 reported a 5.4% involved limb deficit in RF volume in individuals between 6-month and 1-year post-ACLR, which is similar to our 6.8% interlimb deficit in RF CSA at RTA. However, we are reluctant to make direct comparisons between our study and others, as we measured RF CSA whereas the majority of previous research evaluated quadriceps muscle volume. Nonuniform quadriceps atrophy has previously been noted, which may not be fully captured using a single CSA measure.25,34 For instance, data from the Osteoarthritis Initiative showed differential atrophy to the individual quadriceps muscle in response to pain, as the vastus lateralis exhibited the largest amount of atrophy. 34 Thus, only measuring RF in our study may have led to underestimations of quadriceps atrophy in our cohort. Unpublished data (S. A. Garcia, unpublished data, August 2018) from our laboratory (N = 18) indicate that RF and vastus lateralis CSA are indeed correlated with each other (r = 0.605 and r = 0.635 for the involved and uninvolved limb, respectively), although the correlations indicate that a portion of variance remains unexplained. Therefore, future work is needed to assess postoperative atrophic changes in the entire quadriceps femoris using US to identify whether selective or uniform atrophy occurs in individuals with ACLR.
Our results suggest that RF PF is associated with IKDC scores at T1 and RTA, while RF CSA was only associated with IKDC at RTA. Kuenze et al 16 previously demonstrated that vastus intermedius partial muscle volume examined with MRI was associated with IKDC scores; however, we are unable to directly compare findings, as little research has been conducted on US measures of muscle morphology after ACLR. Our results also suggest that lesser RF intramuscular PF is associated with higher IKDC scores at T1 (ΔR2 = 0.377) and at RTA (ΔR2 = 0.165). Intramuscular PF has been evaluated using MRI in individuals diagnosed with knee osteoarthritis and is associated with quadriceps strength and physical functioning. 17 Additionally, a negative relationship between muscle size and muscle composition (ie, quality) has been reported previously in the elderly, with lesser muscle size associated with greater noncontractile components and fatty infiltration within the muscle. 37 Furthermore, the overall force-generating capacity of muscle is influenced independently by size and composition.8,14,36,37 As such, alterations in quadriceps morphology (CSA) and composition (PF) may negatively affect patient-reported outcomes after ACLR.
This study is the first to longitudinally evaluate quadriceps morphological alterations prior to and after ACLR via US. However, our results must be considered within the context of their limitations. Our assessments of RF muscle morphology were only collected at 1 site, which does not allow us to fully evaluate quadriceps muscle volume. Recently, panoramic-mode US images have been demonstrated as a novel and reliable technique to measure total muscle CSA, particularly in larger muscles such as the vastus lateralis. 35 Thus, future studies may benefit from the use of panoramic-view US measuring muscle CSA in all the heads of the quadriceps femoris. Additionally, measuring multiple cross-sectional images across the length of the quadriceps femoris muscles would allow for an estimation of total muscle volume. 35 While this technique has not been applied in individuals with ACLR, future studies may benefit from this method to identify whether muscle volume estimates from US offer a more robust assessment of morphological alterations after ACLR.
Conclusion
Bilateral quadriceps atrophy is present in the early postoperative phase, and substantial deficits in involved limb CSA are not ameliorated at the time of RTA clearance. Quadriceps muscle composition, assessed using estimates of intramuscular PF, is associated with self-reported function during rehabilitation and at RTA after ACLR. Assessing quadriceps size and composition using US may be of benefit clinically to monitor individual progress throughout rehabilitation.
Footnotes
The following author declared potential conflicts of interest: R.M.P.-S. is an associate editor for Sports Health.