
Abstract
Background:
Previous studies have examined the relationship between external load and creatine-kinase (CK) response at the team level. This study aimed to build individualized CK prediction models for elite youth national team soccer players.
Hypothesis:
The CK response of youth soccer players can be categorized as being sensitive to micromovements (MM), high-velocity (HV) parameters, or the combination of both, measured during training sessions and matches.
Study Design:
Prospective cohort study.
Level of Evidence:
Level 4.
Methods:
A total of 25 U16-U17 youth national team soccer players were monitored during training sessions and matches using global positioning system (GPS) units. Individual CK values were measured every morning from whole blood. The data set consisted of 57 ± 17 individual datapoints per player. Individual prediction models were used to examine the relationship between external load and consecutive CK changes. Numerous models were built for each player using MM, HV parameters, or the combination of both. The performance of the models was described by the R2 and the root mean square error (RMSE, U/l for CK values).
Results:
The MM models were superior for 8 players (R2 = 0.68; RMSE = 113 U/l), followed by HV (8 players; R2 = 0.69; RMSE = 88 U/l) and the combined models (2 players; R2 = 0.64; RMSE = 141 U/l). For the remaining 7 players, the R2 of the models was <0.5. The recovery time between efforts was more important in the HV model.
Conclusion:
Players could be categorized on sensitivity to MM, HV movements, or the combination of both.
Clinical Relevance:
These findings can be used to individualize postmatch recovery strategies and to optimize weekly training periodization to maximize match performance.
Keywords
Given the increasing physical demands of elite soccer over the last 2 decades, posttraining and postmatch fatigue monitoring is commonplace. In the Premier League, the maximal velocity of the players increased, and the average distance per sprint has decreased simultaneously. 1 This suggests that short, sharp accelerations, decelerations and changes of directions are becoming more frequent in soccer. 1 Equally, national team players face congested periods during training camps and tournaments, in which 2 to 8 international matches are scheduled every 2 to 4 days.20,23
Previous research has confirmed the utility of creatine kinase (CK) as a muscle damage marker to monitor acute and residual fatigue of the skeletal muscle. 7 Most studies have compared prematch with postmatch CK values for this purpose.7,22 Elevated CK values have been shown to negatively affect physical output during training sessions. 16 Due to this, and the long recovery period of CK after intense training sessions or matches, 7 it is important to determine the relevant external load parameters that influence CK changes. 10 Global positioning systems (GPSs) are used widely in elite sport to measure external load during training sessions and matches. 24
Previous research on the most sensitive external load parameters that predict CK changes has reported conflicting findings. One of the earliest studies in this area suggested that high-intensity and sprint distance, as well as sprint number, during a game correlated with the CK changes after the match. 25 According to a recent systematic review, high-intensity running distance (>19.8 km/h) was the most sensitive external load parameter to predict CK changes 24 hours after matches, but not after 48 hours. 10 Conversely, decelerations and accelerations made the greatest contribution to the CK prediction model in a 14-day preseason training camp in adult soccer players. 2 Another study found significant associations (r = 0.48-0.58) between distance >21 km/h and CK at 24 hours postmatch, distance >14 km/h and CK 48 hours postmatch as well as between accelerations/decelerations and CK change at 48 hours postmatch in U19 soccer players. 4 In our recent work, we found positional and activity-type (training, compensation, match) differences in the most relevant external load parameters in youth national team soccer players. 20 Despite previous studies demonstrating the predictive ability of external load parameters on CK changes at the team level,2,4,10,20,25 the question arises whether differences might exist in the most influential external load parameters at an individual-specific level.
These external load parameters might provide a noninvasive alternative to plan the recovery process of players after matches. In addition, examining the relationship between external load parameters during training sessions and CK changes might help optimize weekly periodization and match-day physical performance. However, based on the current evidence, it is unclear if high-velocity (HV) actions or micromovements (MM; accelerations, decelerations, and changes of directions) are more influential on the CK response of youth soccer players.
Therefore, the aim of this study was to examine the individual relationship between external load parameters measured during training sessions and matches with CK change between preactivity and the following morning in male youth national team soccer players. We aimed to determine whether HV, MM-type external load parameters, or the combination of both, were more influential on the CK changes of the players.
Methods
Subjects
A total of 25 elite male national team soccer players were monitored during the 2018 to 2019 seasons in national team training camps consisting of international friendly (U16 and U17) and competitive (U17 European Qualifications, U17 European Championship, U17 World Cup) matches. Subject characteristics are as follows (mean ± SD): age, 15.9 ± 0.3 years; height, 182.5 ± 6.2 cm; mass 75.2 ± 6.5 kg. All players performed 5 to 7 training sessions and 1 to 2 matches per week. The study was approved by the ethical review board of the University of Physical Education (Budapest, TE-KEB/No9/2020), and the players and their parents provided informed consent to participate in the study. The investigation conformed to the Code of Ethics of the World Medical Association.
Design
This study used an observational research design and was conducted between April 1, 2018 and November 30, 2019. Players took part in 3 different types of training camps (Figure 1). Based on the findings of Ehlers, 8 we linked the athletes’ CK concentration with their external load on the day preceding CK measurement. Datapoints (pairs) were omitted where either the CK concentrations or the external load parameters were not available. The aim was to build personalized machine learning models for each athlete that predicted the CK value of the athletes on the next morning, knowing the actual CK value and the training or match load on any given day.
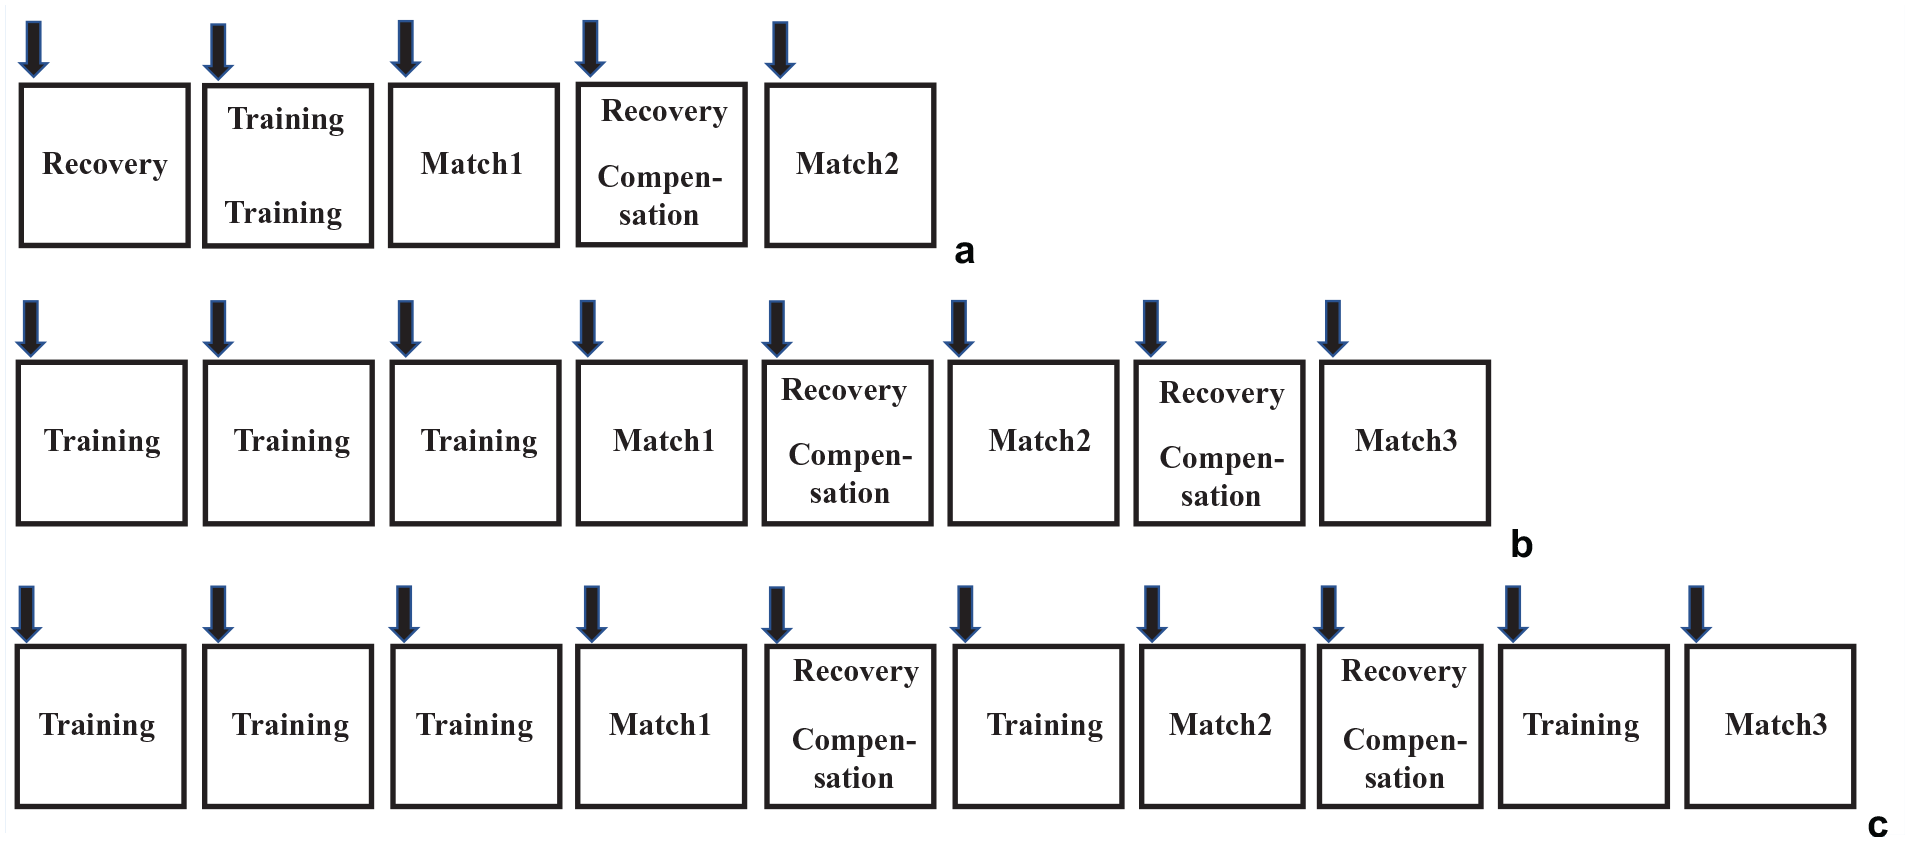
Study design. The players followed 1 of 3 training camp schedules. (a) After playing in the national championship in their clubs, they came to the national team on Sunday and had a recovery session. On Monday, they had 2 tactical training sessions followed by an international friendly game on Tuesday. The players who played more than 45 minutes completed a regeneration session on Wednesday; the rest of the team had a compensation session. The training camp was finished with a second international friendly game on Thursday. (b) During some training camps, the team played 3 international friendly matches with 1 recovery day in-between. (c) During the European Qualification, European Championship and World Cup, 3 to 5 international competitive matches were played with 2 recovery days in between. The black arrow indicates the creatine-kinase measurements.
External Load Monitoring
The activity profile of the players was monitored during each training session, friendly, and competitive match with portable 10 Hz GPS units (Catapult S5 and G5 for field players and goalkeepers, respectively, between April 1, 2018 and June 30, 2019, and Catapult S7 and G7 for field players and goalkeepers, respectively, between June 30, 2019 and November 30, 2019, Catapult Sports, Australia). In order to avoid interunit differences, each player wore the same unit during the study period (apart from the fact that the newer Catapult Vector S7/G7 devices replaced S5/G5 devices in June 2019). The GPS unit was worn in a custom-made vest between the shoulder blades and did not limit the movements of the upper limbs or the torso. The mean velocity difference of the S5 and S7 units was validated against the gold standard Vicon system for several velocity zones during multiple football-specific drills.29,30 The horizontal dilution of precision was 0.69 ± 0.1 and the number of satellites was 11.98 ± 0.2, both of which suggest good GPS signal quality. 15 In addition to the GPS-derived velocity, distance and acceleration/deceleration values, the GPS units also provide inertial movement analysis (IMA) data based on the integration of 100 Hz microsensor data (accelerometer, gyroscope, magnetometer). The reliability of this analysis and the description of the calculations have been published previously. 14 Based on the manufacturer’s description, 2 categories of the external load variables were created. The HV category consisted of 3 velocity bands (19.8-25.1 km/h, 25.1-29.99 km/h, and >29.99 km/h) and 103 parameters associated with them. These included the total distance/duration spent in a band, minimum/average/maximum effort distance, recovery time between efforts, maximal velocity, etc. The MM category consisted of accelerations, decelerations, left and right changes of directions, jumps, impacts, and PlayerLoad variables—altogether 266 parameters. Accelerations and decelerations were calculated both from the GPS signal as well as from the IMA based on 100 Hz microsensor data. Both calculations were used for the MM model. All parameters are in the Appendix, available in the online version of this article.
Creatine Kinase
Capillary blood samples for CK determination were taken from fingertips after overnight fasting, every morning at a standardized time (8-10 am). After appropriate disinfection, the fingertip was pricked with a sterile, disposable micro-lancet (Accu-Chek Safe-T-Pro Plus, Roche Diagnostics). Blood was collected using a 32-µl lithium-heparin microvette (Selzer Labor Technik). Whole blood was analyzed using a Reflotron Plus Clinical Chemistry Analyzer (Roche) according to the manufacturer’s instructions. The validity of this method was determined in a previous study. 11 Capillary and venous samples were highly correlated (P < 0.01; r = 0.99), and the mean difference between capillary and venous samples was statistically nonsignificant (3 ± 14U/l; P = 0.84). 11
Statistical Analysis
The HV and MM parameter sets were treated separately. From the union of these 2 sets, a combined set was created that contained both HV and MM parameters. Based on these 3 categories, numerous regression models were built for each player, and the best individual model was selected for each category. Only the relevant features for each player were kept from the selected set of parameters. To avoid model overfitting, supervised feature selection techniques were applied to create a set of the best possible feature subsets. Filtering of the features was performed by combining 2 methods. First, the effect of multicollinearity was eliminated by removing parameters that correlated highly (r > 0.8) with each other, then only those parameters that showed high correlation with the CK value were kept. The Lasso method was used thereafter to obtain the most relevant parameters that described the CK change. 26
Thus, using these methods, several subsets of all 3 parameter sets were generated. Then, using these sets, 75,000 supervised machine learning regression models were trained. To find the most accurate model with the best parameter set, walk-forward validation was used. The dataset was sorted by time and split into 6 subsets. The training set consisted of the first 2 subsets, and the test set was the third subset. Parameter selection and model fitting were performed on the training set, and the model was evaluated on the test set. Thereafter, the test set was appended to the training set and the next subset of data was marked as the test set. This process was repeated until the entire dataset was tested. We used linear regression models such as Lasso, Ridge, Elastic Net, and the Generalized Linear Model.12,13,17,26
The 3 models that best predicted the CK of a player using 3 different parameter sets (HV, MM, combined) for each player were compared. The predictive power of the models was characterized by the R2 value, and the root mean square error (RMSE, U/l in predicted vs measured CK values) described the accuracy of the prediction. This provided information on whether the HV, MM or combined parameter set best predicted the CK of a particular player.
All statistical analyses were performed in Python 3.9.6 using Sklearn 0.24.2 and Statsmodels 0.12.2. Results are reported as mean and standard deviation.
Results
CK Dataset Characteristics
The total number of individual player observations (where both CK and external load data were available) was 1418. The average number of datapoints per player was 57 ± 17.
Pre- and Posttraining and Pre- and Postmatch CK Values
Table 1 shows the pre- and posttraining as well as pre- and postmatch CK reference values for each player.
Individual players’ (n = 25) pre- and posttraining, as well as pre- and postmatch CK concentration a
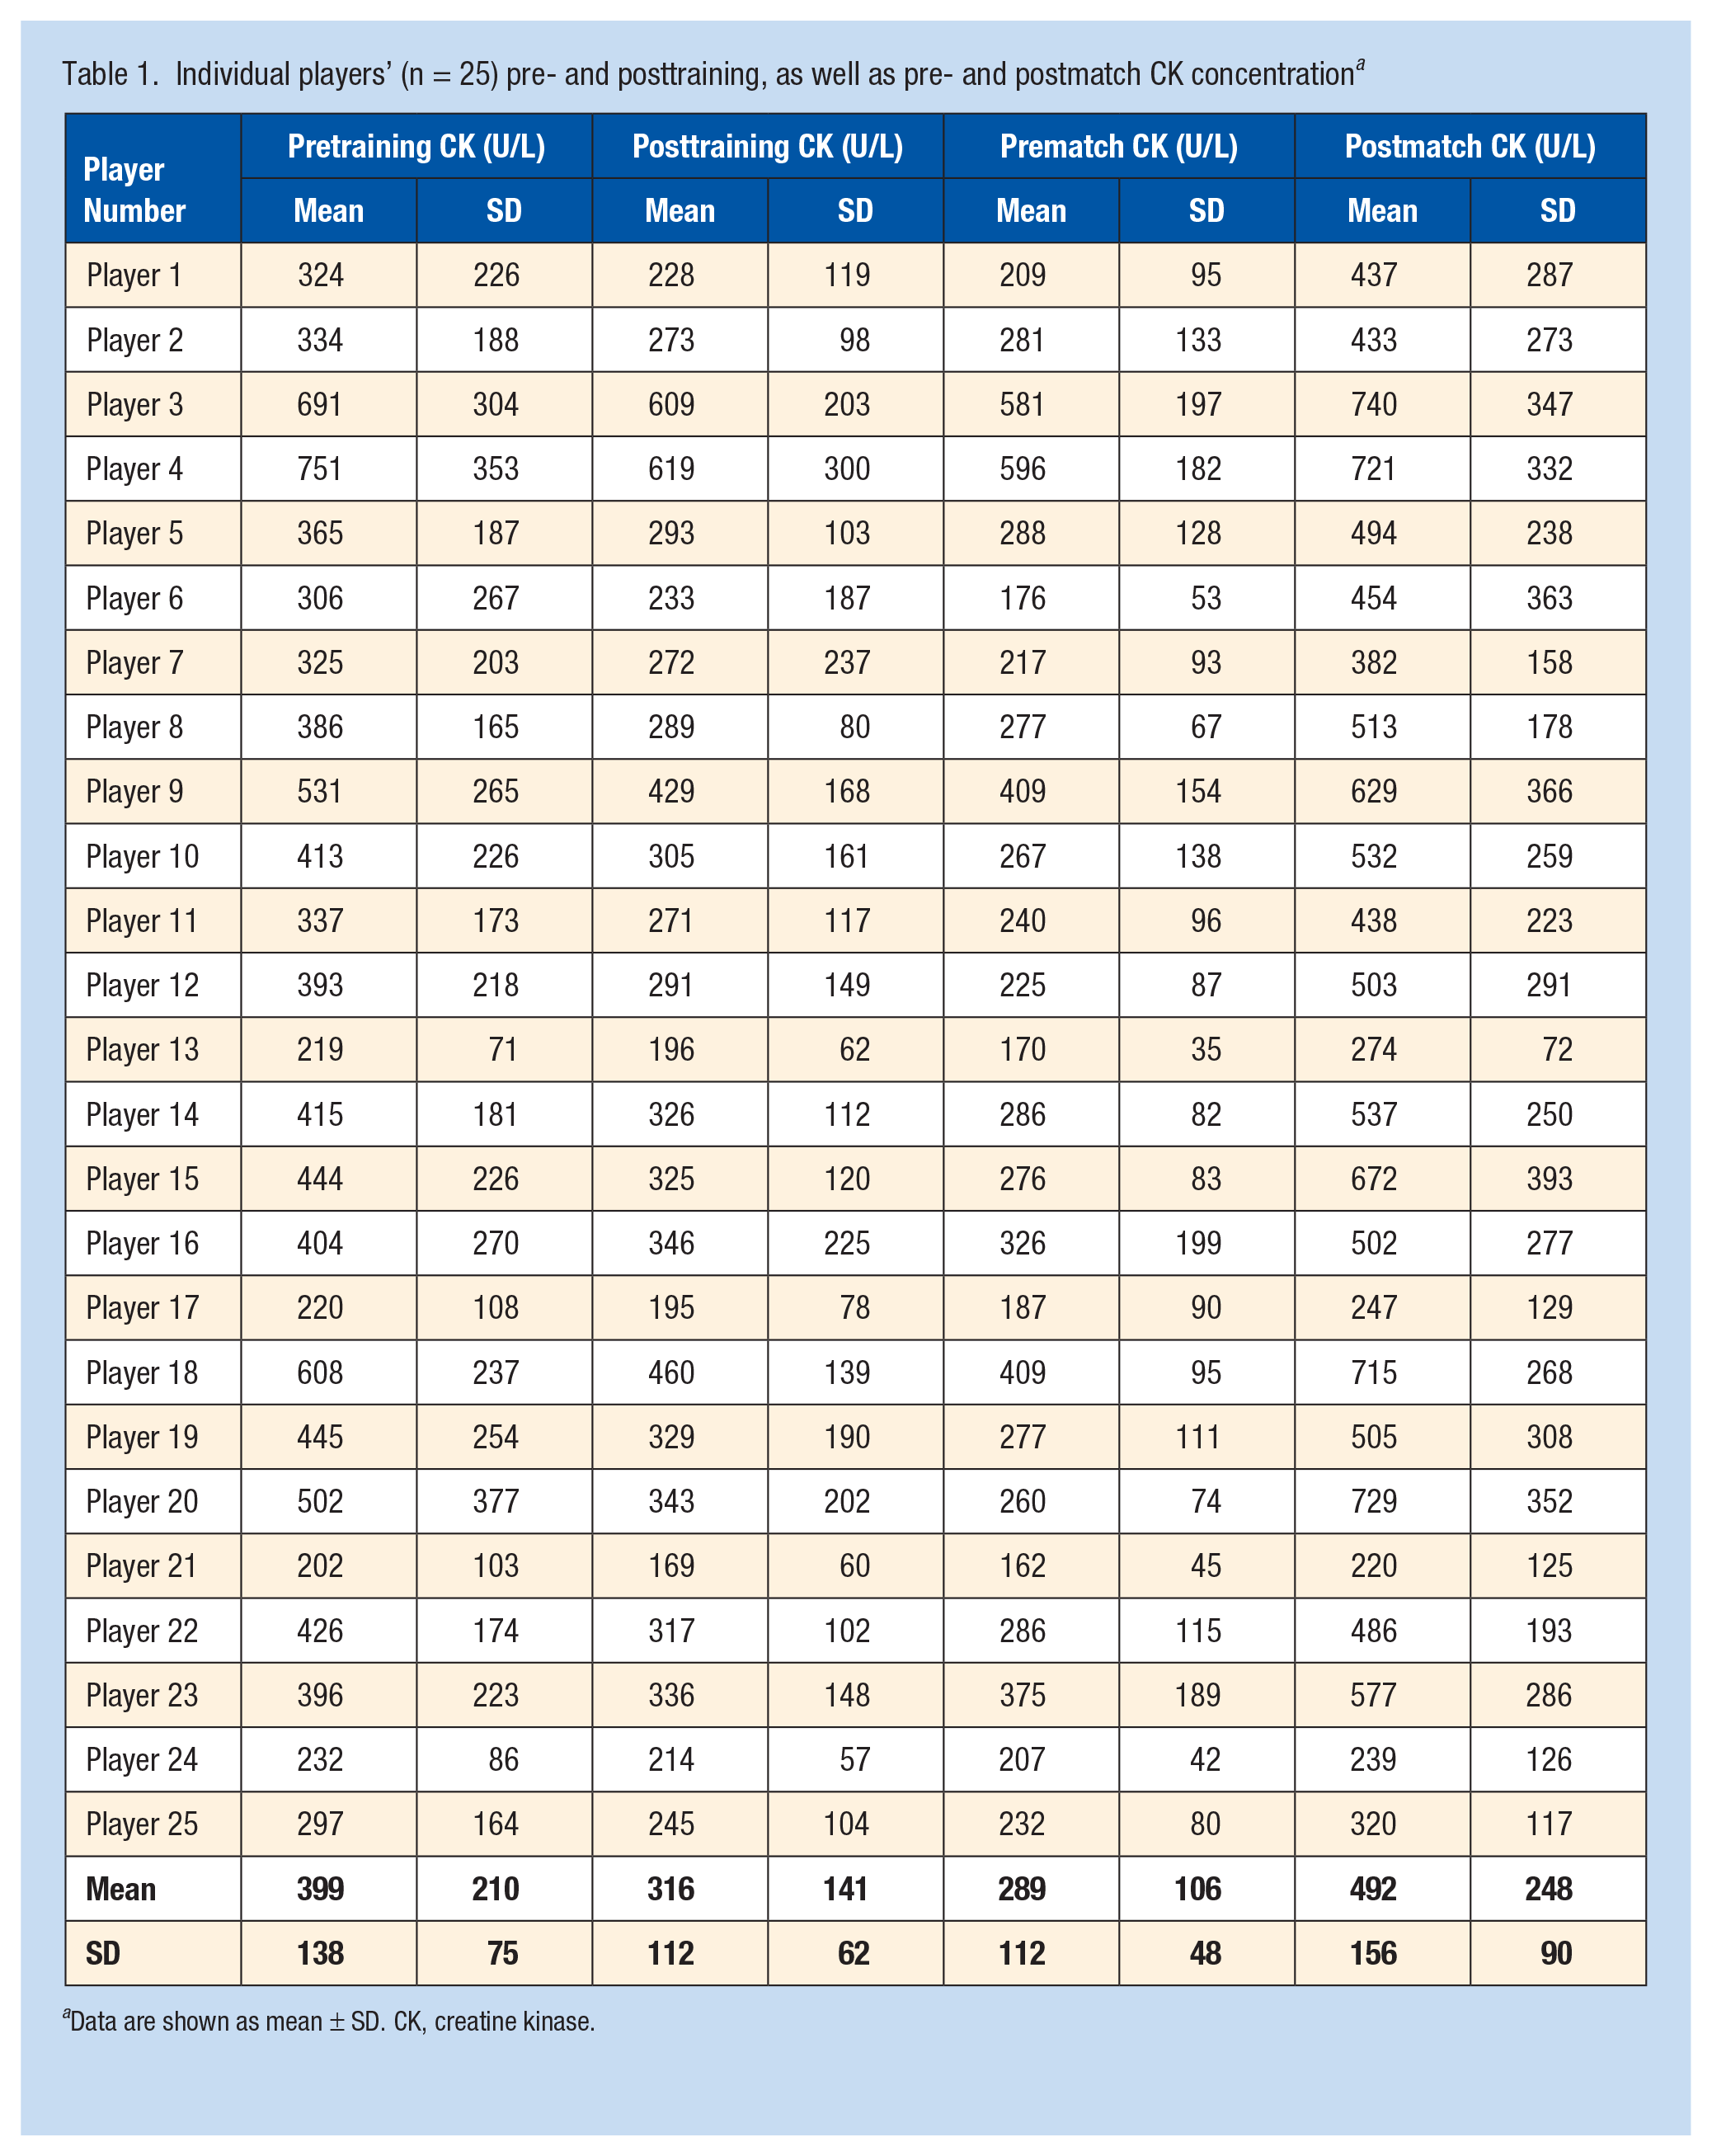
Data are shown as mean ± SD. CK, creatine kinase.
Individual Prediction Model
We evaluated the accuracy of each model using their RMSE on the test sets. The RMSE was 132 ± 51, 132 ± 53, and 131 ± 46 U/l for the MM, HV, and combined parameter set, for all players, respectively. The predictive power (R2) of the models was 0.53 ± 0.19, 0.53 ± 0.19, and 0.51 ± 0.21 for the MM, HV, and combined parameter set, for all players, respectively. Table 2 shows the predictive power of the MM, HV, and combined models for each player. In 7 players, none of the parameter sets could reach 0.5 predictive power. For 8 players, 8 players and 2 players, the MM, HV, and combined parameter sets’ predictive power was the best, respectively. If the predictive power of the MM, HV and the combined parameter sets was the same, the MM or HV model was chosen as the best, as the combined model did not have any additional value.
Number of data points (GPS and CK measurement), predictive power (R2) and prediction accuracy (RMSE, U/l) of the individualized prediction models based on MM, HV, or the combination of both (combined) a
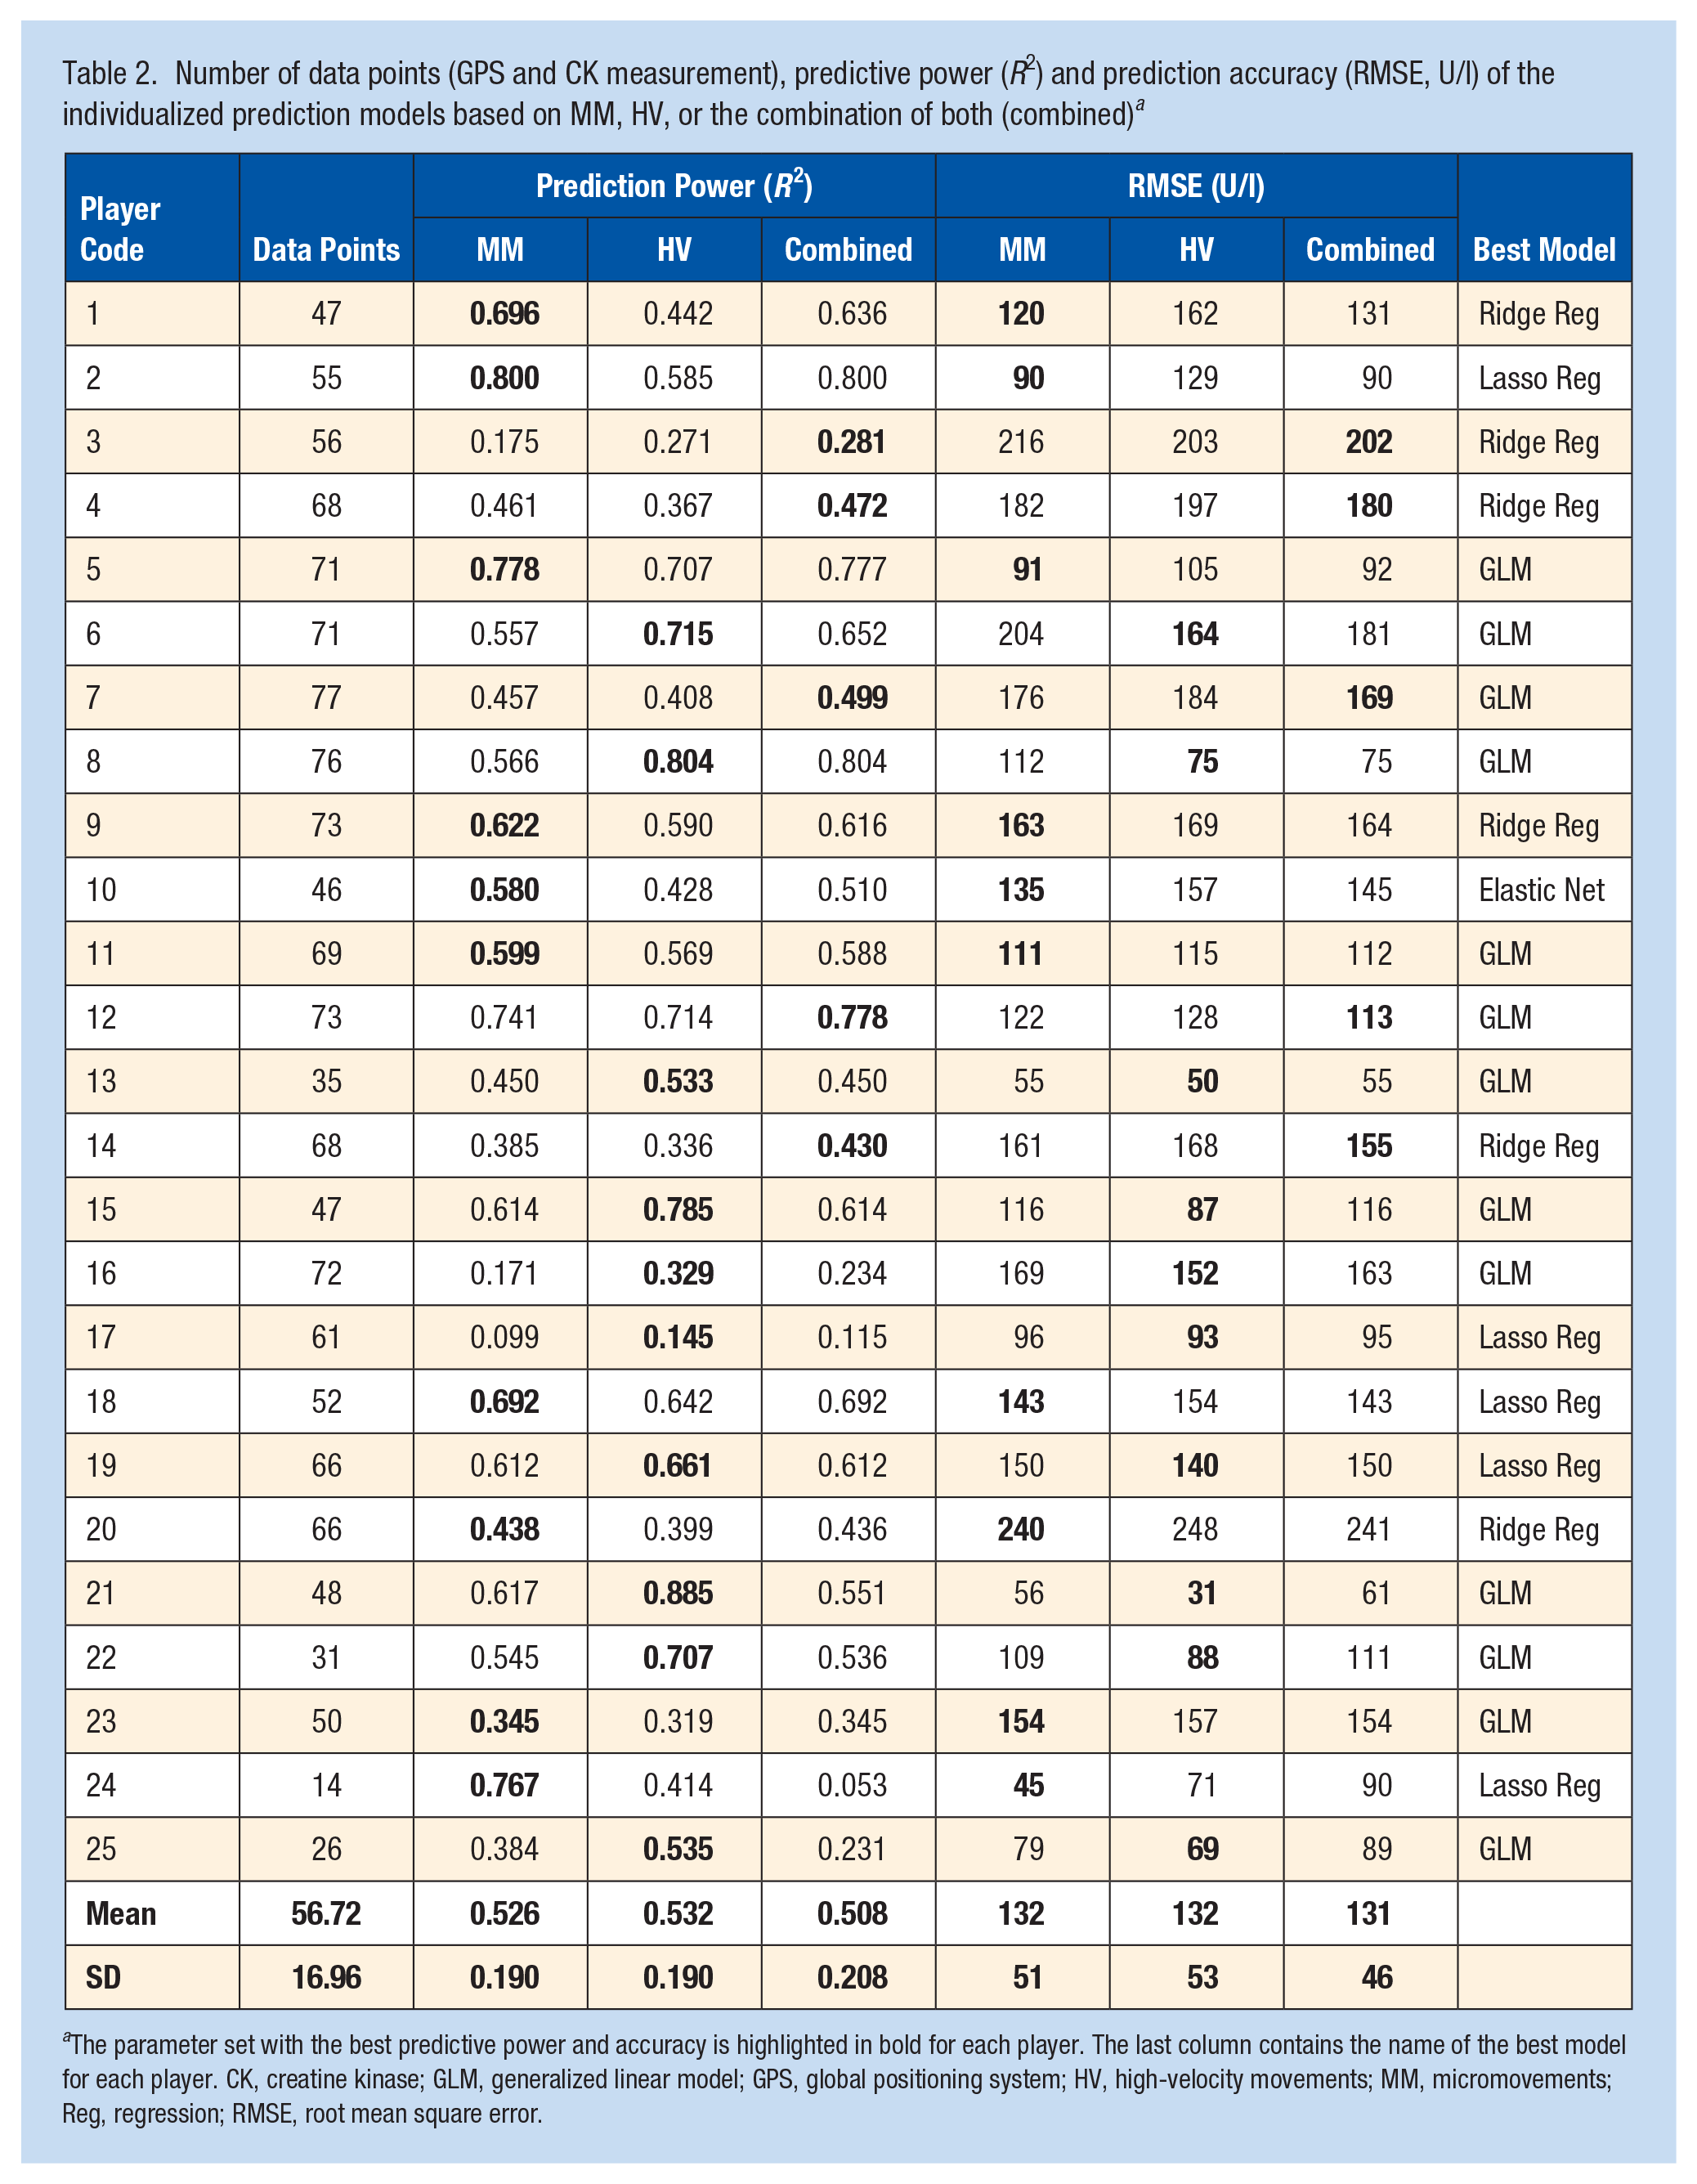
The parameter set with the best predictive power and accuracy is highlighted in bold for each player. The last column contains the name of the best model for each player. CK, creatine kinase; GLM, generalized linear model; GPS, global positioning system; HV, high-velocity movements; MM, micromovements; Reg, regression; RMSE, root mean square error.
Top 3 Features of the Individual Prediction Models
Table 3 shows examples of the top 3 features of the individual prediction models for the 18 players for whom the prediction power of 1 of the 3 models was higher than 0.49.
Top 3 external load parameters of the individual CK prediction models and their relative contribution (%) to the model a
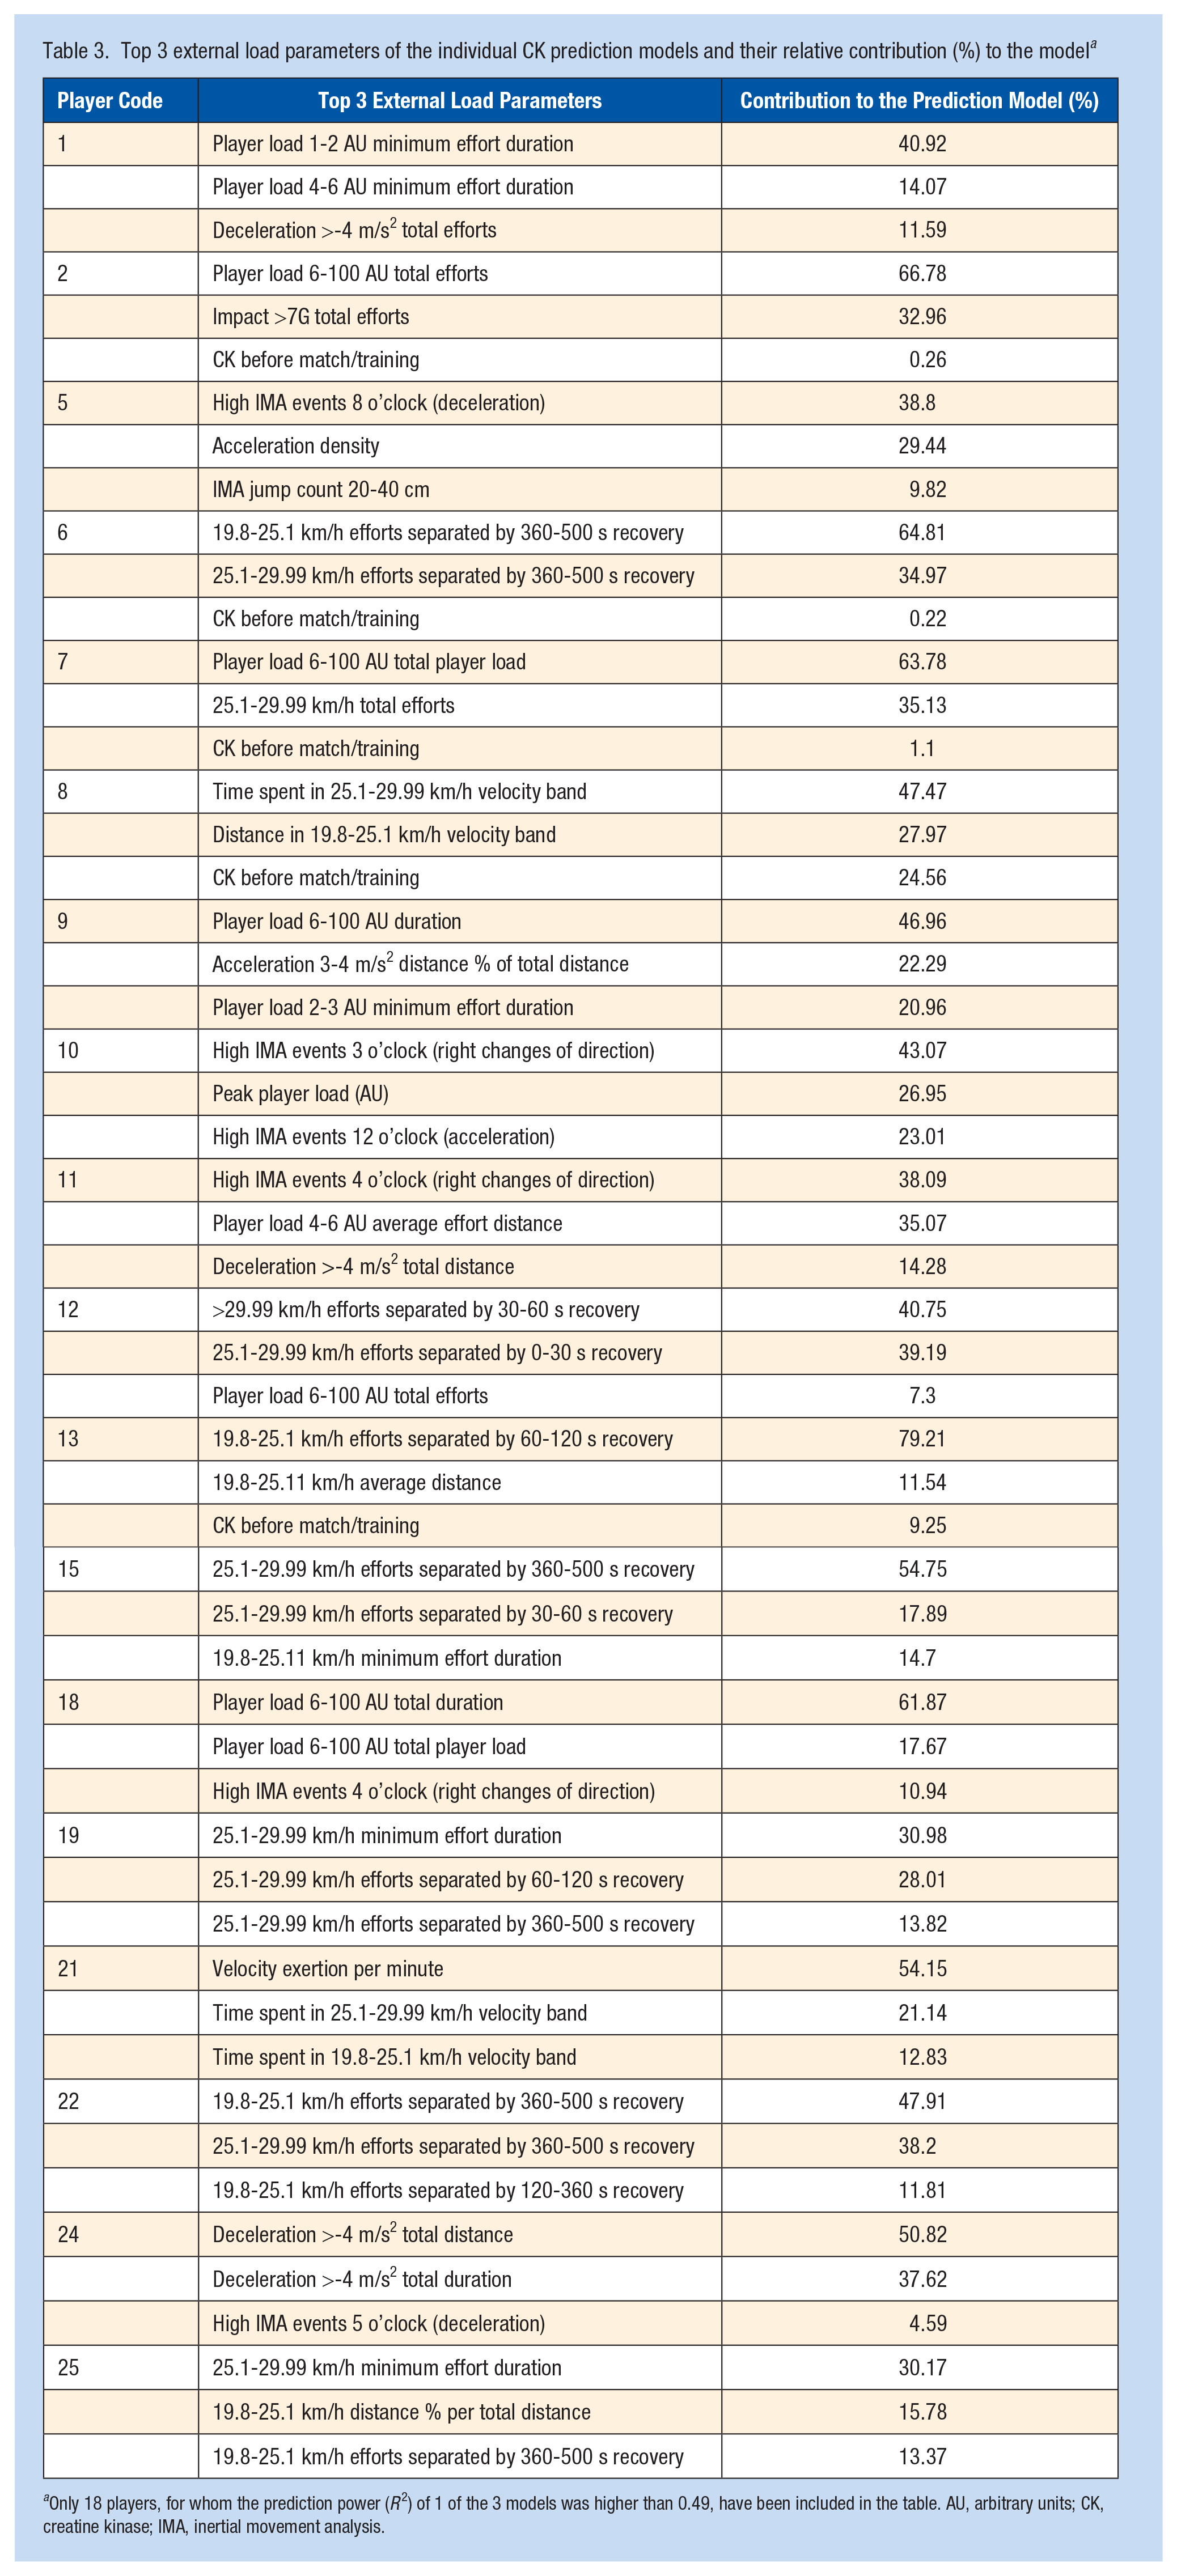
Only 18 players, for whom the prediction power (R2) of 1 of the 3 models was higher than 0.49, have been included in the table. AU, arbitrary units; CK, creatine kinase; IMA, inertial movement analysis.
Discussion
The aim of the present study was to build individual-specific prediction models using morning CK data and training or match load to predict the following day CK value in youth national team soccer players. The main findings show that individual differences determine whether HV efforts (8 players), MM (8 players), or the combination of these (2 players) are the most influential external load parameters on the CK response. In the case of 7 players, none of the applied models offered adequate sensitivity to predict the CK response. Our results emphasize the importance of identifying the individual-specific dose-response relationship between external load and CK changes rather than examining this relationship at the team level.
CK is used mainly to measure muscle damage and recovery kinetics after intense training sessions or matches.7,22 Most of these studies examined adult populations, with only limited evidence on youth players.4,6,20 Monitoring skeletal muscle fatigue status is even more important in a national team setting, where games are played every 2 to 3 days. In contrast to previous studies,2,4,10,11,25 our sample included CK measured pre- and posttraining, as well as pre- and postmatch (Table 1). The players normally arrive at the training camp after playing in their clubs at the weekend, resulting in elevated CK values. Due to the congested schedule, the aim of the national team training sessions is to practice the tactical plan for the match with limited training load to maximize game day readiness. This likely explains the higher pretraining CK values than posttraining for most of the players in our sample (Table 1). Elevated CK values (Z-score +1) have been associated with decreased (3.9%-5.5%) high-intensity, very-high intensity, and explosive distance, as well as accelerations, decelerations, and maximal velocity during training sessions. 16 Due to this effect and the prolonged recovery of CK after matches (42-120 hours), 7 we also included training sessions in our prediction model. Instead of selecting 5 to 10 external load parameters and determining their relationship with CK changes as most studies have done,2,4,10,11,25 we created 2 groups of parameters and their combination, which were used to build the CK prediction models. From more than 1000 external load variables supplied by the GPS system, we selected 103 related to HV and 266 related to MM movements. Determining whether HV or MM type movements are more influential on the CK response of soccer players can help coaches with the weekly periodization, maximize match-day readiness as well as optimize recovery after matches on an individual basis. In the case of 8 players, MM (accelerations, decelerations, impacts, jumps) were more influential on the CK response than HV movements (Table 2). MM, especially decelerations, include intense eccentric contractions, which have been shown to induce significant muscle damage.18,28 This finding is partly supported by the literature.2,4,10,20
Conversely, the CK response of 8 players was more sensitive to HV movements (Table 2). High-intensity eccentric contractions while sprinting increase the mechanical stress on the sarcomeres, disrupting the myofibers, the cytoskeleton, and the Z-disk. 10 A novel finding of our study is that the most relevant velocity bands differed within the HV group. For 6 players, parameters associated with velocity bands 19.8 to 25.1 and 25.1 to 29.99 km/h were included in the top 3 features of the prediction model. However, for Player 13, the velocity band 19.8 to 25.1 km/h, and for Player 12 from the combined group, speed zones 25.1 to 29.99 and >29.99 km/h were the most important (Table 3). These differences might be explained by the maximal velocity as well as the match external load profile of the players. Both players were wingers; however, Player 12 had higher maximal velocity and sprint distance during matches as well as higher maximal velocity during maximal intensity sprints. Even though the position of the players was the same, their match external load profile was quite different, especially in the high-intensity and sprint zone. In line with this, the most influential GPS parameters for the CK changes also differed between them. This finding questions the applicability of general velocity bands to predict CK changes at the team level,4,10,11,25 as they represent different relative stress on the players based on the individual maximal velocity. However, this needs further investigation, as some authors have found no added value of customized speed thresholds when examining the dose-response relationship between external load and subjective fatigue. 21
Another interesting finding was that recovery time between HV efforts was within the top 3 features of the prediction model in 7 players, from which 6 were in the HV and 1 in the combined model category (Table 3). This suggests that repeatability of the HV efforts should be taken into consideration. The duration of the recovery intervals also showed individual differences (Table 3). As previous research focused mainly on volume-based metrics, it is difficult to compare with our results.2,4,10,11,25,27,28 One study also included the intensity of high-speed running (distance >19.8 km/h/min); however, this parameter did not contribute significantly to the prediction model. 2 In another study, high-intensity, high-speed, and sprint distance per minute showed similar association with CK changes than the volume-based metrics. 19 The discrepant findings might be explained by the different experimental design applied by these authors (team-level correlations or modeling, only training sessions or matches examined).2,19 Although intensity parameters were important for the HV prediction model, this was not the case for the MM model, where number of acceleration/deceleration efforts, distance in intensive player load zones, etc, were the most important model features influencing the CK response. This finding is in accordance with previous studies.2,4,27,28
Interestingly, the combined parameter set was most appropriate in only 2 players: for Player 7 and Player 12, its predictive power was close to, or higher than, 0.5. It is important to emphasize that if predictive power and prediction error were the same for the combined method as those for the HV or MM sets, the HV or MM models were chosen, as more variable options provided no additional value. In theory, the models trained on the combined parameter set should be the best for all players, since the MM and HV parameter sets are subsets. However, during feature selection, the combined set did not contain the same external load parameters as the MM and HV sets. This is because the combined dataset has more parameters than MM or HV, so the noise is also higher in this dataset.
Most of the aforementioned studies correlated match physical data with CK changes immediately postmatch and up to 48 hours after the match at the team level.3,4,10,19,25,27 The correlation coefficients in these studies were relatively low (r = 0.35-0.63), indicating that external load parameters during matches could only explain 13% to 40% of CK changes.3,4,10,19,27 One study reported higher correlation coefficients (r = 0.76-0.92), but caution is needed with these results as only 1 match and the external load data of 7 semiprofessional players were included in the analysis. 25 Using more advanced statistical modeling (generalized estimation equations, clustered-based prediction, random forest, etc), previous studies reported RMSE values in the range of 130 to 413 U/l using team-based prediction.2,9,20 Using an individualized approach in the current study, RMSE for the best models was 113, 88, and 141 U/l for the MM, HV, and combined groups, respectively. The R2 value indicated that 64% to 69% of the variance of the CK changes was explained, emphasizing the superiority of individualized prediction models in comparison with a team-level approach. This is confirmed if we compare our current results with our previous study using the same sample, but team-based prediction. 20
In the case of 7 players, the predictive power of our individualized external load-CK models was <0.5. Three of these players were goalkeepers (R2 = 0.14-0.33). In accordance with our previous study, 20 this suggests that the applicability of HV and MM-based parameters is limited for goalkeepers. Specific parameters (dives, pre- and postdive load, time to feet, impacts, etc) should be considered when examining the dose-response relationship between external load and muscle damage markers for goalkeepers. For the other 4 field players, R2 was between 0.35 and 0.47, indicating that 53% to 65% of the variance in the CK response could not be explained by external load parameters. As these players had 50 to 68 individual datapoints, it is difficult to explain why the prediction models were unsuitable. It might be that our prediction models missed some important parameters as we limited the examined external load to 369 variables. Alternatively, it is possible that the CK response was influenced by additional factors (eg, sleep, nutrition) that were not controlled for in this study.
Limitations
Our study has major limitations. First, the biological age of the subjects was not determined and controlled for in the prediction models. As the height of the players changed by only 4 cm in 1.5 years, we assume that our players were in the postpeak height velocity phase and maturation had limited effects on our results. Second, the GPS units were changed during the study period. Independent validation showed good validity for both GPS models.29,30 In addition, the inbuilt microsensors were the same throughout the study period, suggesting that the change in GPS unit had limited effects on our results. Third, we could not fully control for the individual nutrition of the players. CK was measured every morning after an overnight fast, and the players were offered a standardized food selection in each training camp. Fourth, due to the schedule of the training camps, it was only possible to standardize the timing of the CK measurements (8-10 am). However, it was not possible to control the time between the last training session/game and the next CK measurement. Fifth, we only measured CK as an index of the muscle damage/muscle recovery status in youth soccer players. Due to the applied nature of the study, it was not possible to measure additional hematological or biochemical parameters (eg, lactate dehydrogenase, myoglobin). Sixth, capillary blood samples were used to determine CK instead of venipuncture due to the applied nature of the study. Although this method is used widely in the literature to measure CK changes in athletes,2,4,9,11,16,19,20 some authors question its validity. 5 Seventh, as most training camps involved congested periods of 2 to 5 matches, interspersed with only 1 to 2 recovery days, caution is needed to translate these results to the club schedule, where the players have 1 to 2 games per week. A total of 69% of our sample consisted of pre-posttraining CK pairs, of which 76% indicated a decreasing trend (eg, post-training CK values were lower than pretraining values). This is not surprising as players arrive to the training camp from club matches and the focus of national team training is tactical with limited physical load. In addition, the club match may also influence the players’ CK response through already existing muscle damage. This again emphasizes that caution is needed when translating these results to a club schedule. Finally, although our sample only included a team of 25 players, it is important to note that due to the competitive nature of international competition, teams rarely pool or share data to increase sample size. However, we acknowledge that our results may not be generalizable to subelite and recreational players, or elite teams with different training philosophies and schedules.
Practical Applications
CK is a widely used biomarker in soccer to monitor the recovery process after matches, individualize recovery interventions, and optimize match-day readiness through weekly periodization. Our results suggest that individual differences determine whether MM (8 players), HV movements (8 players), or the combination of both (2 players) are more influential on the CK response. Individualized prediction models using external load parameters achieved better accuracy and lower prediction error than previous team-based methods. In case of the HV models, individual differences were also found for the most important velocity band (19.8-25.1, 25.1-29.99, or >29.99 km/h). Finally in our players, the recovery period between HV efforts was more important to the CK response than the number of efforts. Knowing the top 3 external load parameters influencing CK response might help practitioners to control training load to arrive to the game in the best possible physical condition.
Conclusion
External load parameters measured during training sessions and matches can be used to predict CK values for the following day in youth national team soccer players. Individualized prediction models are advised, as individual differences determine whether MM, HV movements, or the combination of both best explain the load-CK relationship. In addition, individualized models result in better predictive power and lower prediction error than in previously reported team-level equations.
Supplemental Material
sj-docx-1-sph-10.1177_19417381221128822 – Supplemental material for Individual-Specific Relationship Between External Training and Match Load and Creatine-Kinase Response in Youth National Team Soccer Players
Supplemental material, sj-docx-1-sph-10.1177_19417381221128822 for Individual-Specific Relationship Between External Training and Match Load and Creatine-Kinase Response in Youth National Team Soccer Players by Gabor Schuth, Gyorgy Szigeti, Gergely Dobreff, Alija Pasic, Tim Gabbett, Adam Szilas and Gabor Pavlik in Sports Health: A Multidisciplinary Approach
Footnotes
Acknowledgements
The authors thank the youth national team soccer players and their coaches who took part in the study. Special thanks to the Hungarian Football Federation for support of this study.
The following author declared potential conflicts of interest: T.G. is a paid Associate Editor for Sports Health and a paid consultant for Gabbett Performance Solutions.
References
Supplementary Material
Please find the following supplemental material available below.
For Open Access articles published under a Creative Commons License, all supplemental material carries the same license as the article it is associated with.
For non-Open Access articles published, all supplemental material carries a non-exclusive license, and permission requests for re-use of supplemental material or any part of supplemental material shall be sent directly to the copyright owner as specified in the copyright notice associated with the article.