
Abstract
Background:
Sex differences in pacing profile and day-to-day variability have been underexplored. Therefore, this study investigated potential sex differences in pacing profile, risk-taking behavior, and pacing reliability during a 4-km cycling time trial.
Hypothesis:
Men and women present similar pacing and assume similar risk of premature trial interruption during a 4-km cycling time trial. In addition, it was hypothesized that men and women might present comparable performance and pacing reliability.
Study Design:
Cross-sectional study.
Level of Evidence:
Level 4.
Methods:
A total of 32 cyclists (16 men and 16 women) performed 2 4-km cycling time trials on separate days. Power output and ratings of perceived exertion were recorded during the trials. To quantify the risk of premature time-trial interruption, the hazard score was calculated as the product of the rating of perceived exertion and the remaining distance.
Results:
There were no sex differences in power output distribution or hazard score during the 4-km cycling time trial (P > 0.05), with both men and women presenting a “U-shaped” pacing profile. In addition, men and women exhibited similar endurance performance reliability between trials (P > 0.05). However, the day-to-day coefficient of variation for power output distribution ranged from 3.5% to 7.2% in women and from 1.9% to 6.3% in men, indicating slightly greater day-to-day variability in the pacing profile for women.
Conclusion:
Men and women exhibit similar pacing profiles, risk-taking behavior, and endurance performance reliability during a 4-km cycling time trial. However, women seem to demonstrate greater day-to-day pacing profile variability than men.
Clinical Relevance:
The present findings provide insights that enable more accurate monitoring and prescription of training protocols in female cyclists.
The pattern of power output or speed distribution during a self-paced endurance event has been defined as pacing.1,20 Previous studies have demonstrated that athletes adopt a “U-shaped” pacing profile during middle-distance self-paced cycling time trials (e.g., 4-km cycling time trial).1,3 For example, during a 4-km cycling time trial, athletes start the trial adopting an unsustainable, high power output during the first ~600 m; thereafter, athletes gradually decrease their power output until attaining a sustainable power output, which is maintained until ~3600 m, before further increases in power output during the last ~400 m as a final sprint.3,14,23 While the “fast-start” accelerates oxygen uptake kinetics, potentially enhancing aerobic energy contribution, 7 it also increases the risk of premature fatigue, leading to the requirement for a reduction in power output during the middle part of the trial. The risk of premature interruption, however, reduces as the trial gets closer to the end 14 ; thus, athletes can increase their power output for a final sprint. 4 The risk of premature interruption can be measured by the so-called “hazard score,” which can be calculated easily from the product of the momentary rating of perceived exertion (RPE) and the fraction of race distance remaining. 27
It should be noted, however, that the “U-shaped” pacing profile during a 4-km cycling time trial was identified in studies recruiting exclusively men; therefore, whether this same pacing profile is also identified in women is unknown. A study exploring sex differences in pacing profile during a marathon found that women adopted a less aggressive pacing start, resulting in an increased likelihood of the same pace being sustained throughout the race, when compared with men. 15 However, this less aggressive pacing in women was not reported in athletes competing in shorter endurance events such as 3-, 5-, and 10-km speed skating in the World Cup series. 33 In addition, the risk of premature interruption has not been measured in these studies; thus, whether women and men assume a similar risk of premature fatigue during time trials is unknown. Understanding of the pacing profile and risk-taking differences between women and men is important to provide specific guidance for how women and men should regulate their pacing during a time trial.
It is also important to consider potential sex differences in performance and pacing reliability during a time trial. Studies including exclusively men reported low coefficients of variation (CV) for both mean power output (CV ≤ 2.3%) and time to complete (CV ≤ 1.70%) a 4-km cycling time trial.18,41,42,44 Furthermore, 1 study with men found that typical error of measurement (TEM) for power output was greatest during the first and last 10% of a 4-km cycling time trial. 43 Nevertheless, whether the same reliability during a 4-km cycling time trial is found in women remains to be investigated. As test reliability is essential for determining true training effects, 24 determination of performance and pacing reliability is necessary for appropriate monitoring of training adaptations in female athletes.
Therefore, the main aim of the present study was to compare pacing and risk-taking between female and male cyclists. A secondary aim was to compare pacing and performance reliability during a 4-km cycling time trial between women and men. We hypothesized that women and men would have similar pacing and assume a similar risk of premature trial interruption during a 4-km cycling time trial. We also hypothesized that women and men might present comparable performance and pacing reliability.
Methods
Participants
A total of 16 men and 16 women volunteered to participate in this study. The main characteristics of the participants are shown in Table 1. According to their peak power output (PPO) reached during a maximal graded exercise test, both the women and men were classified as trained cyclists.16,34 The inclusion criteria were: (1) aged between 18 and 45 years; (2) training frequency of ≥3 times a week; (3) weekly practice of ≥5 hours of training; (4) experience with cycling training for ≥1 year; and (5) not using ergogenic supplements or medications in the 3 months before the study. In addition, women participants were required to have a regular menstrual cycle, without any sign of menstrual disorders in the 6 months before the study. Participants signed an informed consent form, which was approved by the Ethics Committee.
Main characteristics of men and women participating in the study
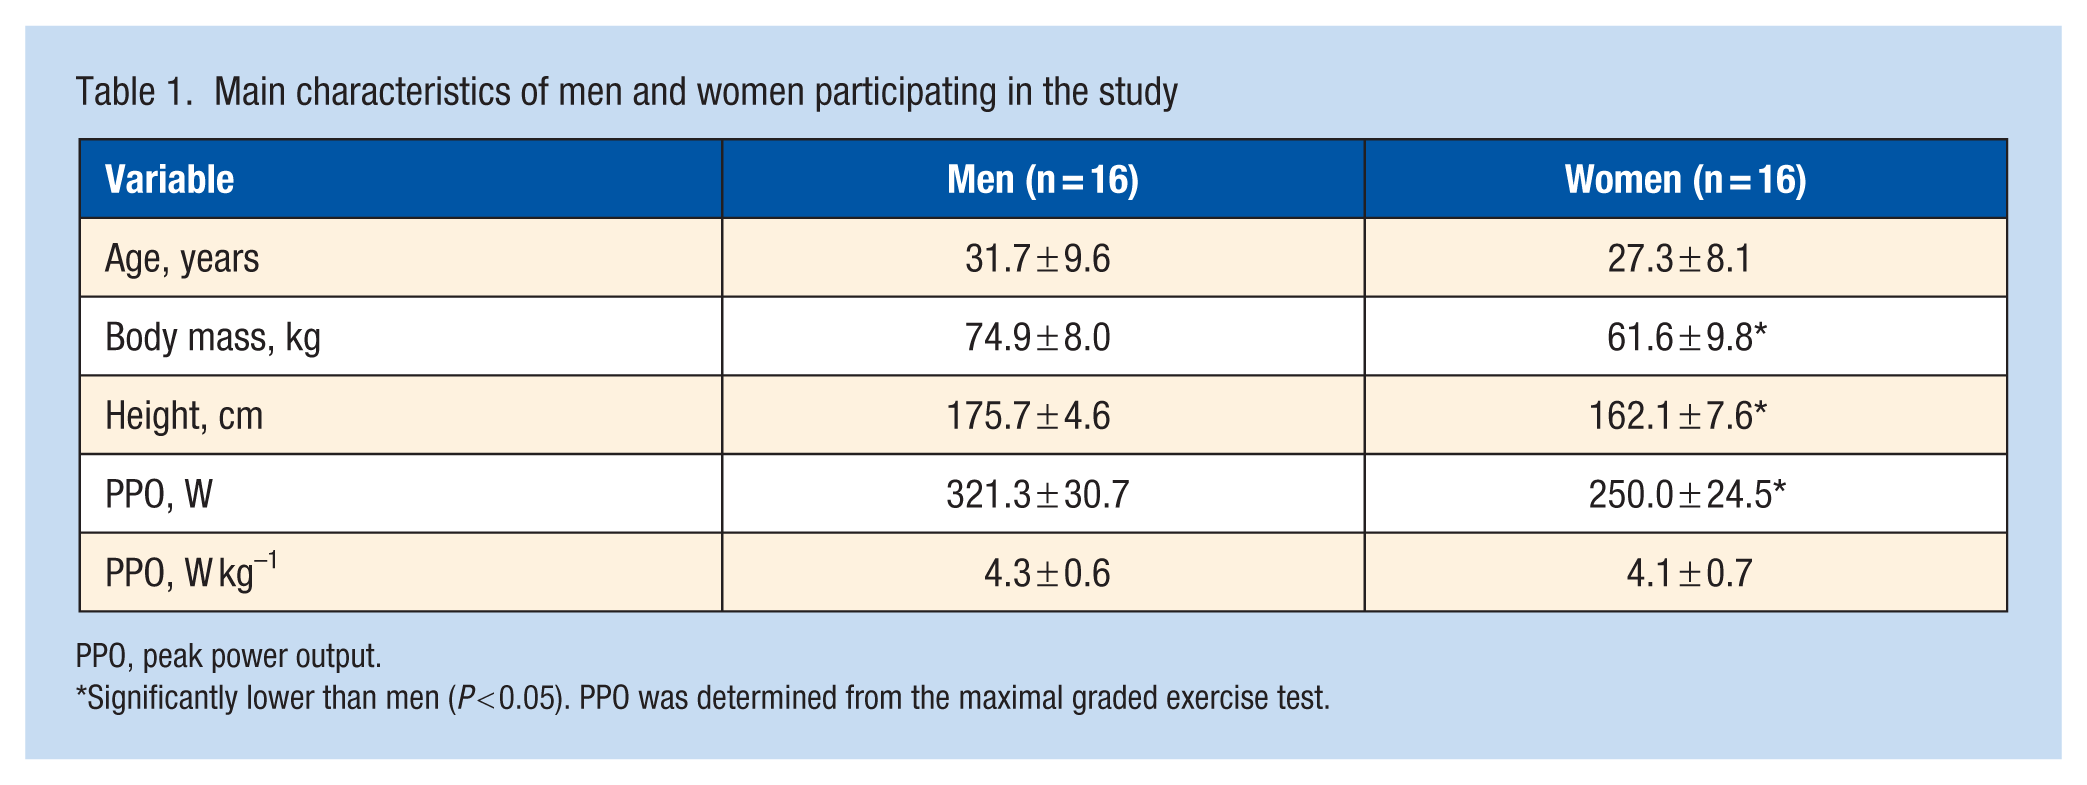
PPO, peak power output.
Significantly lower than men (P < 0.05). PPO was determined from the maximal graded exercise test.
Experimental Design
Participants visited the laboratory on 3 different days, with a minimum of 48 hours and a maximum of 7 days between visits. On the first day, participants were submitted to: (1) anthropometric measurements; (2) maximal graded exercise test; and (3) familiarization with the 4-km cycling time trial. On the second and third days, participants performed a 4-km cycling time trial.
All trials were performed on the participant’s own bike attached to a magnetic resistance cycle simulator (CompuTrainer Pro, RacerMate), which was calibrated before each trial according to the manufacturer’s instructions. To avoid any influence of circadian rhythm on dependent variables, the trials were performed at the same time of day (± 2 hours). 19 Participants were instructed to refrain from exhaustive or unaccustomed exercise and alcohol or caffeine consumption during the 24 hours before the trials. The calendar-based counting method was used to determine the phases of the menstrual cycle, with women participants performing experimental trials between the late-follicular and mid-luteal phases. The trials for women participants were rescheduled if the planned day coincided with the early-follicular (i.e., during menses) or late-luteal (i.e., before the onset of menses) phases, or when there were residual symptoms associated with the onset of menses.17,32
Maximal Graded Exercise Test
Participants warmed up at 100 W for 5 minutes, with subsequent increases of 30 W every minute until reaching task failure. Participants were instructed to maintain a pedal cadence of between 70 and 80 revolutions per minute throughout the test, with task failure being considered when participants voluntarily disengaged from the task, or when they were unable to maintain the pedal cadence above 70 revolutions per minute for >5 seconds, even with verbal encouragement. The PPO was considered as the maximal work rate reached during the final completed stage. When the final stage was incomplete, the PPO was calculated using the fraction of the time performed in the incomplete stage multiplied by the increment rate. 28
4-km Cycling Time Trial
Participants warmed up at 100 W for 5 minutes and were then asked to complete a 4-km cycling time trial as quickly as possible, adopting their own pacing strategy. Distance and power output were recorded at a frequency of 1 Hz via RacerMate software (CompuTrainer, RacerMate). The distance covered was visible on a monitor positioned in front of the participants, but they did not receive feedback on any other variable until completing all experimental trials. The RPE was obtained every 400 m using the Borg 6-20 scale. 8
Data Analysis
The power output during the 4-km cycling trial was averaged for each 400 m, expressed in absolute (W) and relative (percentage of PPO) values. The hazard score was calculated for each 400-m segment by multiplying the momentary RPE by the fraction of the remaining trial. 27 Trials performed on days 2 and 3 were used to calculate pacing and performance reliability, while the trial performed on day 3 was used to compare pacing and performance between sexes.
Statistical Analysis
Data normality was checked using the Shapiro-Wilk test. As normality was identified, data are presented as means ± standard deviations. The Student t test for unpaired samples was used to compare the time to complete the 4-km cycling time trial between women and men. The Hedges’ g effect size (ES) and 95% CI were also calculated using an online calculator (https://effect-size-calculator.herokuapp.com/), where ES < 0.2 indicates a trivial effect, 0.2 ≤ ES < 0.6 a small effect, 0.6 ≤ ES < 1.2 a moderate effect, 1.2 ≤ ES < 2.0 a large effect, 2.0 ≤ ES < 4.0 a very large effect, and ES ≥ 4.0 an extremely large effect. 11 Power output, hazard score, and RPE during the 4-km cycling time trial were compared using a mixed 2-way ANOVA model, having 1 between-subject factor (sex: men and women) and 1 within-subject factor (distance: 400, 800, 1200, 1600, 2000, 2400, 2800, 3200, 3600, and 4000 m). Sphericity of the variances was checked via Mauchly’s test, and the Greenhouse-Geisser correction was applied when sphericity was violated. When the analysis of variance (ANOVA) detected main or interaction effects, pairwise comparisons were performed using the Bonferroni post hoc test. Effect size for F statistics was reported as partial eta-squared (ηp2), where ηp2 < 0.059 indicates a small effect, 0.059 ≤ ηp2 ≤ 0.138 a moderate effect, and 0.138 ≤ ηp2 a large effect. 11
The Student t test for paired samples was used to compare performance time and mean power output between trials 2 and 3. The intraclass correlation coefficient (ICC), TEM, and CV were calculated to determine reliability between trials 2 and 3 for performance time, mean power output, and power output every 400 m. 24 The ICC, TEM, and CV were calculated using a spreadsheet derived from the log-transformed data, with uncertainty in the difference between trials expressed as 90% confidence limits. 24 Remaining statistical analyses were performed using Statistical Package for the Social Sciences software (SPSS, Version 25.0). Significance was assumed when P < 0.05.
Results
Differences in Performance and Pacing Between Women and Men
Men completed the 4-km cycling time trial in less time than women (P < 0.01, 95% CI difference: 38.07-71.92 seconds). There was a main effect of sex (F(1,30) = 60.57; P = 0.01; ηp2 = 0.66) for absolute power output (Figure 2a), with men presenting greater mean power output (270.1 ± 29 W) than women (194.2 ± 26 W). There was also a main effect of distance (F(9,270) = 21.49; P = 0.01; ηp2 = 0.41), with men and women presenting a classical “U-shaped” pacing profile (Figure 1a). There was no sex versus distance interaction for power output (F(9,270) = 0.545; P = 0.84; ηp2 = 0.01).
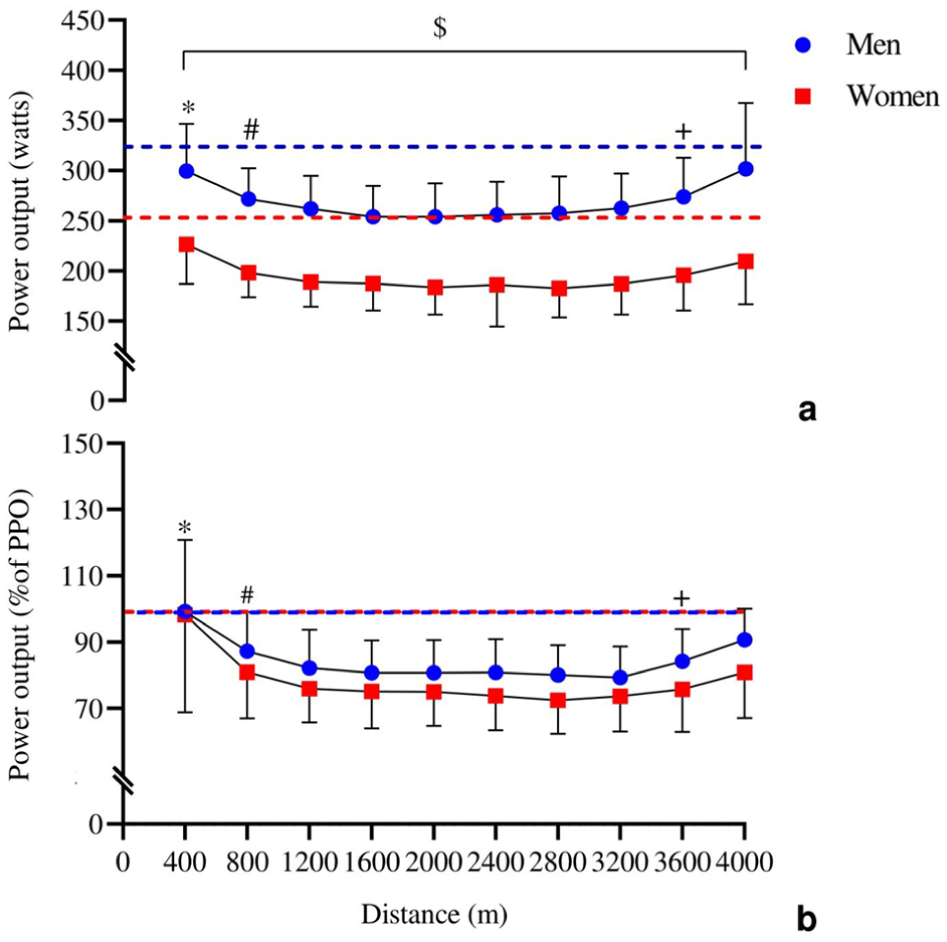
Absolute (a) and relative (b) power output during a 4-km cycling time trial in men and women. Blue and red horizontal dashed lines represent PPO achieved during the maximal graded exercise test for men and women, respectively. Relative power output is expressed in percentage of PPO achieved during the maximal graded exercise test. PPO, peak power output. $Significantly higher in men than in women (P < 0.05). *Significantly different from all distances, except the last 400 m in both sexes (P < 0.05). #Significantly higher than 1200 to 3200 m in both sexes (P < 0.05). +Significantly lower than the last 400 m in both sexes (P < 0.05).
When power output was expressed as a percentage of PPO (Figure 1b), there was only a main effect of distance (F(9,270) = 21.39; P = 0.01; ηp2 = 0.41), without a main effect of sex (F(1,30) = 2.95; P = 0.09; ηp2 = 0.09) or sex versus distance interaction (F(9,270) = 0.62; P = 0.77; ηp2 = 0.02).
Differences in RPE and Hazard Score Between Women and Men
There was a main effect of distance only for RPE (F(9,270) = 118.25; P = 0.01; ηp2 = 0.79) and hazard score (F(9,270) = 347.14; P = 0.01; ηp2 = 0.92). Regardless of sex, the RPE increased (Figure 2a) and hazard score reduced (Figure 2b) progressively as the trial progressed.
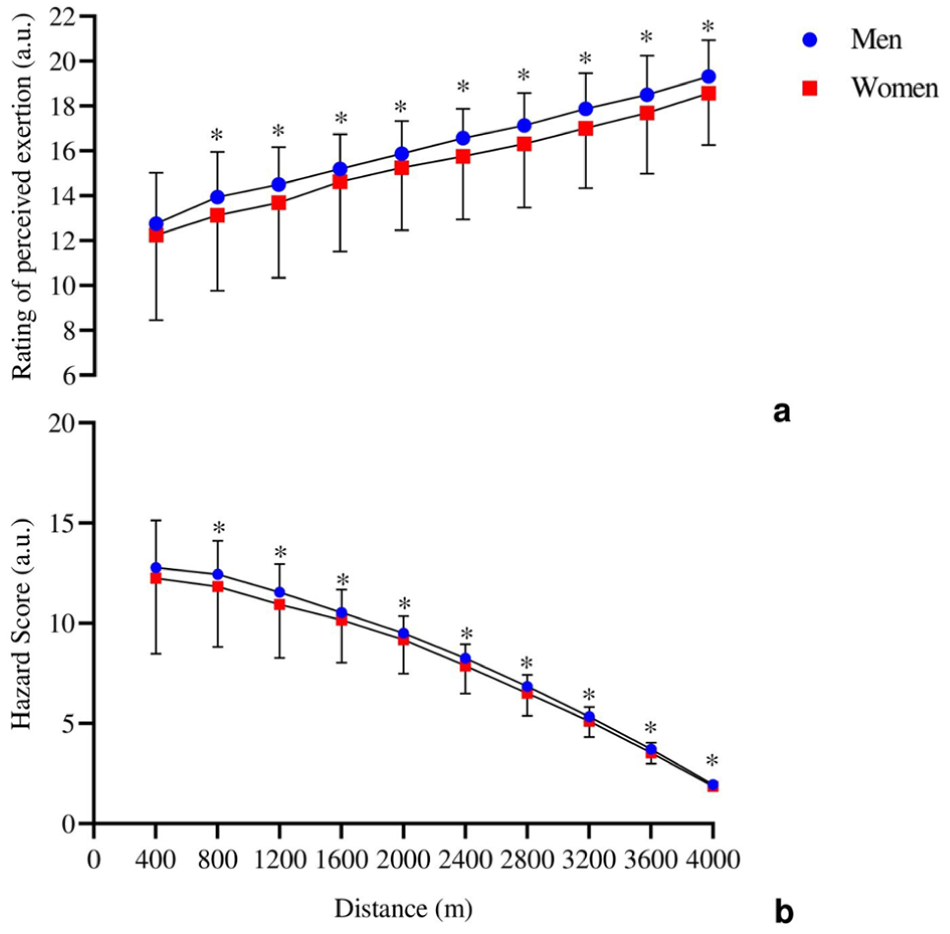
RPE (a) and hazard Score (b) during a 4-km cycling time trial in men and women. RRP, rating of perceived exertion. *Significantly different from previous distance, regardless of group (P < 0.05).
Differences in Reliability Between Women and Men
There was no difference for time to cover the 4-km cycling time trial between trials 1 and 2 for men (389.4 ± 13.5 seconds vs 389.9 ± 17.0 seconds; P = 0.94) or women (444.9 ± 22.6 seconds vs 444.9 ± 28.5 seconds; P = 0.98). The TEM was 1.7% (90% CI 1.3-2.5) and 2.3 % (90% CI 1.8-3.3) for men and women, respectively; the ICC was 0.86 (90% CI 0.68-0.94) and 0.86 (90% CI 0.70-0.94) for men and women, respectively; and the CV was 1.23 (90% CI 0.73-1.63) and 1.74 (90% CI 1.13-2.31) for men and women, respectively.
The mean power output during the 4-km cycling time trial was also not different between trials 1 and 2 for men (270.3 ± 30 W vs 271.1 ± 33 W; P = 0.78) or women (194.2 ± 26 W vs 194.8 ± 21; P = 0.86). The TEM was 2.4% (90% CI 1.8-3.5) and 4.5% (90% CI 3.4-6.7) for men and women, respectively; the ICC was 0.97 (90% CI 0.92-0.99) and 0.91 (90% CI 0.78-0.96) for men and women, respectively; and the CV was 1.79 (90% CI 1.24-2.50) and 3.56 (90% CI 1.95-4.91) for men and women, respectively.
The power output reliability for every 400 m is shown in Table 2. In general, the TEM and CV were higher and ICC lower in women than men.
TEM, ICC, and CV for each 400 m during a 4-km cycling time trial in male and female cyclists
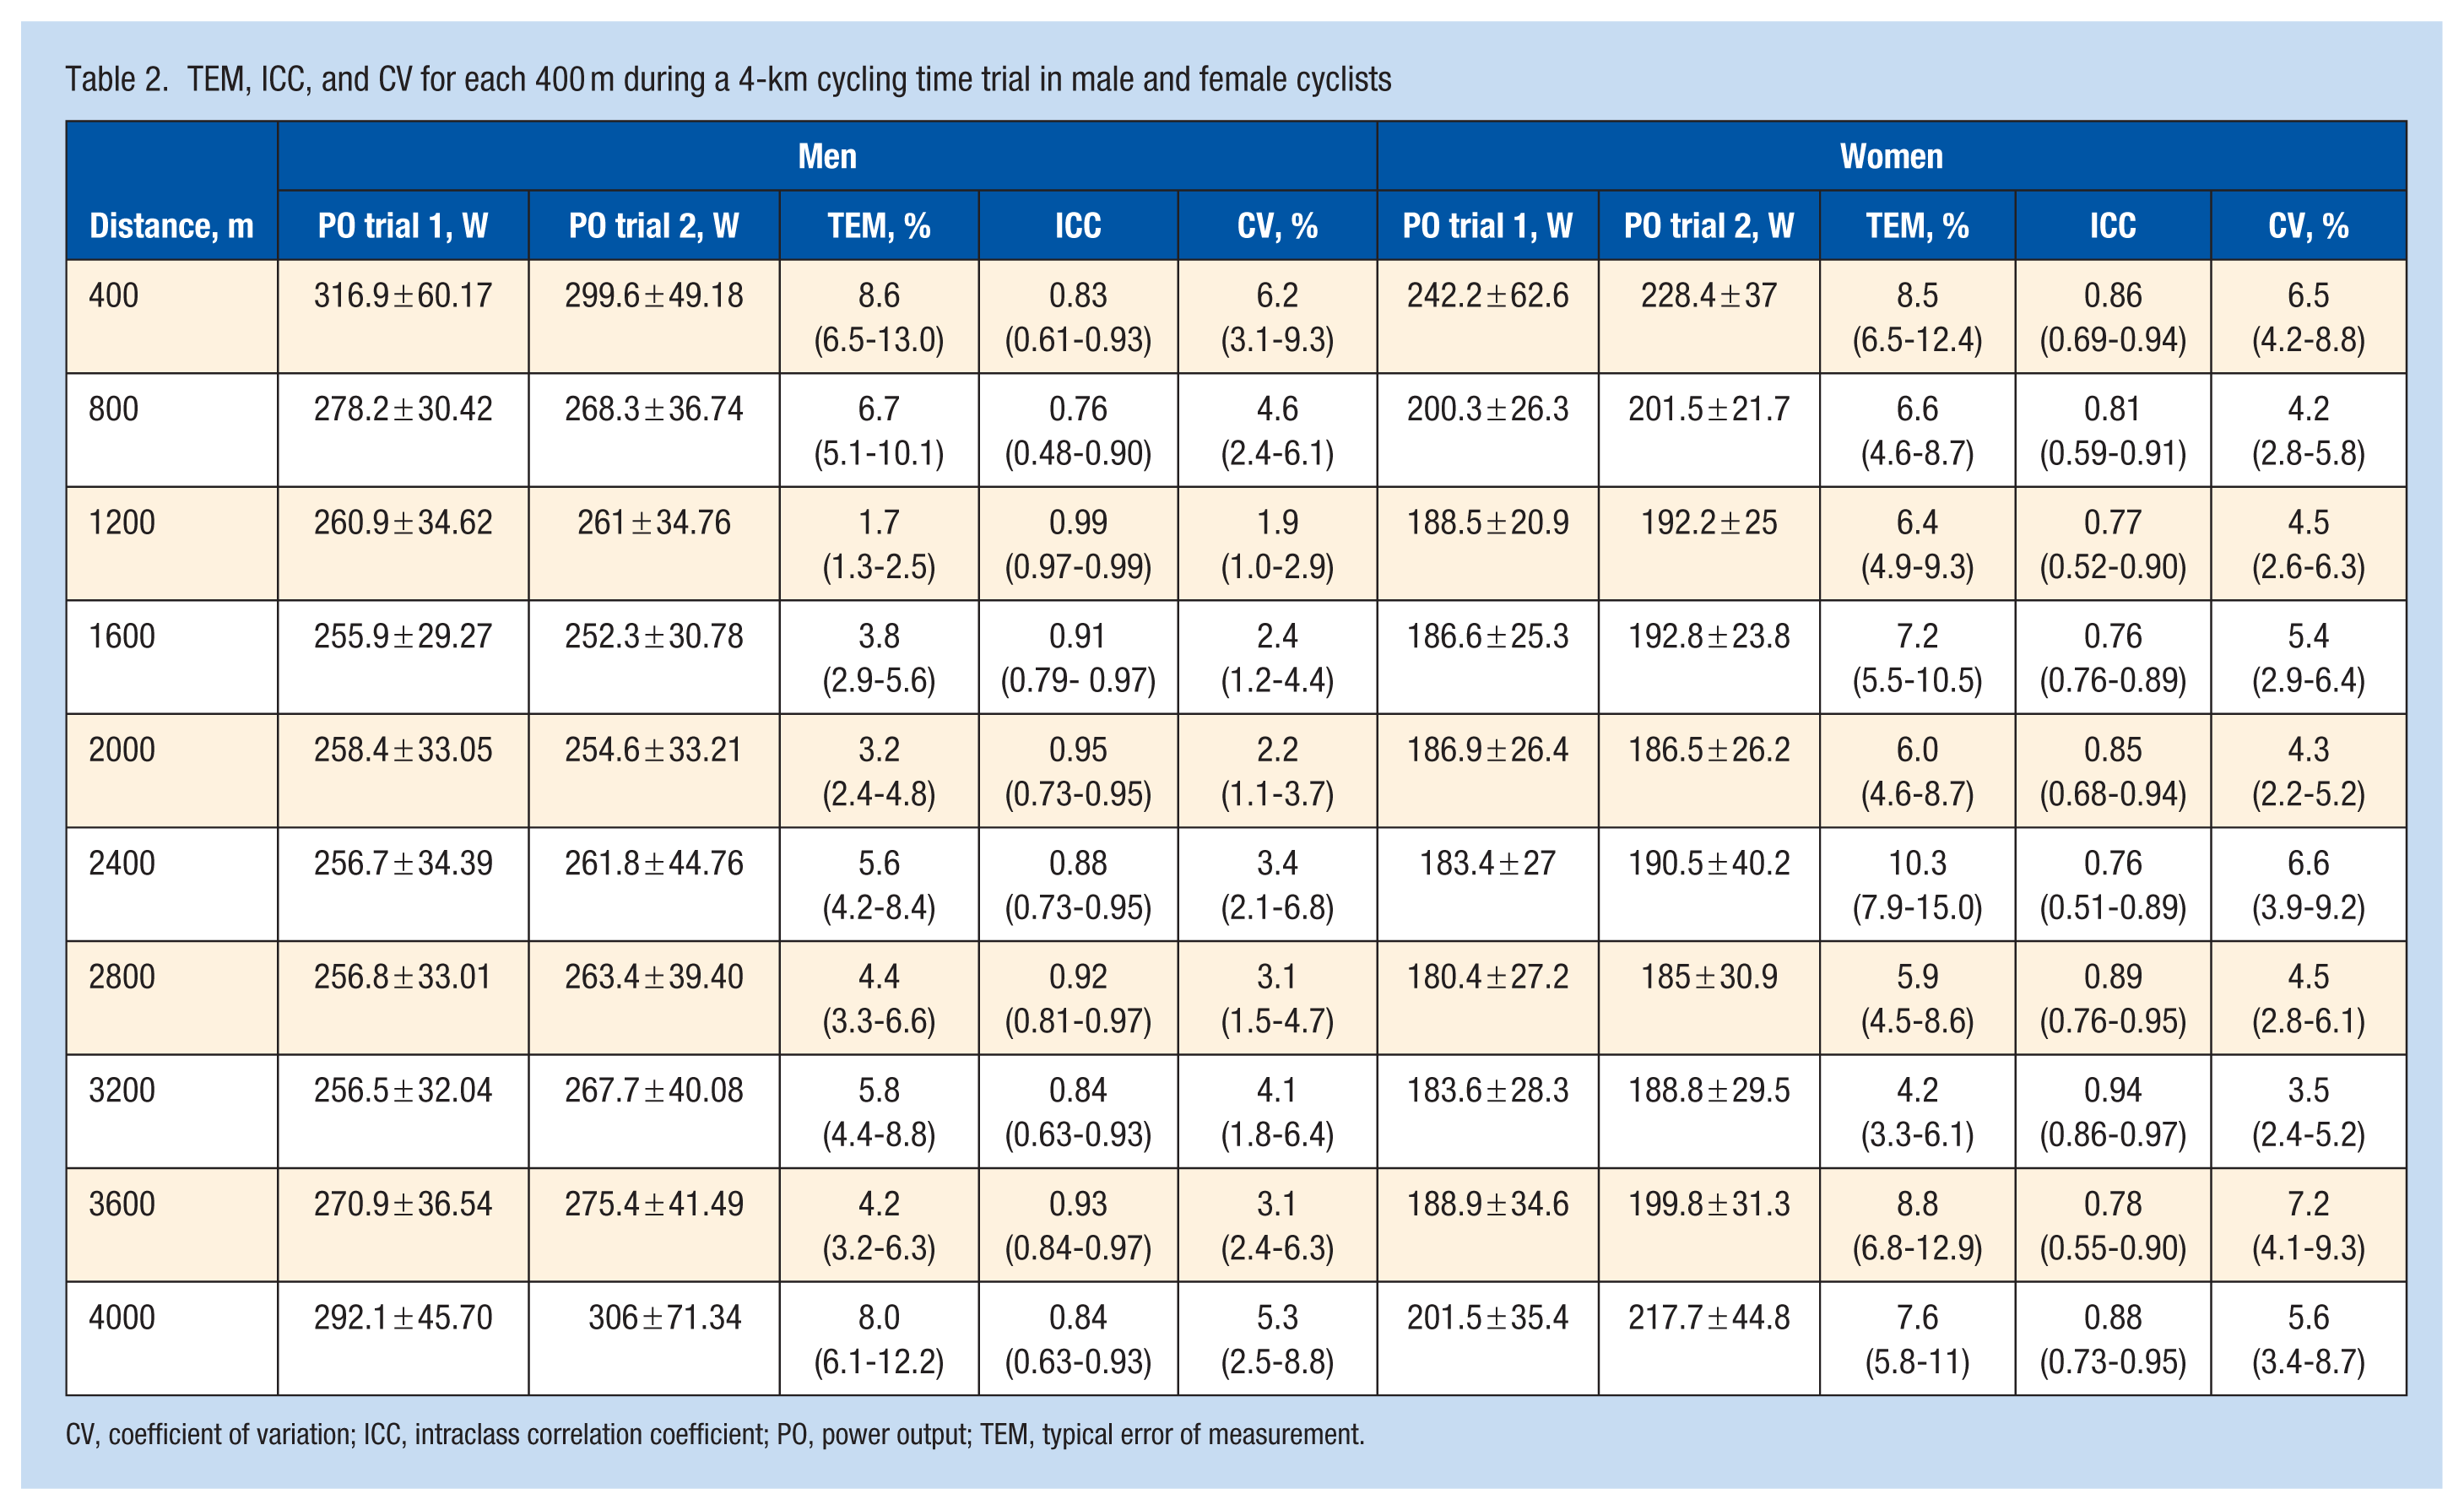
CV, coefficient of variation; ICC, intraclass correlation coefficient; PO, power output; TEM, typical error of measurement.
Discussion
The findings of the present study showed that men and women presented a similar pacing profile and risk-taking for premature fatigue during the 4-km cycling time trials. In addition, although men and women exhibited similar reliability for endurance performance outcomes, women seemed to exhibit lower day-to-day pacing profile reliability.
In the present study, men covered the 4-km cycling time trial faster (~13%) and presented higher mean absolute power output (~28%) than women. These differences are consistent with previous studies reporting that men outperformed women from 10% to 15% in time-to-complete,15,29,30,35 and ~27% in mean power output, 30 during endurance tasks. These differences in endurance performance may be explained by anatomical and physiological differences, such as smaller heart and lung size, reduced cross-sectional area of the conducting airways, and lower stroke volume and cardiac output in women than in men. 25 However, when power output was normalized by individual PPO, no differences between men and women were observed, which is also in line with a previous study showing no difference between men and women for relative power output during a 4-km cycling time-trial. 30 Together, these findings suggest that men and women perform 4-km cycling time trials by setting their power output at a similar relative PPO value.
Consistent with the similar mean relative power output during the trial, there was no sex difference in power output distribution during the 4-km cycling time trial. Men and women presented a “U-shaped” pacing profile, which is consistent with findings from other endurance events that showed a similar pacing profile between women and men during 3-, 5-, and 10-km speed skating races, 33 and a 10-km running time trial. 13 Conversely, several studies have indicated that, compared with women, men often adopt a more aggressive starting pace, resulting in a more pronounced reduction in pace during the latter stages of long-distance events, such as half-marathons, marathons, and ultramarathons.12,13,15,36
Thus, sex differences in the pacing profile appear to be present in long-duration endurance events. Physiological factors and decision-making processes might contribute to these differences in pacing profiles between women and men during long-duration endurance events. 15 For example, men appear to be more susceptible to glycogen depletion, which leads to greater fatigability, 9 whereas women generally rely more heavily on fat metabolism and possess a higher proportion of fatigue-resistant type I muscle fibers, providing an advantage in sustaining pace over prolonged distances. 37 From a psychological perspective, men are more inclined to adopt risky pacing strategies early in a race, which might also accelerate the development of fatigue during long-duration races. 15 As these physiological and psychological stressors are more relevant for long-distance endurance events, our findings indicate that women and men exhibit similar pacing profiles in shorter endurance events, such as a 4-km cycling time trial.
Accompanying the lack of differences in pacing profiles between women and men, the hazard score declined similarly throughout the trial in both women and men. The highest hazard scores are expected at the beginning of the trial, when uncertainty is greatest. In the present study, women and men maintained their highest hazard scores (~13 a.u.) during the first 800 m (20% of the total distance), which is similar to previous reports for endurance events lasting from 4 minutes to 60 minutes. 27 As neuromuscular fatigue develops in the first ~800 m of a 4-km cycling time trial, 5 athletes must subsequently reduce their power output to avoid premature fatigue and potential trial interruption, consequently reducing the hazard score. While no studies have investigated the hazard score during long-endurance events (>half-marathon) in which men typically adopt a more aggressive fast-start strategy, the intensity of the fast start during long-distance events may not be sufficiently high to make the athletes aware of the risk of premature fatigue. In contrast, during shorter endurance trials lasting only a few minutes, the higher power output at the beginning of the trial might be a strong signal of the risk of premature fatigue, regardless of sex. Interestingly, both men and women showed a final sprint during the last 400 m, when the hazard score is <5, which is consistent with a previous study. 27 Therefore, our findings suggest that women and men regulate their pacing during middle-distance cycling time trials through a complex centrally controlled process in the brain that considers hazard scores, reducing power output immediately after a fast start to avoid premature fatigue, and ultimately preserving the ability to accelerate for a final sprint. Thus, the hazard score acts as a “proxy” of pacing profile, integrating power output and RPE in a similar manner in men and women.
From a practical standpoint, it is also essential to establish the reliability of a performance test before using it to accurately monitor or prescribe training protocols. Our findings reveal that men and women presented similar endurance performance reliability (i.e., time to complete the trial and mean power output). This is in agreement with a previous study which reported similar reliability for mean power output during a 20-min cycling trial on a virtual platform between men and women. 31 In the present study, the mean CV of the time to complete the 4-km cycling trial was 1.23% and 1.74% for men and women, respectively, which are similar to values reported previously (CV ≤ 1.70%) for 4-km cycling time trials in a sample comprised exclusively of men.18,42,44 Furthermore, the CV of the mean power output values during the 4-km cycling trial were 1.79% and 3.56% for men and women, respectively, which are also similar to previous reports for a 4-km cycling time trial in a sample comprised exclusively of men (CV = 3.70%). 38 Taken together, these findings indicate a similar natural day-to-day variation in endurance performance between women and men.
Although overall performance reliability was similar between men and women, the TEM and CV seem to be slightly greater and the ICC lower in women than in men in almost all 400-m segments. For men, the TEM followed a typical “U-shaped” pattern, with highest values in the first 800 m (7% to 9%) and last 400 m (8%), when compared with the middle part of the trial (2% to 6%). This behavior and magnitude are consistent with previous findings in well-trained male cyclists performing a 4-km cycling time trial. 41 Our novel findings, however, indicate that TEM does not have a “U-shaped” pattern in women, as it seems to be relatively stable throughout the trial (4% to 10%). Although the mechanisms underlying these sex-differences in pacing reliability cannot be provided from our data, psychophysiological factors might play a role. Women experience daily fluctuations in estrogen levels,17,32 which has been associated with changes in serotonin synthesis and modulation of dopamine activity, altering mood, cognition, pain tolerance, motivation, and reward sensitivity.6,26 When compared with men, women also exhibit greater day-to-day variability in the cortisol awakening response, 2 and daily fluctuations in depressive symptoms. 45 Speculatively, these psychophysiological changes may explain the greater trial-to-trial pacing variability in women than in men.
Strengths, Limitations, and Further Directions
A strength of the present study was the comparison of pacing risk-taking for premature fatigue during a 4-km cycling time trial between women and men cyclists. Another strength of the present study was the comparisons of pacing and performance reliability during the trial. To our knowledge, no previous studies have investigated pacing, risk-taking, and reliability in women cyclists; thus, as sex equity in research is a concern, 22 our findings provide better understanding of sex differences and similarities in pacing, risk-taking, and reliability during an endurance task.
Despite these strengths, the present study also presents some limitations. Participants were trained cyclists, and while this group of trained athletes provides meaningful insights into sex differences in pacing, risk-taking, and reliability, the present findings should not be extrapolated to elite athletes, who have higher physiological capacity, competitive experience, and refined pacing strategies.10,21 Our study also focused on a middle-distance time trial and cannot be extrapolated to longer endurance events.
Finally, our findings also provide some insights for further studies and practical applications. Future studies should investigate sex differences in pacing, risk-taking, and reliability during longer distance cycling and running time trials. In addition, field-based or competitive simulations should be conducted to validate laboratory findings in more realistic conditions, where environmental demands and tactical decision-making play a central role in pacing regulation. 40 Furthermore, women cyclists might benefit from interventions designed to improve pacing consistency, such as the use of real-time feedback. 39 Finally studies investigating pacing profiles in women should include more familiarization sessions to improve time trial reliability.
Conclusion
Women and men demonstrated similar pacing profiles, risk-taking behavior, and day-to-day reliability during a 4-km cycling time trial. However, women exhibited greater day-to-day pacing profile variability than men.