
Abstract
Background:
Chronic ankle instability (CAI) is common in athletic populations and is associated with recurrent sprains and impaired performance. Recent evidence shows that fibularis longus has distinct anterior and posterior regions and that, during isometric eversion, people with CAI display a reduced relative contribution of the posterior region. This muscle is typically trained with band-resisted eversion in supine (BES) and BOSU-based exercises (seated and single-leg eversion, BOSU-Sit and BOSU-SL, respectively), yet it is unknown whether these specific tasks correct or perpetuate regional activation deficits.
Hypothesis:
As exercise demands increased from BES to BOSU-based tasks, fibularis longus activation would be differentially modulated and people with CAI would exhibit a greater anterior shift of the activation barycenter together with a reduced relative contribution of the posterior region, particularly during the BOSU-based tasks.
Study Design:
Descriptive laboratory study.
Level of Evidence:
Level 5.
Methods:
A total of 40 physically active adults (CAI, n = 20; no-CAI, n = 20) performed 3 exercises: BES, BOSU-Sit, and BOSU-SL. High-density surface electromyography recorded fibularis longus activation using a 64-electrode grid. Root mean square was computed for anterior and posterior regions, and the activation barycenter was calculated along the x-axis (anteroposterior) and y-axis (cephalocaudal).
Results:
In CAI, both BOSU exercises shifted the x-axis barycenter anteriorly relative to BES (BOSU-Sit, P = 0.01; BOSU-SL, P = 0.01). BES was the only exercise in which people with CAI exhibited greater posterior-region activation than controls (P = 0.003). In contrast, BOSU-SL produced an anterior-dominant pattern, with greater anterior-region activation than the posterior region (P = 0.04) and lower posterior-region activation than BES (P = 0.008).
Conclusion:
Therapeutic exercises commonly grouped as “fibular strengthening” are not neuromuscularly equivalent. In this acute task comparison, BES was associated with a more posterior barycenter and greater posterior-region activation in CAI, whereas BOSU-based tasks primarily activated the anterior region.
Chronic ankle instability (CAI) is characterized by persistent pain and deficits in fibular muscle function after lateral ankle sprains, driven by pathomechanical, motor-behavioral, and sensory-perceptual impairments.10,23,24 Ankle stability depends on neuromuscular control that allows fibularis longus to adjust its activation to task-specific mechanical and postural demands. 44 People with CAI show altered sensorimotor integration and fibular activation, which contributes to impaired dynamic stability.17,30 Although CAI reflects broader sensorimotor dysfunction, fibularis longus is of particular interest because its region-specific organization is functionally relevant for ankle eversion and appears to be altered in this condition.13,34,36 Yet, most studies have treated this muscle as a single homogeneous unit, overlooking its regional anatomical organization and potential task-dependent differences in activation. 16
Fibularis longus is a bipenniform muscle with anterior and posterior subdivisions,3,32 an arrangement that supports task-dependent spatial differences in regional contribution. 36 High-density surface electromyography (HD-sEMG) quantifies amplitude and spatial distribution of the myoelectric signal, yielding activation maps and an activation barycenter (centroid of activity) which displacement reflects task-dependent redistributions of muscle activity.15,18,37 During isometric ankle eversion, people without a history of sprains exhibit homogeneous activation of the anterior and posterior regions, 36 whereas those with CAI show a reduced relative contribution of the posterior region and a more anterior x-axis barycenter,13,34 a pattern that is associated strongly with poorer self-reported ankle function. 33 Although these observations support an altered regional activation of muscle function in CAI, it remains unclear whether therapeutic exercises used commonly in rehabilitation differentially modulate the spatial distribution of fibularis longus activation.
Clinical practice typically integrates therapeutic exercise progressions that combine open- and closed-chain tasks with increasing postural demands to restore ankle function.21,25,28 Commonly used exercises include band-resisted eversion in supine (BES), seated eversion on a “both sides utilized” ball (BOSU-Sit), and single-leg eversion on a BOSU ball (BOSU-SL), representing a progression from a stable open-chain task to progressively less stable closed-chain tasks.21,25,28,43 Elastic-band and unstable-surface training can improve postural control and performance,9,14,20,21 yet findings on fibularis longus activation and evertor strength are inconsistent and no single exercise modality is superior.1,30 A plausible explanation is that neuromuscular alterations in CAI appear particularly evident in the posterior region of the fibularis longus, whereas most rehabilitation approaches have been designed and evaluated at a global muscle level, without explicitly considering regional activation deficits.33,34 Thus, although BOSU-based exercises are used widely to increase postural and functional demands, it remains unclear whether they promote restoration of the altered regional activation pattern observed in CAI or instead elicit compensatory recruitment strategies.
Recent evidence using HD-sEMG feedback shows that directing activation to the posterior region during eversion at higher contraction intensities increases normalized sEMG amplitude in that region and shifts the activation barycenter posteriorly, suggesting a restoration of the spatial activation pattern typically observed in healthy people. 33 This reinforces the clinical relevance of targeting regional, rather than global, muscle activation in the rehabilitation of CAI. Therefore, the aim of this study was to compare the effect of 3 therapeutic exercises (band-resisted eversion in supine, seated eversion on a BOSU, and single-leg eversion on a BOSU) on the spatial distribution and activation amplitude of the anterior and posterior regions of the fibularis longus in people with and without CAI. We hypothesized that, as exercise demands increased from BES- to BOSU-based tasks, fibularis longus activation would be modulated differentially and people with CAI would exhibit a greater anterior shift of the activation barycenter together with a reduced relative contribution of the posterior region, particularly during the BOSU-based tasks.
Methods
Study Design
This case-control study adhered to the Code of Ethics of the World Medical Association (Declaration of Helsinki) and the STROBE statement. The Scientific Ethics Committee of Universidad de Los Andes approved all procedures (No. CEC2024037). All participants read and signed informed consent.
Participants
Participants were recruited from university-affiliated clinics. Participants with CAI were selected using systematic sampling (every second patient with CAI presenting to each center). Controls without CAI (no-CAI) were recruited from university communities via simple random sampling (random number generator). Eligibility criteria for both groups were: age 18 years to 40 years and regular physical activity (≥30 minutes of moderate intensity, ≥3 times per week). The CAI group met International Ankle Consortium criteria 19 : first ankle sprain >1 year ago, no sprain within 6 weeks before testing, and Identification of Functional Ankle Instability score ≥11. Exclusion criteria for both groups included any lower-extremity surgery or any condition that could affect neuromuscular control or the ability to complete the protocol. The no-CAI group had no history of ankle sprains. A baseline questionnaire captured demographics and medical history (Table 1). For participants with CAI, testing was performed on the previously injured ankle. Because participants in the no-CAI group had no history of ankle sprain, the dominant ankle was selected for testing, defined as the limb used preferentially to kick a ball. 41
Participant characteristics by group
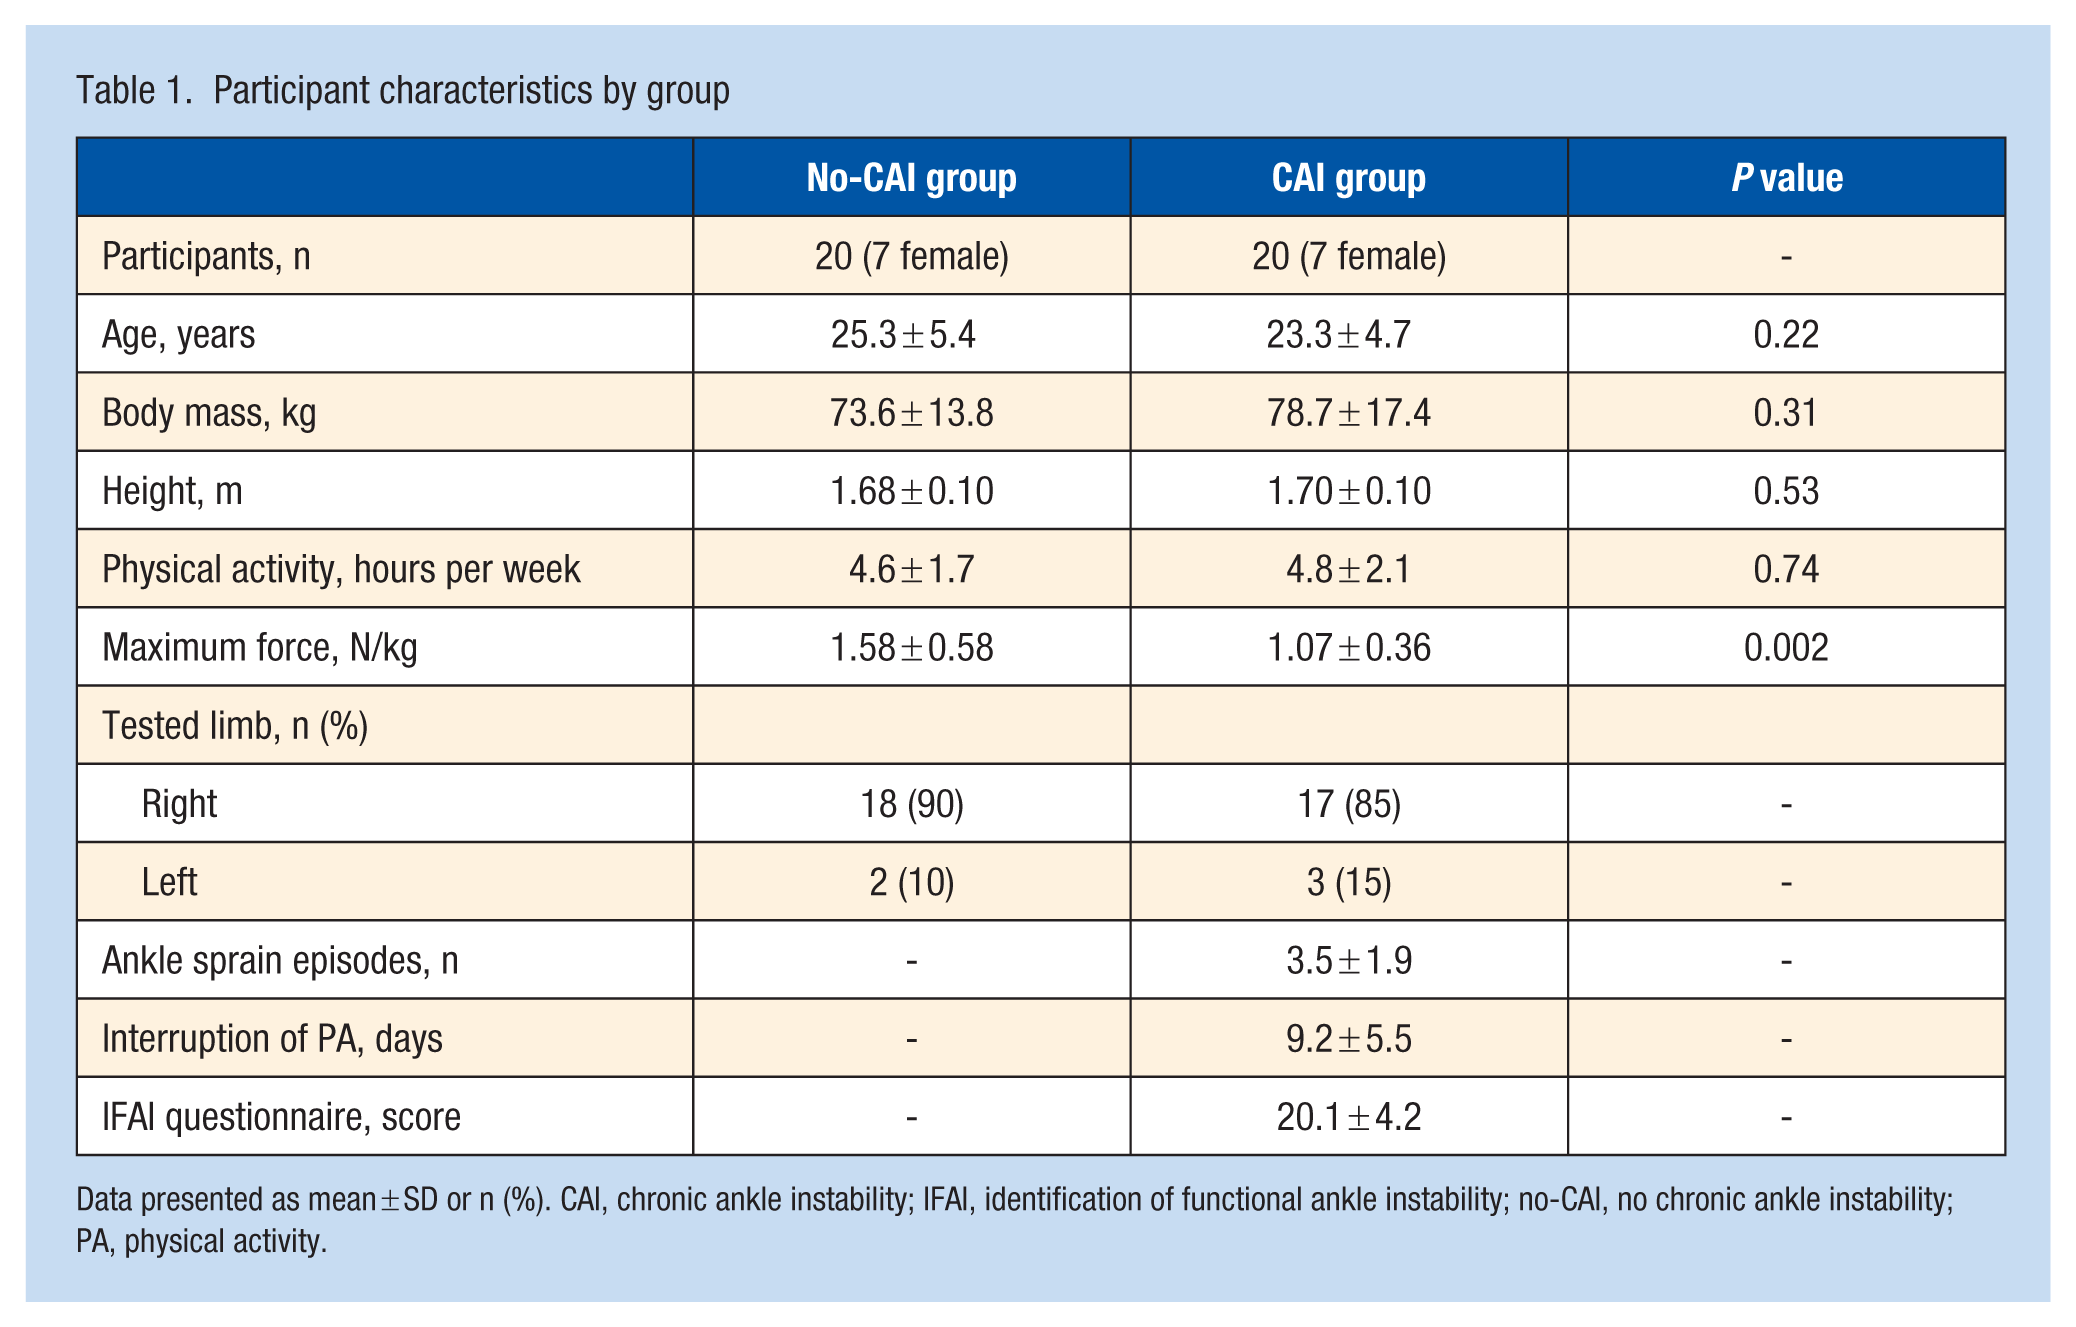
Data presented as mean ± SD or n (%). CAI, chronic ankle instability; IFAI, identification of functional ankle instability; no-CAI, no chronic ankle instability; PA, physical activity.
Sample Size
A repeated-measures analysis of variance (ANOVA) with within-between interaction was used for a priori estimation (α = 0.05; power 1 – β = 0.95; 2 groups; correlation among repeated measures = 0.3; anticipated 20% sEMG signal-processing loss). A total of 20 participants per group were required to detect an effect size f = 0.54. This f was derived from a partial eta squared (η²p) of 0.23 observed previously for between-group differences in fibularis longus barycenter displacement during isometric eversion. 34 Calculations were performed in G*Power Version 3.1.9.6 (Franz Faul, Universität Kiel).
HD-sEMG Electrode and Accelerometer Placement
Skin over the anterolateral leg was shaved and cleaned with abrasive paste and water. A semi-disposable adhesive HD-sEMG grid (64 electrodes; 13 rows × 5 columns; 8-mm interelectrode distance; GR8MM1305, OT Bioelettronica) was positioned within a predefined anatomical reference zone located between 32% and 38% of the line from the fibular head to the lateral malleolus, corresponding to the site of maximal fibularis longus thickness, where motor unit action potential propagation can be detected reliably. 5 B-mode ultrasound guided placement was used to identify the anterior and posterior borders of the fibularis longus in the transverse plane and the myotendinous region in the longitudinal plane. The third column of the grid was aligned with the central tendon and fiber orientation, which served as the reference to differentiate muscle regions; columns 1 to 2 were assigned to the anterior region and columns 4 to 5 to the posterior region, following previous recommendations.35,36 When any part of the grid extended beyond the ultrasound-visualized fibularis longus borders, the grid was translated minimally according to these same placement procedures until all recording columns remained within muscle boundaries and aligned with fiber orientation, thereby minimizing crosstalk.35,36 After positioning the grid, conductive paste was applied to optimize the skin-electrode interface. A triaxial accelerometer (Transducer s.a.s., OT Bioelettronica) was fixed with adhesive tape to the base of the first metatarsal to identify the onset and end of movement phases. Monopolar sEMG was sampled at 2048 Hz, amplified 150 times, and analog-filtered with an eighth-order Bessel band-pass (10-500 Hz). The accelerometer signal was amplified 200 times and sampled at 2048 Hz. Signals were digitized at 16-bit resolution and acquired using OT BioLab (v1.5.8, OT Bioelettronica).
Maximal Voluntary Isometric Contraction
An ankle ergometer (501584, Enraf Nonius) equipped with a calibrated force transducer (CCT Transducer s.a.s.) was used to quantify eversion maximal voluntary contraction (MVC). Force was amplified (Forza-B, OT Bioelettronica). Following previously described protocols,13,35,36 participants were seated with the trunk supported against the backrest, the hip at 90° flexion, the knee at 60° flexion, and the ankle positioned in neutral (0° plantarflexion). The tested foot was secured in the ergometer, and the force transducer was aligned with the subtalar eversion axis (Figure 1). Participants kept their arms crossed over the chest and were instructed to avoid compensatory movements while performing a maximal isometric eversion effort against the transducer for 5 seconds. Three MVC trials were performed with 2-minute rest intervals between trials. Standardized verbal encouragement was provided during each contraction to maintain maximal effort. HD-sEMG was recorded simultaneously, and the MVC magnitude was defined as the highest force value obtained across trials.
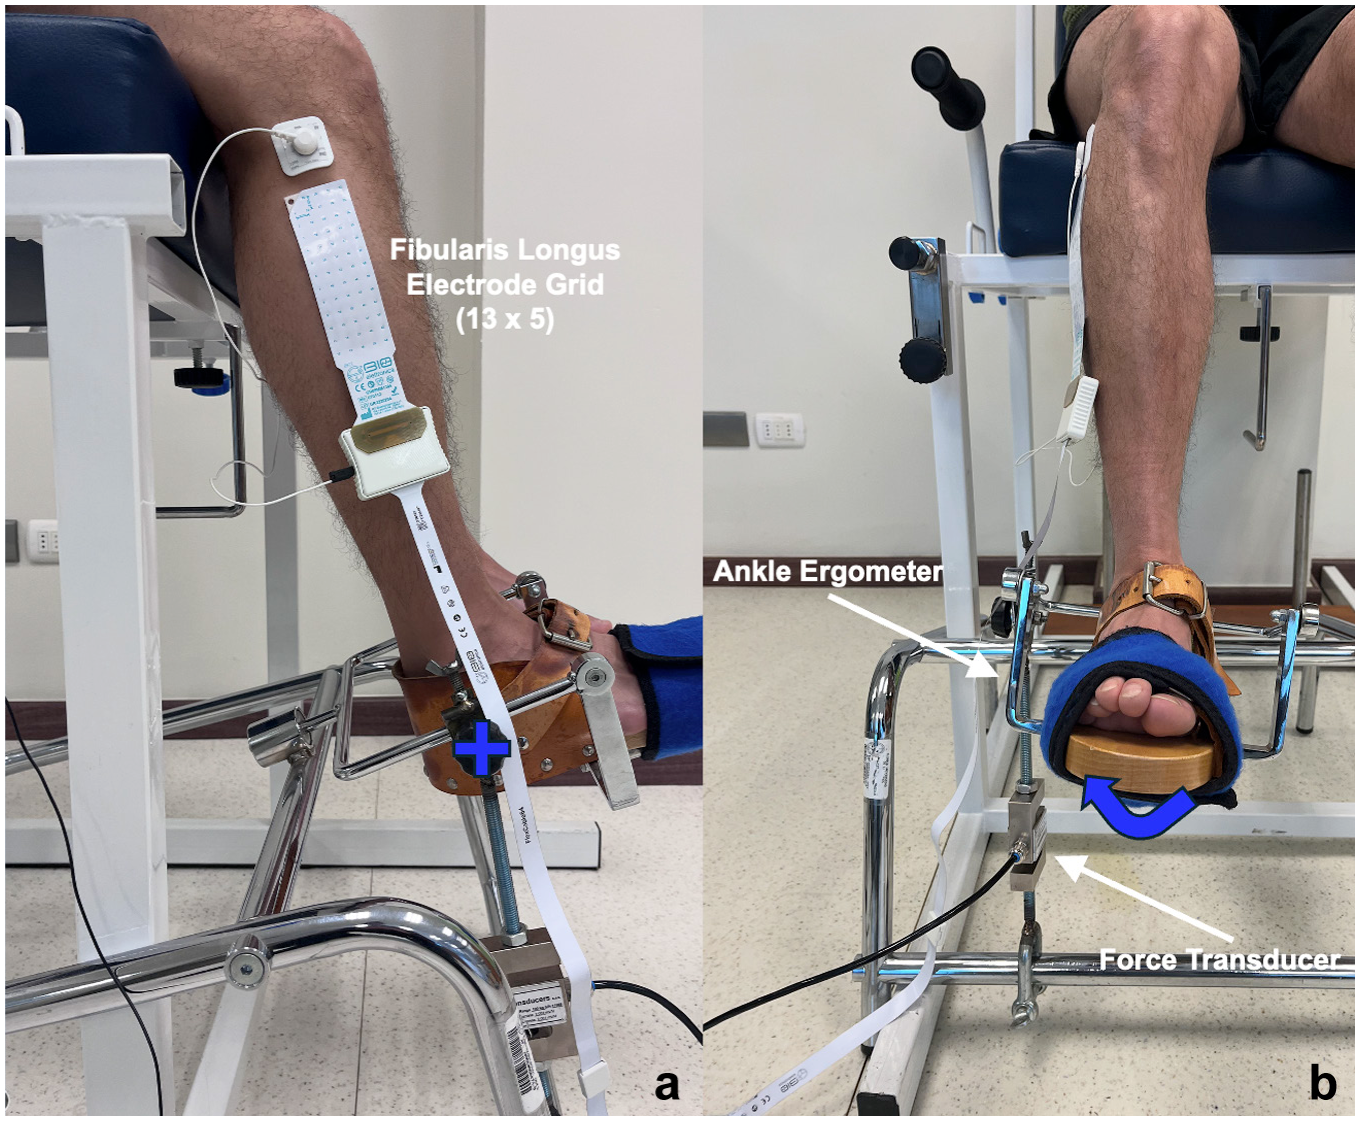
Setup for the eversion MVC assessment. (a) Lateral view showing participant positioning on the ankle ergometer, with the trunk supported against the backrest, hip flexed at 90°, knee flexed at 60°, and ankle in neutral position (0° plantarflexion). (b) Frontal view showing the direction of ankle eversion during the maximal isometric task. The tested foot was secured to the ergometer, and the calibrated force transducer was aligned with the subtalar eversion axis. Participants were instructed to exert maximal eversion force against the transducer while avoiding compensatory movements. MVC, maximal voluntary contraction.
Therapeutic Exercises
After a standardized 5-minute warm-up (general joint mobilization and 2 sets of inversion/eversion and dorsiflexion/plantarflexion stretches), participants performed the 3 eversion exercises in randomized order while fibularis longus HD-sEMG was recorded. Movement cadence was controlled using a metronome (Pro Metronome, EUMLab) set at 20 beats per minute, while visual feedback was provided through a triangular reference displayed on a screen, reinforcing a consistent movement pattern composed of a 3-second concentric and a 3-second eccentric phase across the participant’s full pain-free range of motion. Pain was assessed immediately before and after each exercise using the Numerical Pain Rating Scale. For each exercise, participants completed 3 supervised familiarization repetitions, rested 1 minute, and then performed 1 experimental trial of 7 repetitions. Real-time monitoring ensured cadence adherence and absence of proximal compensations.
Band-resisted Eversion in Supine (BES) Exercise
With the participant supine and the ankle free beyond the table edge, an elastic band (TheraBand CLX, The Hygenic Corporation) was anchored to a stable point and looped around the midfoot (tarsal region) to load primarily the subtalar joint (Figure 2a). The band was stretched to 100% of its resting length during the eversion movement. 9 Resistance was individualized using the standard TheraBand color progression (yellow, red, green, blue, black, silver, gold). To determine the appropriate band level, each participant performed 3 sets of 2 controlled eversion repetitions at a cadence of 3-seconds per phase, with 1 minute of rest between sets, while resistance was increased gradually along the color sequence until a perceived exertion of 3 out of 10 on the Borg CR10 scale was reached. Thus, band elongation standardized the mechanical condition of the task, whereas band color individualized resistance. 8 Participants positioned the ankle at 0° of plantarflexion and performed 7 controlled eversion repetitions at the prescribed cadence, ensuring movement execution without hip or knee compensations.
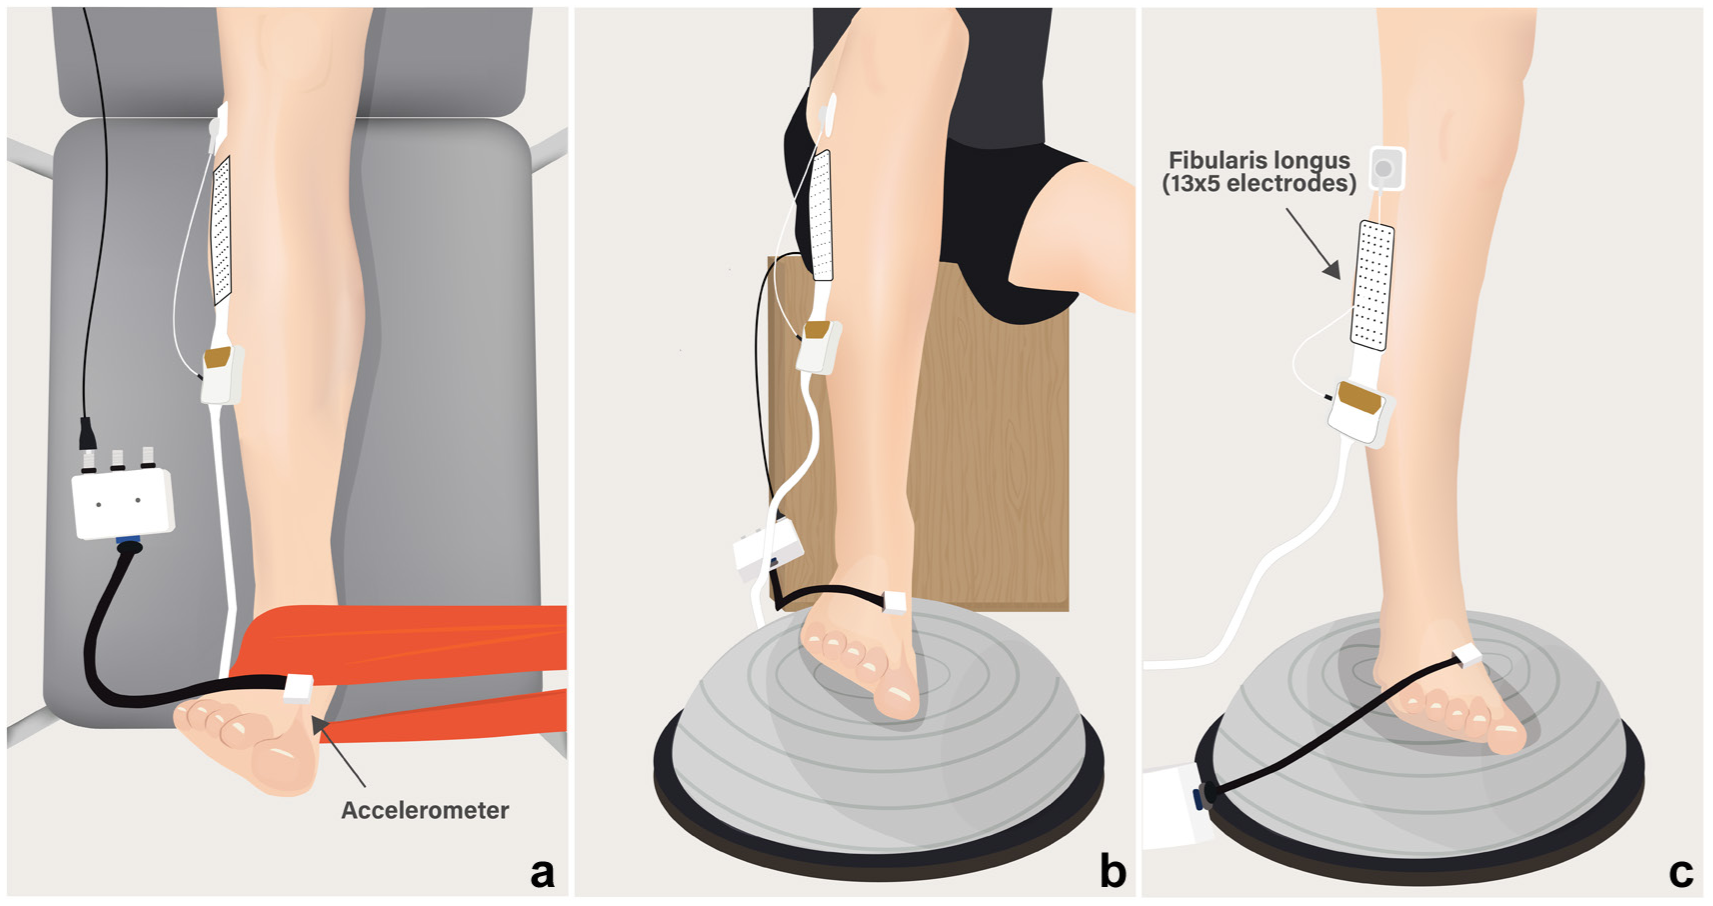
Ankle eversion exercises performed at 0° plantarflexion with controlled movement cadence. In all exercises, the ankle was kept at 0° plantarflexion and eversion was performed at a standardized cadence (3-seconds concentric, 3-seconds eccentric), guided by a metronome set at 20 beats per min and on-screen visual feedback. (a) BES exercise. The participant lies supine with the ankle free beyond the table edge and an elastic band anchored to a fixed point and looped around the midfoot, loading primarily the subtalar joint. (b) BOSU-Sit exercise. The participant sits with the foot placed on the center of the BOSU, aligned with the subtalar joint, performing controlled eversion from a horizontal starting position. (c) BOSU-SL exercise. The participant stands in single-leg stance on the BOSU with its center aligned to the subtalar joint, while the contralateral limb is supported on a chair to increase the base of support during the cadence-controlled eversion-inversion cycles. BES, band-resisted eversion in supine; BOSU-Sit, Seated eversion on a BOSU; BOSU-SL, Single-leg eversion on a BOSU.
BOSU-Sit Exercise
Seated with the foot on the BOSU, the center of the BOSU was aligned with the subtalar joint and the ankle at 0° plantarflexion (Figure 2b). From a level (horizontal) foot position, participants performed 7 eversion repetitions at the set cadence, returning to horizontal between cycles.
BOSU-SL Exercise
Participants stood in single-leg stance on the BOSU, aligning the device’s center with the subtalar joint while keeping the ankle at 0° plantarflexion, with the contralateral limb supported on a chair in triple flexion to increase the base of support without compromising balance (Figure 2c). An investigator stood beside the participant for safety. From a level foot position, participants performed the cadence-controlled eversion-inversion repetitions, returning to horizontal after each cycle.
HD-sEMG Signal Processing
Accelerometry was low-pass filtered at 20 Hz. Monopolar sEMG signals were filtered offline with a second-order Butterworth band-pass (20-400 Hz) (OT BioLab+ Version 1.7, OT Bioelettronica), then exported to Igor Pro Version 8.0 (WaveMetrics) for further analysis. The 64 monopolar channels were differentiated spatially along the cephalocaudal axis, yielding 59 differential signals spanning columns 1 to 5.
sEMG Amplitude
Root mean square (RMS) amplitude was computed in nonoverlapping 100-ms windows and normalized to MVC sEMG. This normalization was based on the eversion MVC recorded in the ergometer because all exercises involved the same primary ankle action (eversion) and were performed with the ankle maintained at 0° plantarflexion (Figure 1). Using a single standardized eversion MVC provided a common reference for between-exercise and between-region comparisons while avoiding task-specific denominators that could be influenced by differences in body support, instability, and weightbearing demands. This rationale is also consistent with previous EMG studies showing that comparable unstable-surface fibularis longus tasks generally elicit submaximal activity relative to MVC. 7 Accordingly, normalization was intended to express relative activation magnitude across tasks rather than to estimate posture-specific maximal activation capacity.
Accelerometer peaks and zero-crossings identified onset and offset of each repetition for segmentation and phase alignment; all detected events were verified visually. Of the 7 repetitions in each trial, repetitions 3 to 6 were analyzed to minimize early-transient variability and late-stage fatigue effects. This decision is consistent with previous ankle-fatigue literature showing that protocols intended to induce measurable fatigue typically require substantially greater loading demands, including sustained contractions at 70% MVIC until force declines and intermittent isometric contractions continued until torque falls to <50% of prefatigue MVC.27,39 Because the present exercise protocol was designed to characterize task-specific activation under low-load, nonfatiguing conditions, a repetition-by-repetition fatigue analysis was not planned. For regional amplitudes, normalized RMS values were averaged within columns (12 signals per column); columns 1 to 2 defined the anterior region and columns 4 to 5 the posterior region.
Spatial Distribution
The spatial distribution of sEMG amplitude was characterized by barycenter coordinates relative to the grid: x-axis (anteroposterior) and y-axis (cephalocaudal). Barycenters were computed from the RMS of all 59 differential signals. Activation maps were generated from RMS values and electrode coordinates and interpolated to a 2-dimensional surface using a smoothed spline (smoothing factor = 8). 38 The x-axis barycenter was considered the primary spatial outcome because of its more direct mechanistic relevance to regional contribution to the eversion component of foot motion.13,34,36 The y-axis barycenter was analyzed as a complementary exploratory outcome to describe additional task-related changes in the spatial distribution of muscle activity.
Statistical Analysis
For all analyses, an alpha of 0.05 was considered and GraphPad Prism (Version 10.4.1) software was used (GraphPad Software). Data are presented as means and standard deviations and 95% CIs. All tests were 2-tailed with a significance level of α = 0.05. Before conducting the ANOVA procedures, statistical assumptions were verified. Residual normality was assessed using the Shapiro-Wilk test, and homogeneity of variances between groups was evaluated with the Levene test. For within-subject factors, sphericity was examined using Mauchly’s test; when this assumption was violated, Greenhouse-Geisser corrections were applied to the degrees of freedom.
For the spatial distribution, x-axis barycenter (anteroposterior) and y-axis barycenter (cephalocaudal) were analyzed using separate repeated-measures ANOVAs with group (between-subjects) and exercise (within-subjects) as factors. For sEMG amplitude (RMS normalized to MVC), a repeated-measures ANOVA was performed with group (CAI vs no-CAI; between-subjects) and 2 within-subject factors: region (anterior, posterior) and exercise (BES, BOSU-Sit, and BOSU-SL). When the ANOVAs revealed statistically significant effects for the factors or their interactions, Tukey-adjusted post hoc pairwise comparisons were applied.
Results
A total of 40 participants were included in the analysis (no-CAI, n = 20; CAI, n = 20). The 20% signal-processing loss considered in the a priori sample size calculation was a conservative estimate. However, no participant-level exclusions were required because all HD-sEMG recordings were of sufficient quality for analysis. None of the participants reported pain of an intensity that interfered with testing (CAI, 1.2 ± 1.7; no-CAI, 0.0 ± 0.0 on the 0 to 10 Numerical Pain Rating Scale). Descriptive statistics for the fibularis longus x- and y-axis barycenter and sEMG amplitude by group, exercise, and region are presented in Table 2.
Fibularis longus surface electromyographic amplitude by region and barycenter position along the x-axis (anteroposterior) and y-axis (cephalocaudal) across the 3 therapeutic exercises (BES, BOSU-Sit, BOSU-SL) in participants with and without CAI
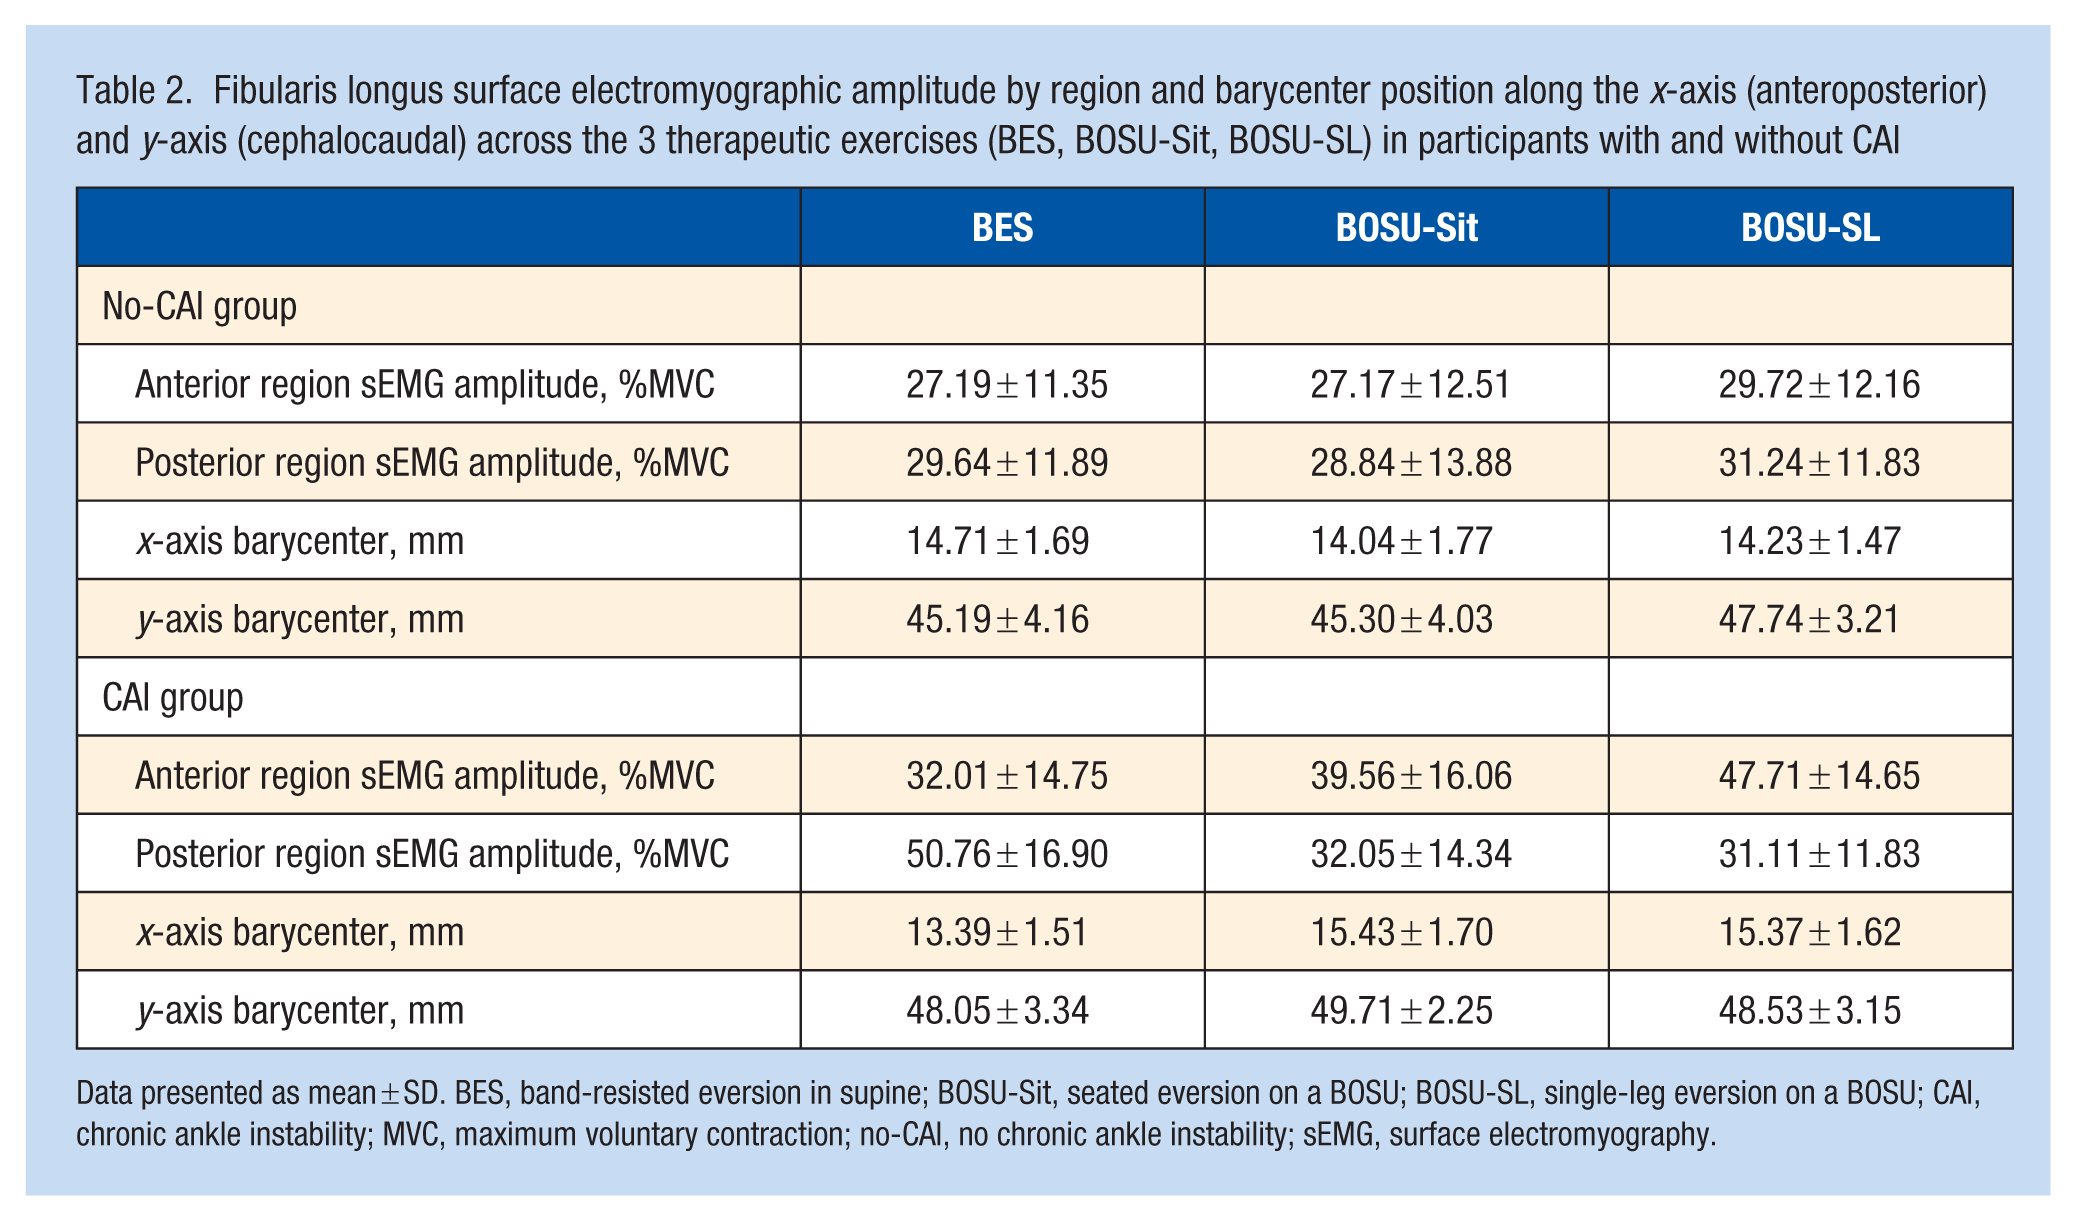
Data presented as mean ± SD. BES, band-resisted eversion in supine; BOSU-Sit, seated eversion on a BOSU; BOSU-SL, single-leg eversion on a BOSU; CAI, chronic ankle instability; MVC, maximum voluntary contraction; no-CAI, no chronic ankle instability; sEMG, surface electromyography.
Barycenter: Group and Exercise
The x-axis barycenter showed a significant group × exercise interaction (F1.846, 70.15) = 10.65; p < 0.001). During BES, the barycenter was more anterior in no-CAI than in CAI (mean difference [MD], 1.32; 95% CI, 0.29 to 2.34; P = 0.01), indicating a more posterior location in CAI (Figure 3a). In contrast, during BOSU-Sit and BOSU-SL, the x-axis barycenter was more anterior in CAI than in no-CAI (BOSU-Sit: MD, 1.39; 95% CI, 0.28 to 2.51; P = 0.02; BOSU-SL: MD, 1.14; 95% CI, 0.15 to 2.13; P = 0.03). Within-group post hoc tests revealed no exercise-related changes in the anteroposterior position of the x-axis barycenter in the no-CAI group (all P ≥ 0.08). In the CAI group, however, the barycenter was more anterior during BOSU-Sit (MD, –2.04; 95% CI, –3.68 to –0.40; P = 0.01) and BOSU-SL (MD, –1.98; 95% CI, –3.55 to –0.41; P = 0.01) than during BES (Figure 3a).
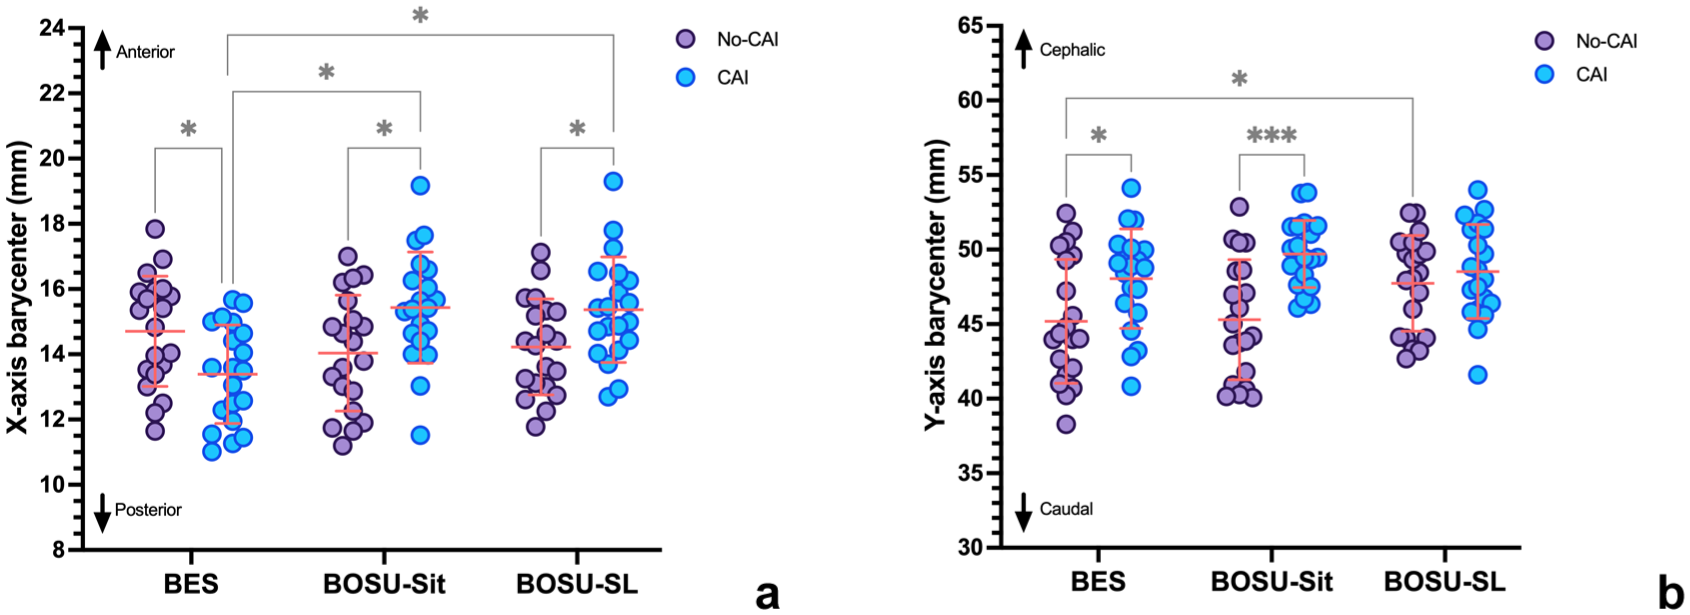
x- and y-axis barycenters of fibularis longus activation across exercises in participants with and without CAI. (a) x-axis barycenter (anteroposterior direction) for the CAI and no-CAI groups during BES, BOSU-Sit, and BOSU-SL tasks. Higher x-axis values indicate a more anterior barycenter (lower values, more posterior) Compared with no-CAI, the CAI group showed a more posterior barycenter during BES and a more anterior barycenter during BOSU-Sit and BOSU-SL. (b) y-axis barycenter (cephalocaudal direction) for the same exercises. Higher y-axis values indicate a more cephalic barycenter (lower values, more caudal). The CAI group displayed a more cephalic barycenter than no-CAI during BES and BOSU-Sit, whereas in no-CAI the barycenter shifted cephalically only during BOSU-SL. Data are mean ± SD. BES, band-resisted eversion in supine; BOSU-Sit, seated eversion on a BOSU; BOSU-SL, single-leg eversion on a BOSU; CAI, chronic ankle instability. Significant differences between groups or exercise are indicated by bracketed lines: *P < 0.05; ***P < 0.001.
For the y-axis barycenter, there was a significant group × exercise interaction (F1.992, 75.68 = 4.66; P = 0.01). Compared with no-CAI, the CAI group showed a more cephalic y-axis barycenter during BES (MD, –2.86; 95% CI, –5.28 to –0.45; P = 0.02) and BOSU-Sit (MD, –4.41; 95% CI, –6.51 to –2.30; P < 0.001) (Figure 3b). No between-group difference was observed during BOSU-SL (MD, –0.79; 95% CI, –2.83 to 1.25; P = 0.44). In the no-CAI group, BOSU-SL located the y-axis barycenter more cephalic position than BES (MD, –2.55; 95% CI, –4.79 to –0.31; P = 0.02), whereas no significant exercise-related differences were detected in CAI (all P ≥ 0.20).
SEMG Amplitude: Group, Region and Exercise
Surface EMG amplitude of the fibularis longus (normalized RMS) showed a significant exercise × group × region interaction (F1.921, 73.01 = 17.56; P < 0.001). In the no-CAI group, amplitudes were similar between anterior and posterior regions and across exercises (all post hoc P ≥ 0.22). In the CAI group, BES elicited greater activation in the posterior than in the anterior region (MD, –18.75% MVC; 95% CI, –1.31 to –36.20; P = 0.03) (Figure 4). Moreover, during BES, activation in the CAI group was higher than in no-CAI in the posterior region (MD, –21.12% MVC; 95% CI, –37.31 to –4.94; P = 0.003). During BOSU-SL, the anterior region in the CAI group showed higher amplitude than the posterior region (MD, 16.60% MVC; 95% CI, 0.76 to 32.44; P = 0.04) and higher values than the anterior region of the no-CAI group (MD, –17.99% MVC; 95% CI, –32.83 to –3.16; P = 0.007) (Figure 4). In addition, the anterior region of CAI group showed higher amplitude in BOSU-SL than BES (MD, –15.71% MVC; 95% CI, –28.95 to –2.46; P = 0.01). Finally, the posterior region of CAI group showed lower amplitude in BOSU-SL than BES (MD, 19.65% MVC; 95% CI, 3.80 to 35.50; P = 0.008).
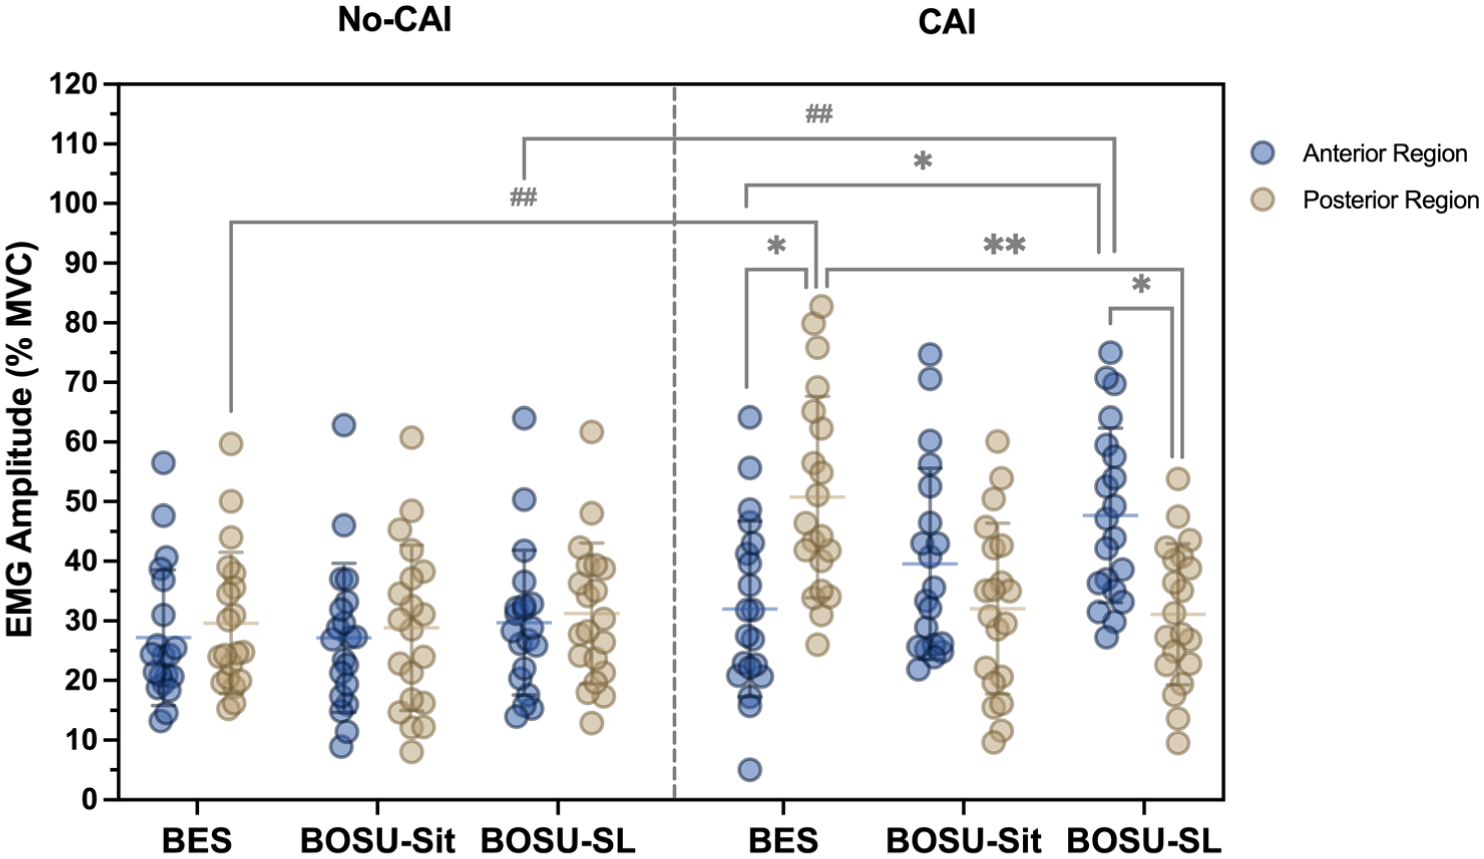
Normalized fibularis longus sEMG amplitude by region and exercise in participants with and without CAI. RMS sEMG amplitude of the anterior and posterior regions of the fibularis longus, normalized to eversion MVC, for the CAI and no-CAI groups during BES, BOSU-Sit, and BOSU-SL tasks. In no-CAI, anterior and posterior regions showed similar amplitudes across exercises. In CAI, BES preferentially increased posterior-region activation, whereas BOSU-SL was characterized by higher activation in the anterior region and reduced posterior activation. During BES, posterior activation was greater in CAI than in no-CAI, while during BOSU-SL, anterior activation was greater in CAI than in no-CAI. BES, band-resisted eversion in supine; BOSU-Sit, seated eversion on a BOSU; BOSU-SL, single-leg eversion on a BOSU; CAI, chronic ankle instability; MVC, maximal voluntary contraction; RMS, root mean square; sEMG, surface electromyography. Data are mean ± SD. Significant between-group differences are indicated by bracketed lines: ##P < 0.01. Significant differences between regions or exercises: *P < 0.05; **P < 0.01.
Discussion
This study examined how 3 commonly prescribed therapeutic exercises (BES, BOSU-Sit, and BOSU-SL) modulate the spatial distribution and amplitude of fibularis longus activation in people with and without CAI. Overall, our findings show that these therapeutic exercises, which differ in mechanical and postural demands, elicit distinct regional activation patterns in CAI that are not observed in controls. The primary spatial finding was observed along the anteroposterior (x-axis) barycenter: people with CAI exhibited a more posterior barycenter displacement during BES, whereas the barycenter shifted anteriorly during BOSU-Sit and BOSU-SL. In contrast, the x-axis barycenter in the no-CAI group remained relatively stable across tasks. For the cephalocaudal (y-axis) barycenter, people with CAI showed a more cephalic barycenter displacement during BES and BOSU-Sit, while controls showed a cephalic shift only in the most demanding BOSU-SL exercise. However, these y-axis findings should be interpreted more cautiously, as their functional significance in the fibularis longus is established less clearly.13,34,36 Amplitude data complemented these observations: the no-CAI group showed a similar activation between anterior and posterior regions, whereas in CAI there was a clear predominance of posterior activation during BES and a transition toward an anterior-dominant pattern during BOSU-SL. From a biomechanical standpoint, a more anterior and cephalic distribution of activity may reflect greater reliance on muscle regions that contribute relatively more to dorsiflexion and less to the eversion component of foot motion, which could represent a less mechanically favorable activation pattern for resisting inversion demands. These spatial activation patterns are consistent with previous reports of a reduced relative contribution of the posterior region in CAI13,34 and suggest that therapeutic exercises differ in their capacity to restore a more balanced distribution of fibularis longus activity.
From an anatomical and mechanical perspective, our data confirm that exercise configuration influences which fibularis longus regions are engaged preferentially. BES elicited greater activation in the posterior region and a more posterior x-axis barycenter in CAI, whereas BOSU-based exercises shifted the barycenter anteriorly and reduced posterior activation. By selectively stimulating neuromuscular regions of the fibularis longus while simultaneously recording foot acceleration during open-chain movements, Mendez-Rebolledo et al 31 showed that stimulation of the posterior region produced the greatest medio-lateral (x-axis) foot acceleration, supporting the interpretation that this region contributes more directly to the eversion component of foot motion. In isometric eversion, people with CAI already exhibit an anteriorly displaced barycenter and a reduced posterior contribution, especially at higher contraction intensities.33,34 The present findings show that this previously described pattern is not invariant across therapeutic tasks. In our study, BES was the only exercise in which people with CAI exhibited greater posterior-region activation than controls, suggesting that this task may acutely reverse, rather than reproduce, the posterior under-recruitment reported during isometric eversion. By contrast, the BOSU-based tasks were associated with a more anterior activation pattern and reduced posterior-region contribution, which is more consistent with the altered regional behavior previously described in CAI.34,37 Bellew et al 6 reported in healthy participants that exercises emphasizing weightbearing forefoot stabilization and closed-chain loading elicit greater global fibularis longus activity than conventional nonweightbearing eversion. However, no previous evidence had shown that these exercises selectively restore recruitment of the posterior region. In our CAI cohort, BOSU-based tasks likewise tended to produce higher overall fibularis longus activation, but HD-sEMG analysis revealed that this increase was achieved predominantly through greater anterior-region recruitment, whereas BES, although less functionally specific, was the only exercise that acutely enhanced posterior-region activation. Taken together, these data suggest that, in the presence of CAI, functional closed-chain tasks may be performed with a compensatory strategy characterized by preferential activation of the anterior fibularis longus region and increased dorsiflexor activity to offset impaired eversion. 26 Importantly, this interpretation should be understood as a mechanistic explanation of task execution, rather than as direct evidence of better or worse clinical outcomes. In the same way, the greater posterior-region activation observed during BES (an open-chain task) should be interpreted as a pattern more consistent with the mechanical role of that region in the eversion component of foot motion, not as proof that BES alone produces superior functional recovery.
Our results can also be interpreted in the context of clinical trials evaluating therapeutic exercise in CAI. Randomized controlled trials and meta-analyses consistently show that balance-based rehabilitation programs improve postural control, dynamic balance and patient-reported outcomes in people with CAI.20,21,28 However, these studies typically quantify global performance outcomes and, when EMG is recorded, focus on overall fibular activity or reflex latency rather that spatial distributions patterns. 22 Thus, it remains unclear whether functional gains are accompanied by restoration of posterior fibularis longus contribution or by compensatory activity predominantly involving the anterior region. In this context, our finding that BOSU-based exercises in people with CAI shift the activation barycenter anteriorly and cranially and preferentially recruit the anterior region, while BES promotes greater posterior-region activation, may help explain the heterogeneous effects reported across rehabilitation protocols. Evidence indicates that balance and unstable-surface tasks increase global fibular activation to meet the demands of mediolateral control,4,40 yet such multijoint tasks do not necessarily enhance recruitment of the posterior fibularis longus region, which contributes more directly to ankle eversion. 36 Accordingly, while balance training remains essential for functional rehabilitation,20,43 integrating more isolated eversion exercises may be necessary to ensure adequate posterior-region engagement in people with CAI.
From a functional perspective, these regional activation patterns may be particularly relevant for postural control. Previous HD-sEMG studies have shown that regional muscle activation is modulated according to perturbation direction during standing and is associated with lower-limb kinematics, supporting a functional role for spatial recruitment in balance regulation. 11 In addition, impaired regional recruitment and differential motor unit behavior during postural tasks have been linked to reduced balance performance. 12 Accordingly, greater posterior-region engagement of fibularis longus may be aligned more mechanically with the mediolateral ankle control required during postural, daily, and sport-related tasks, although these implications remain mechanistic because such outcomes were not measured directly.
Within the broader sensorimotor framework of CAI, these spatial activation patterns likely reflect how the neuromuscular system redistributes workload across fibularis longus regions to cope with persistent mechanical and sensory constraints. Recurrent lateral ankle sprains are associated with delayed fibular activation, impaired proprioception and altered sensorimotor integration, all of which can modify how neural drive is allocated across ankle stabilizers.23,29 Balance- and perturbation-based programs probably promote central reweighting of sensory inputs and improve global postural strategies, but our findings suggest that, at the neuromuscular level, CAI participants may satisfy the increased mechanical demands of BOSU tasks primarily by recruiting anterior fibularis regions, rather than restoring posterior engagement. This regional redistribution may help preserve task performance while reflecting a neuromuscular strategy that is less aligned with the mechanical role of the posterior region during eversion. 28 Although previous HD-sEMG feedback work showed that a more anterior barycenter was associated with poorer self-reported ankle function and that posterior-region targeting can modify this spatial pattern, 33 the present findings should be interpreted as mechanistic observations rather than direct evidence of clinical benefit.
Clinical Implications
From a clinical standpoint, these findings suggest that therapeutic exercise prescription for CAI should consider not only global objectives such as “fibular strengthening” or “balance training” but also the spatial pattern of fibularis longus activation that different tasks elicit. In the present study, BES was the only task that increased posterior-region activation and restored a more posterior barycenter in CAI, supporting its deliberate use to target the region that is thought to contribute more directly to the eversion component of foot motion. These observations should be interpreted as task-specific neuromuscular characteristics rather than direct evidence of clinical superiority. BOSU-based exercises clearly challenged postural control and increased fibularis longus activation, but in CAI this was achieved predominantly via anterior-region recruitment and a more anterior barycenter, a pattern linked previously to poorer self-reported ankle function, which may be less effective for resisting inversion moments. In light of the current evidence that balance-focused programs are beneficial for function and dynamic stability,2,20,28 our results do not argue against the use of unstable-surface exercises; rather, they support combining them with exercises that preferentially engage the posterior region or incorporating feedback strategies to encourage a more homogeneous spatial distribution. Such region-oriented exercise selection could, in theory, better align structural loading with the mechanical role of fibularis longus and potentially contribute to improved resistance to inversion stress. Importantly, these findings reflect acute task-specific neuromuscular responses and should not be interpreted as direct recommendations regarding rehabilitation stage allocation or exercise sequencing.
This study has some limitations. Its cross-sectional, single-session design precludes conclusions about long-term adaptations, exercise sequencing, or injury risk reduction. In addition, functional performance and patient-reported outcomes were not assessed as study endpoints, so the relationship between the observed regional activation patterns and clinically meaningful function cannot be established directly. Participants were young, physically active adults, which limits generalizability to older or less active populations. Moreover, shifts in the activation barycenter, particularly in the cephalocaudal direction, may partly reflect joint-angle dependent changes in fiber length and muscle-tendon geometry rather than solely neural redistribution. Although electrode placement followed standardized anatomical and ultrasound-guided criteria, formal intra- or inter-rater reliability of grid placement was not quantified. In addition, although CAI involves broader neuromuscular impairments, only fibularis longus was assessed, limiting insight into the contribution of other ankle stabilizers and intermuscular coordination patterns. Nevertheless, these findings provide a mechanistic basis for future longitudinal and interventional studies examining whether region-specific activation of the fibularis longus can be modified over time and whether such changes are associated with clinically meaningful outcomes in people with CAI.
Conclusion
This study demonstrates that therapeutic exercises commonly prescribed in CAI rehabilitation generate distinct regional activation patterns of the fibularis longus when assessed with HD-sEMG. In people with CAI, BES increased posterior-region activation and was associated with a posterior shift of the x-axis barycenter, whereas BOSU-based exercises were associated with a more anterior shift of the x-axis barycenter and a predominance of anterior-region recruitment. In contrast, controls maintained a more homogeneous spatial pattern across exercises. These findings indicate that such exercises are not neuromuscularly equivalent, but they should not be interpreted as evidence for a specific sequencing strategy in rehabilitation. Future longitudinal trials should determine whether integrating region-targeted strategies into rehabilitation translates into different clinical and mechanical outcomes. 42
Footnotes
The following authors declared potential conflicts of interest: Interuniversity Network, awarded to G.M.-R. and R.G.-V. through II Interuniversity Competition for Initiation in Associative Research 2023 (code IUP23-02); and National Research and Development Agency (ANID) of Chile, awarded to G.M.-R. through FONDEQUIP Mediano 2025 (code EQM250004). Ethical approval for this study was obtained from Scientific Ethics Committee of Universidad de Los Andes (No. CEC2024037).