
Abstract
Colorectal cancer (CRC) is a leading contributor to morbidity and mortality in the United States, with documented disparities in screening rates across racial lines. This study examined the intersection of race and social vulnerability in CRC screening rates. We examined 117,424 patients eligible for CRC screening in New York State. We assessed CRC screening among individuals aged 45–80 based on Healthcare Effectiveness Data and Information Set guidelines. We used Social Vulnerability Indices (SVIs) geocoded to each patient’s census track. We employed log-binomial multivariate regression models with interaction terms to evaluate the effects of race and social vulnerability on CRC screening rates, while controlling for age, sex, marital status, and community type. Among 117,424 patients eligible for CRC screening, 75.2% of patients (n = 88,276) were effectively screened. Screening rates varied based on race (White 76.2%; Black 64.4%; P < 0.0001). CRC screening rates declined with increasing social vulnerability among both Black and White patients. Among patients in the most socially vulnerable groups, the adjusted rate of screening was 3.8%–8.4% lower for Black patients compared to White patients. In contrast, within the least socially vulnerable (most affluent) group, there was no statistical difference in the rate of CRC screening by race (adjusted risk ratio = 0.981; P = 0.201). The impact of social vulnerability was experienced disproportionately by Black patients. Among patients living in the most vulnerable census tracts, Black patients were significantly less likely to be screened for CRC compared to White patients facing similar social vulnerability. In contrast, we did not observe a difference in screening rates by race in the most affluent (least socially vulnerable) group.
Keywords
Background
Colorectal cancer (CRC) is the second leading cause of cancer-related mortality in the United States among both men and women. In the United States, Black Americans are not only 15% more likely to develop colon cancer but also 35% more likely to die from it compared with White patients. 1
When detected early, CRC is often treatable and potentially curable. Disparities in screening between Black and White patients, however, contribute significantly to the differences observed in mortality.2–4 The United States Preventive Services Task Force (USPSTF) recommends screening for CRC in all adults aged 45–75. 5 Healthy People 2030 has set as a goal to increase the proportion of adults who get screened for CRC to 72.8%, building on public health efforts dating back to the 1980s.6–8 Despite these efforts, substantial disparities in screening rates and outcomes persist among racial groups.9–11 In addition to race, social determinants such as limited access to transportation, language barriers, and financial insecurity significantly influence access to effective screening. 2
Both the American College of Gastroenterology and the USPSTF recognize that inequities in access to and utilization of screening, rather than biological differences, are the primary drivers of racial disparities in CRC outcomes.12,13 They recommend targeted efforts to improve screening uptake in socially vulnerable and minority populations.5,14 To support CRC screening, a range of multifaceted strategies have been undertaken, including (1) embedded clinical decision support tools within the electronic health records,15,16 (2) clinician-focused initiatives,17,18 and (3) patient-facing interventions to increase CRC screening. 17 Despite improvements in screening rates over the past decade, disparities in CRC screening remain largely unchanged. The persistence of these disparities despite concerted efforts to address them is not fully understood and is likely embedded with a complex interplay of social factors and race. Understanding this interplay between race and social factors is important to refine interventions to improve CRC screening among marginalized populations.
While social vulnerability and race are both independently recognized drivers of CRC screening disparities, few studies to date have examined how race and social vulnerability intersect to influence CRC screening. We hypothesized that increasing social vulnerability would disproportionally impact the rate of CRC screening in Black patients.
Methods
Study population
We examined 117,424 patients aged 45–80 years who were eligible for CRC screening. Data were extracted from a common electronic health record across 7 counties in Western New York on January 31, 2024, for patients who self-identified as Black or White and had information regarding social vulnerability. We examined data from the Regional Health Information Organization (RHIO) to ensure comprehensive capture of all available screening data. An RHIO is a collaborative electronic exchange that enables health care systems, hospitals, and clinics to accurately exchange medical data. This process is the same process used for other population health initiatives in the region.19,20 Less than 0.2% of records had missing data.
Social Vulnerability Index
We characterized each patient’s neighborhood-level vulnerability using the Social Vulnerability Index (SVI), a tool designed by the Centers for Disease Control and Prevention and the Agency for Toxic Substances. 21 The SVI is calculated from data collected during the US Census and the 5-Year American Community Survey. We assessed SVI based on the patient’s census track. We examined the overall SVI as well as its subcomponents: socioeconomic status, household composition and disability, minority status and language, and housing type and transportation. Using this information, each patient was assigned a score on a scale from 0 to 100, representing their social vulnerability, with 0 representing the lowest vulnerability and 100 representing the highest vulnerability. We grouped SVI into 4 categories for analysis: 0–24 (least vulnerable), 25–49, 50–74, and 75–100 (most vulnerable).
CRC screening recommendation
We assessed CRC screening based on Healthcare Effectiveness Data and Information Set (HEDIS) definitions. 22 HEDIS definitions are commonly applied in large population health initiatives and health care quality assessments and are aligned with the United States Preventive Services Task Force (USPSTF) recommendations. 5 Appropriate screenings were defined by 1 of the following: fecal occult blood test (FOBT) during the measurement year, flexible sigmoidoscopy during the measurement year or the 4 years prior to the measurement year, colonoscopy during the measurement year or the 9 prior years, computerized tomography colonography during the measurement year or the 4 prior years, or fecal immunochemical test (FIT)-DNA (Cologuard®) test during the measurement year or the 2 prior years.
Covariates
We included age, sex, marital status, and community type in the regression models. Marital status was defined as married, single, divorced/separate, widowed, or unspecified. Community type was defined as metropolitan, micropolitan, small town, or rural. Sex was defined as male, female, and other/unspecified. Age was categorized into 4 distinct groups 41–50 years, 51–60 years, 61–70 years, and 71–80 years.
Statistical analysis
We present unadjusted screening rates stratified by race and SVI. We used chi-square tests to examine differences in screening by race within each SVI category. We used log-binomial multivariable regression models to estimate the screening rates by race and social vulnerability. Models were adjusted for age, sex, marital status, and community type. Interaction terms were used to assess the intersection of SVI and race on CRC screening rates.
Institutional review
The University of Rochester Institutional Review Board evaluated this activity and determined that it did not meet the requirements for a human subject study.
Results
Among 117,424 patients eligible for CRC screening, 75.2% of patients (n = 88,276) were effectively screened. Screening rates varied based on race (White 76.2%; Black 64.4%; P < 0.0001) and social vulnerability scores (Table 1).
Description of Patient Characteristics and Rate of Screening by Characteristics
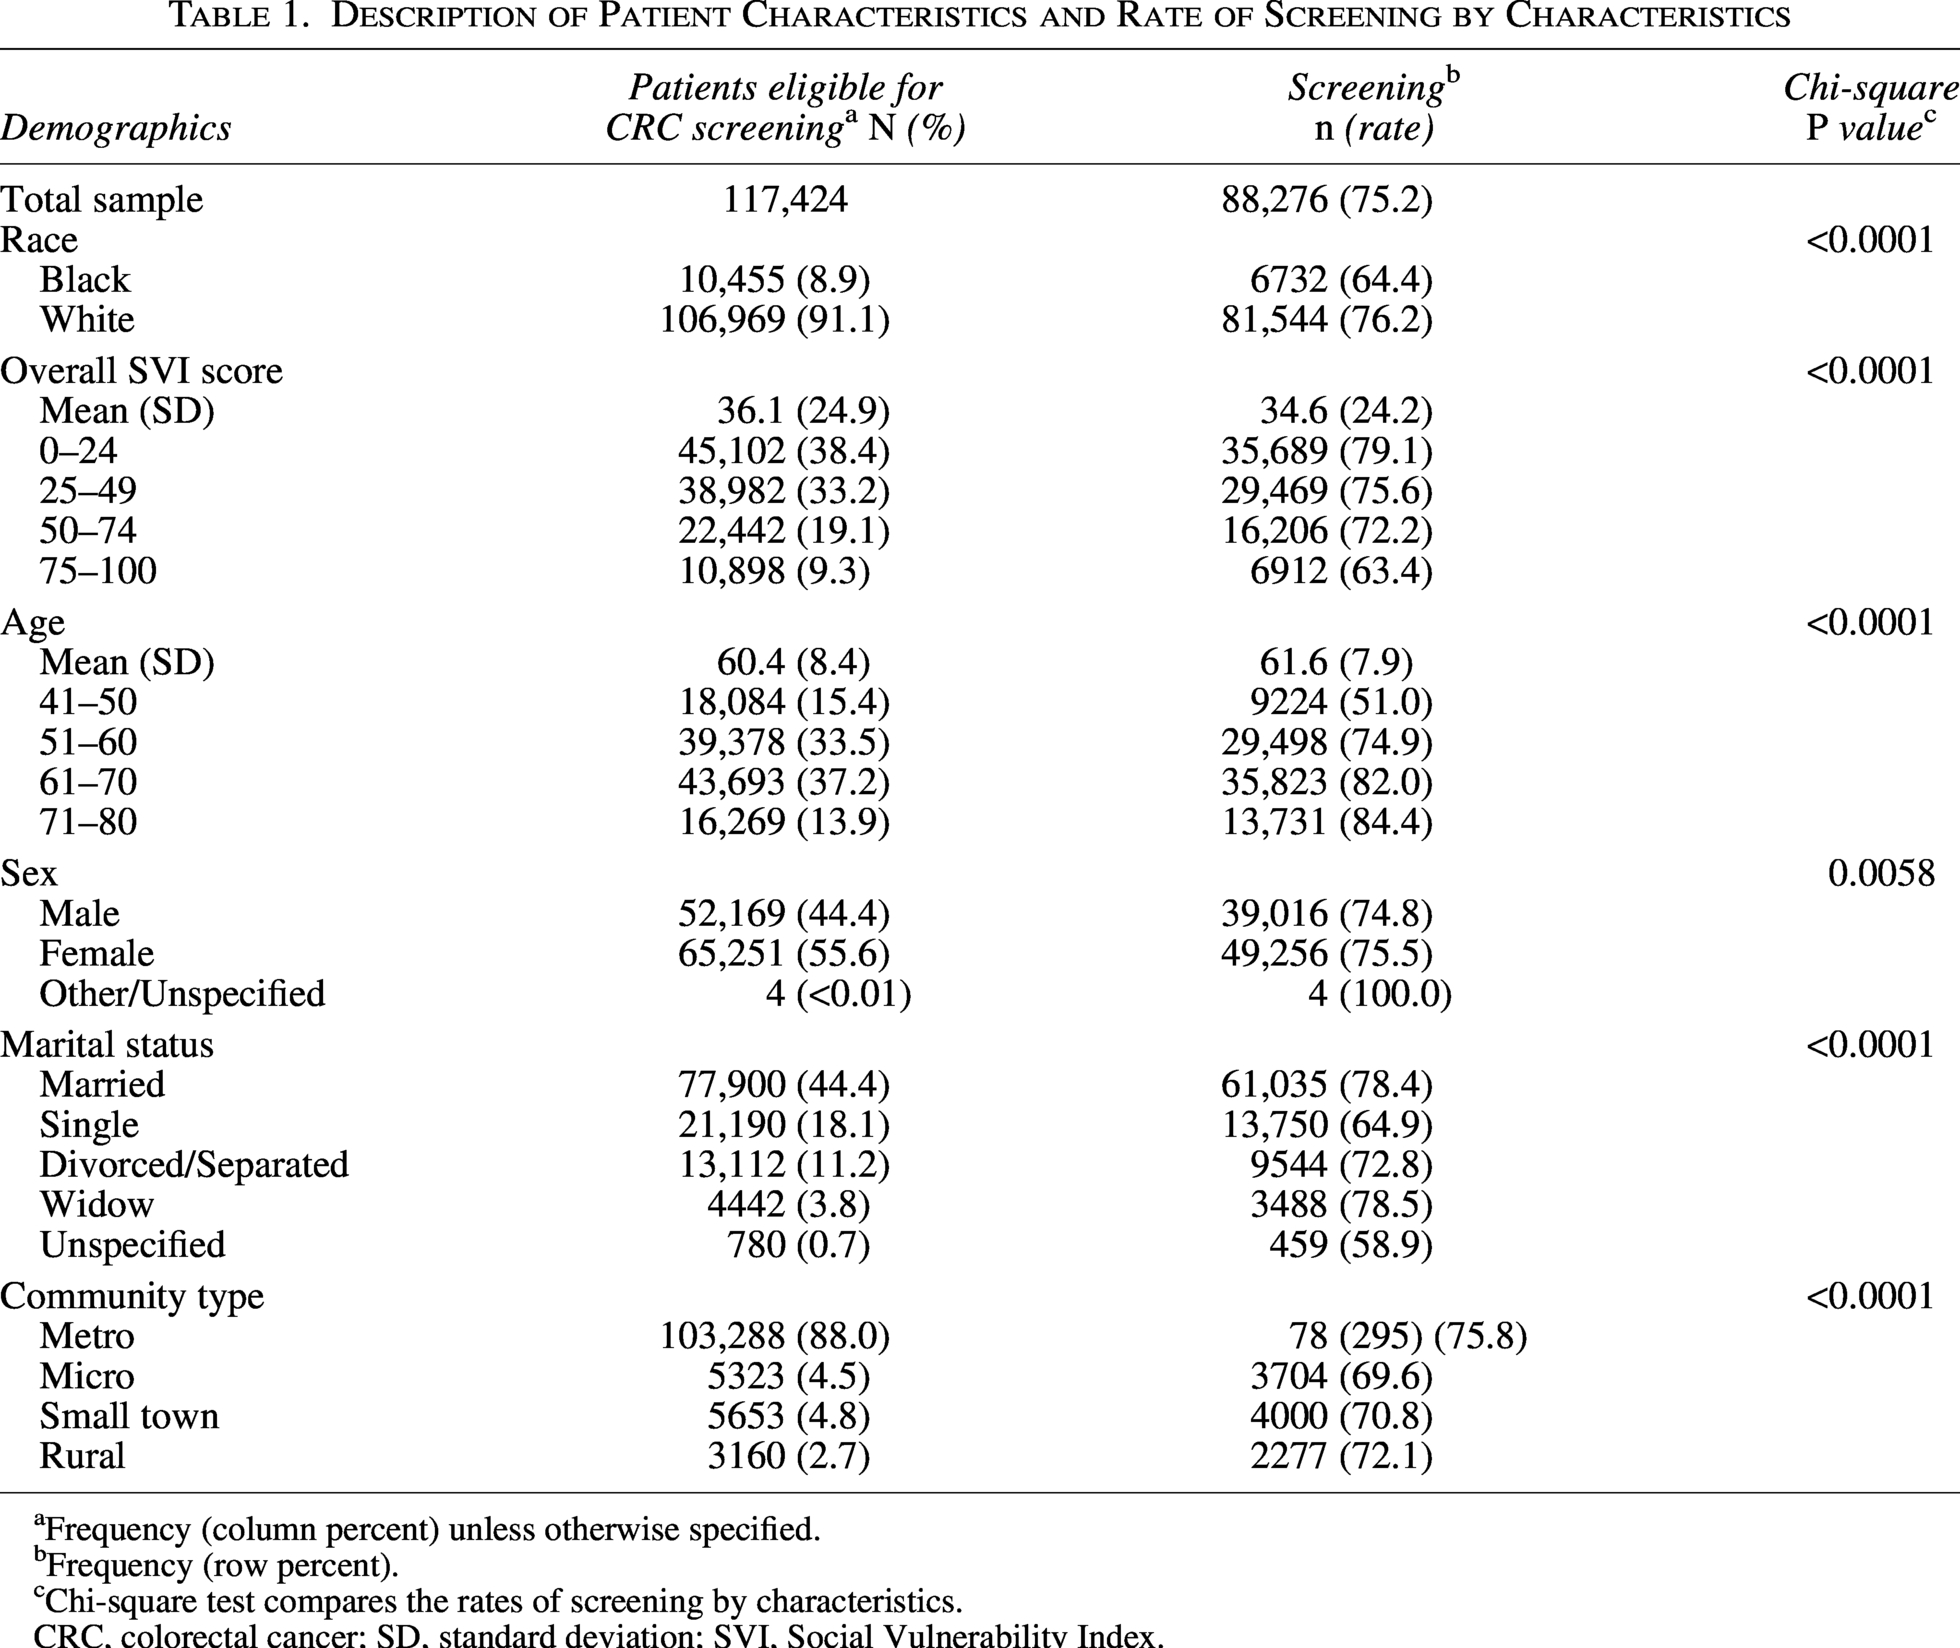
Frequency (column percent) unless otherwise specified.
Frequency (row percent).
Chi-square test compares the rates of screening by characteristics.
CRC, colorectal cancer; SD, standard deviation; SVI, Social Vulnerability Index.
CRC screening rates declined with increasing social vulnerability among both Black and White patients (Fig. 1). Across all social vulnerability groups, Black patients were consistently less likely to be screened than White patients (P < 0.0001 for all comparisons). Figure 2 demonstrates unadjusted screening rates by overall SVI and social vulnerability subscales.
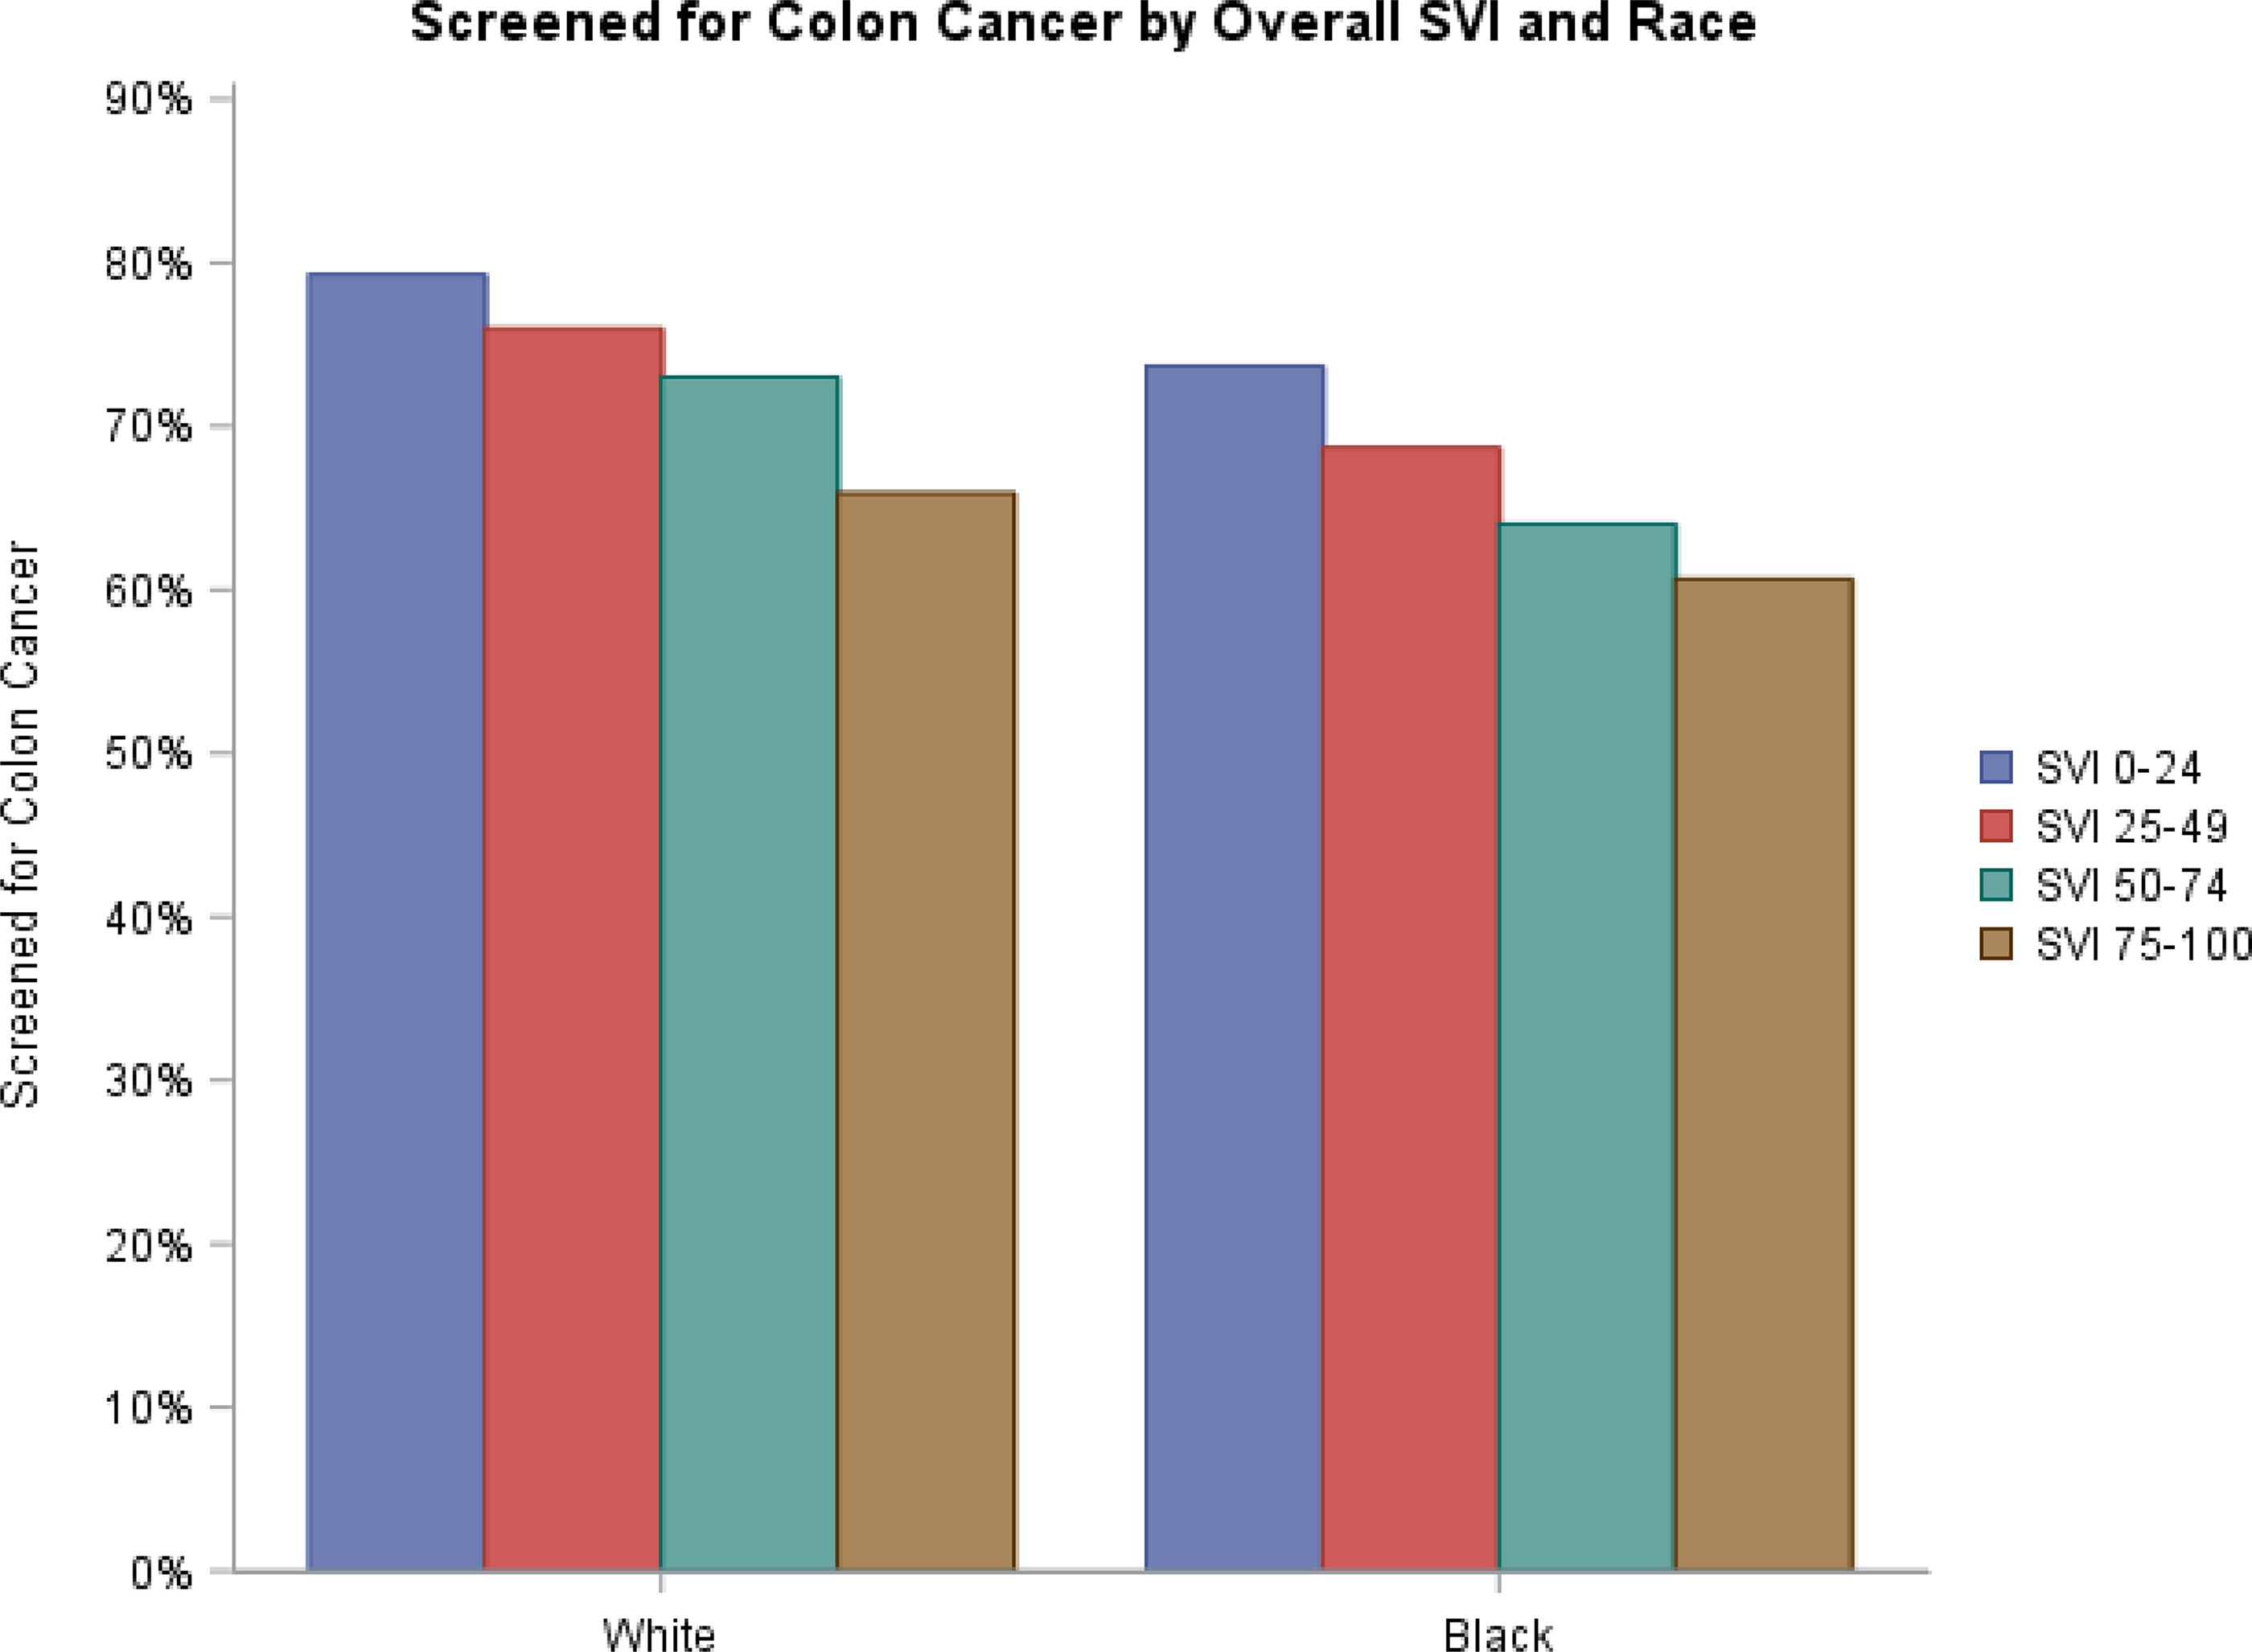
Percent of eligible patient screened by race and SVI. SVI, Social Vulnerability Index.
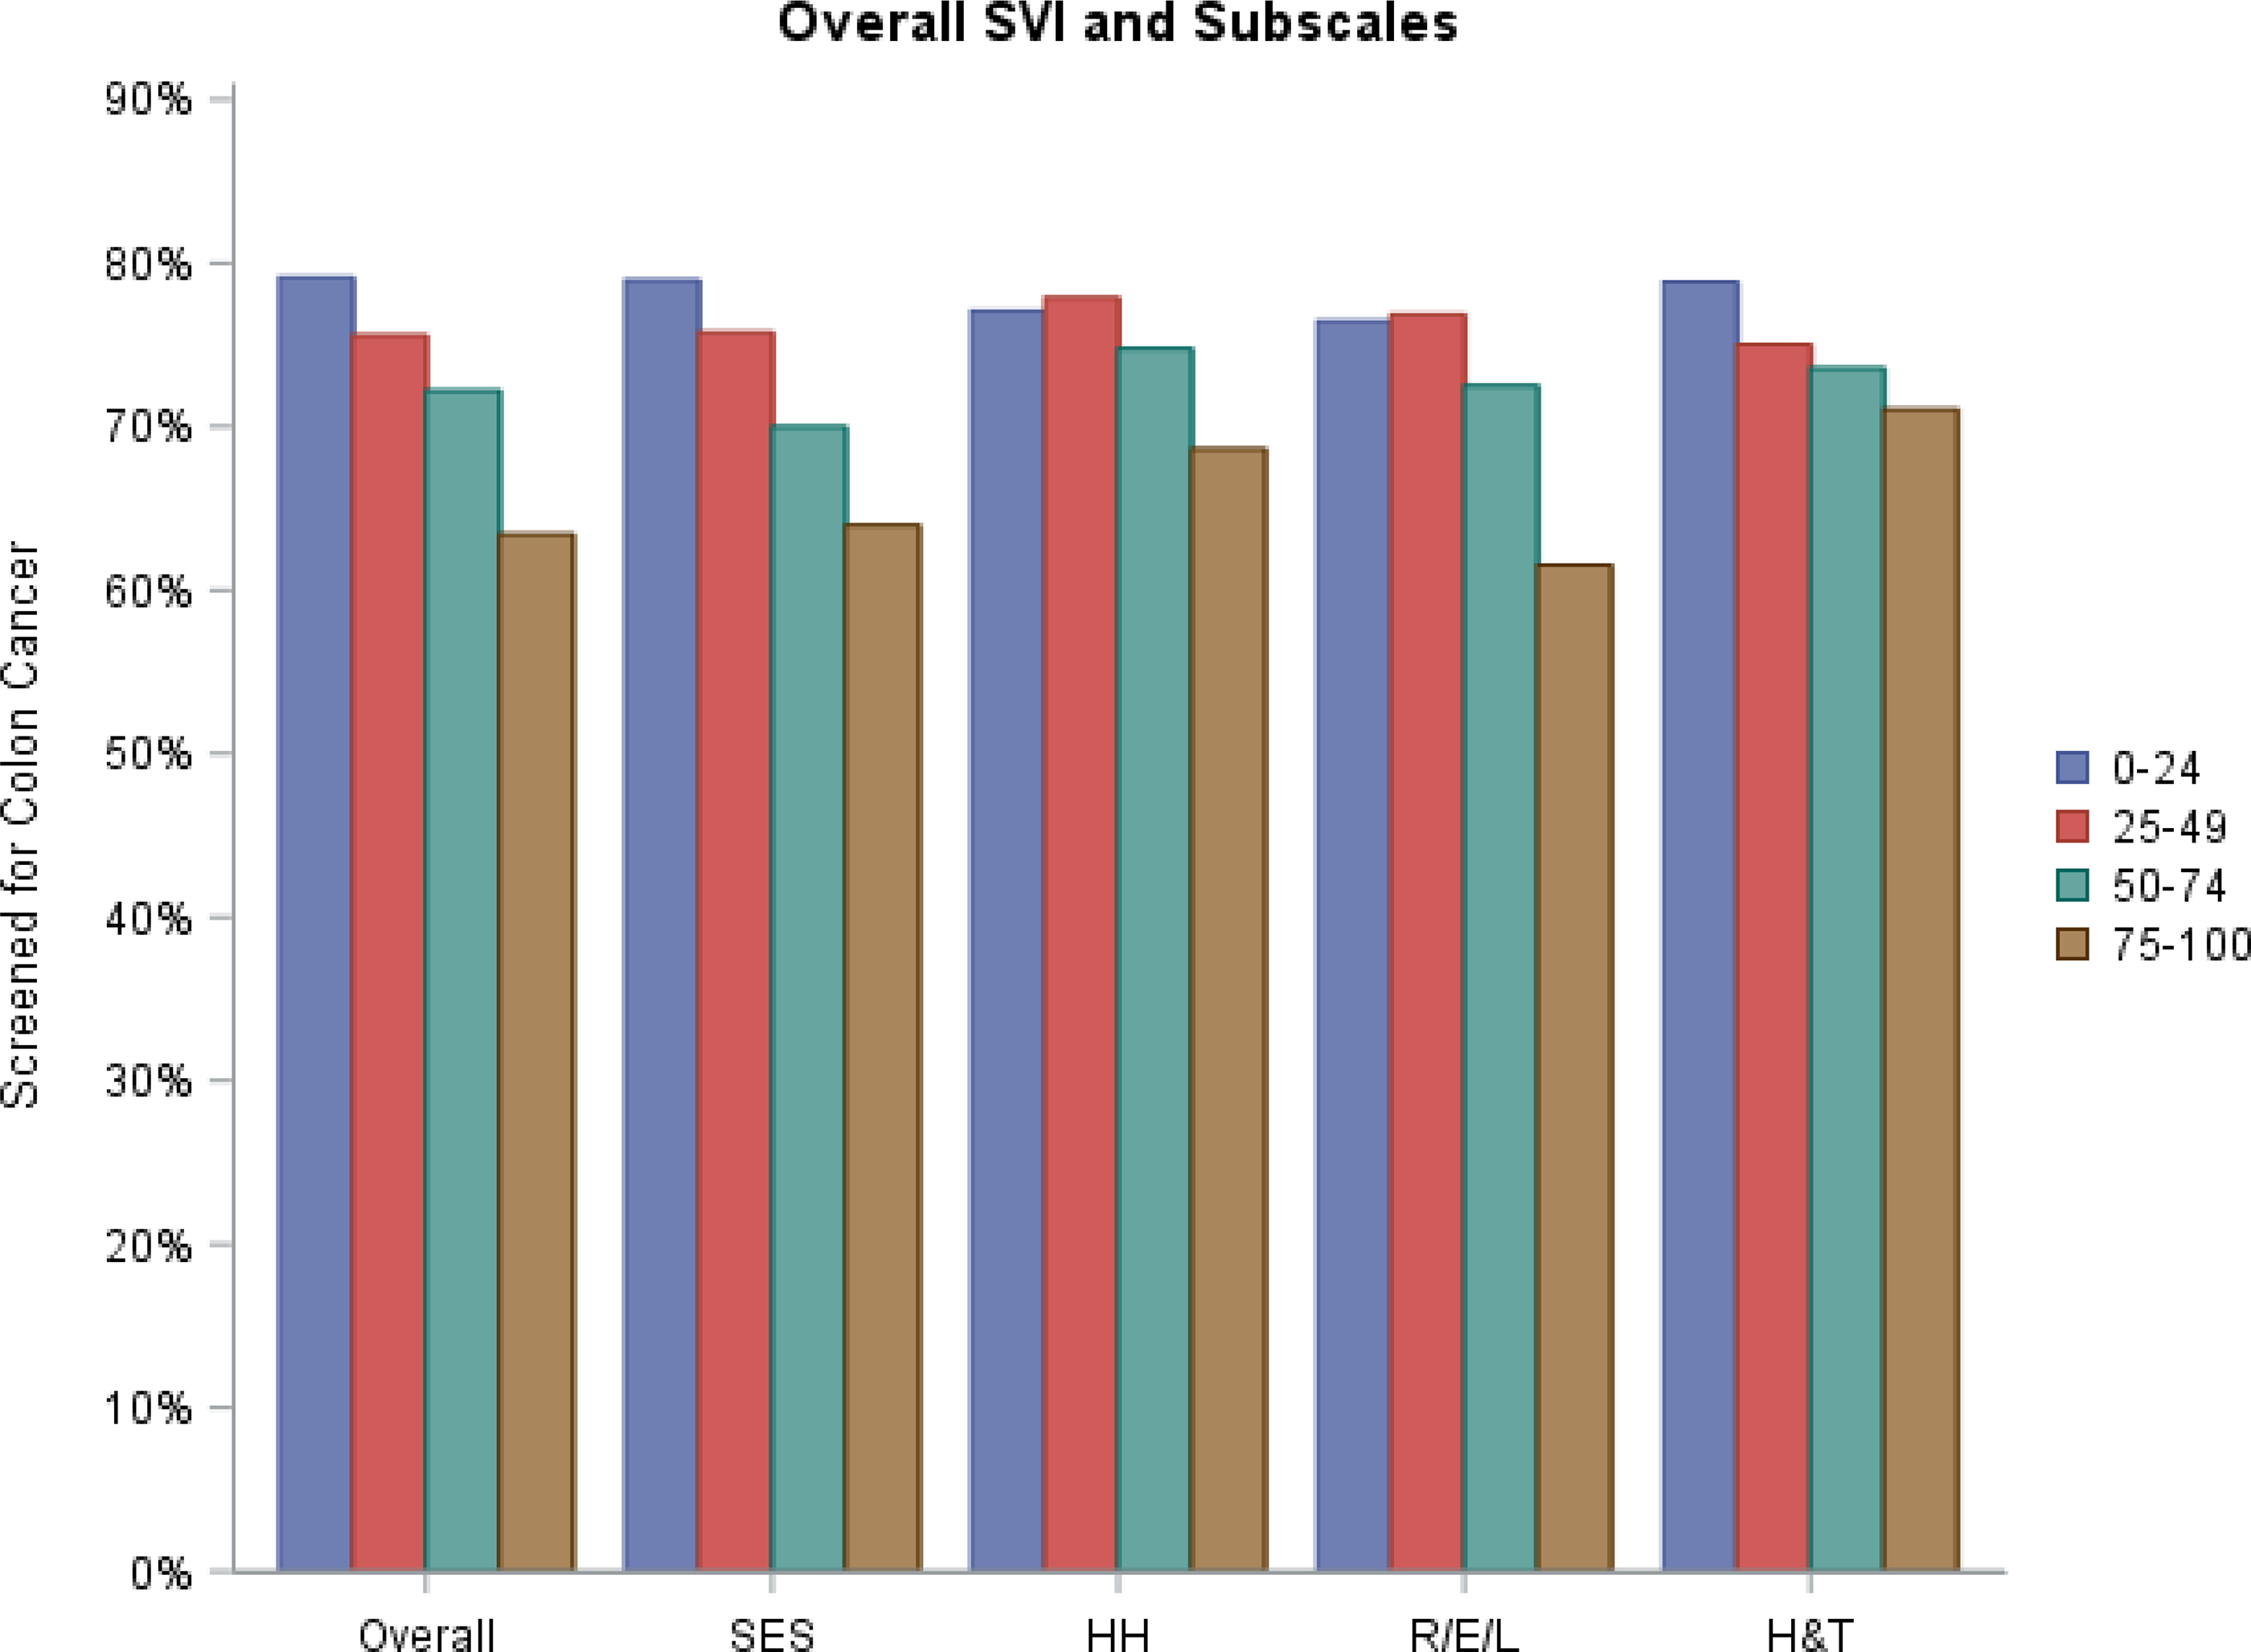
Unadjusted screening for colorectal cancer by overall SVI and subscales. HH, household composition and disability; H&T, housing type and transportation; R/E/L, minority status and language; SES, socioeconomic status; SVI, Social Vulnerability Index.
Table 2 demonstrates the results of a log-binomial regression model incorporating an interaction term between SVI and race and adjusting for SVI, race, age, sex, marital status, and community type. Among patients in the most socially vulnerable groups (SVI = 25–100), the adjusted risk of screening was 3.8%–8.4% lower for Black patients compared to White patients. In contrast, within the least socially vulnerable group (most affluent), there was no statistical difference in the rate of CRC screening by race (adjusted risk ratio = 0.981; P = 0.201). The complete results of the log-binomial regression model are available in Supplementary Data.
Adjusted Risk Ratio of Colorectal Cancer Screening for Black Patients Versus White Patients by Social Vulnerability Index Category
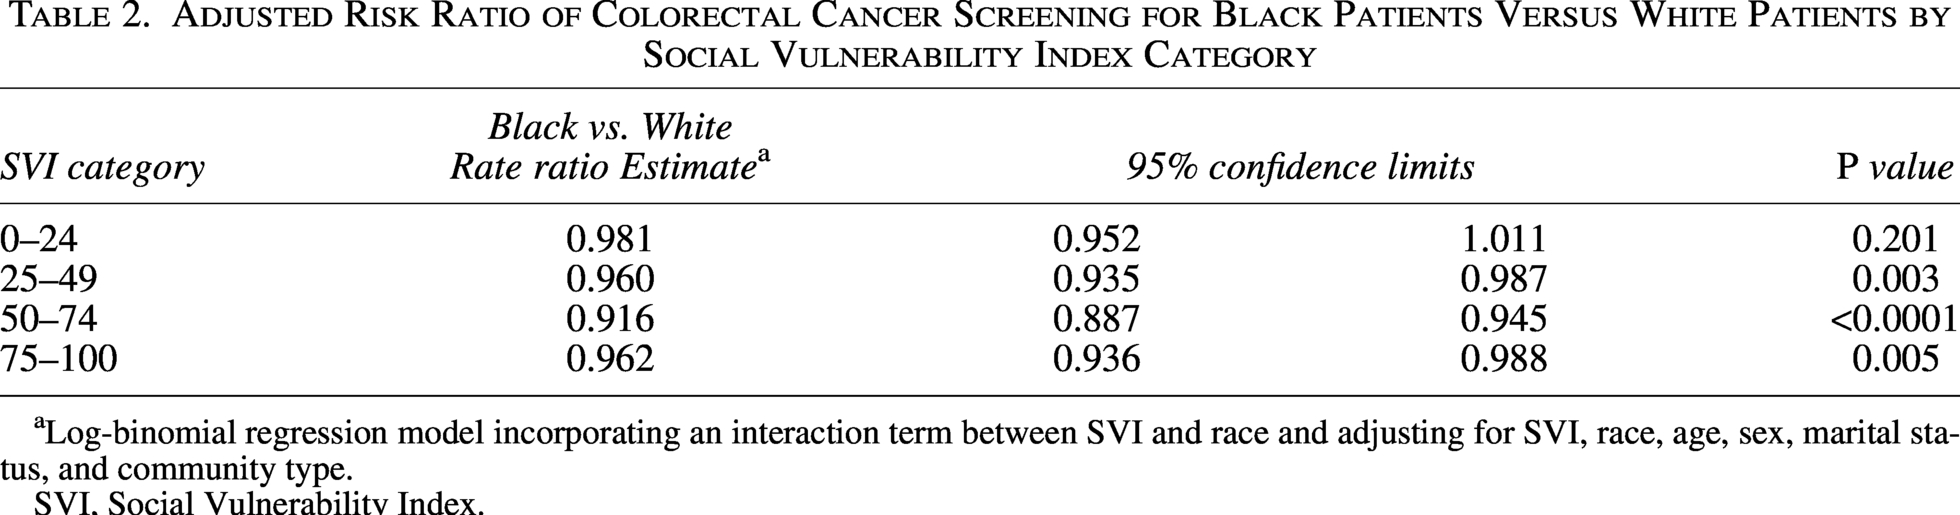
Log-binomial regression model incorporating an interaction term between SVI and race and adjusting for SVI, race, age, sex, marital status, and community type.
SVI, Social Vulnerability Index.
Discussion
Across a large patient population, the intersection of social vulnerability and race played an important role in influencing screening rates for CRC. CRC screening rates declined with increasing social vulnerability among both Black and White patients. When accounting for the interaction of SVI and race, the rate of CRC screening was significantly lower for Black patients compared to White patients for the patients in the most vulnerable groups (SVI >24). However, in the least vulnerable or most affluent group, race did not significantly impact rates of CRC screening after accounting for age, sex, marital status, and community type.
While SDOH and race are both independently recognized drivers of disparities in CRC screening, our findings highlight the complex intersection of race and social vulnerability on cancer screening. Among groups with higher social vulnerability, race had a significant impact on CRC screening. Specifically, Black patients were significantly less likely to undergo screening compared to their equally socially vulnerable White counterparts after controlling for age, sex, marital status, and community type. These findings underscore the persistent and profound impact of race and demonstrate that even after accounting for social vulnerability, race continues to be a significant and independent driver of disparities.
Interestingly, race was not a significant predictor of screening in the least socially vulnerable (most affluent) group. This finding suggests that alleviating social barriers and vulnerability may attenuate the impact of race on screening rates—potentially through greater access to health care and resources to follow up with recommended screening. Alternatively, given the focus on racial disparities over the past several decades, it is possible that public health efforts had the desired effect—but primarily within the most affluent, least vulnerable groups.
Recognizing the multiplicative impact of race and social vulnerability on CRC screening in the most vulnerable groups is critical to develop interventions to address these disparities. Interventions that provide equal access to screening, diagnostic follow-up, and treatment—such as those implemented in integrated health systems—have been shown to mitigate Black-White disparities in CRC outcomes. 23 Additionally, patient navigation, mailed outreach with FIT/FOBT kits, culturally tailored education, reminder systems, and multilevel community engagement are interventions documented to reduce disparities in CRC screening rates among different racial groups. 10 Finally, similar patterns were noted within each social vulnerability subscale, suggesting that interventions aimed at education, employment, and English language proficiency may also help mitigate disparities in CRC screening rates.
Our study had several notable limitations. First, our sample was geographically limited to Western New York; however, the large sample size spread across 7 counties helps to mitigate this constraint. Second, the cross-sectional structure of our study precluded longitudinal analyses of ongoing screening over time, particularly when taking into account the follow-up required depending on the screening method utilized. Third, while our study focused on assessing racial differences between Black and White patients, we were not able to examine screening patterns among other races or Hispanic ethnicity due to smaller sample sizes. Last, we did not have data available within our sample to examine the influence of other clinical comorbidities on CRC screening.
Conclusion
Recognizing the nuanced influence of social vulnerability on racial disparities is essential for guiding strategies to improve CRC screening efforts. Social vulnerability disproportionately affects Black patients living in more vulnerable census tracts compared to White patients experiencing similar levels of social vulnerability. Notably, this intersecting effect of social vulnerability and race was not observed among the most affluent groups, suggesting an important path for understanding and mitigating racial disparities in screening.
Authors’ Contributions
All authors contributed to the study conception and design. Data collection and analysis were performed by CB, CC, RJF and MS. The first draft of the manuscript was written by CB and all authors commented on previous versions of the manuscript.
Author Disclosure Statement
The authors have no additional disclosures.
Footnotes
Funding Information
Supported in part by the Department of Medicine Biostatistical Shared Resource and the University of Rochester School of Medicine and Dentistry.
Supplemental Material
References
Supplementary Material
Please find the following supplemental material available below.
For Open Access articles published under a Creative Commons License, all supplemental material carries the same license as the article it is associated with.
For non-Open Access articles published, all supplemental material carries a non-exclusive license, and permission requests for re-use of supplemental material or any part of supplemental material shall be sent directly to the copyright owner as specified in the copyright notice associated with the article.