
Abstract
Growing evidence links nature contact to improved physical and mental health, yet self-reported measures often rely on undefined concepts of “time in nature.” While experts define nature spaces broadly, from national parks to houseplants, it is unclear if the public shares this view. This study examined how adults perceive the “nature richness” of various environments to determine which spaces the public considers valid for nature contact. A stratified panel sample of U.S. adults (N = 303) completed an online survey rating 16 specific places on a scale from 0 (absolutely zero nature contact) to 100 (complete nature experience). Places were categorized into three subscales: Open Nature (e.g., national parks, lakes), Integrated Nature (e.g., yards, neighborhoods), and Mediated Nature (e.g., VR, screens). Participants held a hierarchical view of nature. Only five of the 16 items received median ratings above 50/100, with Open Nature destinations rated significantly higher than Integrated Nature spaces found in daily life. Mediated Nature was rated lowest overall; however, Black participants rated Mediated Nature significantly higher than all other racial/ethnic groups. Nature connectedness positively predicted ratings across all categories. Results reveal a disconnect between expert and public definitions of nature. By largely discounting Integrated Nature (backyards, neighborhoods), the public may under-report nature contact in standard health surveys. Furthermore, the higher endorsement of Mediated Nature among Black participants may reflect structural inequities in access to safe outdoor green spaces (the “Nature Gap”). Future surveillance tools should differentiate between “time outdoors” and “time in nature” to accurately capture health-promoting exposure.
There is a growing evidence base that nature contact improves both physical and mental health (Frumkin et al., 2017; Jimenez et al., 2021; Oh et al., 2017). While early studies focused on living in neighborhoods with high levels of green space or on tightly controlled experimental designs where participants spent a specific amount of time in a natural or built environment, more current research is focusing on self-reported nature contact in daily living (Browning et al., 2025; Maddock et al., 2022; White et al., 2019). Reliable and valid measures of self-reported time in nature are essential for the development of national guidelines and surveillance systems (Maddock & Johnson, 2024; Maddock & Razani, 2024).
Self-reported measures are critical for public health recommendations because they capture the frequency, duration, and type of individual-level nature engagement, which may differ significantly from objective measures like the Normalized Difference Vegetation Index (NDVI), which assesses residential greenness (Rhew, Vander Stoep, Kearney, Smith, & Dunbar, 2011). For instance, a person living in a highly green neighborhood may never visit a park, while someone in a less green area might actively seek out weekly nature experiences elsewhere (Wu et al., 2022). Furthermore, measures such as the NDVI are not accessible to the general public, nor do they capture the subjective experience of what individuals consider “nature.” Capturing self-reports also allows researchers to establish “dose-response” relations, such as the finding that spending 2 h a week in nature is associated with improved well-being (White et al., 2019), and a minimum dose of 10 min in nature per session improves mental health in college students (Meredith et al., 2019), which directly informs a different type of actionable public health advice than static measures of residential greenery.
While spending time in nature has shown many health benefits, nature connectedness has been identified as an important mediator, with individuals with high levels of connectedness reporting increased benefits (Mayer, Frantz, Bruehlman-Senecal, & Dolliver, 2009). Higher levels of nature connectedness have been shown to not only improve immediate (hedonic) feelings of well-being but also deeper feelings of meaning and purpose (eudemonic well-being), indicating a deep and potentially lasting effect of nature connectedness (Pritchard, Richardson, Sheffield, & McEwan, 2020). Furthermore, people with higher levels of nature connectedness were more likely to notice nature in everyday surroundings (Richardson, Hamlin, Butler, Thomas, & Hunt, 2022).
One essential facet of measuring nature contact is assessing what places “count” as nature. Using the Monitoring of Engagement with the Natural Environment Survey, White et al. (2019) identified a threshold of 120+ min per week of time in nature for improved health. Yet, this survey excludes time spent in your own yard and garden and routine shopping trips. This distinction is critical; preliminary data from the U.S. indicates that personal gardens and backyards might be the most prevalent form of nature contact for Americans (Nakayama, 2026), Furthermore, gardens carry significant cultural meaning, reinforcing connections to home and identity among populations with longstanding gardening traditions (Greer, Rainville, Knausenberger, & Sandolo, 2019).
The complexity of defining nature is noted by Frumkin et al. (2017), who highlight multiple factors that go into assessing nature contact, including spatial scale, proximity, sensory pathways, activities in the space, and levels of awareness. They offer a broad definition of nature ranging from plants in a room and window views to camping trips and virtual reality imagery (Frumkin et al., 2017). Given this complexity in what “counts” as nature, it is important to understand the general public’s perspective on which spaces qualify as nature.
To address this, we utilized a participant-centered design, a method that actively involves participants in the design process to better meet their needs (Bødker, Dindler, Iversen, & Smith, 2022). Rather than researchers debating whether a tree-lined street meets the technical definition of nature contact, assessing the extent to which ordinary people consider various places to be “nature” can help refine how we measure time spent in nature. In this study, we examined how adults viewed the nature richness of 16 different areas and whether these ratings differed by demographics, current time spent in nature, or nature connectedness. We hypothesized that individuals’ perceptions of which environments were more nature-rich would differ between those with higher and lower levels of nature connectedness.
Methods
Participants and recruitment
Data collection was conducted between September 3 and 8, 2025, using the online research platform Prolific. Prolific utilizes a rigorous screening process, including government identification validation, to ensure high data quality (Palan & Schitter, 2018). We employed stratified random sampling with quotas to match the sample to the United States adult population in terms of gender, race/ethnicity, and age categories (U.S. Census Bureau, n.d.). Inclusion criteria required that participants be 18 years of age or older, currently reside in the United States, and be able to read and respond in English. All study procedures were reviewed and rated as exempt by the Texas A&M Institutional Review Board.
Upon entering the study, participants reviewed an online consent form. Those who agreed to participate completed the survey and were compensated with a small monetary incentive through Prolific. Data quality checks included three attention-check questions in the survey (e.g., “Answer Strongly Disagree for this question”; (Oppenheimer, Meyvis, & Davidenko, 2009) and a manual review of respondents with exceptionally fast completion times or failed validation checks. Non-relevant responses were removed from the dataset. Investigators were blind to participant identities, and Prolific did not have access to individual responses.
Survey development
The survey, designed by the lead investigators, assessed individuals’ perceptions of nature places, time spent in nature, and nature connectedness. It also collected standard demographic information, including age, sex, race/ethnicity, urbanicity, zip code, and housing type.
Perceptions of nature places
Participants rated the degree to which they considered 16 specific places to count as “spending time in nature” using a sliding scale from 0 (absolutely zero nature contact) to 100 (complete and full nature experience).
Three subscales were created by grouping these 16 places a priori based on the scale of the environment, the level of human infrastructure present, and the purpose behind the specific place. For example, state and national parks involve minimal human interference, aside from potentially having trails forged or signs installed, and largely serve as distinct destinations for nature contact. Similarly, bodies of water and local parks serve as dedicated open spaces, though the latter may feature more human interference such as concrete paths, benches, or man-made landscaping. While there is more human interference, those spaces are designed specifically for nature contact and being outdoors. In contrast, nature found in neighborhoods, backyards, zoos, and botanical gardens represents environments where nature is deeply integrated into, or bounded by, the built environment, where nature contact might be a product of spending time in those places, but not the primary purpose of the space. This category also captures incidental nature, such as vacant lots, which exist within the urban fabric. Finally, simulated types of nature, such as screen-based media or recorded sounds, require the most mediation to exist. The 16 items were categorized as follows:
Open nature (distinct, larger-scale outdoor environments): state and national parks; ponds, lakes, streams, and other bodies of water; and local parks (Cronbach’s α = 0.64). Integrated nature (elements of nature interwoven with residential or urban infrastructure): neighborhoods; yards and gardens; botanical gardens; dog parks; indoor plants; outdoor community pools; and vacant, undeveloped lots (Cronbach’s α = 0.88). Mediated nature (technological or artistic representations): virtual reality; screen-based media; recorded sounds; and nature artwork (Cronbach’s α = 0.91).
Nature contact
Nature contact, which required our own definition of nature to facilitate shared understanding, was assessed after ‘Perceptions of Nature Spaces’ so that those questions were not biased by our working definition. To measure nature contact, participants were asked to report how much total time they spend outdoors in nature in a typical week. The definition of nature provided to participants read, “Most people define these as visits to…green spaces in town and cities (e.g., parks, yards and gardens, rivers and trails), the countryside (e.g., farmland, forest, mountains, hills, lakes, rivers, springs, trails, deserts), the coast (e.g., beaches, dunes, shorelines), and activities in the ocean, marsh, ponds and wetlands. Do not count time spent outside but not in green or natural spaces, including parking lots and roads.” Response options were: (1) less than an hour; (2) 1 to less than 2 h; (3) 2–3 h; (4) 4–6 h; (5) 7–10 h; and (6) more than 10 h (DJ Case and Associates, 2017).
Connectedness to Nature Scale (CNS)
Nature connectedness was measured using the 14-item Connectedness to Nature Scale (Mayer and Frantz, 2004). Participants rated their agreement with statements such as “I feel a sense of belonging to the natural world” on a 5-point Likert scale (1 = strongly disagree to 5 = strongly agree). After reverse-coding appropriate items, a total mean score was calculated, with higher scores indicating a stronger sense of connectedness. The scale has demonstrated strong internal consistency in previous research (Cronbach’s α = 0.86) and showed high reliability in the current study (α = 0.86).
Results
Participants
The survey was initially completed by 308 participants. Five participants were excluded for failing a validity check or providing improbable responses, resulting in a final analytical sample of 303 participants. Ages ranged from 18 to 76 years (M = 44.3, SD = 14.4). The sample was approximately evenly distributed by sex (50.5% female, 45.9% male), with 3.6% of participants preferring to self-describe. The sample was racially and ethnically diverse: 56.8% are non-Hispanic White, 14.6% are Hispanic, 13.6% are Black, 8.6% are Asian, and 6.3% are from other groups. Geographically, the majority of respondents lived in suburban areas (54.3%), followed by urban (26.5%) and rural (19.2%) areas. Most participants lived in either a single-family home (64.9%) or an apartment (22.1%).
Time spent in nature
Participants reported a wide range of weekly time spent in nature: 36% reported less than 2 h per week, 25.1% reported 2–3 h per week, and 38.9% reported more than 3 h per week. Age was significantly associated with the duration of nature contact (p < 0.05); those reporting less than 2 h of nature contact were generally younger (M = 41.4 years, SD = 14.0) compared with those reporting 2–3 h (M = 47 years, SD = 13.9) or more than 3 h per week (M = 45.1 years, SD = 14.4). No other demographic variables were significantly related to time spent in nature.
Connectedness to nature
The sample reported a high level of nature connectedness (M = 3.81, SD = 0.58). Scores were not significantly associated with age, gender, race/ethnicity, urbanicity, or housing type.
Nature places
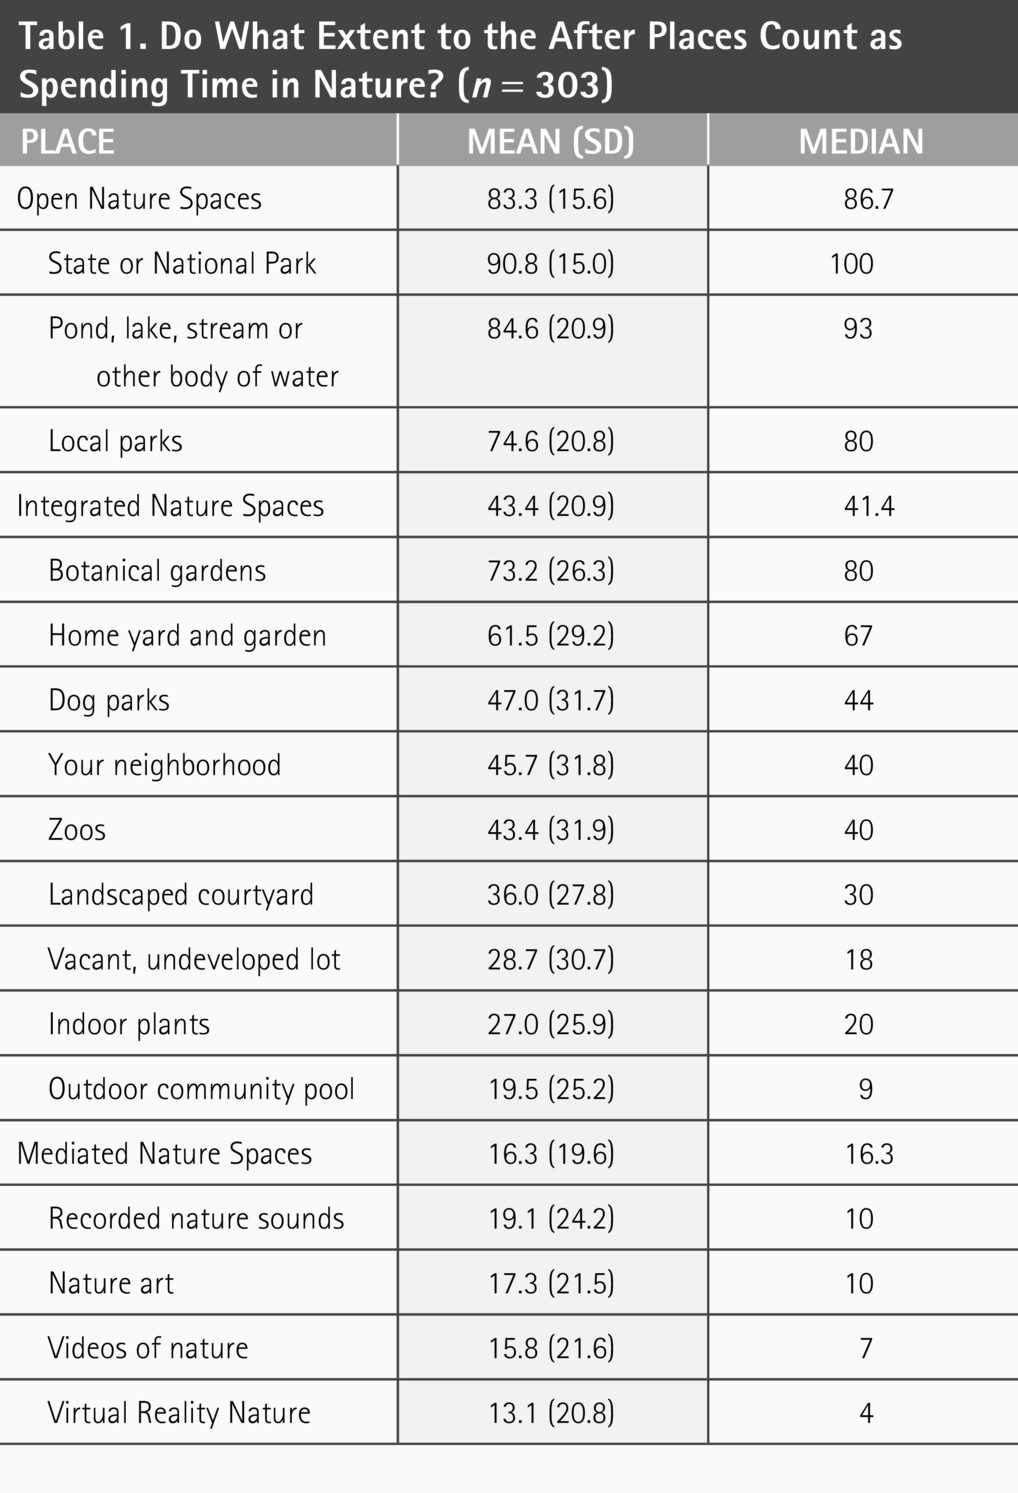
Only five of the 16 spaces had a mean or median rating higher than 50 (on a 0–100 scale). These included state or national park (Mdn = 100); pond, lake, stream or other body of water (Mdn = 93); local parks (Mdn = 80); botanical gardens (Mdn = 80); and home yard or garden (Mdn = 67). The four “mediated” experiences rank the lowest and included: virtual reality nature (Mdn = 4); videos of nature (Mdn = 7); nature art (Mdn = 10); and recorded nature sounds (Mdn = 10). Response variability was high, with 13 of the 16 items having a standard deviation >20, and four items exceeding 30.
Regarding the composite subscales, open nature received the highest endorsement (Mdn = 86.7), followed by integrated nature (Mdn = 41.4) and mediated nature (Mdn = 16.3). Table 1 displays the ratings for each type of nature place.
Do What Extent to the After Places Count as Spending Time in Nature? (n = 303)
Bivariate associations
We next examined the bivariate correlations between nature connectedness, age, and nature place ratings. Nature connectedness was significantly correlated (p < 0.05) with all three subscales: open nature (r = 0.20), integrated nature (r = 0.20) and mediated nature (r = 0.16). It also correlated with most individual places, including: local parks (r = 0.21), neighborhoods (r = 0.22), botanical gardens (r = 0.12), yards or gardens (r = 0.16), state and national parks (r = 0.11), dog parks (r = 0.13), virtual reality nature (r = 0.14), videos of nature (r = 0.12), recorded nature sounds (r = 0.15), nature art (r = 016), indoor plants (r = 0.26), and pond, lake, or other body of water (r = 0.12).
Age was significantly positively correlated with the open nature subscale (r = 0.14) and several individual items, including: neighborhoods (r = 0.12), home yards or gardens (r = 0.12), state and national parks (r = 0.21), and virtual reality nature (r = 0.12).
Correlations between the subscales indicated that open nature was moderately correlated with integrated nature (r = 0.57) but only weakly correlated with mediated nature (r = 0.13). Integrated nature was moderately correlated with mediated nature (r = 0.52).
Group differences
We assessed differences in nature places ratings by categorical variables, including sex, race/ethnicity, urbanicity, and recent time spent in nature. Self-reported time spent in nature during the typical week was significantly related to ratings of open nature spaces. Participants who spent 3 or more hours a week (M = 84.9, SD = 14.5) rated these spaces significantly higher than those who spent 2–3 h a week (M = 81.3, SD = 16.4) and those that spent less than 2 h in the past week (M = 83.0, SD = 16.0).
Integrated nature spaces were rated higher by female participants (M = 45.7, SD = 21.4) than by male participants (M = 39.1, SD = 20.1).
Mediated nature ratings differed significantly by race/ethnicity. Black respondents (M = 24.4, SD = 27.7) rated mediated nature higher than non-Hispanic White respondents (14.5, SD = 16.8), Hispanic respondents (M = 17.6, SD = 22.2), and other groups (M = 14.7, SD = 17.3). No other significant differences were observed across categorical groups. Supplementary Table S1 displays complete results, including individual place analyses.
Regression analysis
Finally, a regression analysis was conducted to assess predictors of the three nature subcategories. All three models were significant. Significant predictors of open nature (R2 = 0.11) included nature connectedness (β = 0.19), age (β = 0.17), Hispanic ethnicity (β = 0.18), and other racial or ethnic groups (β = 0.13). The only significant predictor of integrated nature (R2 = 0.06) was nature connectedness (β = 0.20). The significant predictors of mediated nature (R2 = 0.06) were nature connectedness (β = 0.16) and Black respondents (β = 0.17).
Discussion
This study highlights a critical discrepancy between how researchers define nature and how the public perceives it. Expert definitions of nature include an array of nature exposure, from street trees to potted plants with a lack of consistency across studies (Frumkin et al., 2017). For example, Bratman and colleagues defined nature as “areas containing elements of living systems that include plants and nonhuman animals across a range of scales and degrees of human management, from a small urban park through to relatively pristine wilderness” (Bratman, Hamilton, & Daily, 2012), while Natural England excluded “routine shopping trips or; time spent in your own garden.” (White et al., 2019) and the Nature Contact Questionnaire included indoor nature aspects, including views, natural light, and live plants (Largo-Wight, Chen, Dodd, & Weiler, 2011). Of the 16 types of places evaluated, only five had median ratings greater than 50/100. This indicates that for the average adult, “nature” is largely synonymous with open nature, characterized by distinct destinations like national parks and lakes. Crucially, integrated nature (i.e., spaces where people live their daily lives, such as neighborhoods and indoor plants) was largely rated lower. This disconnect suggests that public health surveys asking about “time in nature” may capture individuals’ most salient nature experiences rather than the full spectrum of exposure, potentially systematically undercounting green-space exposure. The three subcategories of nature exposure were constructed a priori by the research team. Both integrated and mediated nature have very high Cronbach’s alpha scores, indicating that participants rated the items similarly with each subscale. However, open nature had low internal consistency. This was due in large part to the inclusion of local parks in this category. The research team debated whether to include this in open or integrated nature, and it may depend on the type of local park in the respondent’s community. Parks with wooded trails might be more likely to be rated as nature-rich than parks that consist mostly of playground equipment and ball fields. Future studies may want to code local parks as integrated nature or include categories for different local park types.
Nonetheless, self-reported indicators remain essential because they assess behavioral dimensions of perceived nature exposure, such as frequency, duration, and perceived experience, which are relevant to the psychological benefits of connectedness and restoration and inform actionable public health advice. Given the wide range of what participants considered nature, time outdoors may be a more reliable though less valid self-report measure of nature contact.
These findings do not diminish the value of objective measures of the “intensity” or “quality” of available nature using satellite imagery (e.g., NVDI, LIDAR; (Holland et al., 2021). Objective measures capture environmental context, disparities, and structural opportunities to improve access to green space. Taken together, self-reported and objective indicators capture complementary dimensions of nature exposure and support multi-level strategies to promote equitable access to the health benefits of nature. The use of multiple measures to triangulate actual nature exposure may be important since no single measure currently available captures all facets of nature exposure. These may include NVDI and Lidar along with machine learning applications such as NatureDose and NatureScore (NatureQuant, n.d.).
A second notable finding was the racial disparity in ratings of mediated nature. Black American participants endorsed virtual and screen-based nature significantly higher than all other racial and ethnic groups. This finding could be explained by the well-documented “Nature Gap,” where Black and minority communities in the United States have access to fewer, smaller, and lower-quality parks than white communities (Rigolon, 2016). Research in diverse groups of college students has shown that White students think less about fear and danger in nature spaces than their non-White peers. However, fear and nature connectedness vary widely across ethnic minority populations (Taylor, 2019). Additionally, all racial and ethnic groups thought of open and wild spaces as nature, similar to the findings in this study (Taylor, 2022). If safe, high-quality open nature is inaccessible, mediated nature may serve as an accessible, albeit sedentary, substitute. This presents a complex public health trade-off. While mediated nature has modest mental health benefits (Chen, 2025), it lacks the physical activity benefits of outdoor movement (Maddock and Frumkin, 2025). Given that Black Americans are less likely to meet physical activity guidelines than White Americans (Elgaddal et al., 2022), reliance on mediated nature could inadvertently widen the physical health disparities even while providing psychological relief.
Third, nature connectedness acted as a “sensitizing” lens. Participants with higher connectedness scores rated almost all spaces as “more natural,” particularly within the integrated and mediated categories. This suggests a bi-directional pathway: those who feel connected to nature are more likely to “find” it in their everyday environment (e.g., a houseplant or vacant lot). Consequently, interventions that aim to increase nature connectedness might not only improve mental health (Barragan‐Jason, De Mazancourt, Parmesan, Singer, & Loreau, 2022) but also expand individuals’ definitions of nature, encouraging them to utilize local, integrated spaces they previously overlooked. Nature connectedness interventions may also present several other co-benefits, including increased green physical activity and pro-environmental behaviors (Loureiro & Veloso, 2014; McNeil, Singh, & Chambers, 2022; Teixeira et al., 2023).
Limitations
These findings should be considered in light of several limitations. First, the sample was recruited via an online platform (Prolific). While we utilized stratified sampling to match Census quotas, online samples may differ in technological literacy, which could influence ratings of mediated nature. Second, the cross-sectional design prevents causal inferences regarding whether nature connectedness alters perceptions of place, or vice versa. Finally, we did not collect objective geolocation data, meaning we cannot verify the actual greenness of the participants’ “Integrated Nature” environments.
Conclusion
This study provides intriguing initial evidence that the public holds a hierarchical view of nature places, prioritizing open nature destinations while largely discounting the integrated nature of their daily environments. This has profound implications for measurement, suggesting that accurately tracking nature contact will require relying on more than a single question about “time in nature.” Future surveillance tools must be explicit, asking separately about time outdoors, time in parks, and engagement in digital nature, to capture the full spectrum of human-nature interaction. As expert consensus groups continue to refine these measures (Browning et al., 2025), incorporating the public’s perspective will be essential to ensuring these tools are both valid and equitable.
Authors’ Contributions
J.E.M. contributed to the conceptualization, methodology, analysis, and original drafting of the article. M.S.P. and A.E.P. contributed to the conceptualization, methodology, and reviewing and editing of the article.
Footnotes
Ethical Approval and Informed Consent
Study procedures were reviewed and rated as exempt by the Texas A&M Committee on Human Studies.
Consent to Participate
Consent was obtained electronically for all participants by clicking I agree after reading the consent form.
Data Availability
Data is available by contacting the corresponding author.
Author Disclosure Statement
The authors declared no potential conflicts of interest with respect to the research, authorship, and/or publication of this article.
Funding Information
This study was funded by a generous gift from the Marek Family to the Center for Health & Nature.
Supplemental Material
References
Supplementary Material
Please find the following supplemental material available below.
For Open Access articles published under a Creative Commons License, all supplemental material carries the same license as the article it is associated with.
For non-Open Access articles published, all supplemental material carries a non-exclusive license, and permission requests for re-use of supplemental material or any part of supplemental material shall be sent directly to the copyright owner as specified in the copyright notice associated with the article.