
Abstract
Background
Computed tomography (CT) of the paranasal sinuses is the diagnostic reference standard for chronic rhinosinusitis and related inflammatory sinus pathology. Nasal nitric oxide (nNO) levels have been investigated as a diagnostic tool in sinus disease because it decreases with sinus obstruction.
Objective
The primary aim of the study was to determine the correlation of passive (baseline) and dynamic (humming) nNO to CT findings of sinus inflammation and to sinonasal symptoms measured by the modified Sinonasal Outcome Test (26 items) (SNOT-26).
Methods
From June 2015 through January 2016, subjects had baseline and humming nNO levels measured with a chemiluminescence NO analyzer, and each subject underwent CT imaging and completed the SNOT-26 survey. CT images were scored using the Lund–Mackay (LM) system (LM scores >3 indicated sinus inflammation). Correlation was measured by linear and ordinal regression analysis that compared SNOT-26 scores, LM scores, and nNO measurements.
Results
Fourteen subjects were recruited. LM scores had a positive pairwise correlation with total SNOT-26 scores (R2 = .1457; correlation = .3817) and nasal-specific SNOT-26 scores (R2 = .4036; correlation = .6353). Baseline nasal nNO scores had a negative pairwise correlation with LM scores (R2 = .1580; correlation = −.3582), total SNOT-26 scores (R2 = .1515; correlation = −.3893), and nasal-specific SNOT-26 scores (R2 = .0805; correlation = −.4343). Although baseline nNO levels correlated with LM and SNOT-26 scores, humming nNO levels did not show a similar correlation.
Conclusion
Baseline passive nNO may be a useful and inexpensive point-of-care screening test for sinonasal opacification.
Introduction
The mucosa of the paranasal sinuses is normally a site of intense nitric oxide (NO) production.1–4 Measurement of nasal nitric oxide (nNO) consistently yields high levels of NO in proportion to the airflow from the paranasal sinuses into the nasal cavity3–6; one previous study quantified the level of NO in the maxillary sinus and showed that it was up to 49 times higher than the level found in the nasal cavity. 7 In addition, the primary rate-limiting enzyme responsible for NO production, inducible NO synthase, resides in the paranasal sinus mucosa.7–9 Physiologically, the role of NO in the paranasal sinuses is well characterized and includes antibacterial, antifungal, and antiviral properties, plus it stimulates ciliary activity.5,10 In a healthy person, NO levels are consistently high in the airflow from the paranasal sinuses into the nasal cavity.4,11 However, nNO levels can be decreased by obstruction in the ostiomeatal complex, which results in abnormal paranasal sinus gas exchange, and low levels of nNO correlate with decreased mucociliary function and decreased functional capacity of the lungs.5,10
Sinus disease, which blocks the sinusoidal passages and disrupts airflow into the nasal cavity, decreases nNO levels 7 ; additionally, nNO levels are inversely correlated to the severity of sinus disease, as indicated by sinus opacity in computed tomography (CT) scans. Thus, because opacification is associated with decreased nNO levels, nNO has been suggested as a possible biologic marker of disease activity in subjects with chronic rhinosinusitis (CRS) or rhinosinusitis lasting more than 3 months.4,11–13 Furthermore, nNO is easily measured with a low-risk and relatively low-cost test, so nNO assessment also has potential as a screening tool for sinus inflammation and obstruction.2,4,12
Recent investigations have shown that humming, which causes the air in the paranasal sinuses to oscillate, may increase air exchange between the sinuses and the nasal cavity.1,6,14,15 This increase in sinus ventilation is typically detected as a peak in nNO levels, but subjects with clinically significant CRS or ostiomeatal obstruction lack the nNO peak.14,15 The emerging technique of nNO measurement after humming has been compared with the diagnostic reference standard of CT imaging in a study of 10 subjects with radiographically significant sinusitis; control subjects had a 7-fold increase in nNO with humming, whereas the exhaled NO in subjects with sinusitis did not change from baseline. 16 In the current study, we aimed to validate the use of nNO levels by correlating exhaled nNO with CT imaging findings of sinus opacification and with sinonasal symptoms. We hypothesized that increasing sinonasal symptoms and sinus opacification would be negatively correlated with baseline (passive) and humming (dynamic) NO levels.
Methods
We conducted a cross-sectional pilot study in accordance with the protocol approved by the Mayo Clinic Institutional Review Board. Adult subjects (age ≥18 years) were recruited for the study, from June 2015 through January 2016, if they were scheduled for sinus CT, based on clinical suspicion of rhinosinusitis. CT is considered the reference standard for diagnosing sinus inflammation. Subjects were contacted by the study coordinator before the CT scan; if they consented to participate, they were screened for eligibility. Subjects were excluded if they had cystic fibrosis or primary ciliary dyskinesia or if they had previously undergone sinus surgery. CT images of the paranasal sinuses were evaluated using the Lund–Mackay (LM) scoring system. 17 Sinus opacification on the CT scan is scored for each sinus as 0 (no opacification) to 2 (complete opacification), for a possible maximum score of 24 points. A positive CT was defined as an LM score greater than 3. Scoring was performed by a rhinologist (E.K.O.) who was blinded to the nNO determination.
After the sinus CT, subjects had an nNO evaluation with a Siever chemiluminescence NO analyzer. nNO levels reported have been validated at our institution in prior studies.18,19 Baseline nNO was determined in accordance with the 2005 American Thoracic Society and European Respiratory Society guidelines, 20 with a sampling rate of 50 mL/s. After a 2-minute rest for recovery, dynamic nNO was measured with the subject humming for at least 6 seconds. Tests were repeated at least once for each subject. CRS symptoms were assessed with a validated tool, the 22-item Sinonasal Outcome Test plus 4 items associated with sinusitis, with the addition of 4 questions on symptoms of fever, headache, dental pain, and halitosis (Sinonasal Outcome Test [26 items], SNOT-26). 3 Nasal-specific items included the questions about decreased sense of smell; nasal obstruction, blockage, or congestion; runny nose; postnasal discharge; and thick nasal discharge.
Correlation was measured by linear regression analysis comparing mean SNOT-26 scores, both total and nasal-specific (ie, decreased sense of smell; nasal obstruction, blockage, or congestion; runny nose; postnasal discharge; and thick nasal discharge), LM scores, and nNO levels. Ordinal regression analysis was used to compare LM scores with baseline nNO levels.
Results
Fourteen subjects (8 males) were enrolled in the study. Thirteen subjects (93%) were Caucasian, and the mean (SD) age was 59.4 (12.8) years (range, 39–87 years). The mean (SD) LM score was 5.64 (5.64) (range, 0–16); 7 subjects had scores higher than 3, indicating clinically significant sinus inflammation. The mean (SD) SNOT-26 total score was 35.9 (17.4) (range, 6–67), and the mean (SD) nasal-specific SNOT-26 score was 9.5 (5.2) (range, 1–17).
LM score positively correlated with total SNOT-26 score (R2 = .1457; correlation = .3817), indicating that increased opacification of the sinuses on CT was associated with an increased total symptom score (Figure 1(a)). LM score also positively correlated with, and was more strongly associated with, increasing sinonasal-specific symptom scores (R2 = .4036; correlation = .6353), indicating an increased specificity for correlating with sinus opacification on CT with more specific subjective symptom scores in the clinic (Figure 1(b)). Decreasing levels of exhaled nNO correlated with increasing LM scores of sinus opacification (R2 = .1580; correlation = −.3582), in concordance with the premise that greater levels of sinus inflammation (detected on CT) partially obstruct nNO from the paranasal outflow tracts (Figure 2). Additionally, we observed a correlation between decreasing nNO levels exhaled and increasing total SNOT-26 scores (R2 = .1515; correlation = −.3893), confirming an association between progressively lower nNO levels and progressively higher subjective symptom scores clinically reported (Figure 3). Finally, we noted a correlation between decreasing nNO levels exhaled and increasing sinonasal-specific symptom scores (R2 = .0805; correlation = −.4343), indicating consistency in the correlations seen in total and sinonasal-specific symptom scores (Figure 4). Table 1 outlines each comparison analyzed through logistic regression analysis in this study and provides respective R2 values. Unlike the baseline passive nNO measurements, the addition of humming nNO measurements did not add utility to this clinical point-of-care test.
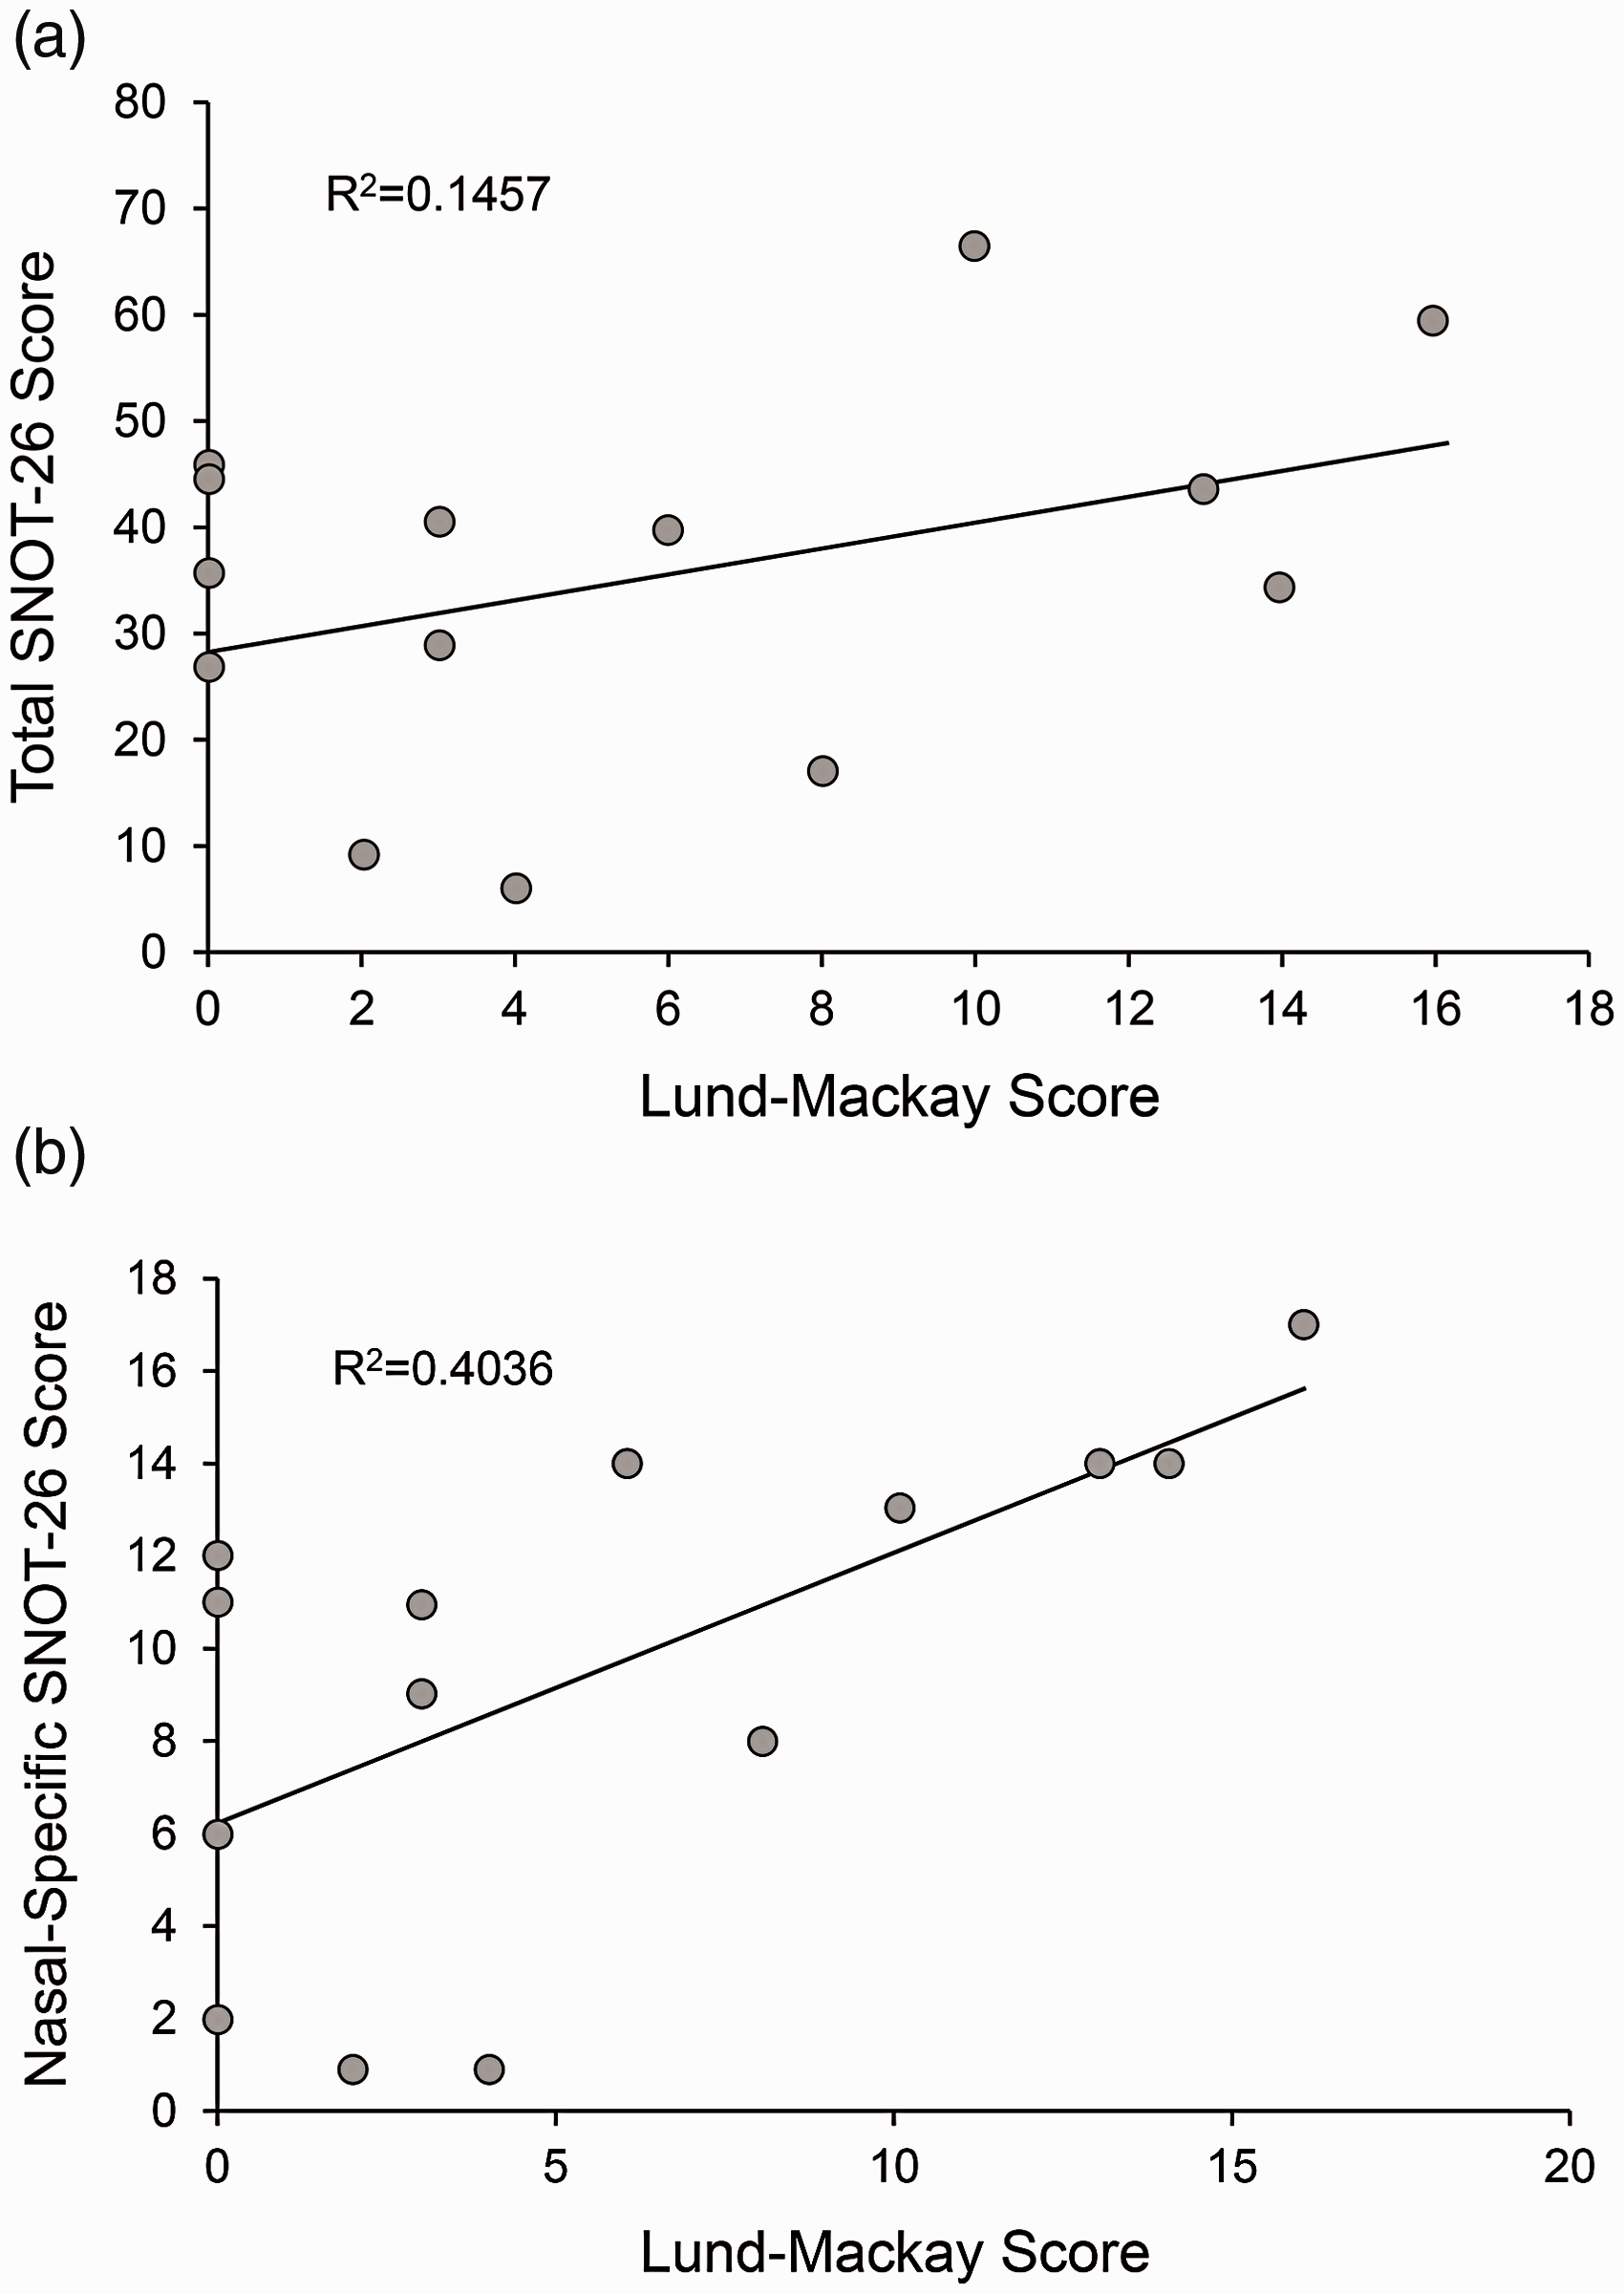
(a) CT Lund–Mackay score is associated with total SNOT-26 score. Increased opacification of the sinuses on the sinus CT is positively correlated with worse overall symptoms, as measured by the SNOT-26 symptom survey. (b) CT Lund–Mackay score is associated with specific sinonasal symptoms. Increased opacification of the sinuses on the sinus CT is positively correlated with worse specific sinonasal symptoms, as measured by a subset of the SNOT-26 symptom survey. SNOT-26, Sinonasal Outcome Test (26 items).
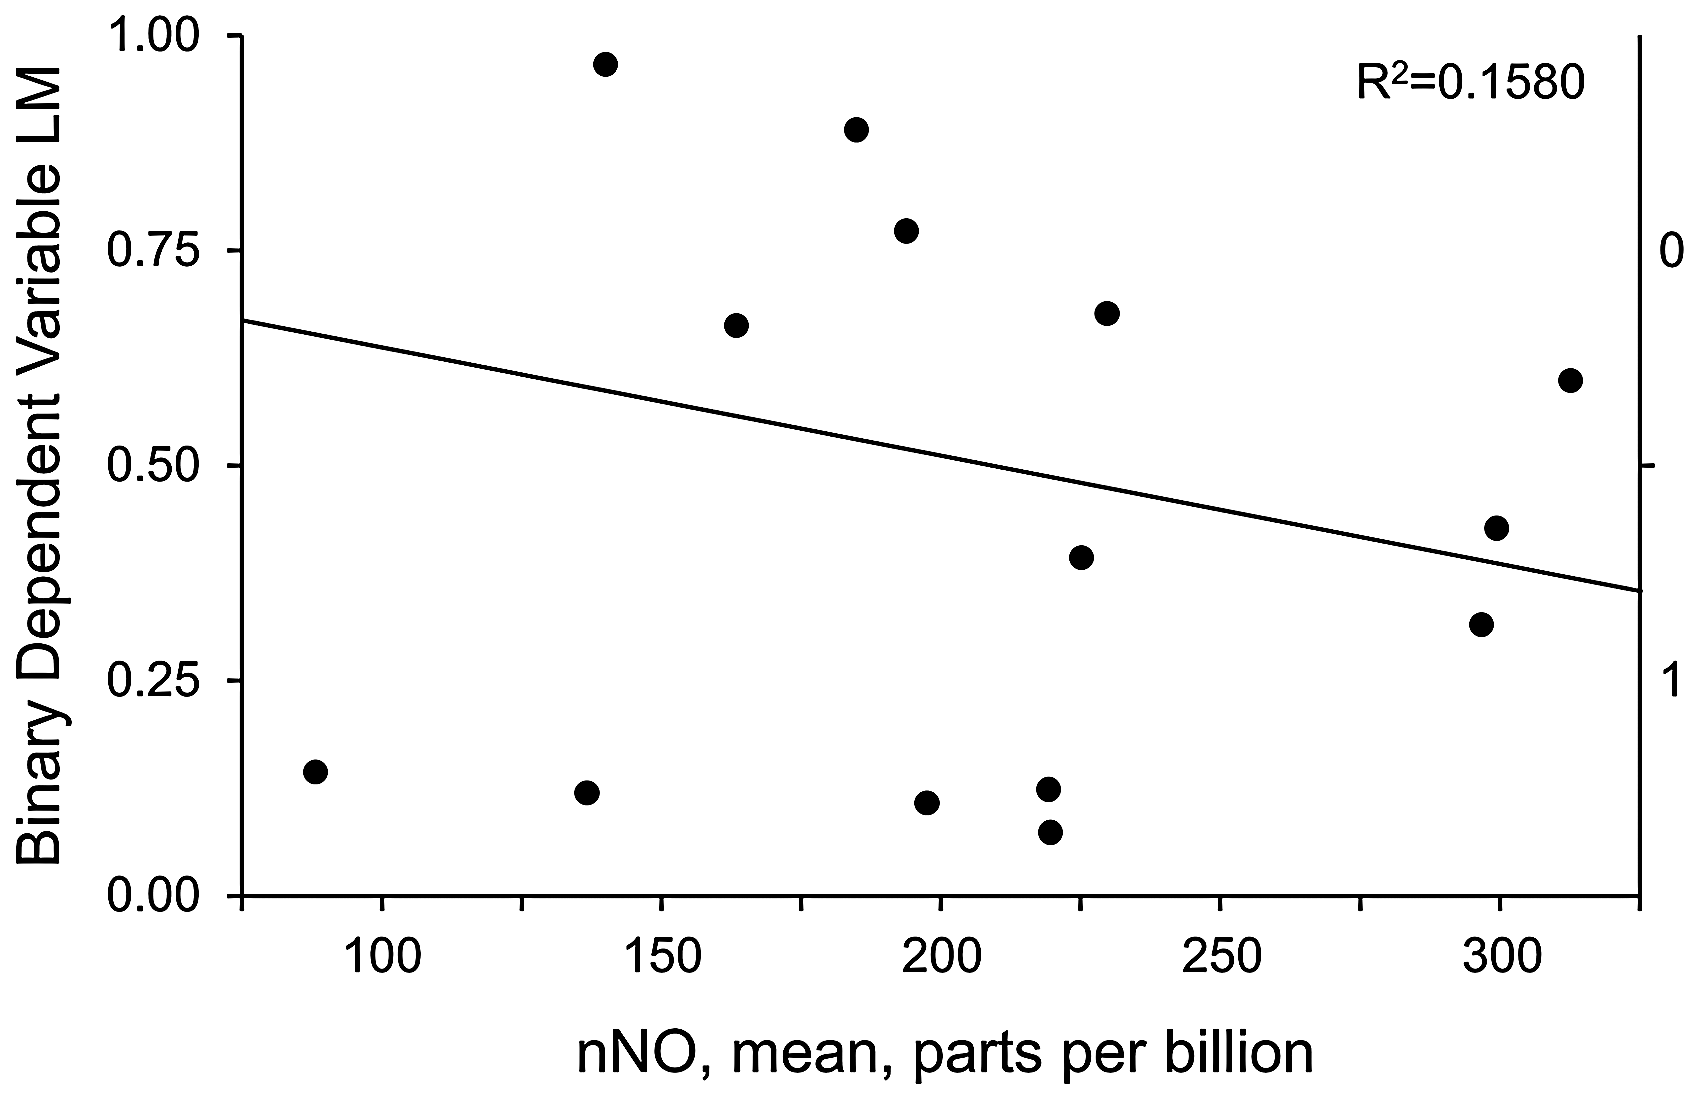
Decreased nNO is associated with increased CT LM score in nominal logistic fit (nNO) for binary dependent variable (LM). Opacification of the sinuses on the sinus CT is negatively correlated with exhaled nNO because of inflammation and obstruction of the sinuses. LM, Lund–Mackay; nNO, nasal nitric oxide.
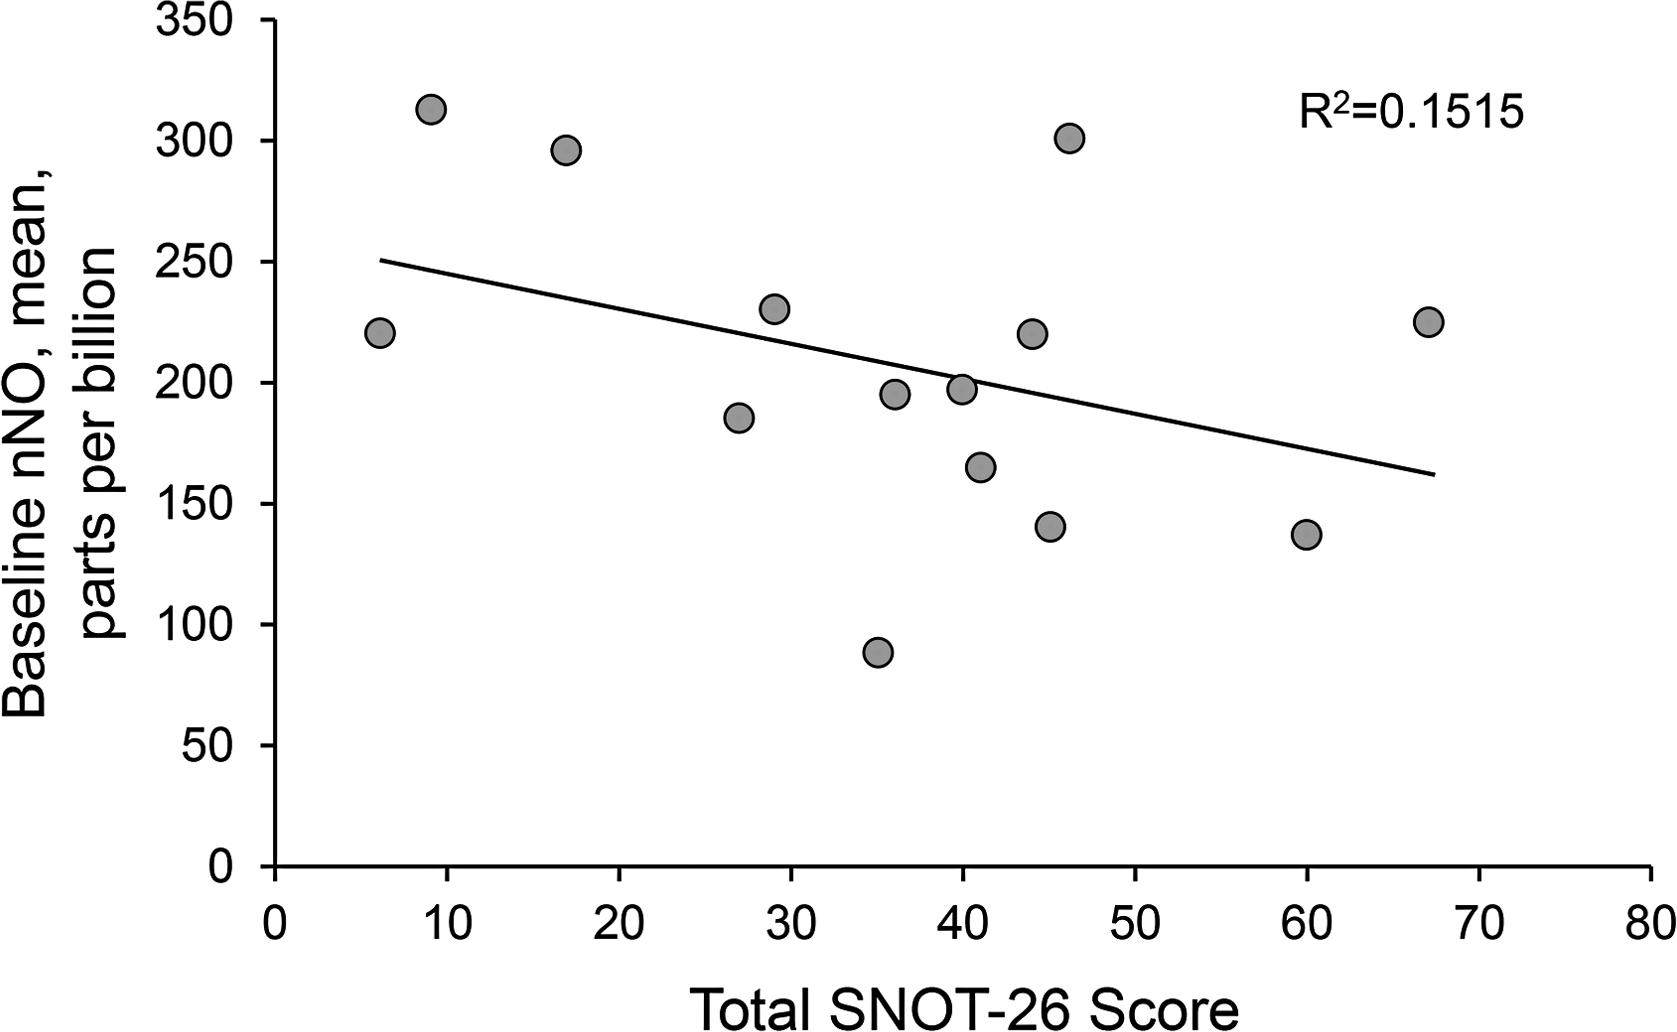
Decreased nNO is associated with increased total SNOT-26 symptom score. The total overall symptom score, as measured by the SNOT-26 symptom survey, is negatively correlated with exhaled nNO because of inflammation and obstruction of the sinuses. nNO, nasal nitric oxide; SNOT-26, Sinonasal Outcome Test (26 items).
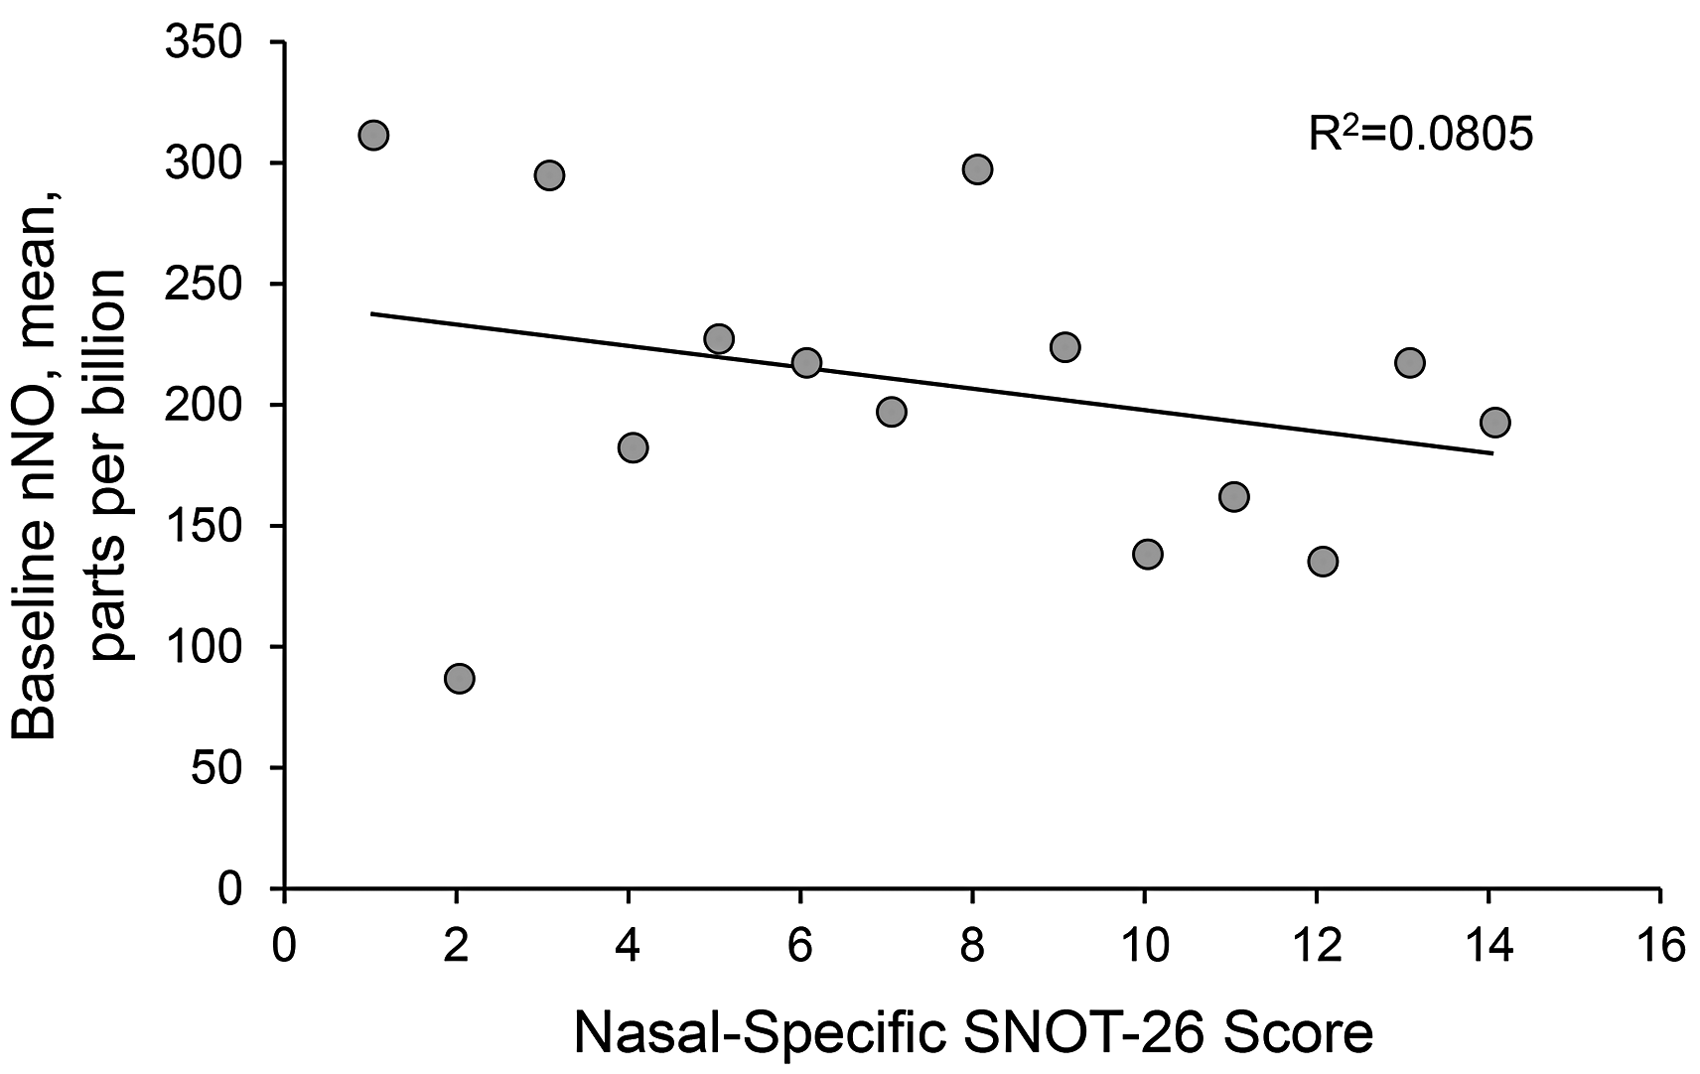
Decreased nNO is associated with increased sinonasal-specific symptom score. The total symptom score for the specific sinonasal symptoms on the SNOT-26 survey are negatively correlated with exhaled nNO because of inflammation and obstruction of the sinuses. nNO, nasal nitric oxide; SNOT-26, Sinonasal Outcome Test (26 items).
Association of nNO Levels With Lund–Mackay Score and SNOT-26 Scores. a
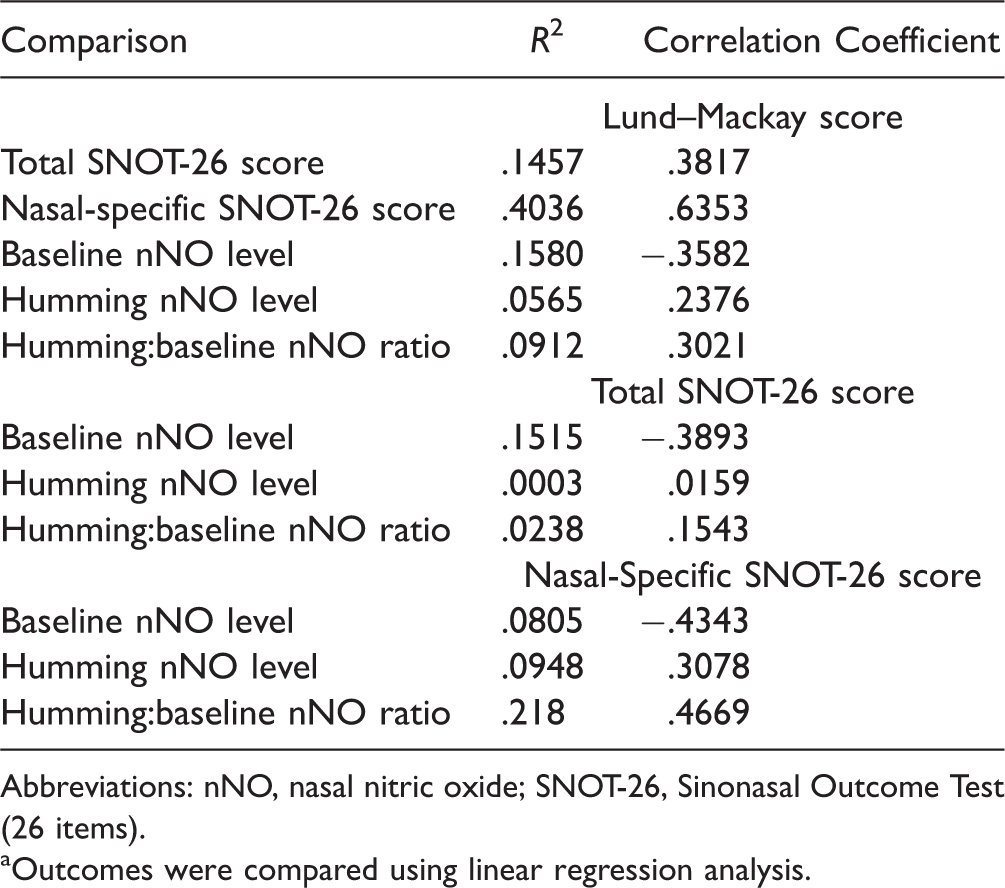
Abbreviations: nNO, nasal nitric oxide; SNOT-26, Sinonasal Outcome Test (26 items).
aOutcomes were compared using linear regression analysis.
Discussion
We hypothesized that nNO would be negatively correlated with opacification on the CT scan, as measured by the LM score, and negatively correlated with the total and nasal-specific SNOT-26 scores. In support of this hypothesis, we observed that baseline nNO was negatively correlated with the LM score and with the total and nasal-specific SNOT-26 scores. We also showed that the LM scores were positively correlated with total and nasal-specific SNOT-26 scores. However, contrary to our hypothesis, humming nNO and the ratio of baseline:humming nNO were positively correlated with LM scores and total and nasal-specific SNOT-26 scores. From these data, we conclude that the addition of the humming (dynamic) nNO measurement did not enhance the diagnostic usefulness of the baseline nNO. This lack of difference could potentially be due to the volumetric rendering of the sinus cavities because every subject’s baseline nNO volume capacity varies, depending on the size of the nasal cavity and paranasal sinus cavities.
In healthy persons, humming markedly increases nNO output through a mechanism that greatly depends on factors that modify sinus ventilation, with the size of the sinus ostia being most influential. 21 An evaluation of subjects with nasal polyposis and obstructed sinus ostia showed that nNO output did not increase while humming. 16 Maniscalco et al. 22 conducted a study of subjects with allergic rhinitis and showed that the lack of an nNO outflow peak during humming was associated with endoscopic findings of sinus ostial obstruction. Because the ostiomeatal complex tends to be obstructed in CRS and related inflammatory sinus diseases, we hypothesized that nNO would be similar (or marginally higher) in subjects with sinus disease compared with subjects who lacked symptoms of sinonasal pathology. However, only 7 of our subjects had sinus opacification (LM score >3), which may have affected our ability to detect changes in the ratio of humming:baseline nNO.
Baseline nNO was correlated with sinus inflammation on the CT scan and with SNOT-26 scores. This correlation supports the use of nNO as a clinical tool to predict sinus disease with greater specificity in patients with SNOT-26 outcome scores suggestive of disease, potentially aiding in the efficacy in screening for sinonasal opacification, in conjunction with the diagnostic reference standard of CT. 23 Subjects should undergo a careful evaluation of symptoms and a physical examination, and baseline nNO levels may be useful when screening patients with sinonasal symptoms for sinus obstruction. CT imaging may not be warranted in those with normal nNO levels; alternatively, a low nNO level that suggests sinus obstruction can help identify patients who may require either therapy for chronic sinusitis or CT imaging to confirm the diagnosis. Current practice guidelines in clinical rhinology suggest a need for more precise, individualized options to diagnose sinonasal opacification, and nNO may be a helpful, low-cost, point-of-care screening tool to detect sinus obstruction.24,25 A 2017 study 26 confirmed a distinction between CRS (with and without nasal polyposis) using nNO detection, demonstrating the potential utility of this simple point-of-care clinical tool in this patient population.
The low number of recruited subjects is a major limitation of this study; limitations in the availability the nNO measuring device precluded enrollment of more subjects. Although the low number of recruited subjects may have affected the correlations between sinus opacification, sinonasal symptoms, and baseline nNO measurements, this study potentially lays the groundwork for larger, randomized studies that can further elucidate this relationship. Addition of humming nNO measurements did not add to the diagnostic utility of this study. We propose that baseline (passive) nNO can be used as a clinical point-of-care test to screen for elevated sinus opacification before CT imaging. Randomized, prospective studies are warranted to further validate the use of nNO when assessing sinus inflammation and replicating the results reported in this preliminary study.
Conclusions
This study affirms our hypothesis that a functional, directional correlation exists between baseline nNO levels and total SNOT-26 scores, nasal-specific SNOT-26 scores, and LM CT scores, with lower nNO levels being associated with worse sinonasal symptoms and higher LM scores. The SNOT-26 survey potentially complements nNO levels in the diagnosis and management of patients suspected to have sinus opacification. Future directions could potentially include testing the clinical efficacy of combining these methods to increase the sensitivity of detecting radiographically significant sinus opacification. Measurement of nNO may be a useful and inexpensive point-of-care tool for screening prior to CT imaging.
Footnotes
Acknowledgment
The authors thank Shannon Daly, Clinical Research Coordinator, for her assistance in recruiting and enrolling subjects and collecting data.
Declaration of Conflicting Interests
The author(s) declared no potential conflicts of interest with respect to the research, authorship, and/or publication of this article.
Funding
The author(s) disclosed receipt of the following financial support for the research, authorship, and/or publication of this article: This research was supported by the Mayo Clinic Small Grants awards through the Department of Otorhinolaryngology and the Division of Pulmonary and Critical Care Medicine.