
Abstract
Background
Chronic rhinosinusitis (CRS) and allergic rhinitis (AR) may be associated with an increased risk of subsequent diagnosis of nasopharyngeal carcinoma (NPC) or paranasal sinus cancer (PSC) in elderly Americans. The clinical utility of this association remains uncertain.
Objective
To compare early computed tomography (CT) or nasal endoscopy (NE) with late diagnostic studies for the diagnosis of NPC or PSC in elderly Americans with CRS or AR.
Methods
The Surveillance, Epidemiology, and End Results (SEER)-Medicare database was queried from 2003 to 2011 and included 150 088 Medicare beneficiaries. Patients with a diagnosis of CRS or AR were examined for either NE or CT performed within 6 months of the exposure diagnosis. The risk of a cancer diagnosis was determined between the early and the late diagnostic groups.
Results
The relative risk of early cancer diagnosis with NE was 1.98 (95% confidence interval [CI], 1.60–2.43). The number needed to detect (NND) a case of cancer with NE was 503 (95% CI, 387–718). The relative risk of an early cancer diagnosis using CT was 3.40 (95% CI, 2.85–4.06) and NND was 221 (95% CI, 194–255). The stage of NPC or PSC for the late diagnostic group was not different from those with early NE (P = .458) or CT (P = .497). Overall survival was not different between diagnostic groups for NE (P = .789) or CT (P = .425).
Conclusions
Early NE or CT is associated with a higher likelihood of cancer diagnosis in elderly individuals with a diagnosis of CRS or AR. The clinical utility of this association is limited due to the low prevalence of these malignancies and lack of difference in disease stage and overall survival between diagnostic groups.
Keywords
Introduction
Chronic rhinosinusitis (CRS) and allergic rhinitis (AR) may be associated with an increased risk of a subsequent diagnosis of nasopharyngeal carcinoma (NPC) and paranasal sinus cancer (PSC) in elderly Americans as reported in 2 studies of the Surveillance, Epidemiology, and End Results (SEER)-Medicare linked database.1,2 CRS and AR have also been associated with NPC in large, population-based studies in Taiwain3–6 and confirmed in a meta-analysis of these studies. 7 Genetic susceptibility, dietary exposure, and Epstein Barr Virus infection are well-known etiologic factors in the development of NPC, particularly in Asia. 8 The multifactorial etiology of NPC has been demonstrated by Asian emigrants who continue to have an increased incidence of NPC, although decreased compared to their native populations. 9 Occupational exposure has been described as an etiologic factor in the development of PSC and is related to the specific histopathology. Sinonasal adenocarcinoma is associated with exposure to wood and leather dusts, while squamous cell carcinoma (SCC) has been linked to nickel, arsenic, and welding fume exposure. 10 Human papilloma virus may also be a causative factor in the development of sinonasal SCC. 11 Tobacco exposure and alcohol consumption are also potential etiologic factors in both NPC and PSC. The studies examining an association of CRS and AR with NPC and PSC are limited by many potential confounders, including the previously mentioned known etiologic factors, and cannot imply causality.
Screening for head and neck cancer has been recognized as having the potential for improving disease detection and treatment,12–16 although no national programs or guidelines have been established in the United States.12,17 Furthermore, the role of endoscopy or imaging, such as computed tomography (CT), has not been evaluated as screening modalities for head and neck cancer in patients without a previous cancer diagnosis. Imaging and endoscopy guidelines have been developed for other forms of cancer, including recommendations for mammography in breast cancer screening 18 and colonoscopy for colon cancer screening. 19 Head and neck cancer accounted for 3.3% of all new cancer diagnoses in the United States in 2014, 20 and this relatively low incidence has likely hindered the development of imaging and endoscopy guidelines. Establishing a diagnostic paradigm in patients at risk for sinonasal malignancy has been poorly defined as well. 21
The association of CRS and AR with subsequent diagnosis of NPC and PSC in elderly Americans may have diagnostic utility for clinicians, due to the epidemiological nature of the association. The SEER-Medicare linked database was used to establish the increased risk of NPC and PSC diagnoses among Medicare beneficiaries with a previous diagnosis of CRS or AR.1,2 The SEER-Medicare database also contains occurrences of interventions and diagnostic tests performed according to the Current Procedural Terminology, 4th edition (CPT-4) codes. 22 The purpose of this study was to determine if early CT or nasal endoscopy (NE) was associated with an early diagnosis of NPC or PSC. Secondary outcomes were to compare disease extent and overall survival between the early and late diagnostic groups according to staging and mortality data available in the SEER database.
Methods
Study Population and Design
The study population was determined from the SEER-Medicare linked database maintained by the National Cancer Institute and the Center for Medicare and Medicaid Services. The SEER database is comprised of 18 cancer registries and includes 28% of the United States population.23,24 Demographics, incidence, and first treatment course for all primary malignancies diagnosed in SEER registries since 1973 are included in the data set. 23 Information on comorbid disease, preceding interventions, and subsequent treatment is not contained in the SEER database. Medicare is the primary insurer for 97% of United States citizens over 65 years of age and includes hospital, surgical, physician, and outpatient services. 23 The linked SEER-Medicare database contains 100% of Medicare claims for cancer patients in the SEER database as well as a subcohort of noncancer cases derived from a 5% random sample of all Medicare beneficiaries residing in the SEER areas.23,25 The entire source population of the study represents approximately 3 million Americans over 65 years of age residing in SEER regions.
The study was performed in a case-cohort design 26 to maximally use the data available in the SEER-Medicare database from 2003 to 2011. The case-cohort design weights noncancer cases 20 times, as these are derived from a 5% random sampling of the entire source population. Cancer cases are not weighted because all occurrences of cancer within the source population are included in the database. Therefore, the available data in the SEER-Medicare database can be used to characterize the entire source population. This study design also allows for determination of clinically relevant statistics such as relative risk (RR) and number needed to diagnose (NND). The SEER-Medicare Database was obtained following an application to the National Cancer Institute, and the study was approved by the Institutional Review Board of the Ochsner Clinic Foundation.
Exposures, Outcomes, and Interventions
CRS and AR were considered exposures and were defined using the relevant International Classification of Diseases, 9th Revision, Clinical Modification (ICD-9-CM) diagnosis codes. CRS was identified by ICD-9-CM diagnosis codes 473.0–473.3, 473.8, and 473.9, while AR was identified by ICD-9-CM diagnosis codes 477.0–477.2, 477.8, and 477.9 obtained from both inpatient and outpatient Medicare claims. The cancers of interest were identified using International Classification of Diseases for Oncology, 3rd Edition (ICD-O-3) topology and morphology codes. Patients with morphology codes 8000-8576 and 8940-8941 and topology codes C11.0-C11.9 were categorized to NPC, and those with topology codes C30.0–C30.1 and C31.0–C31.9 were categorized to PSC. ICD-O-3 codes are entered into the SEER registry according to procedures outlined in the SEER Program Coding and Staging Manual, and often reflect histologic diagnoses, although may be entered solely on the basis of clinical diagnosis in rare cases.
Diagnostic interventions were determined according to the relevant CPT-4 codes. For CT, this included CPT-4 codes 70486, 70487, and 76380, while NE was defined as CPT-4 codes 31231, 31575, and 92511. The early diagnostic group included patients with a CT or NE occurrence within 6 months of the exposure diagnosis code (either CRS or AR). Furthermore, to be considered a successful test, the cancer diagnosis was required to be within 6 months of the diagnostic intervention (CT or NE). The early diagnostic group consisted of all patients who had a CT or NE performed within 6 months of CRS or AR diagnosis. When the cancer diagnosis was made more than 6 months after CT or NE, these patients were considered false negatives and not counted as cancer cases. The late diagnostic group consisted of patients for which CT or NE was not performed, or when the examination was more than 6 months after the diagnosis of CRS or AR. A schematic diagram of the early and late diagnostic groupings is shown in Figure 1. Categorization into “early” and “late” groups is relative to the diagnostic test and does not imply tumor stage in cases of cancer.
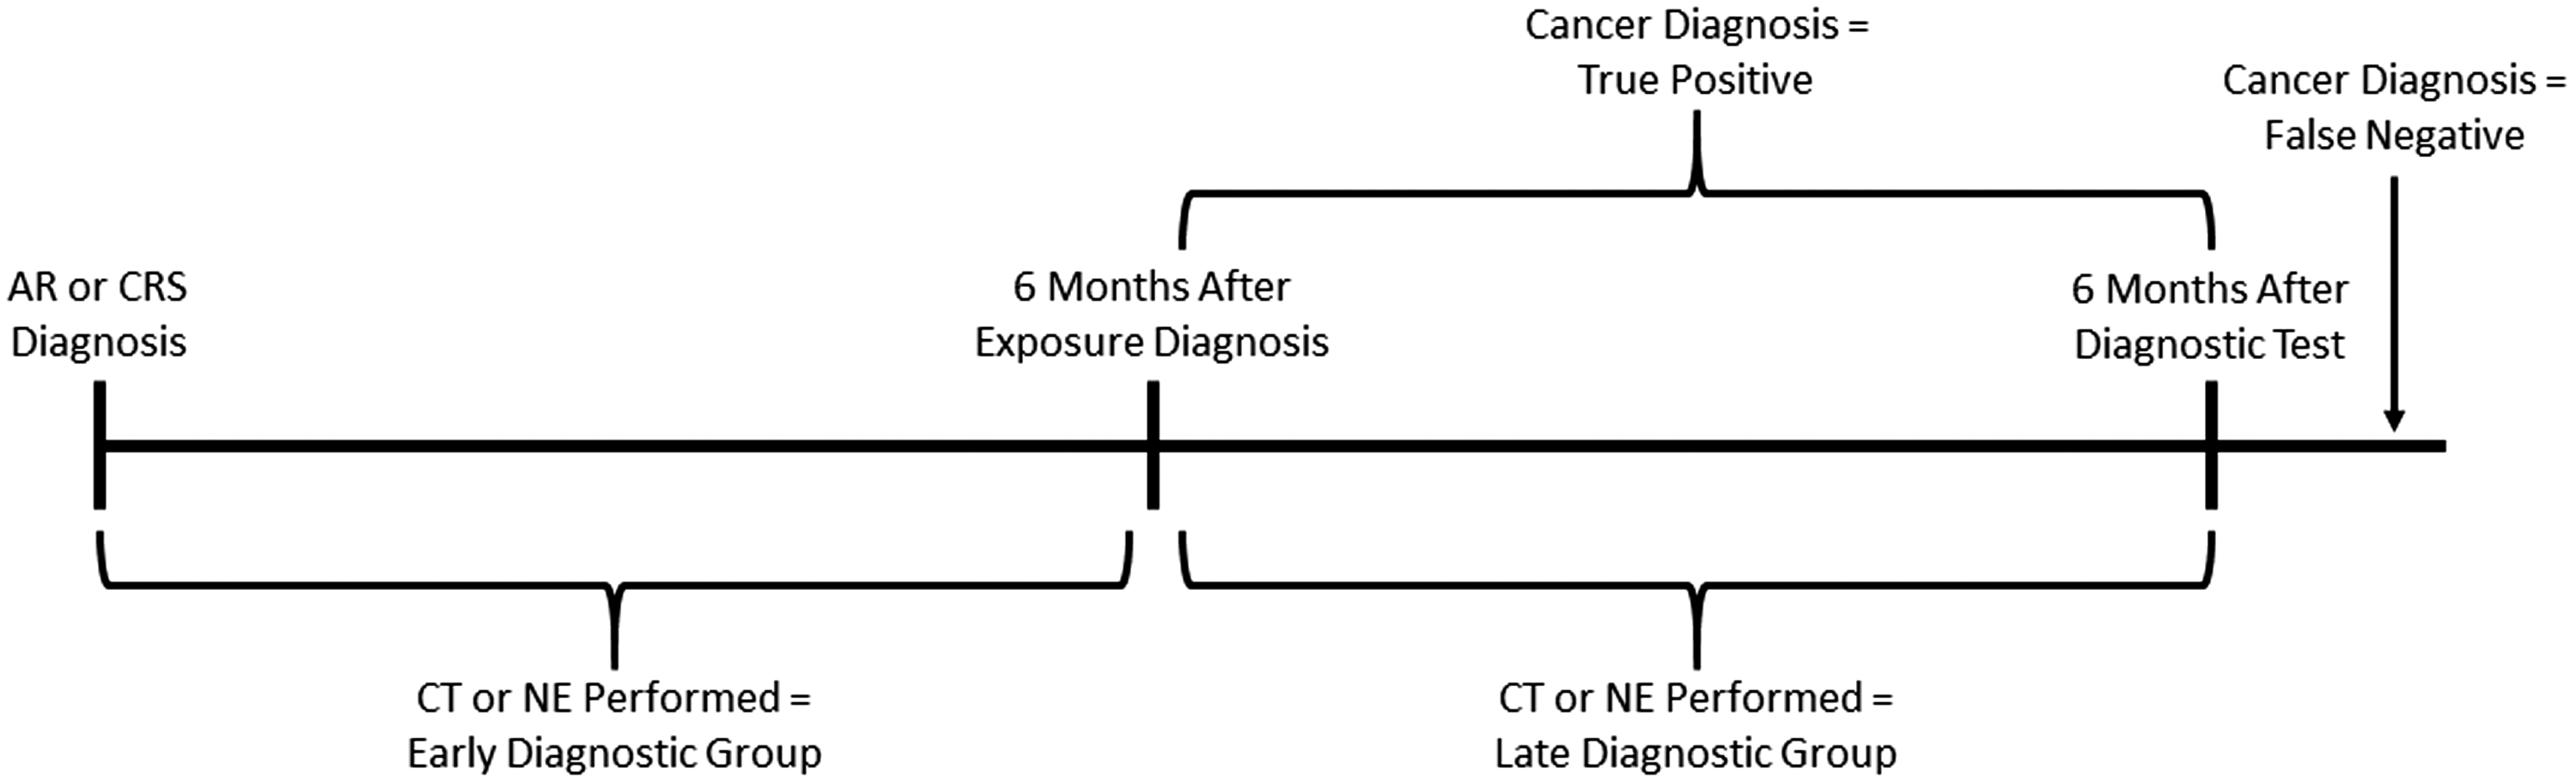
Schematic diagram of patient assignment to early and late diagnostic groups. AR, allergic rhinitis; CRS, chronic rhinosinusitis; CT, computed tomography; NE, nasal endoscopy.
A secondary outcome measure was to determine the disease extent of cancer cases in both the early and the late diagnostic populations. Complete staging data according to the American Joint Committee on Cancer guidelines was not available in the SEER-Medicare database for all years included in this study. Disease extent was instead determined according to the SEER Summary Stage 2000 (SS2000) codes that were used to categorize the cancer as local, regional, metastatic, or unknown. Kaplan–Meier survival curves were also determined for the early versus late patients in the CT and NE groups.
Statistical Analyses
Demographic characteristics of the exposed versus nonexposed and the early versus late diagnostic groups were compared using χ2 tests and 2 sample independent t tests. The demographic parameters that were considered included age, gender, race, and residence in an urban or rural area. Patients were followed until they developed a cancer of interest, migrated out of a SEER region, discontinued Medicare coverage, died, or survived through the study end date of December 31, 2012.
The risk of being diagnosed with NPC or PSC following a diagnosis of CRS or AR was assessed by the RR. The exposure was required to precede the cancer diagnosis, but no specific time interval between the 2 diagnoses was required. The NND was calculated from the inverse of the attributable risk. The NND is used to contextualize the RR due to the low prevalence of NPC and PSC. The disease extent in cancer cases from the early diagnostic population was compared to cancer cases in the late population using χ2 test. Survival analysis was performed using Kaplan–Meier curves. In addition, 95% confidence intervals (CIs) were calculated for all reported RR and NND, while P values were calculated for χ2 and t tests.
Results
The study included 148 079 control patients from the 5% subcohort and 2009 cases of NPC or PSC, for a total of 150 088 individuals. Weighting of control patients results in a source population of approximately 3 million Medicare beneficiaries. The prevalence of AR in the control population was 10.3%, while the prevalence of CRS was 3.5%. Among cancer cases (either NPC or PSC), the prevalence of AR and CRS was 25.7% and 20.6%, respectively. Patients with CRS or AR exposures were more likely to be female (P < .001) and have race reported as “other” (P < .001). Exposed patients were also more likely to be from rural areas (P = .002). The patients receiving either early NE or CT were more likely to be male (P < .001) and white (P < .001). Patients receiving early NE were more likely to be from urban areas (P < .001), while regional differences were not statistically significant for early CT (P = .069). In rural regions, early CT was more common than early NE (P = .007). The demographic characteristics of the study populations are summarized in Table 1.
Demographic Characteristics of Study Population.
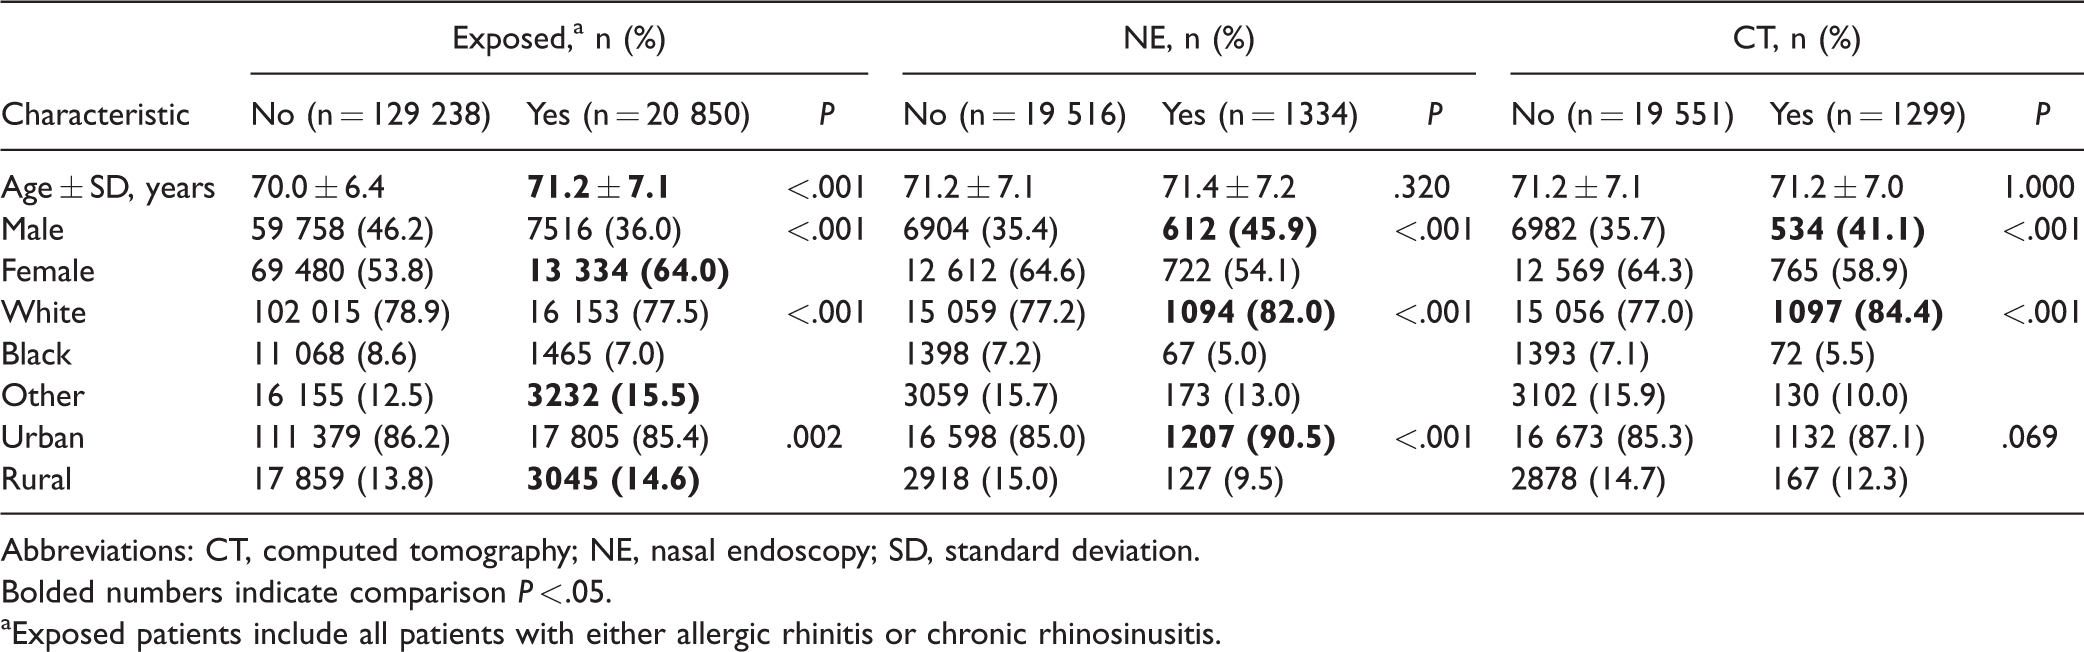
Abbreviations: CT, computed tomography; NE, nasal endoscopy; SD, standard deviation.
Bolded numbers indicate comparison P < .05.
Exposed patients include all patients with either allergic rhinitis or chronic rhinosinusitis.
Within the entire source population the prevalence of NPC and PSC were 0.026% and 0.042%, respectively. The RR of NPC or PSC diagnosis following a diagnosis of AR or CRS was 5.38 (95% CI, 4.93–5.87). Among patients with CRS or AR exposure, 6.2% met the criteria for early NE and 5.8% met criteria for early CT. The RR of achieving a diagnosis of NPC or PSC after early NE was 1.98 (95% CI, 1.60–2.43). The attributable risk of cancer diagnosis after early NE was 0.20% and results in a NND of 503 (95% CI, 387–718). For early CT, the RR of a cancer diagnosis was 3.40 (95% CI, 2.85–4.06). The attributable risk was 0.45%, resulting in a NND of 221 (95% CI, 194–255). The RR was also calculated considering only CRS or AR as an exposure and only NPC or PSC as an outcome (Table 2).
Risk of Cancer Diagnosis According to Exposure and Screening Intervention.
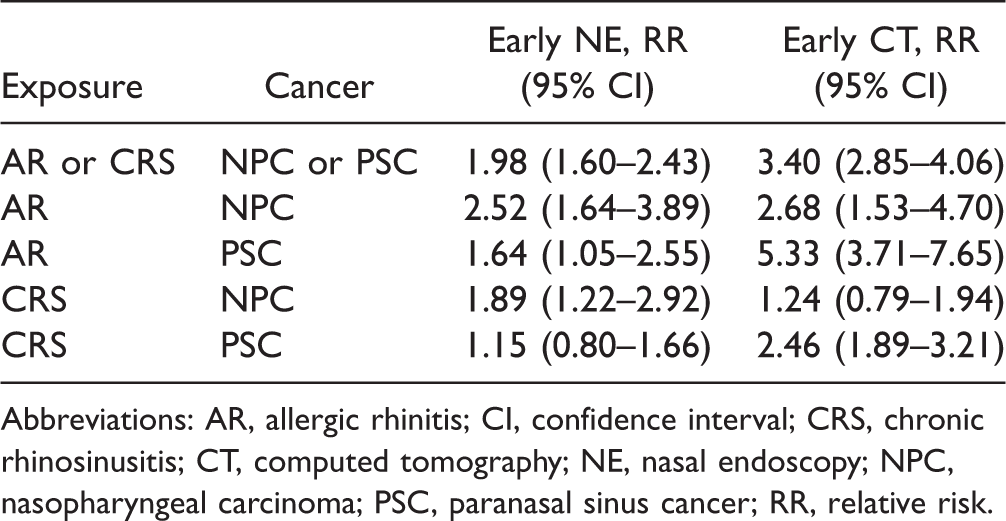
Abbreviations: AR, allergic rhinitis; CI, confidence interval; CRS, chronic rhinosinusitis; CT, computed tomography; NE, nasal endoscopy; NPC, nasopharyngeal carcinoma; PSC, paranasal sinus cancer; RR, relative risk.
The disease extent in patients receiving either early NE or CT was tabulated in comparison to patients receiving late diagnostic intervention (Table 3). Cancer cases were categorized into local, regional, metastatic, or unknown groups according to SS2000 codes available in the SEER database. There were no statistical differences in disease extent using these categories in patients with early NE (P = .458) or CT (P = .497). Furthermore, Kaplan–Meier curves did not reveal statistically different overall survival for the patients receiving early versus late CT (Figure 2, P = .425) or NE groups (Figure 3, P = .789).
Disease Extent According to Patients Screened by NE or CT.
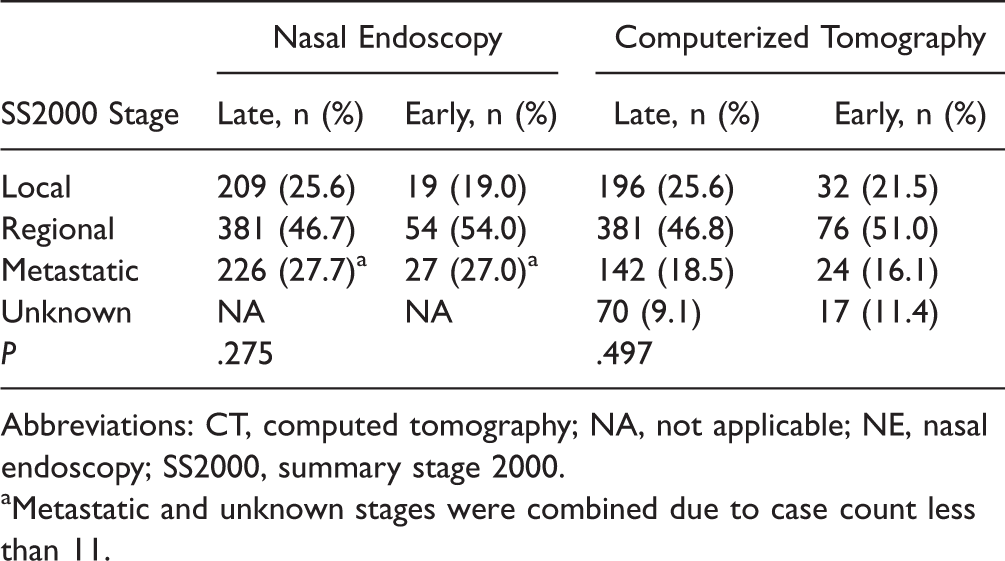
Abbreviations: CT, computed tomography; NA, not applicable; NE, nasal endoscopy; SS2000, summary stage 2000.
Metastatic and unknown stages were combined due to case count less than 11.
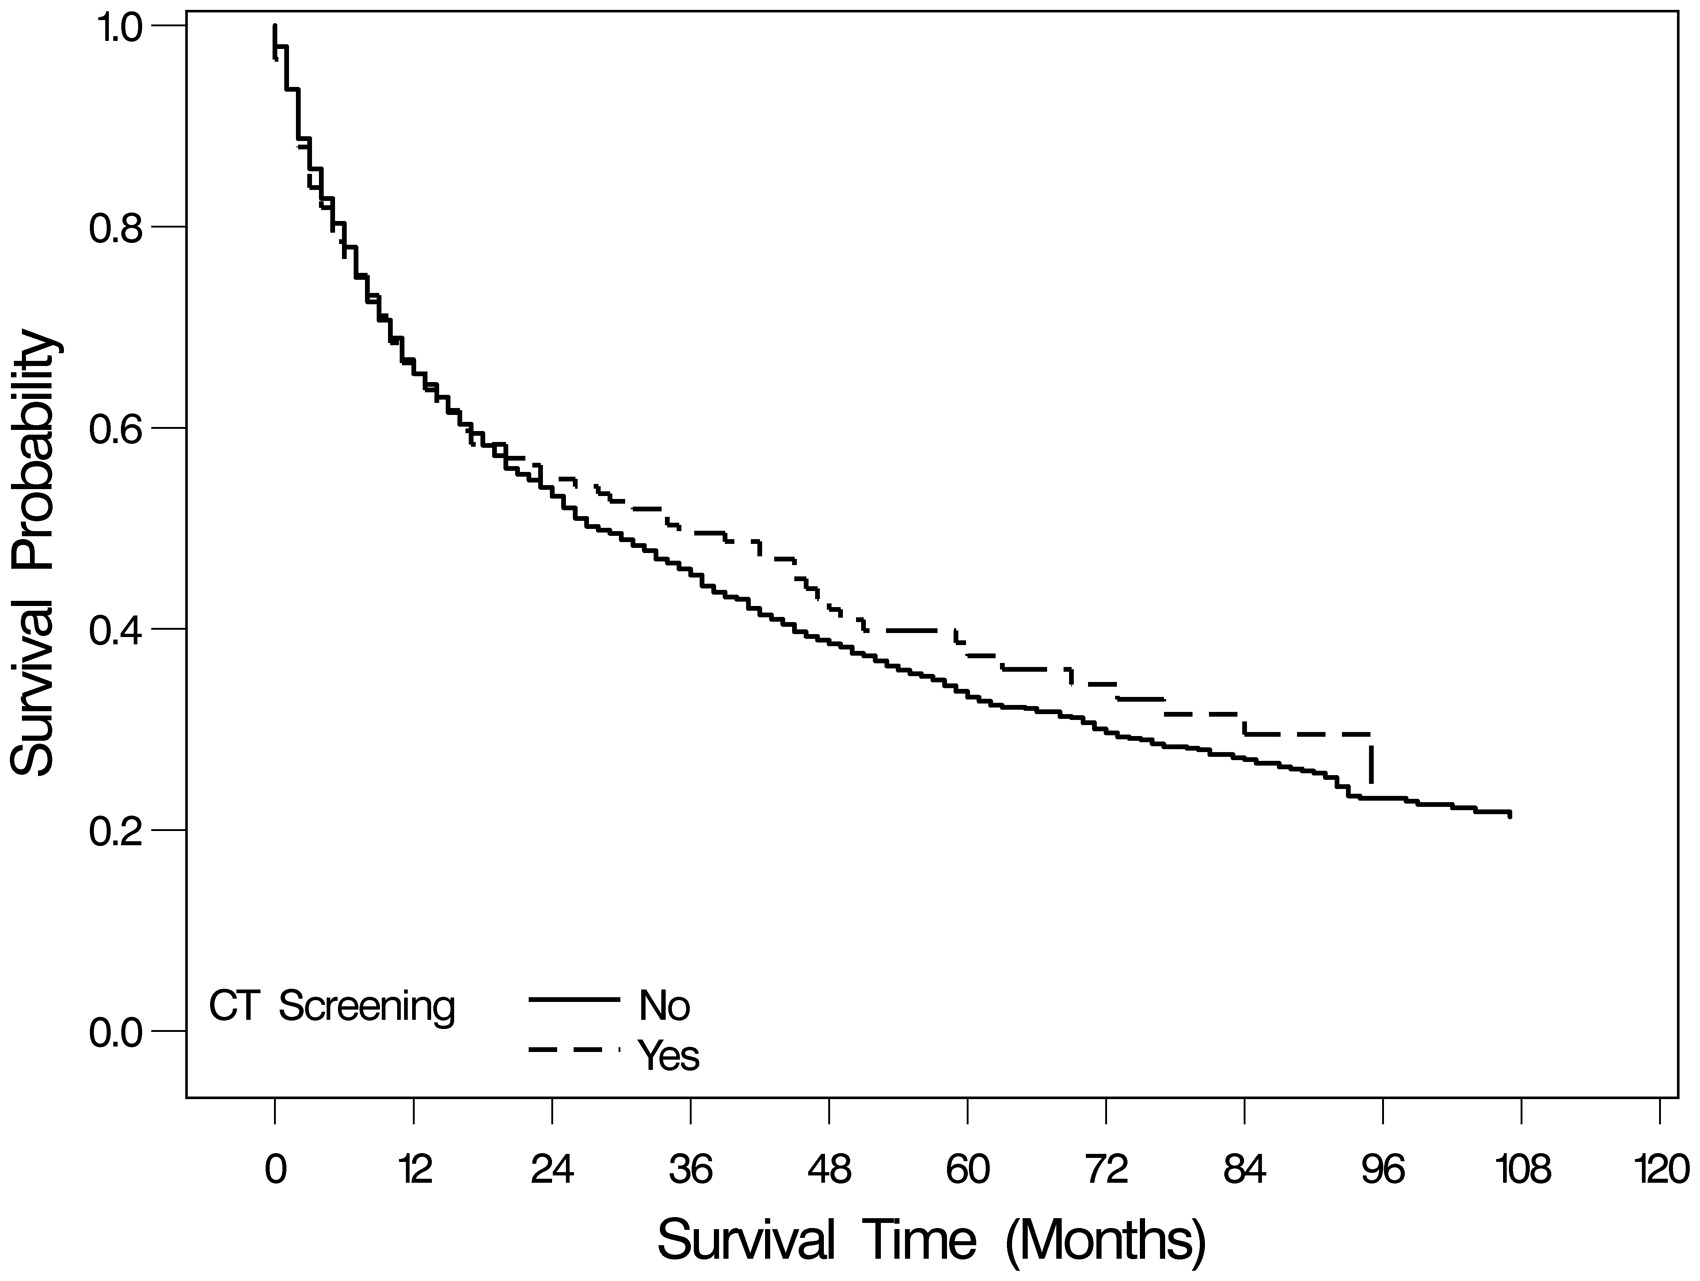
Kaplan–Meier survival curves for early diagnostic group compared to late diagnostic group for CT. CT, computed tomography.
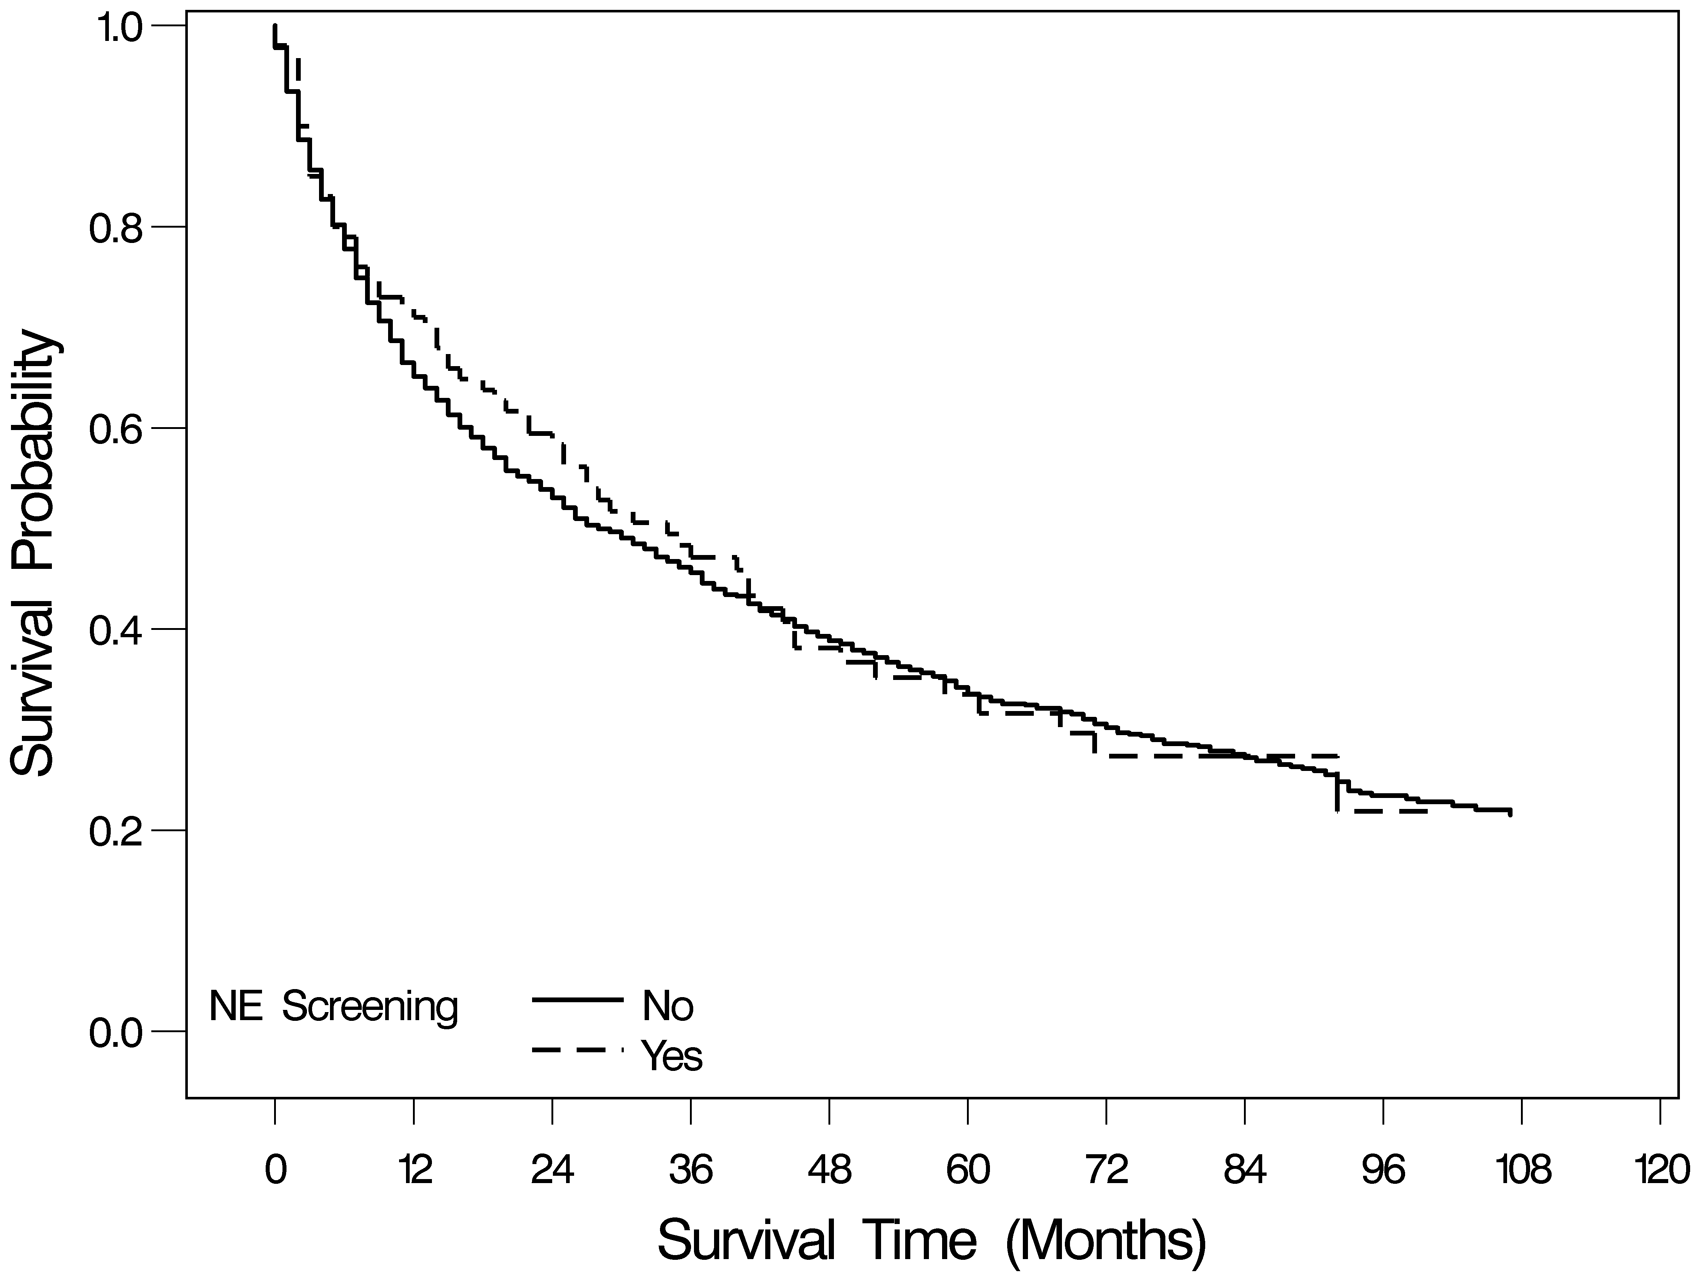
Kaplan–Meier survival curves for early diagnostic group compared to late diagnostic group for NE. NE, nasal endoscopy.
Discussion
Recently, CRS and AR have been identified as potential risk factors for the subsequent diagnosis of NPC and PSC.1–7 In the United States, this association exists in individuals older than 65 years.1,2 NPC and PSC are known to have multiple environmental exposures contributing to the etiology of these cancers,8–11 although the current data associating CRS and AR with NPC and PSC are limited by multiple confounders. CRS and AR may appear to be associated with NPC and PSC through a combination of surveillance bias, reverse causation, and misdiagnosis. 2 Separately, head and neck cancer screening has been studied as a means for early detection and improved treatment,12–16 but no national programs or guidelines have been established in the United States.12,17 This study finds that early NE or CT are associated with a higher rate of cancer diagnosis in a population that may be at risk for NPC or PSC, although secondary analysis of cancer stage and overall mortality make the clinical utility of this association questionable.
Subgroup analysis according to the specific diagnostic intervention (NE or CT) and cancer outcome (NPC or PSC) was performed. Interestingly, NE appears to be better suited to the detection of NPC, while CT was more effective for identifying PSC. The detection of PSC by NE in patients with CRS was not statistically significant, and in AR patients, the RR was 1.64 (95% CI, 1.05–2.55). CT as a diagnostic modality for NPC in patients with CRS was not statistically significant, while in AR patients, the RR was 2.68 (1.53–4.70). Overall, when both exposures and outcomes were considered, early CT was more likely to result in cancer diagnosis than NE. The NND for NE was nearly double that for CT. NE, however, can be performed concurrently with the physical examination in the clinical setting and may also be less expensive. The reported fair price for NE was $322, compared to CT without contrast fair price of $410.27,28
This study remains agnostic on a potential causative relationship between CRS or AR and NPC or PSC. Instead, we sought to determine if relatively common exposures (13.5% combined prevalence of CRS or AR in the source population) can be used for diagnostic advantage in the detection of more ominous disease. In this regard, CRS and AR are not specific biological exposures, but rather represent a symptom complex in the clinical setting. It is possible that the symptoms being reported as CRS or AR represent early NPC or PSC, and, in fact the purpose of this study is to determine if this bias can be exploited by early diagnostic intervention. RR analysis and quantification of the number of patients that would be necessary to achieve a cancer diagnosis in this population are consistent with a statistical advantage in the early diagnostic group. Comparison of disease stage and overall mortality, however, are not different between the early and late diagnostic groups. The clinical utility of this statistical difference in RR is therefore doubtful. Furthermore, there are likely many unaccounted factors that contributed to the clinical decision for early CT or NE, which further confound this statistical significance.
Additional limitations of the current study were also identified. The validity of ICD-9 codes entered for CRS and AR are difficult to substantiate and are unlikely to reflect the strict criteria for these conditions to some extent. Also a history of CRS or AR prior to entry into the Medicare program cannot be confirmed. Nevertheless, there has been recognition that certain populations are at risk for head and neck cancer, 16 despite the absence of national screening guidelines.12,17 This absence is most likely related to the relatively low prevalence of head and neck cancers, with the combined prevalence of NPC and PSC in this study of 0.068%. Such low prevalence requires extremely large populations in order to detect differences in RR, which are prohibitive for prospective screening trials. Furthermore, when considering disease of low prevalence, there is substantial question as to whether statistically significant risk is of clinical value and cannot be completely evaluated in this study due to the inherent limitations of retrospective registry data. Screening trials would more accurately determine mortality reduction, disease-free survival, and cost effectiveness, although the retrospective analysis performed in this study makes it unclear if such trials would produce clinically useful results.
Conclusion
Early NE or CT in elderly Americans with CRS or AR is associated with a higher likelihood of subsequent cancer diagnosis within 6 months of the diagnostic test. The retrospective nature of the SEER-Medicare database and the low prevalence of NPC and PSC prohibit understanding whether these are useful screening tests. Disease stage and overall mortality were also not different between early and late diagnostic groups, which further questions the clinical utility of screening in this specific population.
Footnotes
Authors’ Note
This study was presented at the American Academy of Otolaryngology Annual Meeting, Chicago, Illinois, on September 12, 2017.
Declaration of Conflicting Interests
The author(s) declared no potential conflicts of interest with respect to the research, authorship, and/or publication of this article.
Funding
The author(s) received no financial support for the research, authorship, and/or publication of this article.