
Abstract
Background
Hyaluronan is one of the major extracellular matrixes in chronic rhinosinusitis (CRS) associated with tissue remodeling. Prostaglandin D2 (PGD2) is also associated with the pathogenesis of CRS. However, little is known about whether PGD2 regulates hyaluronan production by human airway fibroblasts.
Objective
We sought to determine the effect of PGD2 on the mRNA expression of three isoforms of membrane-bound hyaluronic acid synthase (HAS1, HAS2 and HAS3) in fibroblasts, the major source of hyaluronan production, derived from CRS patients.
Methods
Nasal polyp-derived fibroblasts (NPDF) and uncinate tissue-derived fibroblasts (UTDF) were established from CRS patients with nasal polyps and those without, respectively. These fibroblasts were stimulated with PGD2 or PGD2 receptor (DP/CRTH2)-selective agonists in the presence or absence of receptor-selective antagonists. mRNA levels for HAS1, HAS2 and HAS3 were determined by real-time quantitative PCR.
Results
PGD2 (1 µM) significantly enhanced HAS1 but not HAS2 or HAS3 mRNA expression by NPDF. Enhanced HAS1 mRNA expression was also obtained by stimulation with a DP receptor-selective agonist, but not with a CRTH2 receptor-selective agonist. In addition, PGD2-induced HAS1 mRNA expression was significantly inhibited by pre-treatment with DP receptor-selective antagonists. Similar induction of PGD2-induced HAS1 mRNA expression was seen in UTDF.
Conclusion
PGD2 selectively stimulates HAS1 mRNA expression in local fibroblasts in CRS via DP, but not CRTH2, receptors.
Introduction
Chronic rhinosinusitis (CRS), both with and without nasal polyps (CRSwNP and CRSsNP, respectively), is pathologically characterized by tissue remodeling such as changes to the tissue structure and deposition of extracellular matrix.1–3 To date, several factors are known to be directly or indirectly associated with this remodeling including matrix metalloproteinases, cytokines such as transforming growth factor (TGF)-β, prostaglandins (PGs) such as PGD2 and PGE2, growth factors such as vascular endothelial growth factor (VEGF) and molecules in the coagulation cascade such as tissue plasminogen activator and factor XIIIa.4–8
Hyaluronan (HA) is one of the major extracellular matrixes in nasal polyps (NP) associated with mucosal hyperplasia and edema.9,10 HA accounts for approximately 80% of uronic acids in human nasal secretions. 11 HA comprises the majority of glycosaminoglycans in NP. 12 HA is synthesized up to 10 MDa by the action of membrane-bound hyaluronic acid synthase (HAS). There are three known HAS isoforms: HAS1, HAS2 and HAS3. 13 High molecular weight HA is degraded through the action of hyaluronidases into low molecular weight HA.9,13 HA controls inflammation and angiogenesis via coupling to a variety of HA binding proteins such as CD44 and CD168. 13 In general, high molecular weight HA has anti-inflammatory properties such as promotion of suppressive effect of CD4+CD25+ regulatory T cells and allergen-specific immune tolerance.14–16 On the contrary, low molecular weight HA shows pro-inflammatory effects such as induction of inflammatory cytokines and maturation of dendritic cells.13,14 In addition, HA induces eosinophil maturation and survival via enhancement of granulocyte macrophage colony-stimulating factor (GM-CSF), TGF-β and intercellular adhesion molecule (ICAM)-1 expression.17,18
PGD2 is associated with the pathogenesis of CRS, especially CRSwNP.6,19 For example, we previously reported that the level of PGD2 in middle meatus secretion is significantly higher in CRSwNP compared with CRSsNP. 19 The mRNA level of hemopoietic-type PGD2 synthase in NP was also significantly and positively correlated with the degree of NP eosinophilia and the radiological severity of CRS. 6 To date, D-prostanoid (DP) and chemoattractant receptor-homologous molecule expressed on TH2 cells (CRTH2) are the two major receptors reported for PGD2. 20 We recently reported that PGD2 stimulates NP fibroblasts to produce VEGF, which is involved in angiogenesis and vascular permeability, via coupling to DP. 7
Fibroblasts are one of the major sources of HA production. 13 Although a recent report showed that PGD2 promotes HA biosynthesis by human orbital fibroblasts, little is known about whether PGD2 regulates HA production by human airway fibroblasts. 21 In the present study, we sought to determine the effect of PGD2 on the mRNA expression of the three HAS isoforms in fibroblasts derived from CRS patients.
Materials and Methods
Subjects
The study involved 25 Japanese patients with CRS, which was defined by diagnostic criteria reported in a European position paper on rhinosinusitis and NP. 22 Twelve and 13 patients were diagnosed with CRSwNP and CRSsNP, respectively, based on the presence or absence of NP. Patient characteristics are shown in Table 1. None of the participants received systemic glucocorticoids for at least 4 weeks prior to surgery, and none of the participants received pharmacotherapy for rhinosinusitis, such as macrolide antibiotics or intranasal steroids, for at least 2 weeks prior to surgery. Informed consent for participation in the study was obtained from each patient, and the study was approved by the Human Research Committee of Okayama University Graduate School of Medicine, Dentistry and Pharmaceutical Sciences (approval no. 1505-030).
Patients’ Characteristics.
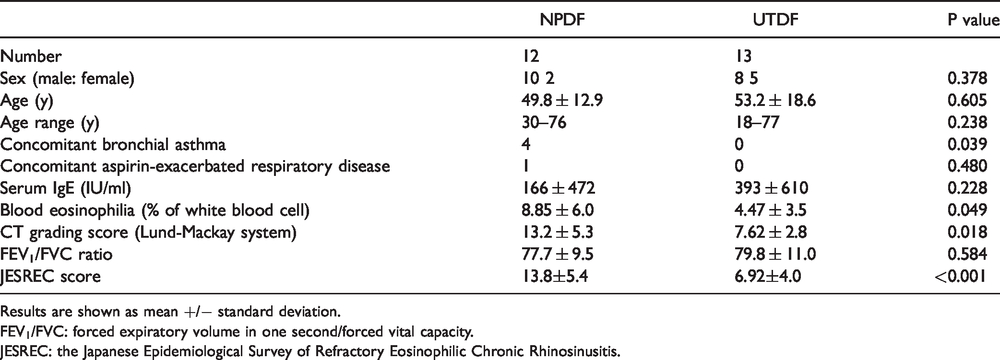
Results are shown as mean +/− standard deviation.
FEV1/FVC: forced expiratory volume in one second/forced vital capacity.
JESREC: the Japanese Epidemiological Survey of Refractory Eosinophilic Chronic Rhinosinusitis.
Generation of Nasal Tissue-Derived Fibroblasts
Nasal tissue-derived fibroblasts were generated as previously reported. 7 Briefly, NP and uncinate tissues (UT) were surgically excised from patients with CRSwNP and CRSsNP, respectively, and then dispersed by enzymatic digestion using protease, collagenase, hyaluronidase and DNase (Sigma, St. Louis, MO, USA). Dispersed cells were suspended with culture medium (RPMI 16,402 mM glutamine, 100 U/ml penicillin and 100 µg/ml streptomycin, Sigma) supplemented with 10% FCS (Sigma) in a culture dish (Sumitomo Bakelite Co. Ltd, Tokyo, Japan) and incubated at 37 °C and 5% CO2 for 10 days. Then, non-adherent cells were removed by changing the culture medium. After reaching confluence, NP-derived fibroblasts (NPDF) and UT-derived fibroblasts (UTDF) were harvested by treatment with 0.25% trypsin and 0.02% EDTA and seeded into new dishes. The cellularity of fibroblasts was characterized using immunohistochemistry; more than 95% of confluent cells were found to be vimentin-positive. Fibroblasts were used after 3 to 4 passages.
Cell Culture
Fibroblasts were seeded into 48-well culture plates (Asahi Techno Glass, Tokyo, Japan). When cells reached confluence, they were rested in culture medium containing 0.5% FCS for 4 days. In order to determine the effect of PGD2 on HAS mRNA expression, cells were stimulated with serial dilutions of PGD2 (0.1, 1.0 or 10 µM) (Cayman, Ann Arbor, MI, USA) or control buffer (0.005% DMSO) for 1, 3 and 6 h. Thereafter, cell pellets were soaked in RNAlater™ RNA stabilization reagent (Qiagen, Hilden, Germany) and stored at −30°C until use. To determine receptor specificity, 1.0 µM BW245C (Cayman) or DK-PGD2 (Cayman) or control buffer (0.05% DMSO) was added for 3 h. Alternatively, 1.0 µM of a DP receptor-selective antagonist (MK0524 or ONO-4053) or a CRTH2 receptor-selective antagonist (OC0000459) was added to fibroblasts treated with 1 µM PGD2. The degree of HAS1, HAS2 and HAS3 mRNA expression in non-stimulated (3-h culture without PGD2 or DMSO) in NPDF and UTDF was also examined.
Real-Time Quantitative PCR
Real-time quantitative PCR for analysis of HAS1, HAS2 and HAS3 mRNA levels in NPDF and UTDF was performed as described previously. 2 Primers for HAS determination were designed according to a previous report (HAS1: forward 5′-TGTGTATCCTGCATCAGCGGT-3′, reverse 5′-CTGGAGGTGTACTTGGTAGCATAACC-3′; HAS2: forward 5′-GCCTCATCTGTGGAGATGGT-3′, reverse 5′-ATGCACTGAACACACCCAAA-3′; HAS3: forward 5′-GGCATTATCAAGGCCACCTA-3′, reverse 5′-AGGCCAATGAAGTTCACCAC-3′). 21 The absolute copy number for each sample was calculated, and samples are reported as copy number relative to GAPDH mRNA, which was used as an internal control.
Release of HA in NPDF
NPDF (n = 6) were stimulated with 1.0 µM PGD2 or control buffer (0.025% DMSO) for 12 h. Thereafter, culture supernatants were collected and stored at −30°C until use. Concentration of HA were determined by ELISA kit which detects HA molecules that are as small as 6.4 kDa (Echelon Bioscience, Salt Lake City, UT, USA).
Statistical Analysis
Values are given as the median except for Table 1. The nonparametric Mann–Whitney U test and chi-square test were used to compare data between two groups, and the Wilcoxon signed-rank test was used to analyze data within each group. The Friedman test followed by Dunn’s test or two-way analysis of variance (ANOVA) followed by Dunnett’s test was used for multiple comparisons. Correlation analyses were performed using Spearman’s rank correlation. Statistical analyses were performed using GraphPad Prism version 9.2 (GraphPad software, Inc., La Jolla, CA, USA), with P < 0.05 considered to be significant.
Results
Effect of PGD2 on HAS mRNA Expression by NPDF
First, we conducted a preliminary study to determine whether PGD2 affects HAS1, HAS2 and HAS3 mRNA expression in NPDF (n = 4). A significant dose-phase interaction was observed in HAS1 (P = 0.009, ANOVA) but not HAS2 (P = 0.600) or HAS3 (P = 0.890) mRNA expression (Figure 1(A)–(C)). A significant increase in HAS1 mRNA expression was seen following 3-h stimulation with PGD2 at 0.1 (P = 0.010, Dunnett’s test), 1.0 (P < 0.001) and 10 (P < 0.001) µM, and the highest expression was seen at 1 µM. Thus, we used this culture condition for further investigation using 12 NPDF primary cultures. Compared with control treatment (0.005% DMSO), a clear increase in HAS1 mRNA expression was seen in response to PGD2 (median: 276.80-fold increase, P < 0.001, Wilcoxon-signed rank test, Figure 1(D)). Minimal decrease and increase in HAS2 (median: 0.59-fold decrease, P = 0.007, Figure 1(E)) and HAS3 (median: 1.28-fold increase, P = 0.007, Figure 1(F)), respectively, mRNA expression was also seen. In addition, a significant difference in PGD2-induced mRNA expression was seen among the three HAS isoforms (P < 0.001, Friedman test); HAS1 mRNA expression was significantly increased compared with HAS2 (P < 0.001, Dunn’s test) and HAS3 (P = 0.024) mRNA expression. In contrast, changes in HAS2 and HAS3 mRNA expression were not statistically different (P = 0.124, Figure 1(G)). 12-h stimulation with 1 µM PGD2 did not alter the release of HA as compred with control treatment (P > 0.999, Figure 1(H)).
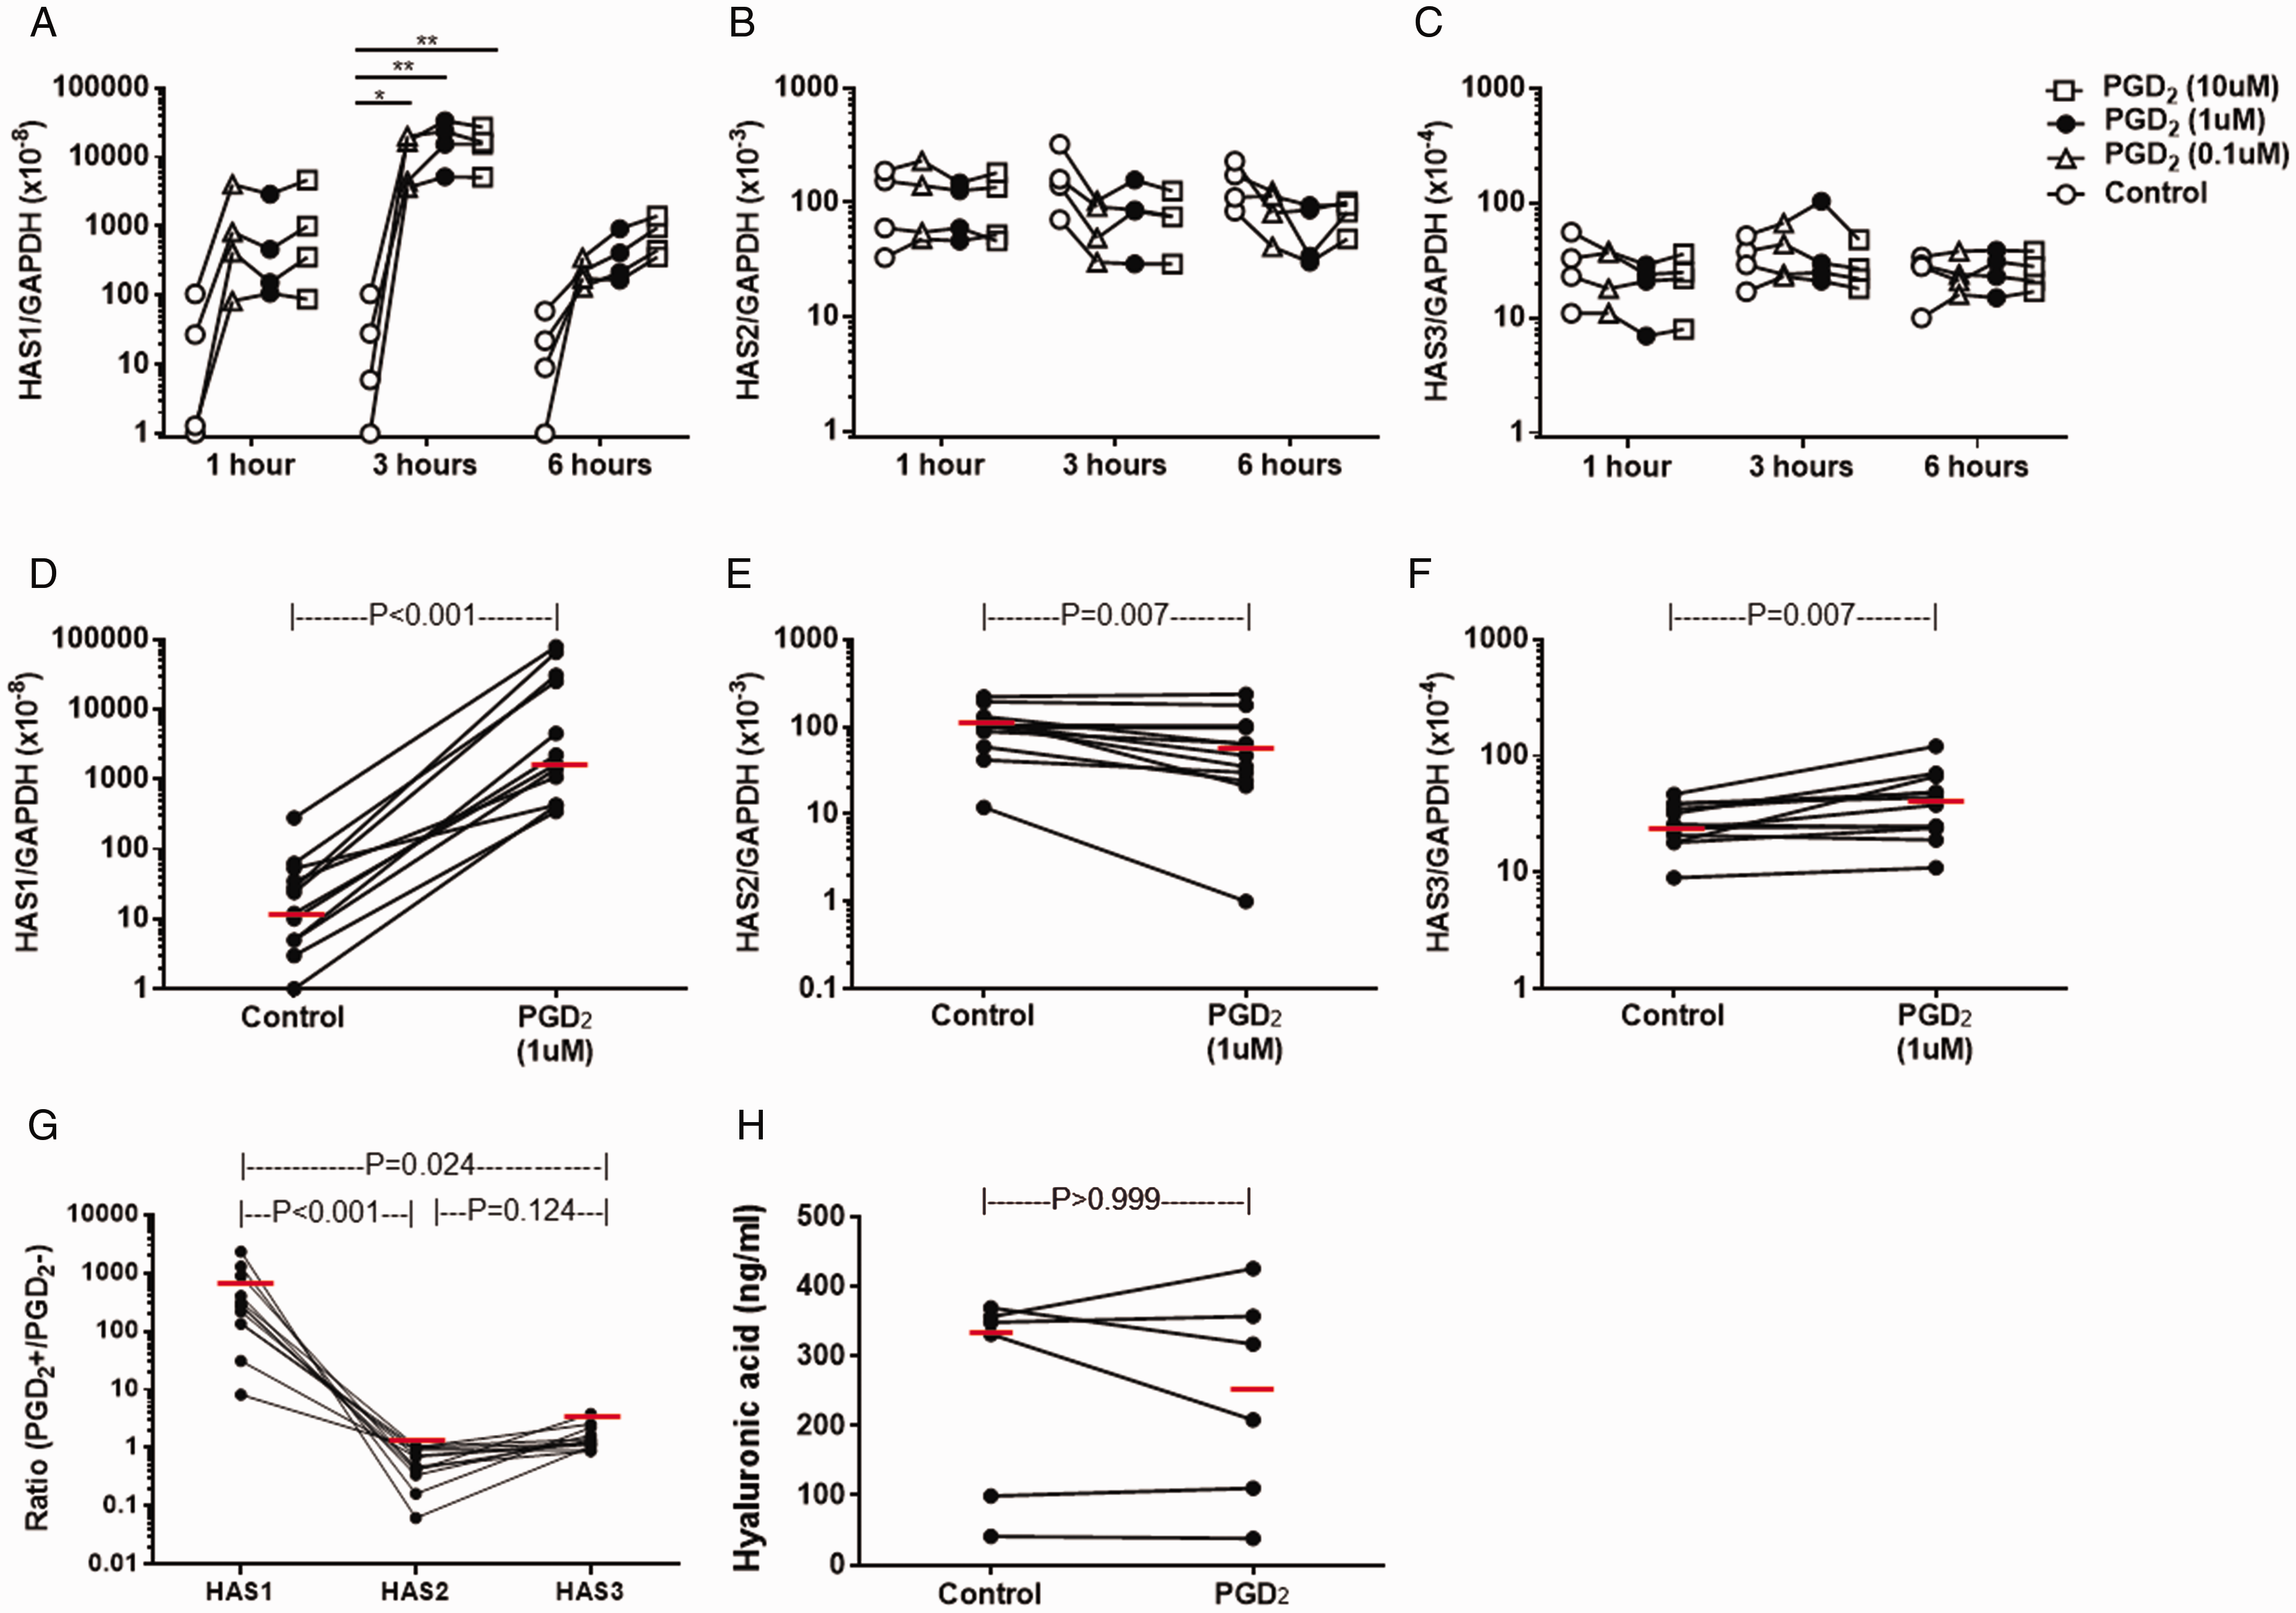
PGD2-induced HAS mRNA expression and HA release in NPDF. NPDF (n = 4) were stimulated with a serial concentration of PGD2 or control buffer (DMSO) for 1, 3 and 6 hours. Relative amounts of mRNA for HAS1 (A), HAS2 (B) and HAS3 (C) were determined (n = 4). P-values were determined using Dunn test. NPDF (n = 12) were stimulated with 1 µM PGD2 or control buffer for 3 hours. Relative amounts of mRNA for HAS1 (D), HAS2 (E) and HAS3 (F) were determined. G, Comparison of PGD2-indued mRNA expression ratio of HAS1, HAS2 and HAS3. H, Effect of PGD2 on HA release in NPDF. P-values were determined using Wilcoxon signed rank test.
Effect of PGD2 Receptor-Selective Agonists on HAS mRNA Expression by NPDF
To evaluate the receptor specificity of PGD2 stimulation on HAS mRNA expression, we stimulated NPDF with PGD2 receptor-selective agonists. A significant difference was observed in response to PGD2 receptor-selective agonists in HAS1 (P < 0.001, Friedman test) and HAS2 (P < 0.001) mRNA expression but not HAS3 (P = 0.558) mRNA expression (n = 12, Figure 2). A significant increase in HAS1 mRNA expression was also seen by stimulation with 1 µM BW245C, a DP receptor-selective agonist, compared with control (0.05% DMSO) (P < 0.001, Dunn’s test, n = 12). In contrast, no significant change in HAS1 mRNA expression was seen following stimulation with 1 µM DK-PGD2, a CRTH2 receptor-selective agonist (P > 0.999, Figure 2(A)). In contrast to PGD2 stimulation, a marginal, albeit significant, increase in HAS2 mRNA expression was seen in response to DK-PGD2 (P = 0.002, Figure 2(B)).
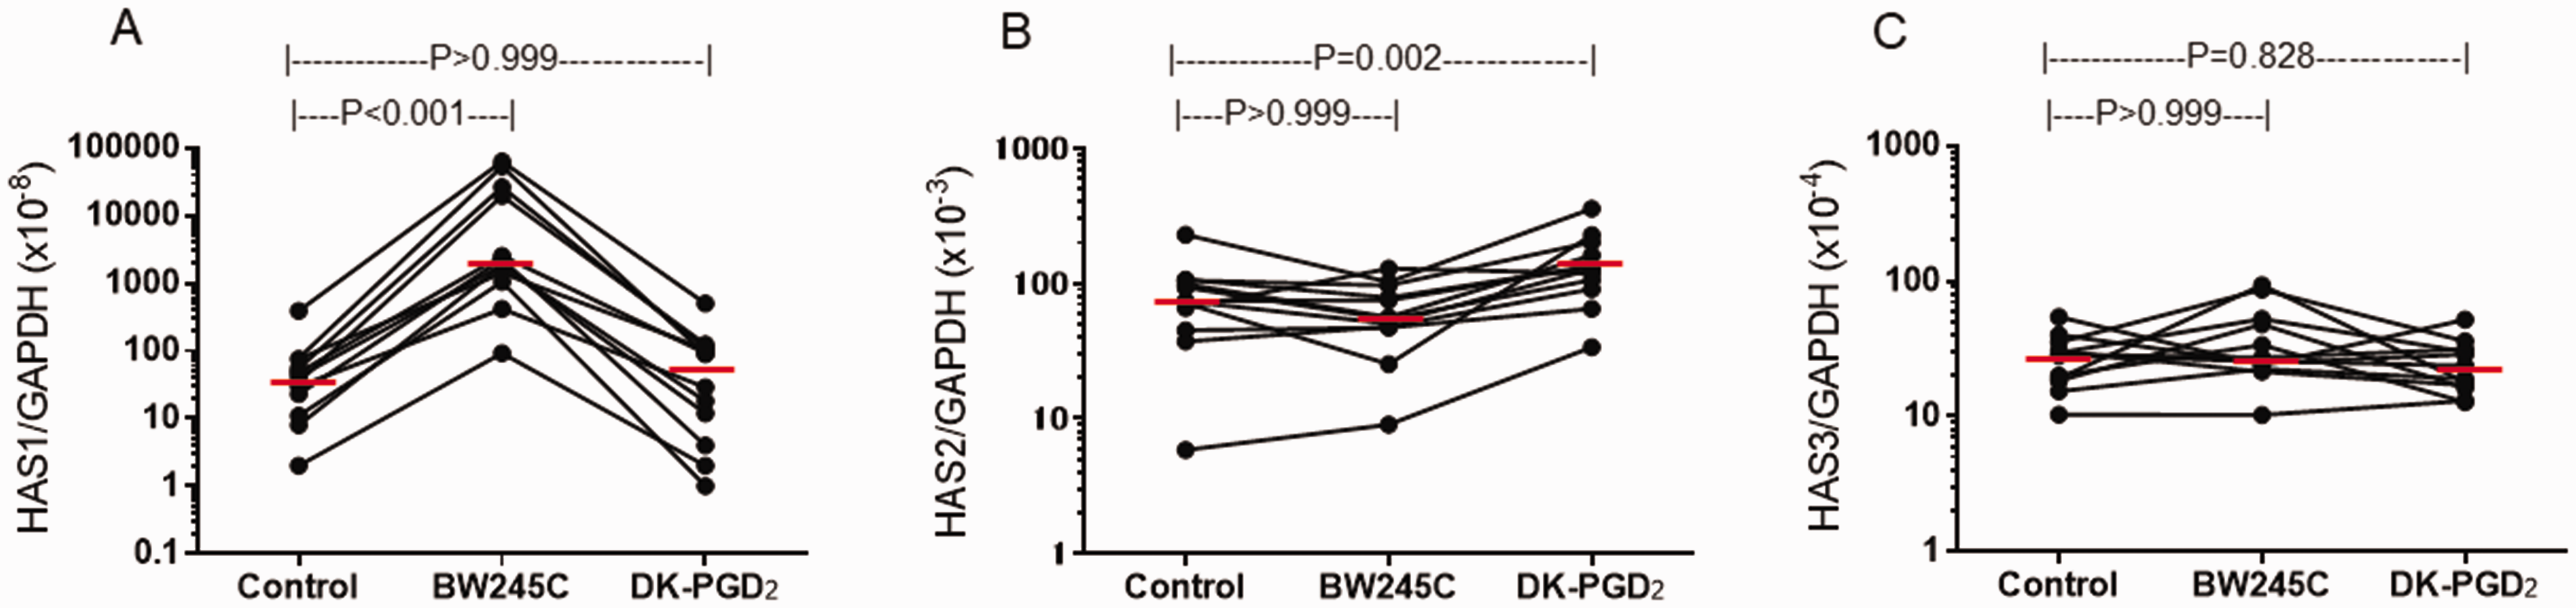
Effect of PGD2 receptor-selective agonists on HAS mRNA expression by NPDF. NPDF were stimulated with 1 µM of BW245C, DK-PGD2 or control buffer for 3 hours. Relative amounts of mRNA for HAS1 (A), HAS2 (B) and HAS3 (C) were determined. P-values were determined using Dunn test.
Effect of Receptor-Selective Antagonists on PGD2-Induced HAS mRNA Expression by NPDF
To confirm the above receptor specificity of PGD2 in PGD2-induced HAS mRNA expression, PGD2-stimulated NPDF were treated with receptor-selective antagonists. Similar to the above results using receptor-selective agonists, a significant difference in response to the antagonists was observed in HAS1 (P < 0.001, Friedman test) and HAS2 (P = 0.002) but not HAS3 (P = 0.262) mRNA expression (n = 12, Figure 3). As compared with control (0.05% DMSO), 1 µM of MK-0524 and ONO-4053, both of which are DP receptor-selective antagonists, inhibited PGD2-induced HAS1 mRNA expression (both 94% reduction, P < 0.001). In contrast, treatment with the CRTH2 receptor antagonist, OC000459, did not change PGD2-induced HAS1 mRNA expression (P > 0.999, Figure 3(A)). Such drastic changes were not seen for HAS2 or HAS3 mRNA expression (Figure 3(B) and (C)). Only treatment with ONO-4053 significantly enhanced PGD2-induced HAS2 mRNA expression (P = 0.003), however, the median increase was less than two fold (1.64).
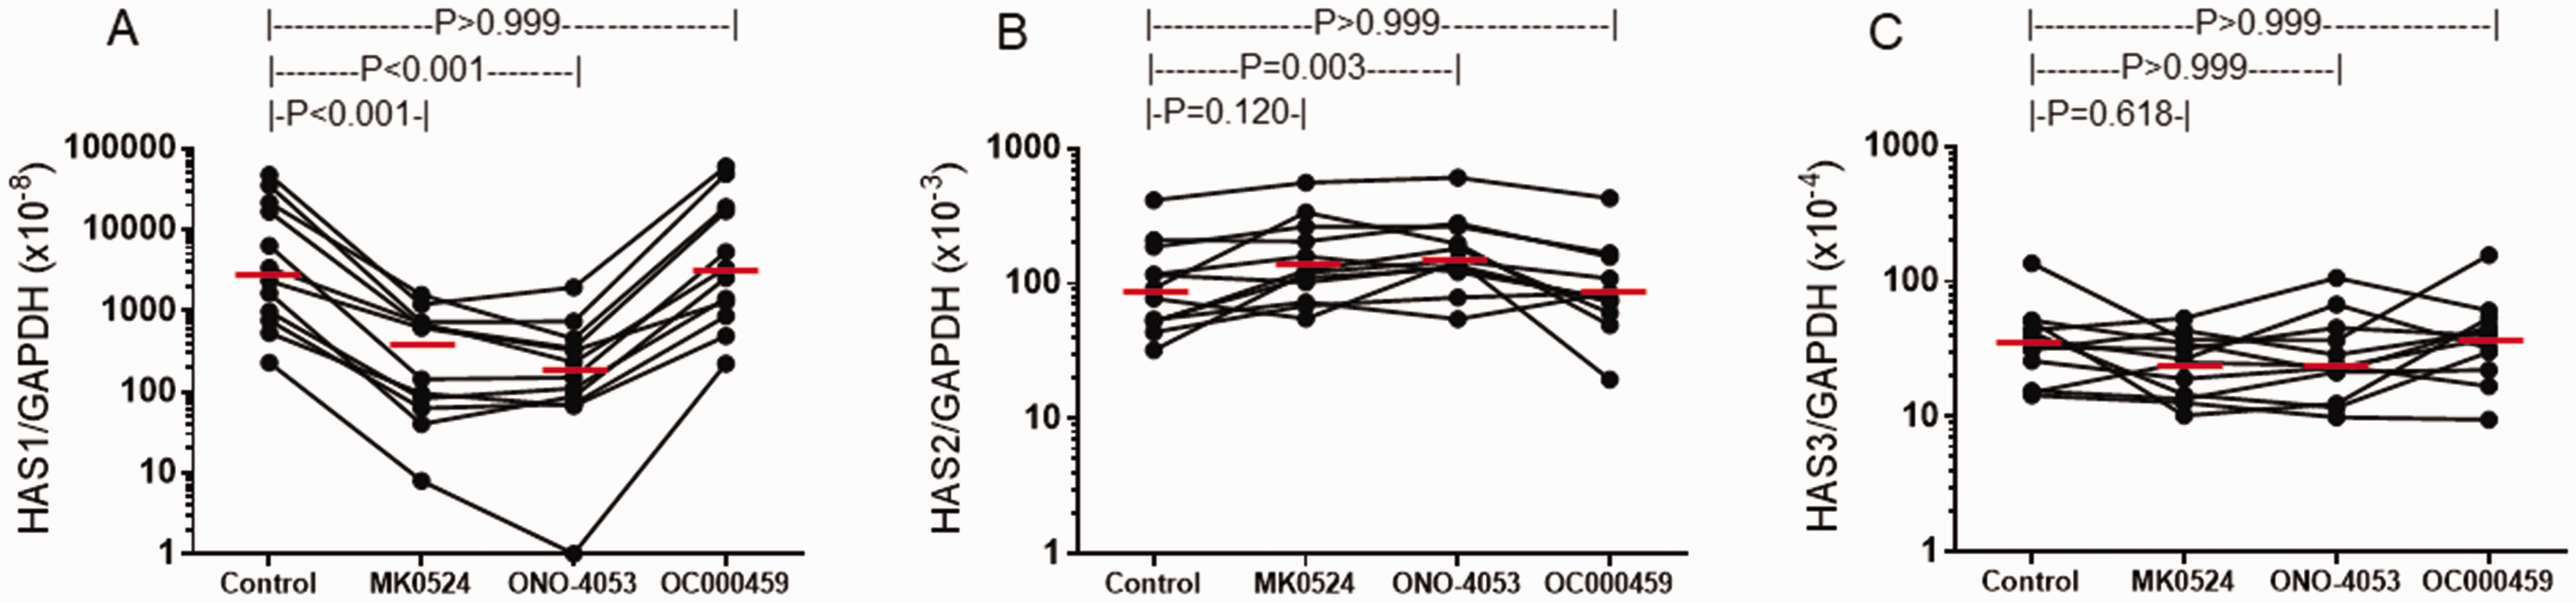
Effect of receptor-selective antagonists on PGD2-induced HAS mRNA expression by NPDF. NPDF were stimulated with 1 µM PGD2 in the presence or absence of 1 µM of MK-0524, ONO-4053, OC000459 or control buffer for 3 hours. Relative amounts of mRNA for HAS1 (A), HAS2 (B) and HAS3 (C) were determined. P-values were determined using Dunn test.
Comparison of PGD2-Induced HAS1 mRNA Expression between NPDF and UTDF
Similar to NPDF, UTDF (n = 13) showed a significant upregulation in HAS1 mRNA expression following 3-h stimulation with 1 µM PGD2 (median: 887.14-fold increase, P < 0.001, Wilcoxon signed-rank test, Figure 4(A)). In addition, 1 µM BW245C (median: 87.05-fold increase, P < 0.001, Dunn’s test) but not DK-PGD2 (median: 0.89-fold decrease, P > 0.999) enhanced HAS1 mRNA expression (Figure 4(D)). A modest, albeit significant, decrease and increase in mRNA expression of HAS2 (median: 0.69-fold decrease, P = 0.006, Figure 4(B)) and HAS3 (median: 2.06-fold increase, P = 0.001, Figure 4(C)), respectively, were also seen. Treatment with BW245C or DK-PGD2 had no significant effect on HAS2 mRNA expression (Figure 4(E)). On the other hand, BW245C (P < 0.001) but not DK-PGD2 (P > 0.999) slightly albeit significantly enhanced HAS3 mRNA expression (Figure 4(F)). No significant difference in the degree of PGD2-induced HAS1 (P = 0.086, Mann–Whitney U test, Figure 5(A)), HAS2 (P = 0.967, Figure 5(B)) or HAS3 (P = 0.055, Figure 5(C)) mRNA expression was seen between NPDF and UTDF. Baseline HAS mRNA expression was similar between non-stimulated NPDF and UTDF (Figure 5(D) to (F)).
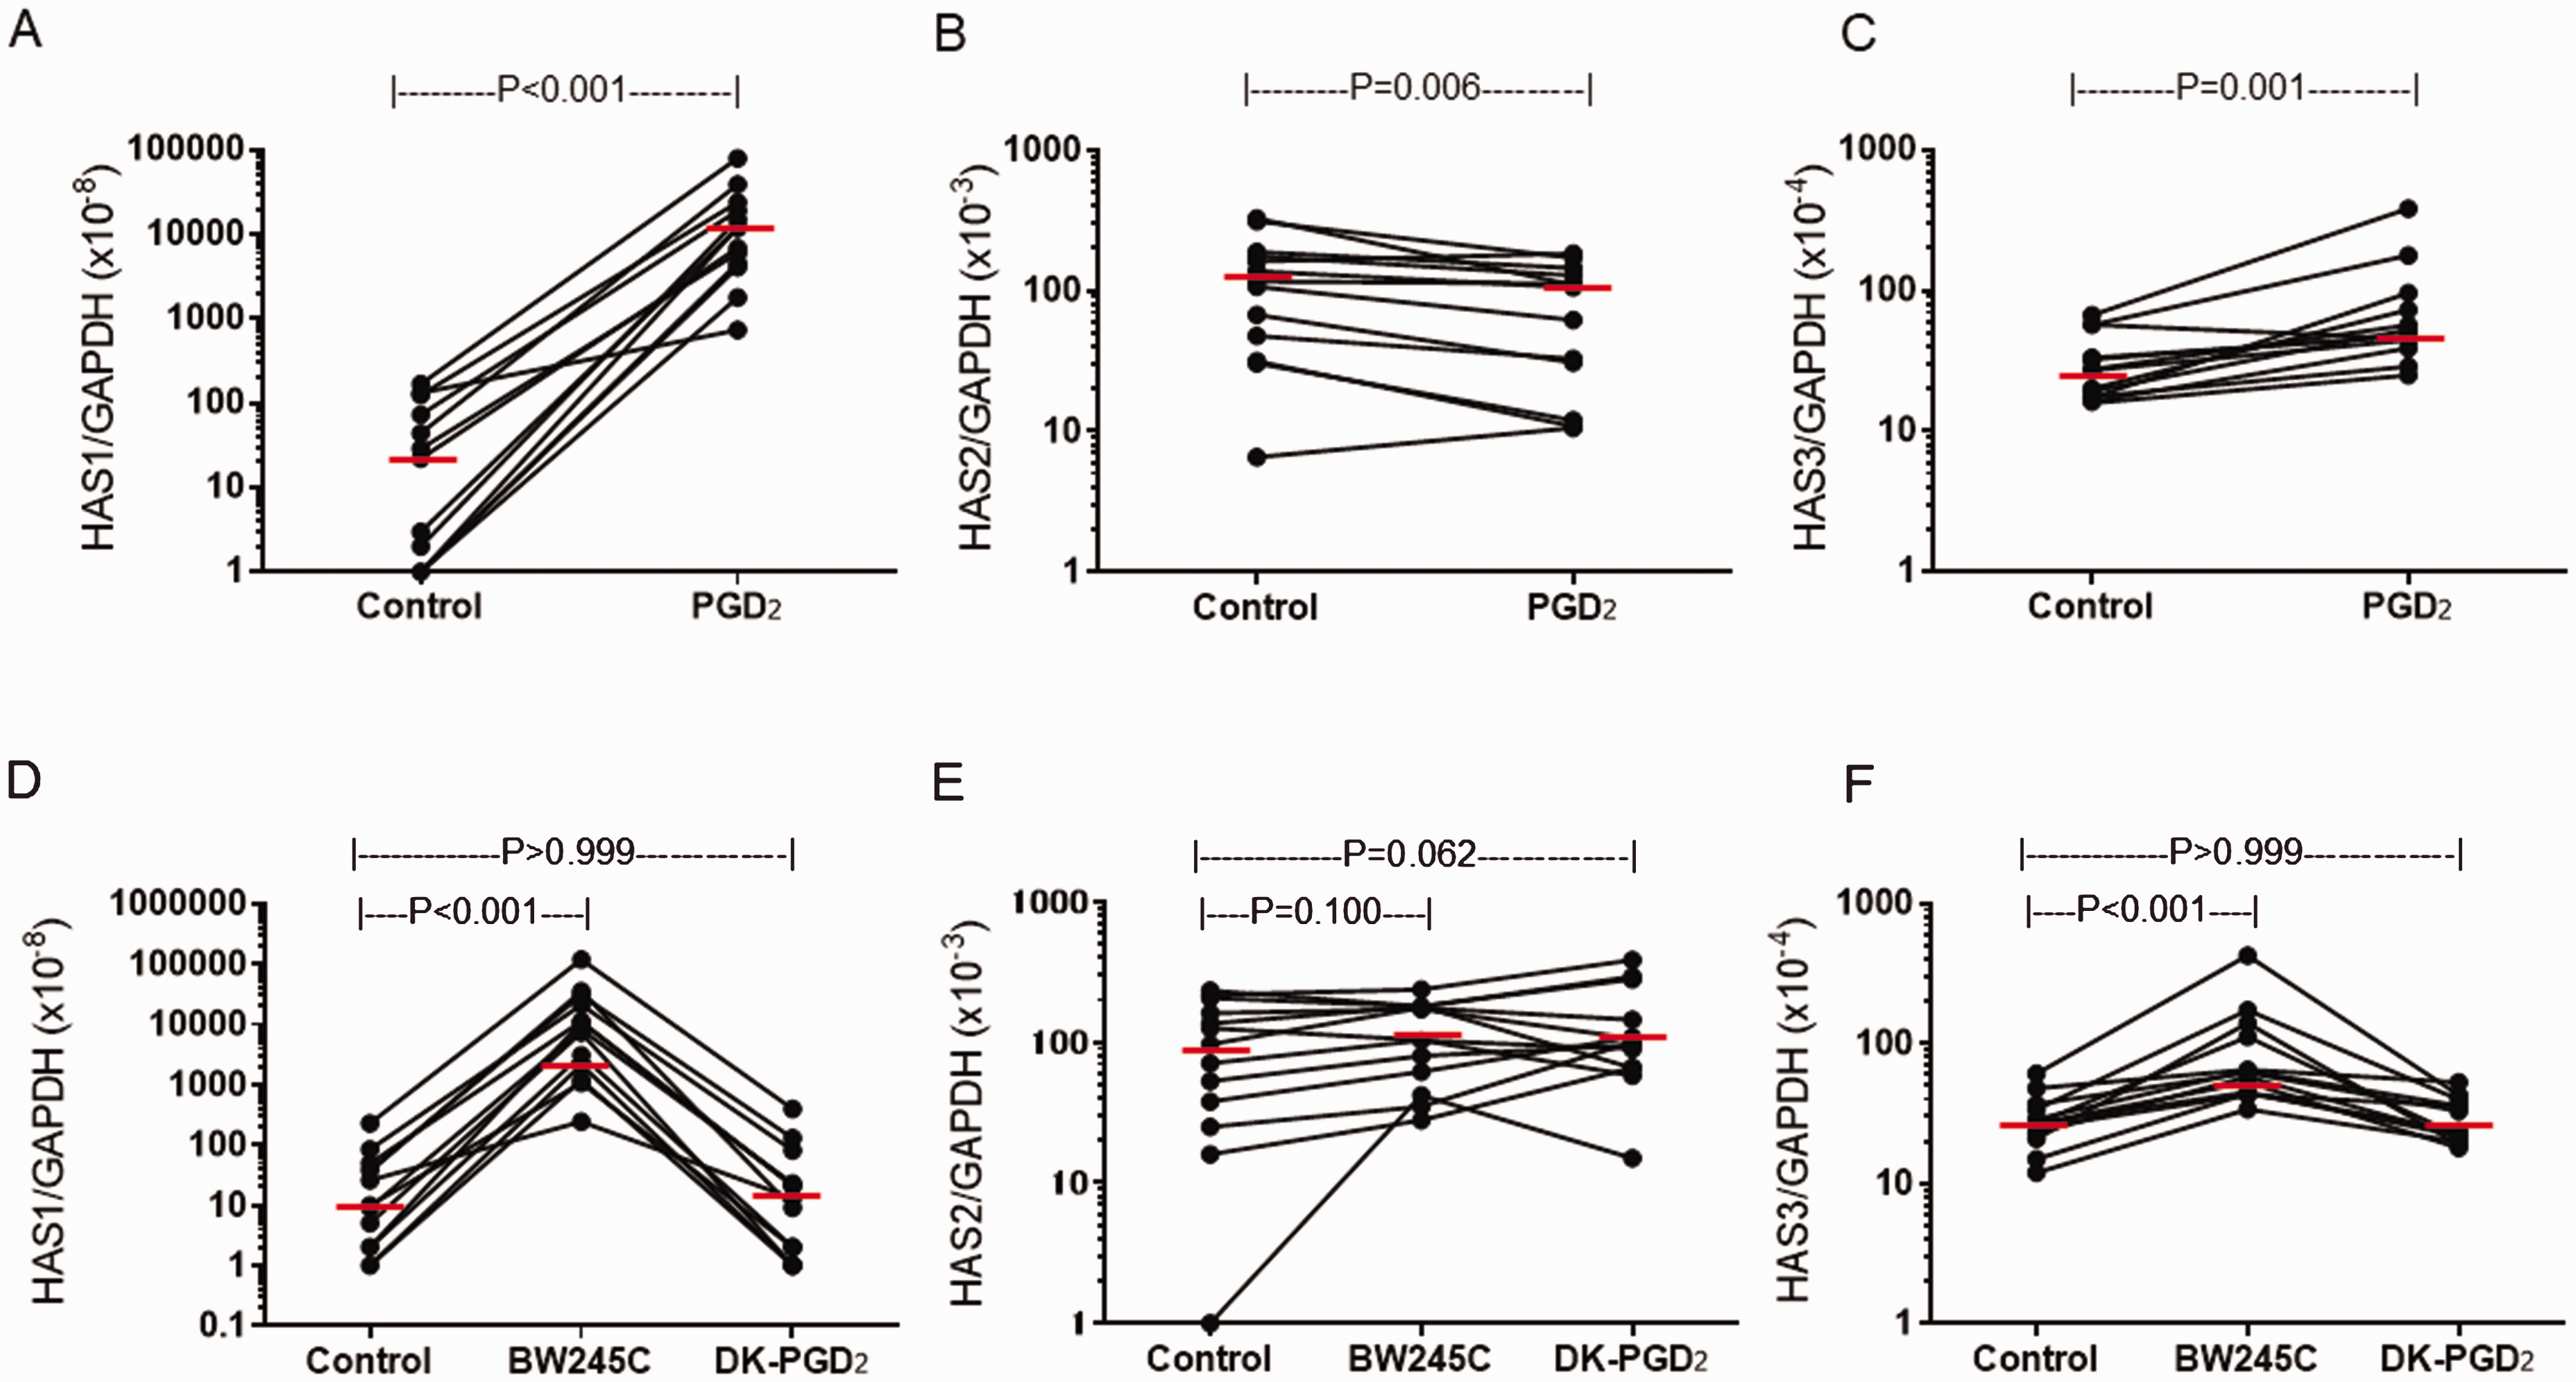
PGD2-induced HAS mRNA expression in UTDF. UTDF (n=13) were stimulated with 1 µM PGD2 or control buffer for 3 hours. Relative amounts of mRNA for HAS1 (A), HAS2 (B) and HAS3 (C) were determined. Effect of PGD2 receptor-selective agonists on HAS1 (D), HAS2 (E) and HAS3 (F) mRNA expression in UTDF were also determined. P-values were determined using Wilcoxon signed rank test.
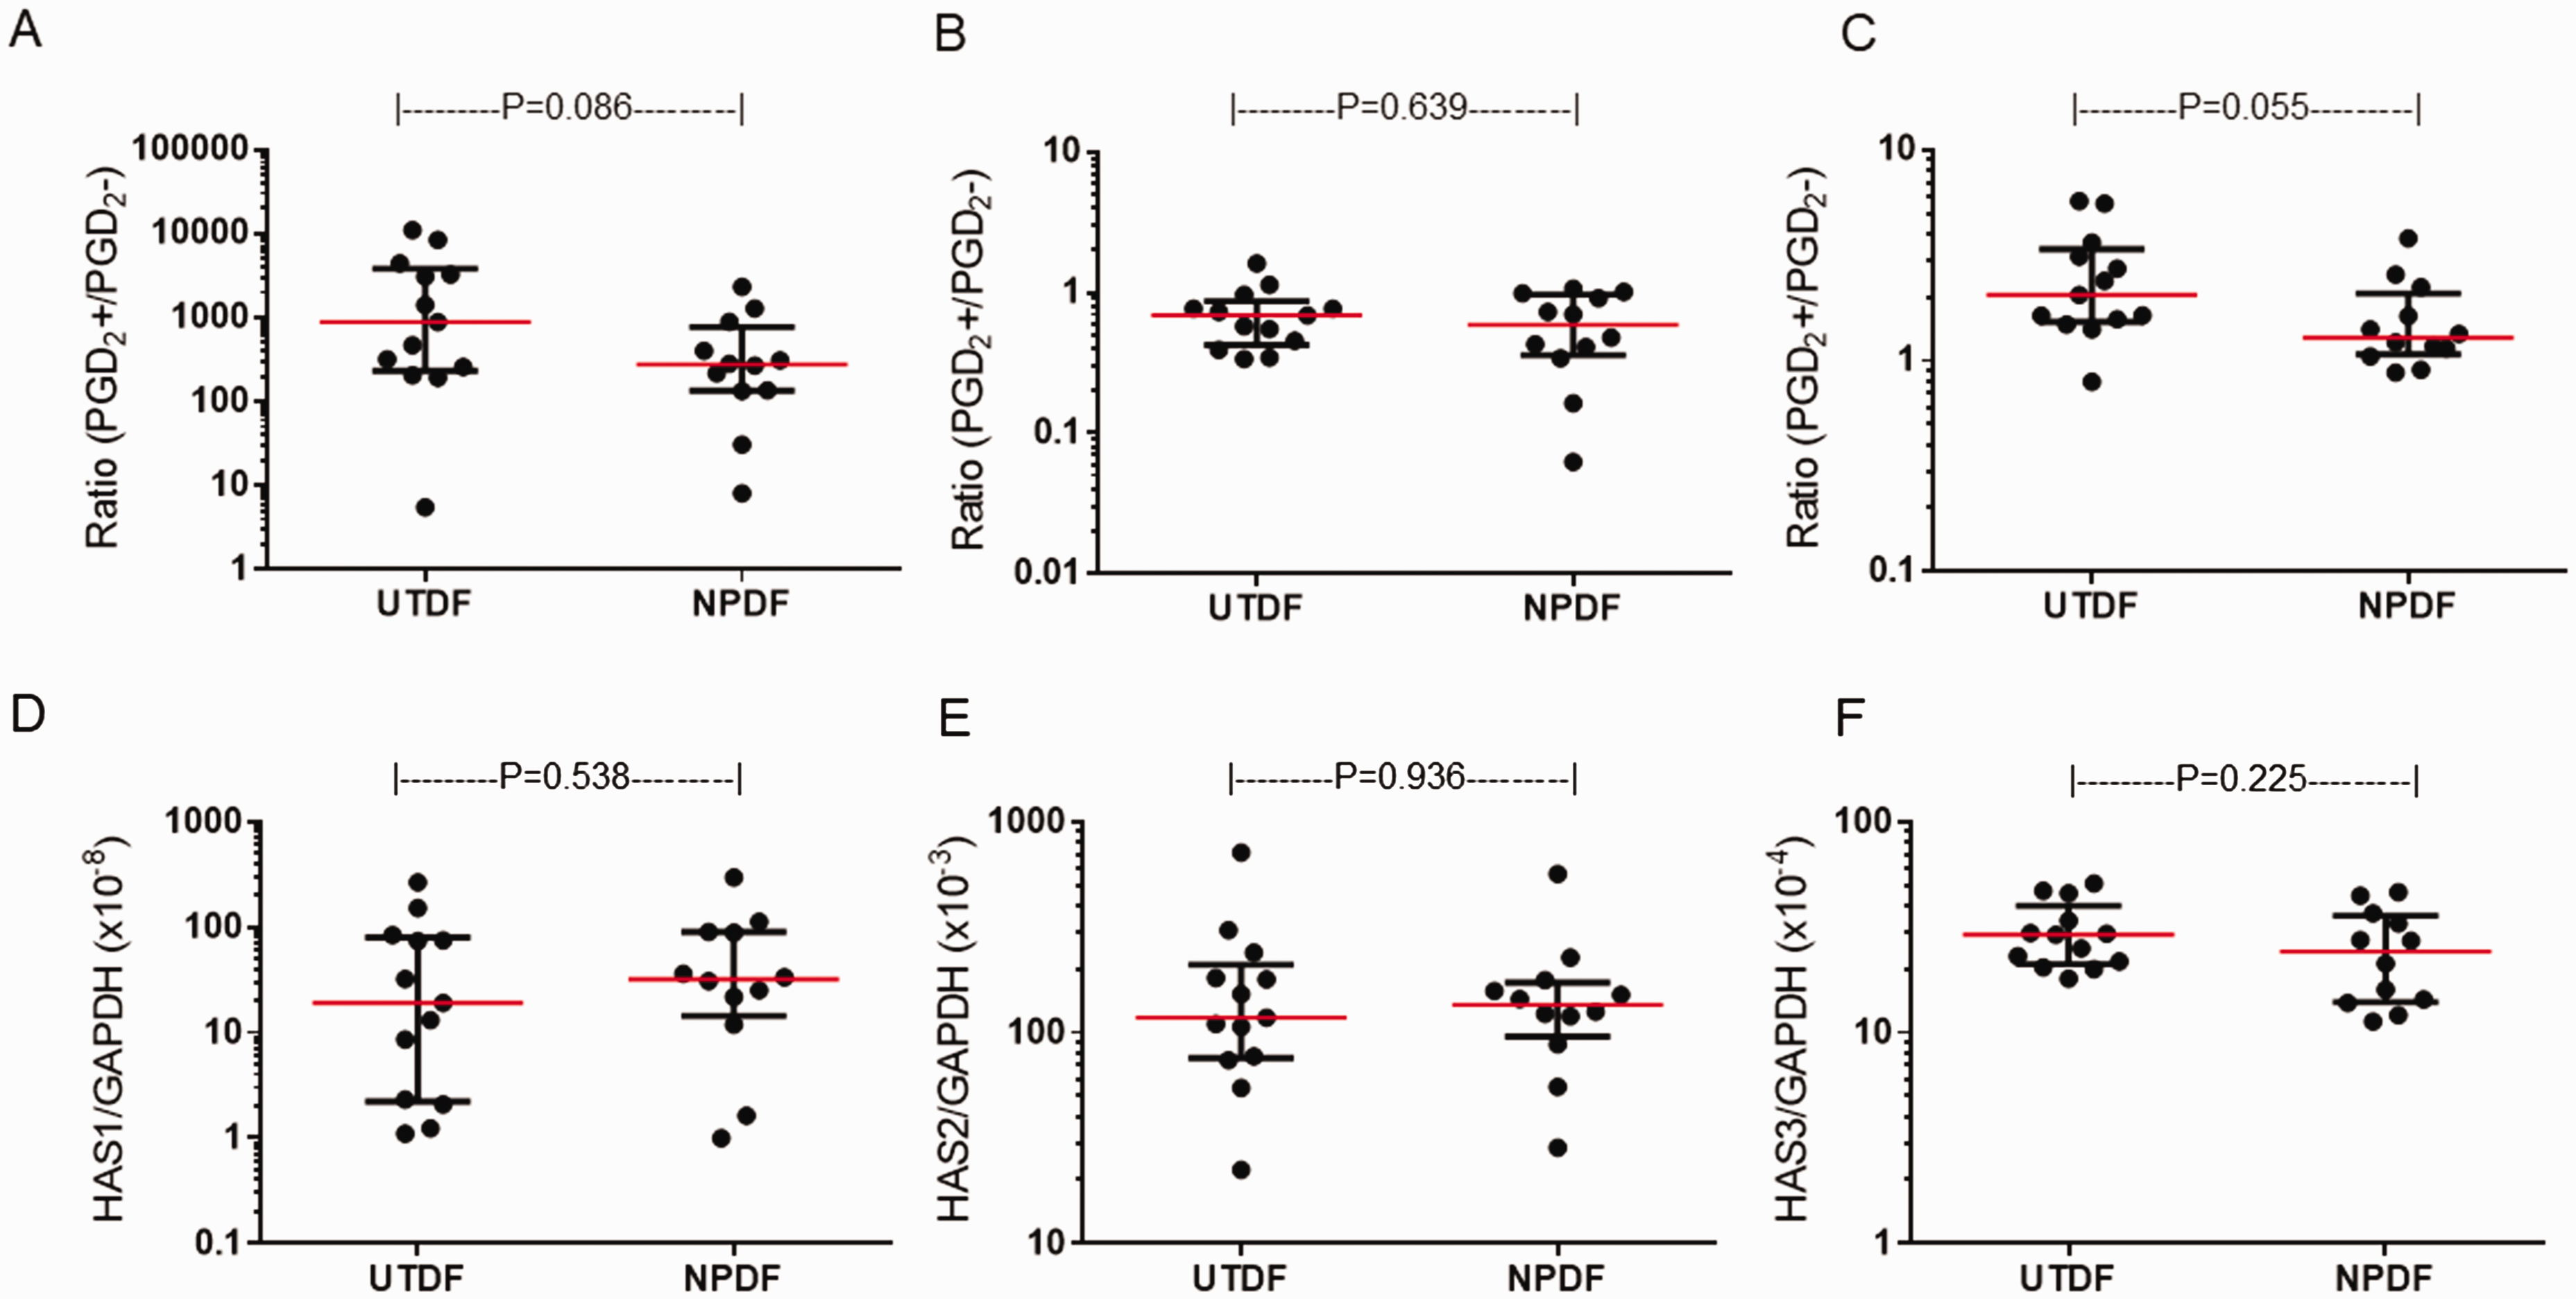
Comparison of non-stimulated and PGD2-induced HAS mRNA expression between UTDF and NPDF. Ratio of PGD2-induced HAS1 (A), HAS2 (B) and HAS3 (C) mRNA expression were compared between UTDF and NPDF. Non-stimulated HAS1 (D), HAS2 (E) and HAS3 (F) mRNA expression were also compared. P-values were determined using Mann-Whitney U test.
Discussion
In the present study, we examined the effect of PGD2 on mRNA expression of three HAS isoforms in NPDF. We found a marked increase in HAS1 mRNA expression, as compared with HAS2 and HAS3, in response to PGD2. Stimulation with BW245C, but not DK-PGD2, mimicked the effect of PGD2 on HAS1 mRNA expression by NPDF. In addition, treatment with MK0524 and ONO-4053, but not OC000459, significantly abrogated the effect of PGD2. These findings clearly suggested that PGD2 induces HAS1 mRNA expression via coupling to DP, but not CRTH2, receptors in NPDF. This effect mediated through the DP receptor may be due to the predominant expression of DP receptors over that of CRTH2 receptors in NPDF, as we previously shown. 7
A recent study demonstrated that mRNA expression of HAS2 and HAS3, but not HAS1, was observed in NP. 10 A similar result was seen in lung fibroblasts in which HAS2 and HAS3, but not HAS1, mRNA could be detected. 23 In addition, HAS1 activity is low under normal condition. 24 Our results are in part consistent with these reports because a significant difference in relative mRNA expression in response to control treatment (0.005% DMSO) was seen among the three HAS isoforms (P < 0.001, Freidman test), namely, HAS1 mRNA expression was significantly lower than that of HAS2 (P < 0.001, Dunn’s test) and HAS3 (P = 0.043, Figures 1 and 4).
HAS1 is upregulated in states associated with inflammation. In human fibroblasts, cytokines and growth factors associated with inflammation including IL-1β, TGF-β, epidermal growth factor (EGF) and fibroblast growth factor (FGF) can enhance HAS1 expression. 24 Because PGD2 is thought to be involved in the inflammation of CRS, the results of the present study suggested that NPDF likely enhance HAS1 expression under the inflammatory condition of CRS.6,7,19
To our knowledge, no study has investigated whether PGD2 regulates the expression of the three HAS isoforms in airway fibroblasts. One report showed that PGD2 induced expression of not only HAS1 but also HAS2 and HAS3 mRNA in orbital fibroblasts. 21 Our results were consistent with this report regarding HAS1 expression, especially the finding that the increase in HAS1 mRNA expression was significantly greater than that of HAS2 and HAS3. However, our results were inconsistent with this report in terms of HAS2 and HAS3 mRNA expression. Thus, nasal fibroblasts may have a unique characteristic in HAS expression in response to PGD2.
The role of HAS1 in health and diseases has been studied. 24 In vitro, HAS2 produces the largest HA (>3.9 MDa), whereas HAS3 produces intermediate HA (0.12–1 MDa) and HAS1 produces the smallest HA (120 kDa). 25 In general, low molecular weight HA (<500 kDa) induces inflammatory responses such as macrophage activation and eosinophil survival. 13 NP contain more HA with lower molecular weight HA (80–600 kDa) than normal nasal mucosa. 9 Our results suggested that enhanced HAS1 expression in NPDF induced by PGD2 may play a role in local accumulation of low molecular weight HA that leads to inflammation.
The effect of PGD2 on HAS2 and HAS3 mRNA expression in NPDF was indistinct as compared with HAS1. PGD2 induced a 0.59-fold decrease in HAS2 mRNA expression. As discussed above, HAS2 produces HA with high molecular weight. 25 Because high molecular weight HA has anti-inflammatory properties and promotes immune suppression in the airway, inhibition of HAS2 mRNA expression by PGD2 may augment inflammation in CRS. 16 Conversely, experiments using PGD2 receptor-selective agonists or antagonists did not confirm that the effect of PGD2 on HAS2 or HAS3 mRNA expression was mediated through selectively coupling to DP or CRTH2 receptors, unlike HAS1. Human airway fibroblasts express peroxisome proliferator-activated receptor (PPAR)-gamma, which binds to 15-deoxy-delta (12,14)-PGJ2, the metabolite of PGD2. 26 PGD2 may affect the expression of HAS2 and/or HAS3 mRNA via altered PPAR-gamma signaling. Investigation about whether signals via PPAR-gamma affect HAS2 and HAS3 mRNA expression is currently underway using GW2664, a selective PPAR-gamma antagonist.
No significant response in PGD2-induced HAS mRNA expression was seen between NPDF and UTDF. Although we did not examine such effect in normal nasal tissue-derived fibroblasts due to ethical concerns, this finding suggested that nasal fibroblasts from CRSwNP and CRSsNP patients have a similar ability to induce HAS1 mRNA expression in response to PGD2, which may lead to tissue remodeling. In contrast, elevated PGD2 production and PGD2 synthase expression occur in CRSwNP.6,19,27 Thus, HA accumulation may be induced more frequently in NP than UT.
PGD2 did not alter the release of HA as compred with control treatment in NPDF. This finding is not surprising since the ELISA kit used in this study detects HA molecules that are as small as 6.4 kDa. PGD2 upregulated HAS1 and HAS3 mRNA expression and consersely downregulated HAS2 mRNA expression in NPDF. These result suggest that PGD2 did not affect the release of whole amount of HA in NPDF. It is desirable to detect low molecular weight HA to confirm whether increased HAS1 expression by PGD2 promotes low molecular weight HA production in NPDF.
In conclusion, the present study demonstrated that PGD2 promotes HAS1 mRNA expression by NFDF via coupling to DP. The results may provide a basis for use of DP-selective antagonists to prevent tissue remodeling characterized by HA accumulation in CRS. Future investigation is desired whether PGD2 induces HAS expression at protein level using immune-histochemistry or ELISA . In addition, since DP and CRTH2 couples to Gs and Gi, respectively, signaling via Gs or Gi could be more critical for the expression of HAS mRNA. An investigation whether a kind of agents increasing cAMP levles can increase the expression of HAS isoforms in NFDP should be examined in future.
Footnotes
Acknowledgment
The authors would like to thank Yuko Okano for her editorial assistance.
Declaration of Conflicting Interests
The author(s) declared no potential conflicts of interest with respect to the research, authorship, and/or publication of this article.
Funding
The author(s) disclosed receipt of the following financial support for the research, authorship, and/or publication of this article: This work was supported in part by grants from Ministry of Education, Culture, Sports, Science and Technology, Japan (16K15721 and 17K16920) and grants from the Japan Agency for Medical Research and Development (AMED) under Grant Number JP17ek0410040, and JP16ek0109062.