
Abstract
Background
Allergy and asthma are often diagnosed concomitantly. Patients with both diagnoses might need to have a more targeted approach to reduce the symptomatic burden and severity of disease.
Objective
This study was designed to explore the relationship between specific allergen sensitization, and asthma diagnosis and severity with the hypothesis that patients who tested positive to a higher allergy class of response and to more allergens would be more likely to have severe asthma.
Methods
A retrospective review was performed on 1419 charts that had a positive IgE allergy class blood test between 2014 and 2018. A total of 701 patients had one or more positive tests and a diagnosis of asthma. Patient demographics and pertinent variables including all clinic and ED visits, specific allergy and class of response, and information related to their asthma treatment and severity were recorded. Logistic regression was used to analyze the likelihood of asthma diagnosis, concomitant diagnosis of asthma and allergic rhinitis, and measures of asthma severity.
Results
Higher class of response to cat dander 1.24 (1.09, 1.41), dog dander 1.29 (1.13, 1.47), lamb's quarter 1.35 (1.06, 1.70), house dust 1.41 (1.11, 1.82), Cladosporium herbarum 1.35 (1.07, 1.67) or cockroach 1.56 (1.00, 2.44) showed increased odds of hospitalizations. There was a statistically significant difference between the average number of classes for patients with and without asthma (P < .001), and those with and without steroids (P < .001).
Conclusions
This study found that positivity to cat dander, dog dander, some fungus, and house dust was associated with more severe asthma.
Introduction
The global prevalence of asthma has been reported from 1% to 18%. 1 In the United States, this prevalence has been estimated to be approximately 8.4%, with 7.7% in adults and 9.5% in children. 1 In the United States alone, the economic burden of asthma-related medical expenses, lost work and school time, and deaths was estimated to be $80 billion yearly. 2
In addition to increasing the risk of death, uncontrolled, severe asthma increases the economic burden and decreases overall quality of life by limiting job opportunities and daily activities for patients.3–5 Prior work has demonstrated that the presence of certain types of allergic sensitization can differentially modify the impact of atopic disease on quality of life. A meta-analysis performed to compare the health-related quality of life for patients with asthma or allergic rhinitis caused by either perennial house dust mite or a seasonal pollen allergy found a worse health-related quality of life in patients with perennial dust mite allergy. 6
Asthma is often diagnosed concomitantly with allergic conditions such as allergic rhinitis, sinusitis, atopic dermatitis, and conjunctivitis. Industrialized nations have seen a more dramatic rise in allergic asthma and other atopic disorders compared to developing countries. 3 The relationship was noted in the 1920s and has continued to rise through the 1980s and 1990s. 7 This gradual increase in sensitization may account for patients with asthma and atopic dermatitis being younger than the overall population. 7 Past studies have shown a relationship between the incidence of allergy and the subsequent development of asthma. Children exposed at a very young age to perennial allergens have been found to have a higher risk of following this progression.1,2,8
Even though certain allergens and atopic diseases have been identified in the literature to have a strong correlation with asthma and asthma exacerbations, to date, specific phenotypes of patients with an increased risk of severe asthma have not been identified.9–11 In addition, patients diagnosed with both asthma and/or allergic rhinitis might require a different therapeutic approach to optimally address their symptoms. 12
Identifying specific allergic phenotypes that are associated with asthma would allow physicians to more promptly diagnose and treat patients with asthma. Earlier introduction of appropriate therapy could lead to more stable disease control, a reduction in emergency room visits and hospitalizations, a better quality of life for the patients, and a reduction in health care expenditures. The present study explores the association of specific allergen sensitizations with the development and severity of asthma. It was hypothesized that patients who tested positive with a higher allergic class of response and 2 or more allergens would be more likely to have more difficulty to control asthma.
Methods
After Institutional Review Board approval for the study protocol was obtained. Patients with a laboratory result of IgE in-vitro blood testing between 2014 and 2016. Data was collected till 2018 to ensure patients had at least 2 years of follow-up. Overall, 1422 patients were identified. Variables collected included age, sex, diagnosis of asthma, allergies, current treatment, smoking status, and comorbidities such as COPD, cancer, cystic fibrosis, sarcoidosis, pulmonary eosinophilia, Langerhans cell histiocytosis, sinusitis (acute and chronic), COPD status, and smoking status, as well as other illness treated with steroids at the date of data collection. Other allergic diagnoses, such as allergic rhinitis, allergic dermatitis, and allergic conjunctivitis; as well as concomitant diagnoses of acute sinusitis, chronic sinusitis, aspirin sensitivity, and nasal polyps were also collected. Diagnoses (eg, asthma, allergic rhinitis, etc) were identified from subjects charts by using the International Classification of Diseases 10th Revision (ICD-10) codes given by their providers. We checked the code and that they had at least one PFT or had an established treatment regime.
For those patients with a diagnosis of asthma, additional data was collected: age at diagnosis, number of clinic visits due to asthma, the time between first and last visit for asthma during the study time frame, emergency department (ED) visits due to asthma, admission to inpatient from ED from an asthma ED visit, ED discharge medications, number of hospitalizations due to asthma, and current asthma treatment. For a clinical visit to be counted for asthma, the principal diagnosis had to be asthma or asthma exacerbation. Classes of treatment were collected for both cohorts. Medications classes included were: short-acting beta 2 agonists, long-acting beta 2 agonists (LABAs), inhaled corticosteroids, anticholinergics, leukotriene modifiers, oral methylxanthines, cromolyn, immunomodulators, and anti-IgE and oral corticosteroids. The treatment collected for the asthma cohort was the treatment prescribed on their last visit. Immunotherapy was noted for patients who received this against dust mites, grass pollen, and bee/wasp venoms.
The allergens evaluated included perennial allergens such as cat dander, house dust, dog dander, Dermatophagoides farinae, Cladosporium herbarum, Alternaria tenuis, Aspergillus fumigatus, Dermatophagoides pteronyssinus, Penicillium chrysogenum, cockroach, and mouse epithelium, as well as seasonal allergens which included timothy grass, June grass, English plantain, short ragweed, box elder tree, lamb's quarter, oak tree, bermudagrass, johnson grass, elm tree, hickory/pecan tree, walnut tree, cottonwood tree, birch tree, sycamore tree, white ash, mountain juniper, mulberry pigweed, Russian thistle, rough marsh elder; additionally to allergen positivity we evaluated their respective class response.
Allergens were measured using ImmunoCAP™ IgE assay, and classes were collected based on the laboratory final report. Cleveland Clinic Laboratory uses the following criteria to evaluate allergen class response based on kU/L: ≤ 0.35, Class 0; 0.35 to 0.69, Class 1 (low); 0.70 to 3.49, Class 2 (moderate); 3.50 to 17.49, Class 3 (high); 17.50 to 49.99, Class 4 (very high); 50 to 99.99, Class 5 (very high); and ≥ 100, Classes 6 to 9 (very high). This is a cross-sectional study, therefore, these values were collected from reports existing in patients' charts during the study time frame.
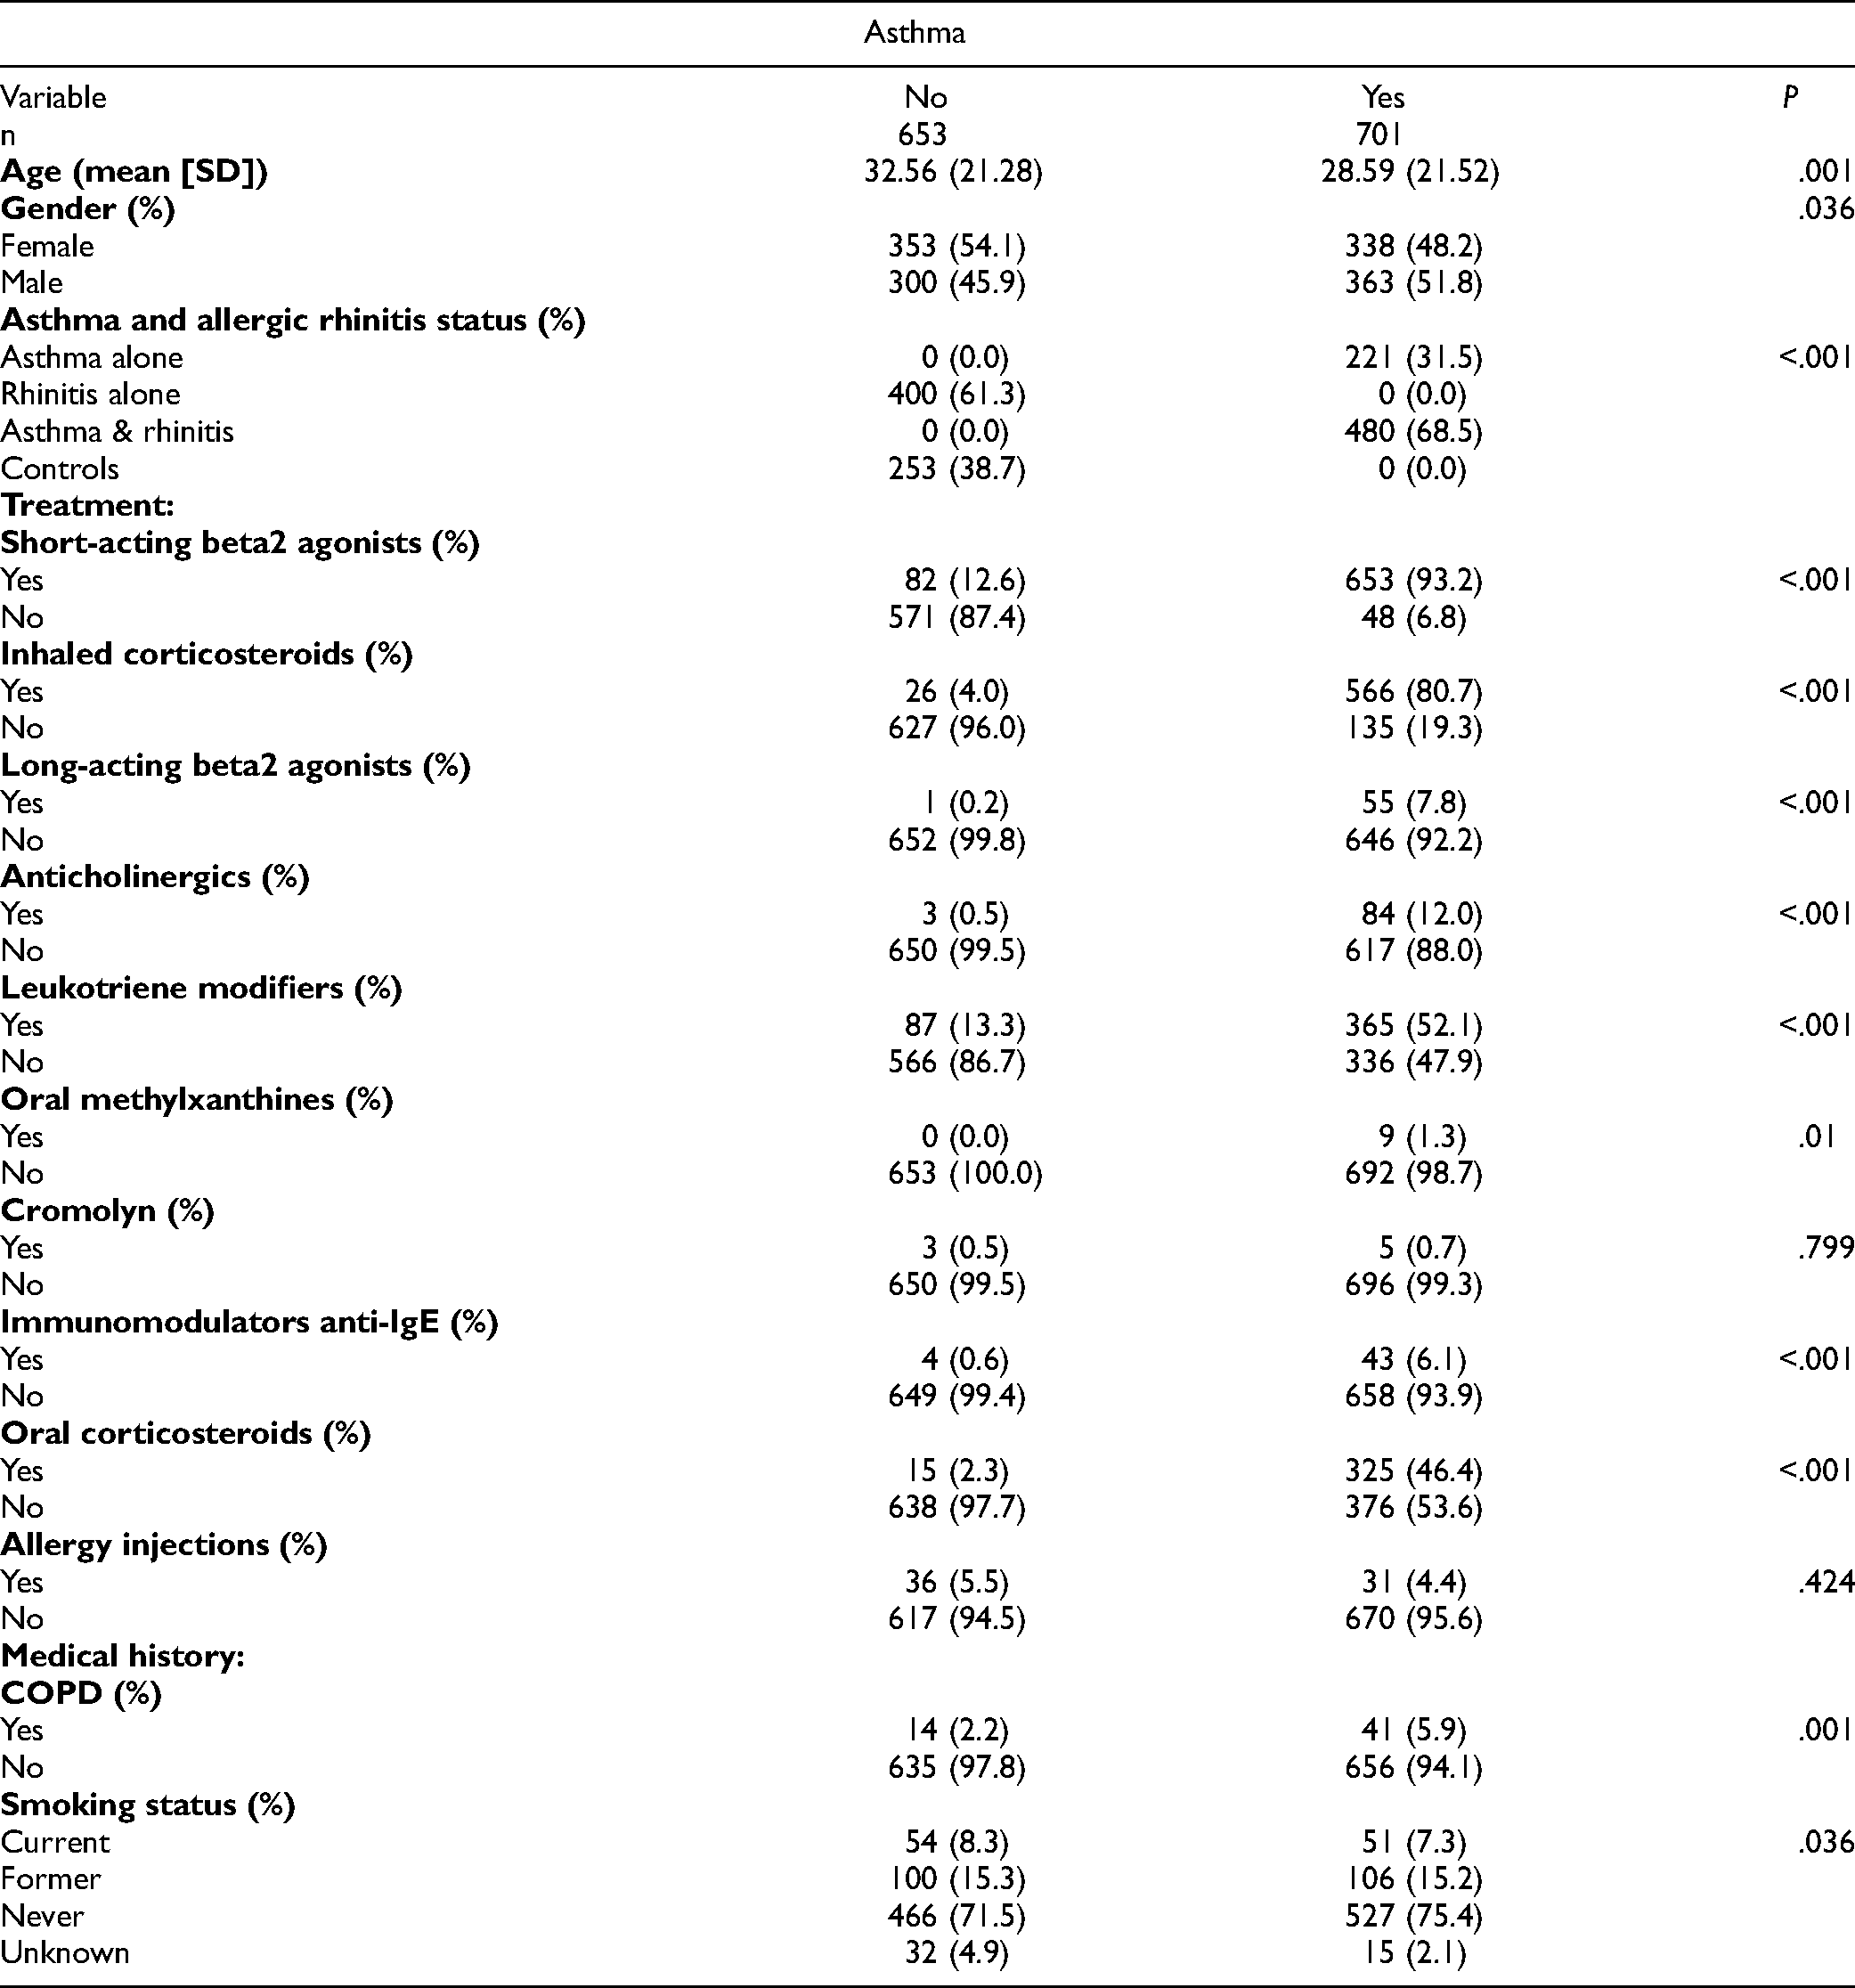
Baseline characteristics were measured using mean and standard deviations or median and ranges for continuous variables, as appropriate. Categorical variables were summarized using frequency and percentages. In the univariate analysis, chi-square and t-tests for categorical and continuous variables, respectively, were used (Table 1).
Demographics by Asthma Diagnosis Status.
To evaluate the influence of the IgE class response in asthmatic patients who most likely had a more severe disease, additional binary variables were created as proxy measures of asthma disease severity. Variables were made as follows: (1) average clinic visits per year was created from the total clinic visits over the number of years for patients who had one or more years of follow-up during the study time frame, this variable was coded as < or > 4 per year; (2) ED visits per year was coded as < or > 1 visit year from the total ED visits per year due to asthma, (3) hospitalizations due to asthma exacerbation is a binary yes/no variable which highlights if a patient had any hospitalizations due to asthma exacerbation, excluding sport induced, (4) use of systemic corticosteroids was created as a binary yes/no variable if a patient was prescribed systemic corticosteroids during the study time frame, and (5) Medications to control asthma: if patients were treated with 2 or more additional medications in order to control their asthma, these were counted as < or ≥ 2, excluding short-acting beta-agonists (SABAs).
Univariate logistic regression was used to analyze the likelihood of asthma diagnosis, and asthma with allergic rhinitis, using the different allergens and classes collected as well as the use of oral steroids and the need for more than 2 medications to control their asthma. This type of regression was also used to evaluate the 5 different proxy measures of disease severity for the asthmatic cohort.
A Spearman correlation was used to evaluate the relationship between the total number of antigens and the average number of classes per antigen a patient is positive to, this was done for patients with and without a diagnosis of asthma as well as for patients with and without the use of oral corticosteroids. Wilcoxon tests were used to evaluate the difference between class responses and their number of overall antigens among these 2 groups. We considered α < 0.05 as statistically significant. R statistical software (Version 4.1.1) was used for all analyses. 13
IgE Testing
ImmunoCAP™ IgE assays (Thermo Fisher Scientific/Phadia, Uppsala, Sweden) are validated quantitative tests that measure circulating allergen-specific IgE antibody levels in human serum or plasma. 14
Results
Cohort Characteristics
Baseline characteristics can be found in Table 1. Out of 1422 patients initially identified we ultimately included 1354 patients after excluding subjects with incomplete chart information, concomitant pulmonary disease, cancer, cystic fibrosis, sarcoidosis, pulmonary eosinophilia, Langerhans histiocytosis, and other conditions treated with steroids. Of these patients, 653 (48.2%) had no current diagnosis of asthma and 701 (51.8%) had a current positive diagnosis of asthma. The mean age in patients with asthma was younger (28.6 years) compared to patients without asthma (32.6 years). Gender was not predictive of an asthma diagnosis. Allergic rhinitis was more common among patients with a diagnosis of asthma (68.5% vs 61.3%; P < .001).
For the 701 patients diagnosed with asthma, the mean age at diagnosis was 19 years, the median average number of clinic visits per year for the cohort was 1.80 ranged from 0.98 to 2.99. Asthma patients had an average of 1.21 ED visits per year, from which 28.4% received steroids and 69.3% received short-acting beta2 agonists upon ED discharge; there was an average of 0.48 hospitalization from ED, as well as 0.48 mean hospitalizations overall per year as well. However, the median for those 2 last measurements was 0. (Table 2).
Asthmatic Cohort.
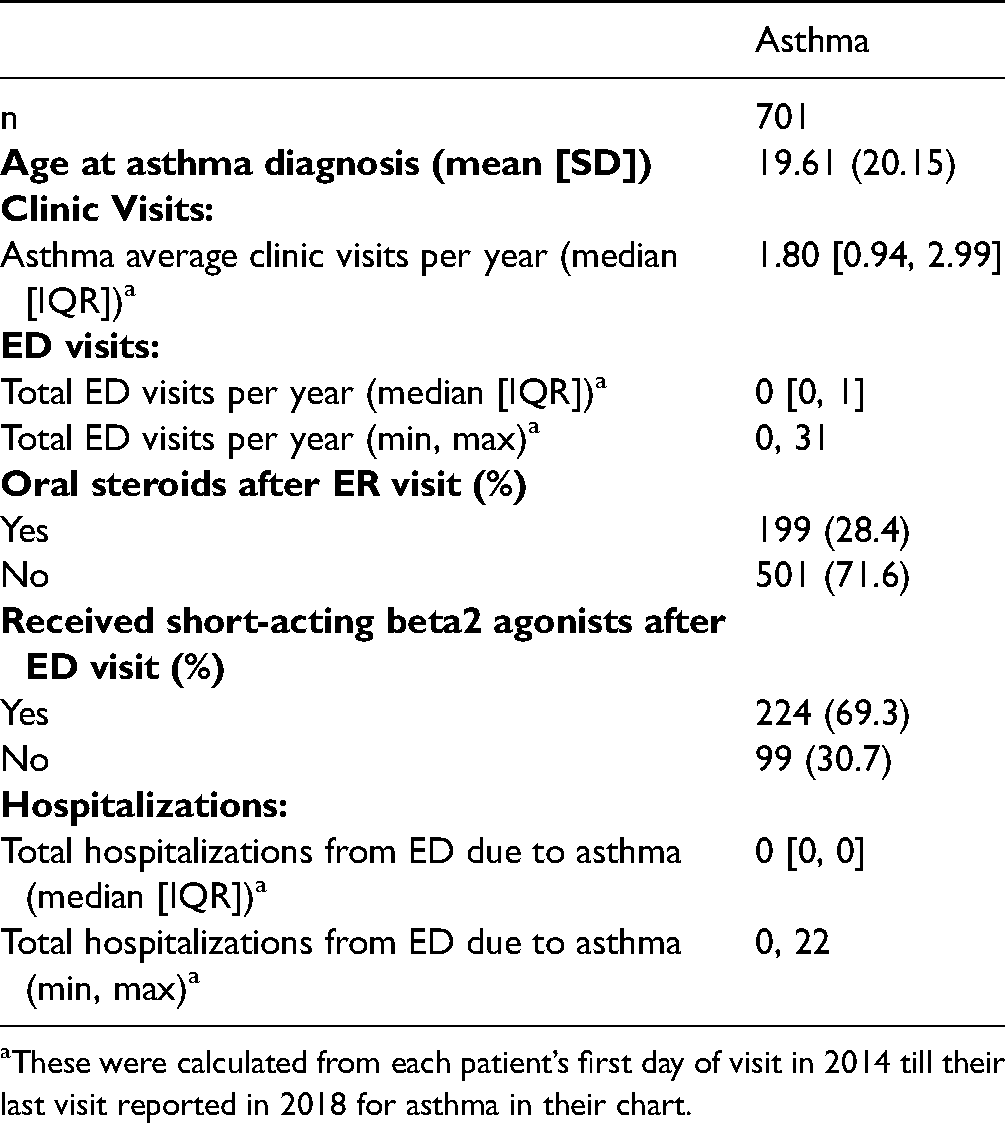
These were calculated from each patient’s first day of visit in 2014 till their last visit reported in 2018 for asthma in their chart.
Allergen Class Response by Asthma Diagnosis status.
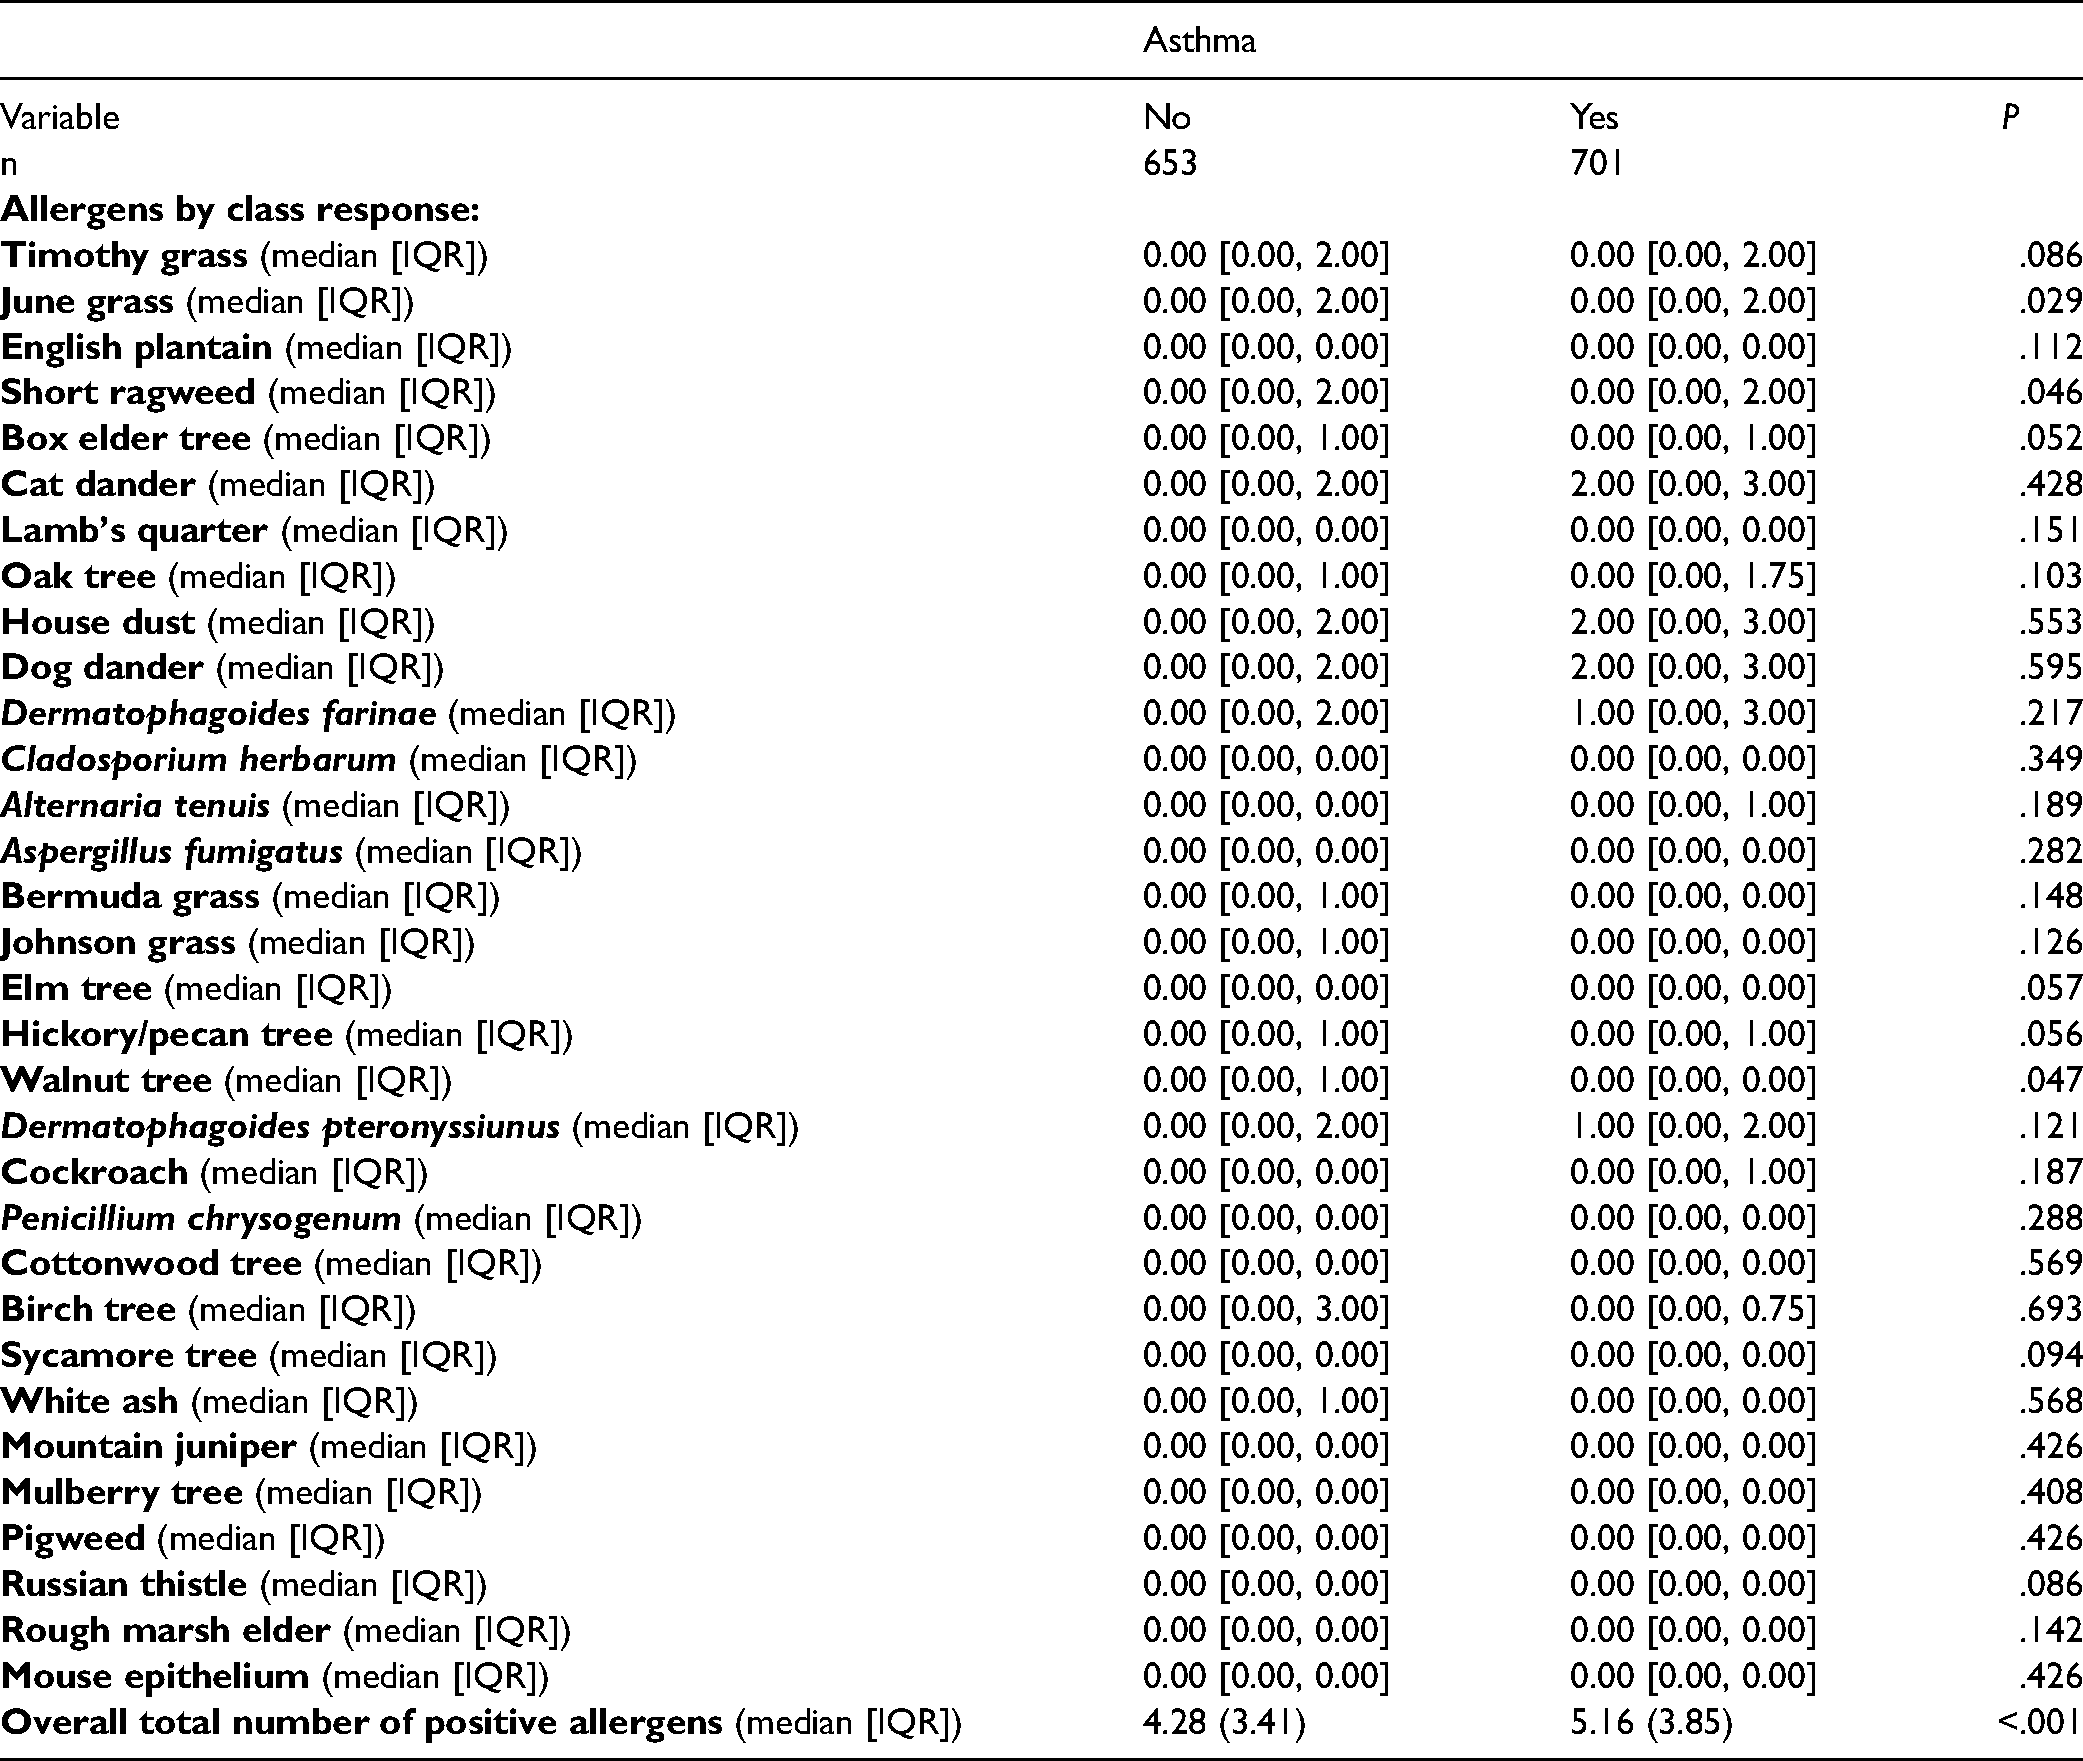
The median number of class responses for such as June grass, short ragweed, box elder tree, elm tree, and hickory/pecan tree was significantly higher for the asthma cohort when compared to the non-asthmatic cohort (P < .05) (Table 3). The median response to a walnut tree was higher for the non-asthmatic cohort (P < .05) (Table 3). Overall the average number of positive allergen classes was higher among the patients diagnosed with asthma 5.16 versus 4.28 (P < .001) (Table 3). This cohort showed a higher percentage of patients diagnosed with chronic sinusitis and nasal polyps. Allergic dermatitis, allergic conjunctivitis, and aspirin sensitivity were not statistically different between cohorts.
For treatment categories, 93.2% of the asthma patients were on short-acting beta2 agonists, 80.7% received inhaled corticosteroids, 46.4% oral corticosteroids, 52.1% leukotriene modifiers, 12% anticholinergics, 7.8% long-acting beta2 agonists, 1.3% oral methylxanthines, 6.1% immunomodulators anti-IgE, and 0.7% cromolyn. There was no difference on the number of patients who received allergy injections or immunotherapy between groups.
Within each allergen measured, the majority of the patients who tested positive had a concomitant diagnosis of asthma and allergic rhinitis (AR), followed by patients with a sole diagnosis of AR (Figure 1).
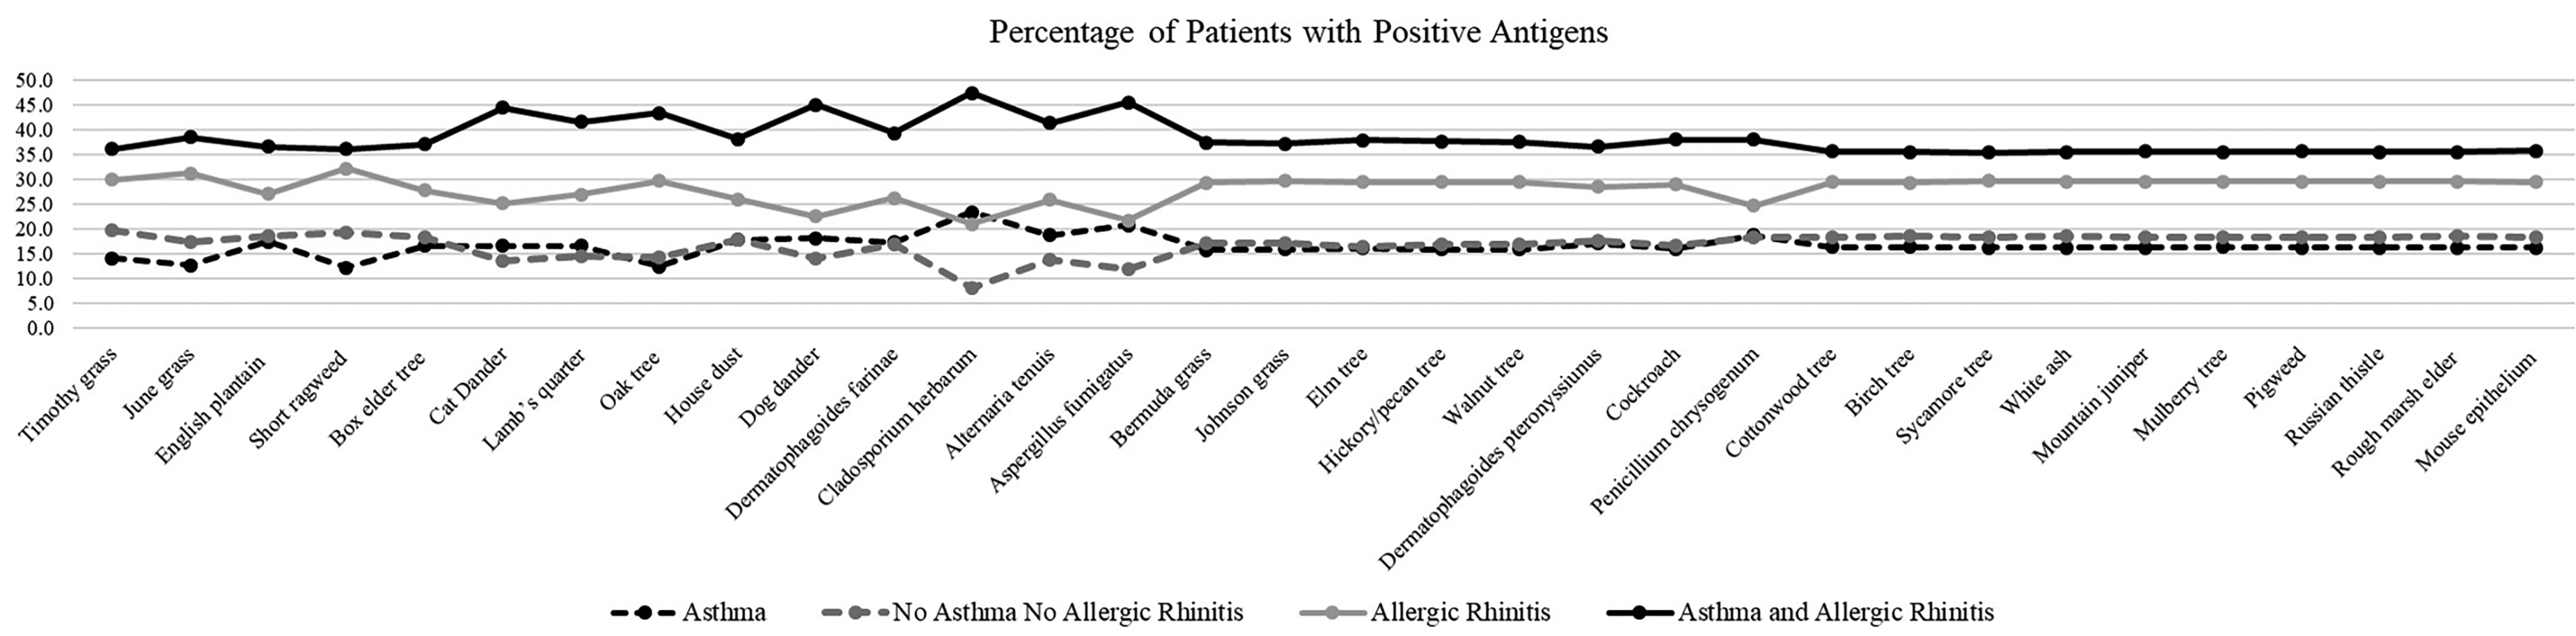
Percentage of patients who tested positive within each allergen group type divided by asthma diagnosis status (positive/negative), and allergic rhinitis diagnosis status (positive/negative).
For both patients with and without an asthma diagnosis, and those with and without steroids, there was a strong positive correlation (P < .001) between the average number of class response per antigen and the total number of antigens a patient was positive to (Figure 2). We found a statistically significant difference between the average number of classes response for patients with and without asthma (P < .001), and those with and without steroids (P < .001). Additionally, the difference between the number of antigens for patients with and without asthma, with and without steroids was also statistically significant (P < .001) and (P < .001), respectively.
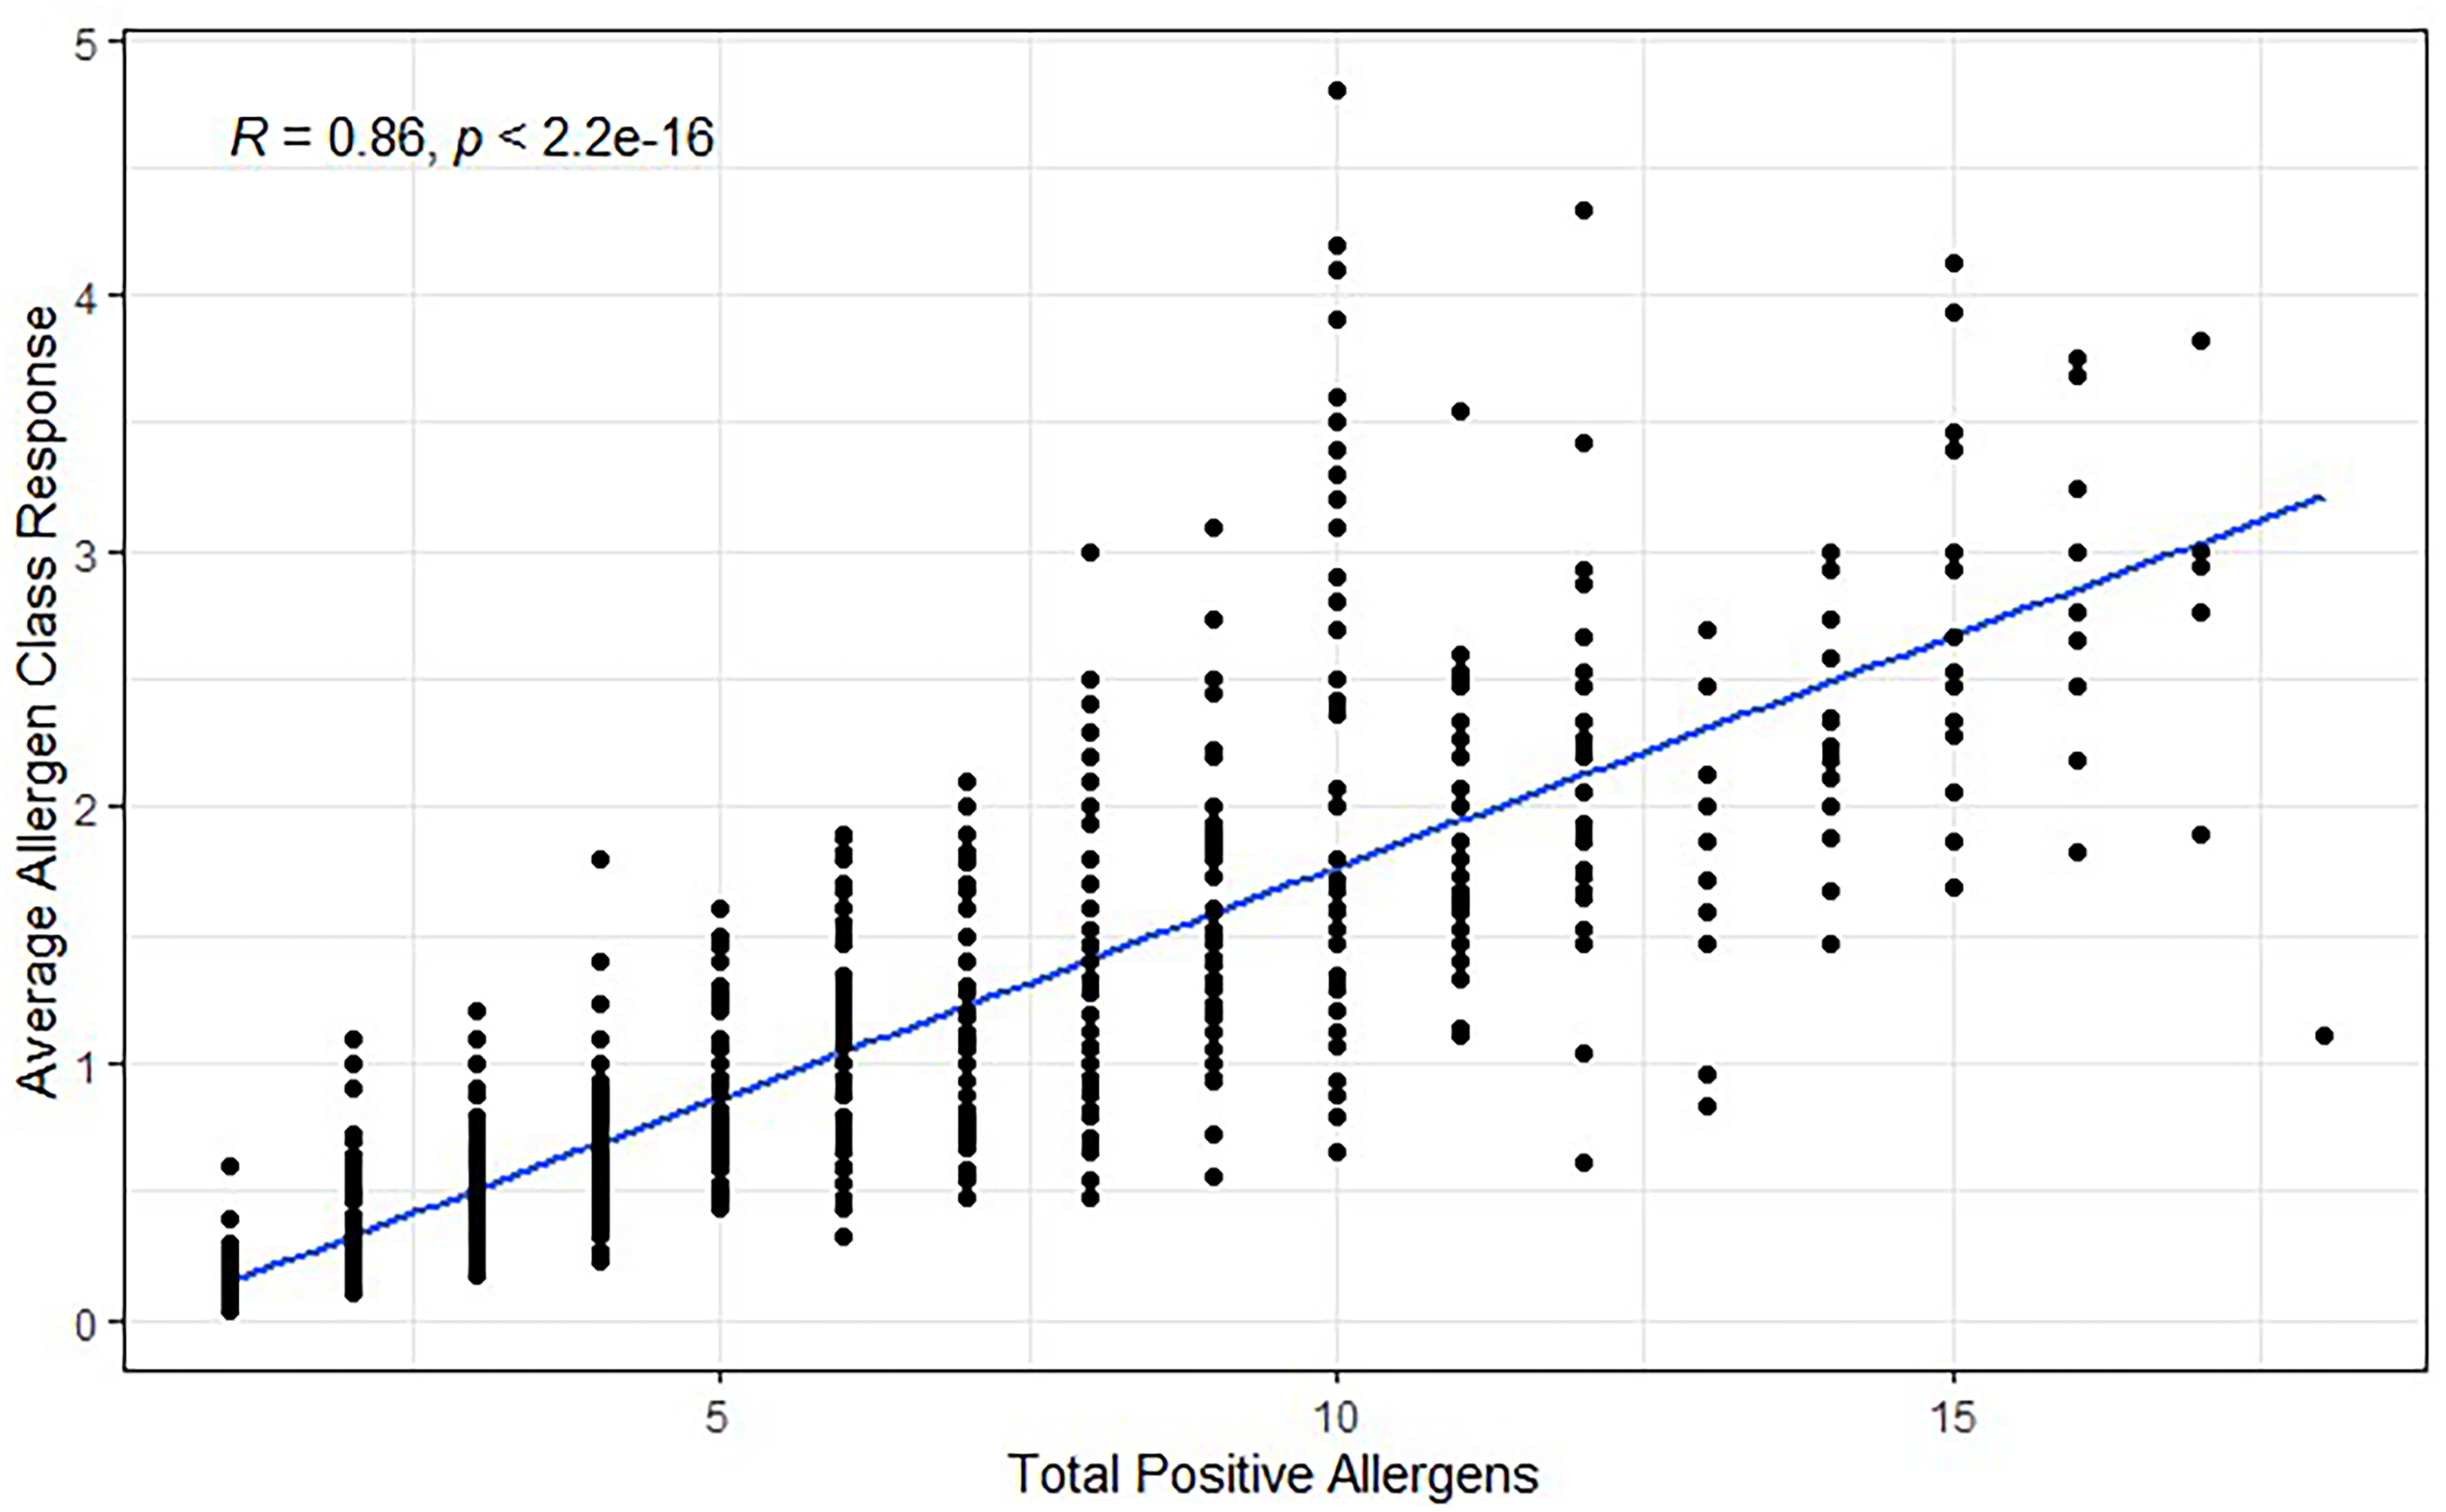
Correlation between the total number of antigens and the average class response per antigen a patient is positive to. R denotes a strong positive correlation between the positive number of allergens and the average class response.
Seasonal Allergens and Diagnosis of Asthma
Univariate logistic regression revealed that the odds of a positive diagnosis of asthma were higher for patients positive for oak tree 1.28 (1.01-1.62, P = .040), lamb's quarter 1.50 (1.14-1.97, p = .004), Cladosporium herbarum 2.70 (1.89-3.93, P < .001), Alternaria tenuis 1.59 (1.24-2.06, P < .001), Aspergillus fumigatus 2.21 (1.50-3.31, P < .001), or Penicillium chrysogenum 2.96 (1.70-5.42, P < .001). Additionally, the positivity elm tree seemed to be associated with reduced odds of a diagnosis of asthma, 0.17 (0.03-0.62, P = .020). The rest of the seasonal allergens were not statistically significant or unable to be calculated due to the sample size (Supplemental Table 1).
Perennial Allergens and Diagnosis of Asthma
Univariate logistic regression of perennial allergens revealed that the odds of a positive diagnosis of asthma were higher for cat dander 2.15 (1.73-2.67, P < .001), house dust 2.25 (1.67-3.03, P < .001), dog dander 2.54 (2.04-3.17, P < .001), and Dermatophagoides farinae 1.47 (1.19-1.82, P < .001). Additionally, positivity to cockroaches was found to be associated with reduced odds of a diagnosis of asthma 0.17 (0.03-0.64, P = .023). The rest of the allergens are significant or unable to be calculated due to the sample size (Supplemental Table 1).
Allergens and Diagnosis of Allergic Rhinitis With and Without Asthma
Unique allergens found to increase the odds of a diagnosis of asthma were the seasonal allergen lamb's quarter 1.50 (1.14-1.97, P = .004), as well as perennial allergens, house dust 2.25 (1.67-3.03, P < .001), dog dander 2.54 (2.04-3.17, P < .001), Dermatophagoides farinae 1.47 (1.19-1.82, P < .001), Cladosporium herbarum 2.70 (1.89-3.93, P < .001), Alternaria tenuis 1.59 (1.24-2.06, P < .001), and Aspergillus fumigatus 2.21 (1.50-3.31, P < .001).
Furthermore, positivity to cat dander (2.15 [1.73-2.67, P < .001], 1.62 [1.17-2.24, P = .003]) and oak tree (1.28 [1.01-1.62, P = 0.040], 1.93 [1.34-2.80, p < .001]), increased the odds of a diagnosis of both asthma, and asthma with AR, respectively.
However, positivity to timothy grass was 1.77 (1.24-2.56, P = .002), June grass 1.90 (1.36-2.66, P < .001), or short ragweed 1.56 (1.10-2.22, P = .014), show increased odds to the diagnosis of asthma with AR; this finding was unique to this cohort. Positivity to timothy grass, June grass, or short ragweed did not increase the odds of diagnosis of asthma or AR alone.
We found that allergen positivity did not increase the odds of AR alone. The rest of the analysis can be found in Supplemental Table 1.
Asthma Severity by Allergen Positivity
Results from severity measures by allergen positivity for the asthmatic cohort can be found in Supplemental Table 2. Overall, asthmatic patients with a positive test for perennial allergens such as cat dander 2.13 (OR) (1.24, 3.82) [95% CI], dog dander 3.01 (1.69, 5.72), or house dust 5.05 (1.74, 21.4) had increased odds of hospitalizations; whereas for seasonal allergens, increased odds held only for those positive to lamb's quarter 2.10 (1.22, 3.55).
The likelihood of ED visits for this cohort was associated with 4 perennial allergens: dog dander 1.70 (1.07, 2.79), Dermatophagoides farinae 1.66 (1.05, 2.64), and Cladosporium herbarum 1.80 (1.04, 3.02), and with 2 seasonal allergens: walnut tree 8.52 (1.03, 58.3), and Lamb's quarter 2.11 (1.30, 3.38).
In regards to clinical visits, seasonal allergens associated with increased odds of having more than 4 visits a month were: June grass 1.79 (1.14, 2.85), oak tree 2.01 (1.20, 3.50), and English plantain 2.16 (1.04, 5.10). However, the only perennial allergen associated with increased clinic visits was cat dander 1.66 (1.08, 2.57).
Increased odds of oral steroid use were found in patients positive for the following perennial allergens: cat dander 1.42 (1.05, 1.92), dog dander 1.51 (1.11, 2.05), and Cladosporium herbarum 1.50 (1.00, 2.24), and for one seasonal allergen: Alternaria tenuis 1.62 (1.17, 2.26).
Additionally, increase odds of the need to use 2 or more medications to achieve asthma control were found for positivity to 3 perennial allergens: cat dander 1.40 (1.02, 1.94), dog dander 1.55 (1.12, 2.14), and Cladosporium herbarum 1.51 (1.00, 2.27), and only for one seasonal allergen: short ragweed 1.39 (1.00, 1.92).
Asthma Severity by Allergen Classes
The results of the analysis of severity measures by allergen class response for patients with a diagnosis of asthma can be found in Supplemental Table 3. Higher class response for cat dander 1.24 (1.09, 1.41), dog dander 1.29 (1.13, 1.47), lamb's quarter 1.35 (1.06, 1.70), house dust 1.41 (1.11, 1.82), Cladosporium herbarum 1.35 (1.07, 1.67) or cockroach 1.56 (1.00, 2.44) showed increased odds of hospitalizations. Positive specific IgE results for lamb's quarter 1.36 (1.10, 1.68), house dust 1.13 (1.00, 1.26), and Cladosporium herbarum 1.35 (1.09, 1.65) were associated with ED visits.
Interestingly an increase in the class of response for Timothy grass was 1.22 (1.03, 1.48), June grass 1.24 (1.06, 1.47), Oak tree 1.28 (1.06, 1.59), and English plantain 1.56 (1.07, 2.53) were associated with increasing odds of clinic visits.
Higher class response to cat dander 1.14 (1.04, 1.24), dog dander 1.16 (1.07, 1.26), Cladosporium herbarum 1.26 (1.07, 1.51), or Alternaria tenuis 1.15 (1.02, 1.30) was associated with increasing odds of use of oral corticosteroids.
Increased odds for the use of 2 or more medications to control exacerbations were found in an increase in class response for short ragweed 1.15 (1.01, 1.31), cat dander 1.18 (1.08, 1.29), dog dander 1.16 (1.06, 1.26), Dermatophagoides farinae 1.09 (1.00, 1.19), Cladosporium herbarum 1.29 (1.09, 1.53), or Aspergillus fumigatus 1.27 (1.03, 1.58).
Discussion
Asthma is considered a multifactorial disease. 7 Previous work has demonstrated that allergic sensitization can impact the overall morbidity of asthma including the frequency of exacerbations as well as the overall economic burden of the disease. 1 Improvement in in-vitro IgE testing accuracy have allowed for better assessment of the influence of allergy on asthma severity. 15 Moreover, the use of this diagnostic tool to identify asthmatic phenotypes and endotypes will open the path toward personalized treatment approaches in the asthmatic population.7,16
The influence of specific IgE antigens in asthmatic patients has been explored individually in the literature; however, the identification of multiple phenotyping antigens and antigen classes has not been studied in the same cohort.17,18 In this study, we found that patients with severe asthma had higher positivity rates not only to the number of allergens but also to a higher allergen class response. Patients with a positive IgE test for cat dander, dog dander, lamb's quarter, or house dust, showed increased odds of hospitalizations. Additionally, an increase in class response for the afore-mentioned antigens as well as for Cladosporium herbarum and cockroach also increased the odds of hospitalization.
Allergen IgE phenotyping may allow healthcare providers to identify the risk of a diagnosis of asthma or asthma with concomitant AR. These tests may also allow for personalized treatment in patients with a diagnosis of asthma or asthma with AR, helping to identify patients at risk for more severe asthma that will require more intensive treatment. 19 Further, personalized targeted treatments should decrease asthma exacerbations and the overall economic burden of the disease.
Allergic IgE phenotype recognition among both specialists and primary care providers has the potential to facilitate the creation of patient-specific targeted treatment approaches, particularly in patients at risk for more complicated or difficult to control asthma, which might require rescue mediations or hospitalization. Additionally, this may lead to a reduction in asthma morbidity.
Among the limitations of this study were the inabilities to compare hospitalizations, ED visits, and clinical visits with the nonasthmatic cohort. The influence of demographic characteristics or compliance to treatment in impacting severity was not evaluated in this study. It was not possible to give a specific class cutoff for severity other than to state that a higher in-vitro class, even in the moderate range, is a predictor of greater severity based on the criteria of severity assigned. Additionally, due to the multiple variations of allergic endotypes in the asthmatic population, an adjusted logistic regression was not performed. The sample size of some of the antigens was not large enough to perform statistical analysis. The study began utilizing reported classes from the laboratory. As there has been a shift to reporting specific IgE levels, we were unable to convert all of the results to specific IgE levels, but rather continued to report them as a class response.
Conclusion
In this study, we found a correlation not only between positivity to allergens but also to allergen classes, and their influence on different allergic groups. This is important because this seems to influence not only the diagnosis of asthma but also the need for the use of corticosteroids and identify more severe disease. The creation of personalized predictive phenotype models will improve the accuracy of diagnosis and treatment in patients with allergic disease, and more specifically in those patients with asthma diagnosis.
Supplemental Material
sj-docx-1-ajr-10.1177_19458924221112316 - Supplemental material for Phenotypes of Allergic Asthma: Does In-Vitro Allergy Testing Help Predict Asthma Disease Severity?
Supplemental material, sj-docx-1-ajr-10.1177_19458924221112316 for Phenotypes of Allergic Asthma: Does In-Vitro Allergy Testing Help Predict Asthma Disease Severity? by Michael S. Benninger, Claudia I. Cabrera, Eulalia M. Amador, Kevin Grafmiller and Raj Sindwani in American Journal of Rhinology & Allergy
Footnotes
Author Contributions
Michael S. Benninger, lead author, study design, writing and editing; Claudia I. Cabrera, data acquisition, study design, data analysis, writing and editing; Eulalia M. Amador, data acquisition, study design, writing and editing; Kevin Grafmiller, study design, writing and editing; Raj Sindwani, study design, writing, and editing.
Declaration of Conflicting Interests
The authors declared the following potential conflicts of interest with respect to the research, authorship, and/or publication of this article: Dr Benninger is now a consultant to Thermo Fisher Scientific but was not until after the completion of this study. He also is a consultant for Shionogi Pharmaceuticals and Astra-Zeneca. These are not relevant to this study. Dr Sindwani is a consultant for Styrker, Acclarent, and Optinose, and receives royalties/payment from Elsevier and Sage Publications (Editor-in-Chief of American Journal of Rhinology and Allergy). These are not relevant to this article. The other authors deny any conflicts of interest.
Funding
The authors disclosed receipt of the following financial support for the research, authorship, and/or publication of this article: This work was supported by Thermo-Fisher Scientific
Supplemental Material
Supplemental material for this article is available online.
References
Supplementary Material
Please find the following supplemental material available below.
For Open Access articles published under a Creative Commons License, all supplemental material carries the same license as the article it is associated with.
For non-Open Access articles published, all supplemental material carries a non-exclusive license, and permission requests for re-use of supplemental material or any part of supplemental material shall be sent directly to the copyright owner as specified in the copyright notice associated with the article.