
Abstract
Background
Airway remodeling is demonstrated in Asian patients with allergic rhinitis (AR). The epithelial–mesenchymal transition (EMT) is one of the key mechanisms underlying airway remodeling. Thymic stromal lymphopoietin (TSLP) is an important contributor to airway remodeling. Although increased TSLP is found in AR, little is known about whether TSLP is involved in airway remodeling through induction of the EMT.
Objective
We investigated the effect of TSLP on the EMT in human nasal epithelial cells (HNECs) from AR patients.
Methods
Human nasal epithelial cells from AR patients were stimulated with TSLP in the absence or presence of the preincubation with a selective inhibitor of transforming growth factor beta 1 (TGF-β1) receptor (SB431542). The expression of TGF-β1 in the cells was evaluated by using real-time polymerase chain reaction, Western blotting, and immunocytochemistry. Western blotting and immunocytochemistry were used to assay EMT markers including vimentin, fibroblast-specific protein 1 (FSP1) and E-cadherin, small mothers against decapentaplegic homolog2/3 (Smad2/3), and phosphorylated Smad2/3 in the cells. The levels of extracellular matrix components such as collagens I and III in supernatants were measured by enzyme-linked immunoassay. Morphological changes of the cells were observed under inverted phase-contrast microscope.
Results
A concentration-dependent increase of TGF-β1 mRNA and protein was observed following stimulation with TSLP. Furthermore, TSLP decreased the expression of E-cadherin protein, but upregulated the production of FSP1 and vimentin proteins along with increased levels of collagens I and III, and the morphology of the cells was transformed into fibroblast-like shape. Additionally, a significant increase was found in phosphorylation of Smad2/3 protein. However, these effects were reversed by SB431542 preincubation.
Conclusion
TSLP–induced HNECs to undergo the EMT process via TGF-β1-mediated Smad2/3 activation. TSLP is an activator of the EMT in HNECs and might be a potential target for inhibiting EMT and reducing airway remodeling in AR.
Keywords
Introduction
Allergic rhinitis (AR) is the most frequent allergic disorder that generates a significant healthcare burden in adults, adolescents, and children. 1 Over the past few decades, a rising trend of AR has been observed in developing countries including China. 2 Although the mechanisms underlying the pathology and treatment of AR have been widely studied, many aspects remain unclear and warrant further investigations. 3
Under the concept of “united airways disease,” AR and asthma are viewed as arising from a common atopic entity because of their similar epidemiology, pathophysiology, and treatment. 4 Airway remodeling is one of the main pathological features of asthma, resulting in structural changes of airway walls, and is correlated with severe asthma. 5 Structural changes of upper airway also occur in AR, but there is much debate about whether such remodeling occurs in AR.6,7 Recently, nasal remodeling has been found in Asian patients with AR, including Chinese and Korean,8,9 even though the pathologic extent of the remodeling seems to be less extensive than that in the bronchi of asthmatic patients. 7 Furthermore, airway remodeling is demonstrated in experimental AR with murine, rat, and guinea pig. 10 - 12 However, the demonstration of the factors contributing to nasal remodeling of AR patients is lacking because of the paucity of studies.
Epithelial–mesenchymal transition (EMT) is a typical pathological change of airway remodeling. 13 The EMT refers to a phenomenon in which epithelial cells lose cell-to-cell adhesion and apical-basal polarity and transform into mesenchymal cells with an ability of producing extracellular matrix (ECM).14,15 As a result, epithelial markers such as E-cadherin are decreased, whereas mesenchymal markers including vimentin and fibroblast-specific protein 1 (FSP1) are increased, contributing to airway remodeling.16,17 Inhibition of the EMT ameliorates ovalbumin-induced airway remodeling in mice. 18 Recent evidence has shown that the EMT reduces the expression of anti-inflammatory genes induced by glucocorticoids in human lung epithelial cells, causing steroid insensitivity, and is related to refractory asthma.17,19 Hence, targeting EMT is a promising strategy against tissue remodeling of airway diseases.
Mechanistic studies have shown that the EMT is initiated by a variety of agents linked to chronic inflammation, including oxidative stress, growth factors, and cytokines. 20 - 22 Thymic stromal lymphopoietin (TSLP) is a crucial pro-inflammatory cytokine that affects multiple cell lineages involved in allergic reactions and is identified as a master switch for airway inflammation.23,24 Proof from animal model and in vitro study supports that TSLP acts as a critical factor involved in asthmatic airway remodeling.25,26 Furthermore, macrophage-secreted TSLP participates in the EMT process of mouse alveolar epithelial cells and promotes pulmonary fibrosis. 27 Stimulation with TSLP induces the EMT in human bronchial epithelial cells. 28 Based on the cross-talk between T helper (Th)2 inflammation and cancers, TSLP could induce the EMT to promote cancer metastasis. 29 Although increased TSLP expression is demonstrated in the nasal mucosa of AR patients, little is known about whether TSLP is involved in airway remodeling in AR through induction of the EMT, and few studies have assessed the effect of TSLP on the EMT of nasal epithelial cells in AR. 30
Multiple signaling transduction pathways centered on transforming growth factor beta 1 (TGF-β1) participate in the EMT process of most epithelial cell types.31,32 In this study, we hypothesized that TSLP induced the EMT in nasal epithelial cells via TGF-β1 signaling in AR. To test this hypothesis, human nasal epithelial cells (HNECs) from AR patients were used as an in vitro model following stimulation with TSLP in the absence or presence of the preincubation with a selective inhibitor of TGF-β1 receptor (SB431542). We investigated whether and how TSLP orchestrated the EMT process of HNECs from AR patients.
Materials and Methods
Cell Culture and Stimulation
This study was approved by the local ethics committee of the Institutional Review Board of Huzhou University (No: hz2018121) and was performed on 56 patients in the Department of Head and Neck Surgery of Huzhou Central Hospital from December 2018 to December 2022. These patients were diagnosed with persistent AR complicated with turbinate hypertrophy according to the Allergic Rhinitis and its Impact on Asthma (ARIA) guidelines. 33 Their ages ranged from 18 to 48 years old. The inclusion criteria were as follows: a diagnosis of persistent AR for at least 2 years, positive results of skin prick test, specific symptoms of AR. They had not received the treatment with intranasal or oral glucocorticoids and antibiotics for at least 4 weeks before the surgery. Subject characteristics are shown in Table 1.
Demographic and Clinical Characteristics of the Patients in This Study.
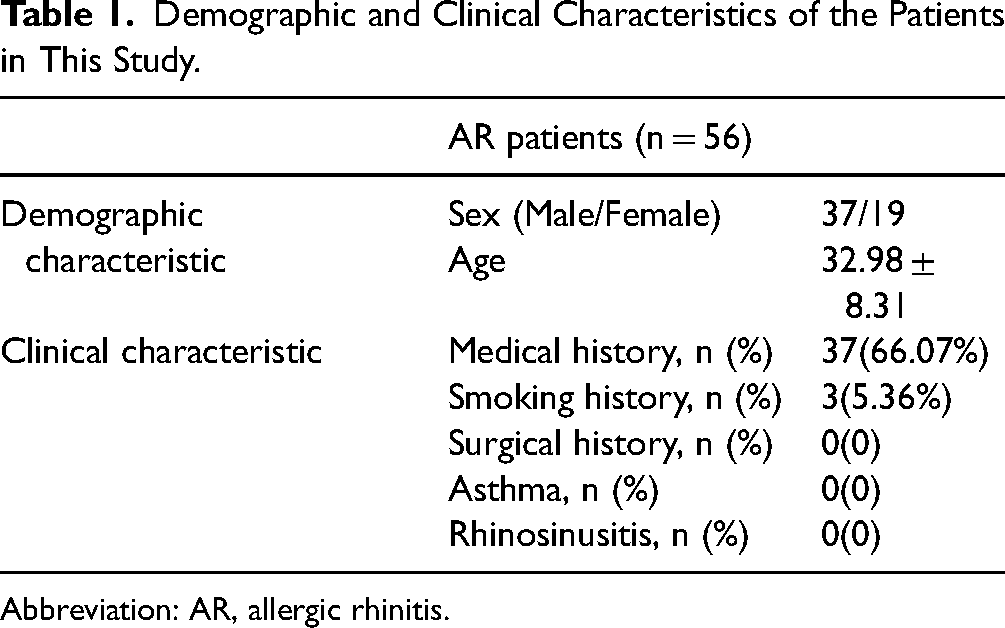
Abbreviation: AR, allergic rhinitis.
The mucosal tissues on the inferior turbinates of the patients were collected during endoscopic nasal surgery and were digested in 0.01% Collagenase I (4A Biotech Co, Ltd). The primary nasal epithelial cells were cultured according to published study. 34 The confluent cells were stimulated with different concentrations of recombinant human TSLP (0, 1.0, 10.0, 100.0 µg/mL; Beyotime) for 48 h. A selective inhibitor of TGF-β1 receptor SB431542 (100.0 ng/mL; Beyotime) was applied one hour prior to the stimulation with 100.0 µg/mL of TSLP. Based on previous study, optimal concentrations and incubation times of TSLP and SB431542 were chosen. 28
Real-Time Polymerase Chain Reaction
Total RNA from the cells was extracted by using TRIzol Reagent (Beyotime); 1 μg of total RNA was used to synthesize cDNA using a reverse transcriptional kit (Fermentas Inc). The level of specific RNAs was quantified by using the Platinum® SYBR® Green qPCR Super Mix-UDG kit (Invitrogen Corporation) in a real-time thermal cycler (ABI7500, Applied Biosystems). The primers are as follows: TGF-β1 5′-ATGAACTCATTCAGTCACCATAGC-3′, 5′-CTATCCCCCACTAAAGCAGG-3′; β-actin 5′-ACCGTGAAAAGATGACCCAGAT-3′, 5′-AGCT- GTGGTGGTGAAGCTGTAG-3′. The mean cycle threshold (CT) from control group was used as the calibrator. The equation used was: ratio (sample to calibrator) = 2(-△△CT), where △CT = CT(goal gene) -CT (reference gene), and △△CT=△CT (sample) -△CT (calibrator).
Immunocytochemistry
The cells were fixed in a 4% paraformaldehyde solution. Intrinsic peroxidase activity was blocked with H2O2, and then nonspecific antibody binding was blocked with nonimmune serum. The cells were incubated overnight at 4 °C with a 1:100 dilution of rabbit anti-TGF-β1 antibody (Abcam), a 1:100 dilution of rabbit anti-E-cadherin antibody (Biosynthesis Biotechnology Co, Ltd), a 1:100 dilution of rabbit anti-vimentin antibody (Biosynthesis), a 1:100 dilution of rabbit anti-FSP1 antibody (Abcam), a 1:100 dilution of rabbit anti-p-Smad2 antibody (ZEN-BIOSCIENCE), and a 1:100 dilution of rabbit anti-p-Smad3 antibody (ZEN-BIOSCIENCE) before incubation with the corresponding secondary antibody (Beyotime). Finally, they were incubated with diaminobenzidine.
Western Blotting
Total protein from the cells was lysed with RIPA buffer (Beyotime). After denaturation, equal amounts of protein from each sample were separated by SDS-PAGE (Beyotime) and transferred into PVDF membranes (Beyotime). The membranes were incubated with a 1:500 dilution of rabbit anti-TGF-β1 antibody (Bioss), a 1:400 dilution of rabbit anti-p-Smad2 antibody (Boster Biological Technology Co, Ltd), a 1:500 dilution of rabbit anti-p-Smad3 antibody (Boster), a 1:500 dilution of rabbit anti-E-cadherin antibody (Biosynthesis), a 1:800 dilution of rabbit anti-vimentin antibody (Biosynthesis), a 1:300 dilution of rabbit anti-FSP1 antibody (Biosynthesis), a 1:500 dilution of rabbit anti-Smad2 antibody (Biosynthesis), a 1:500 dilution of rabbit anti-Smad3 antibody (Biosynthesis) or a 1:1000 dilution of mouse anti-β-actin antibody (Beyotime), and then were incubated with the corresponding secondary antibody (Beyotime). The band intensity was assayed using Quantity One software (Silk Scientific Corporation).
Enzyme-Linked Immunosorbent Assay (ELISA)
The levels of collagens I and III in culture supernatants were measured by using an ELISA kit (Abcam). The procedures were performed according to the manufacturer's instructions. After the reactions, the optical density values were measured at 450 nm by a microplate reader (Bio-Rad).
Cell Morphology
After HNECs were stimulated with TSLP for 48 h in the presence or absence of SB431542 pretreatment one hour before TSLP stimulation, the morphology of the cells was observed under an inverted phase-contrast microscope (Olympus) at a magnification of 400×.
Statistical Analysis
Data analysis was conducted using SPSSS 13.0 software. The data were presented as mean ± standard deviation. All experiments were repeated 8 times, and each experiment was performed in triplicate. Multiple group comparisons were analyzed using a one-way analysis of variance. Two group comparisons were analyzed by using the Tukey-Kramer post-test or Dunnet's test. Statistical significance was defined as a P value <.05.
Results
To investigate the effect of TSLP on the transcriptional regulation of TGF-β1 expression in HNECs, real-time polymerase chain reaction was used to assay the expression of TGF-β1 mRNA (Figure 1A). Compared to 0 mmol/L of TSLP, 1.0, 10.0, and 100.0 µg/mL of TSLP increased the level of TGF-β1 mRNA by 41.00%, 75.91%, and 119.59%, respectively (P < .05). When compared to 1.0 mmol/L of TSLP, 10.0 and 100.0 µg/mL of TSLP upregulated TGF-β1 expression by 24.75%, and 55.74%, respectively (P < .05). Stimulation with 100.0 µg/mL of TSLP led to a 24.83% increase in TGF-β1 mRNA expression compared to 10.0 µg/mL of TSLP (P < .05).
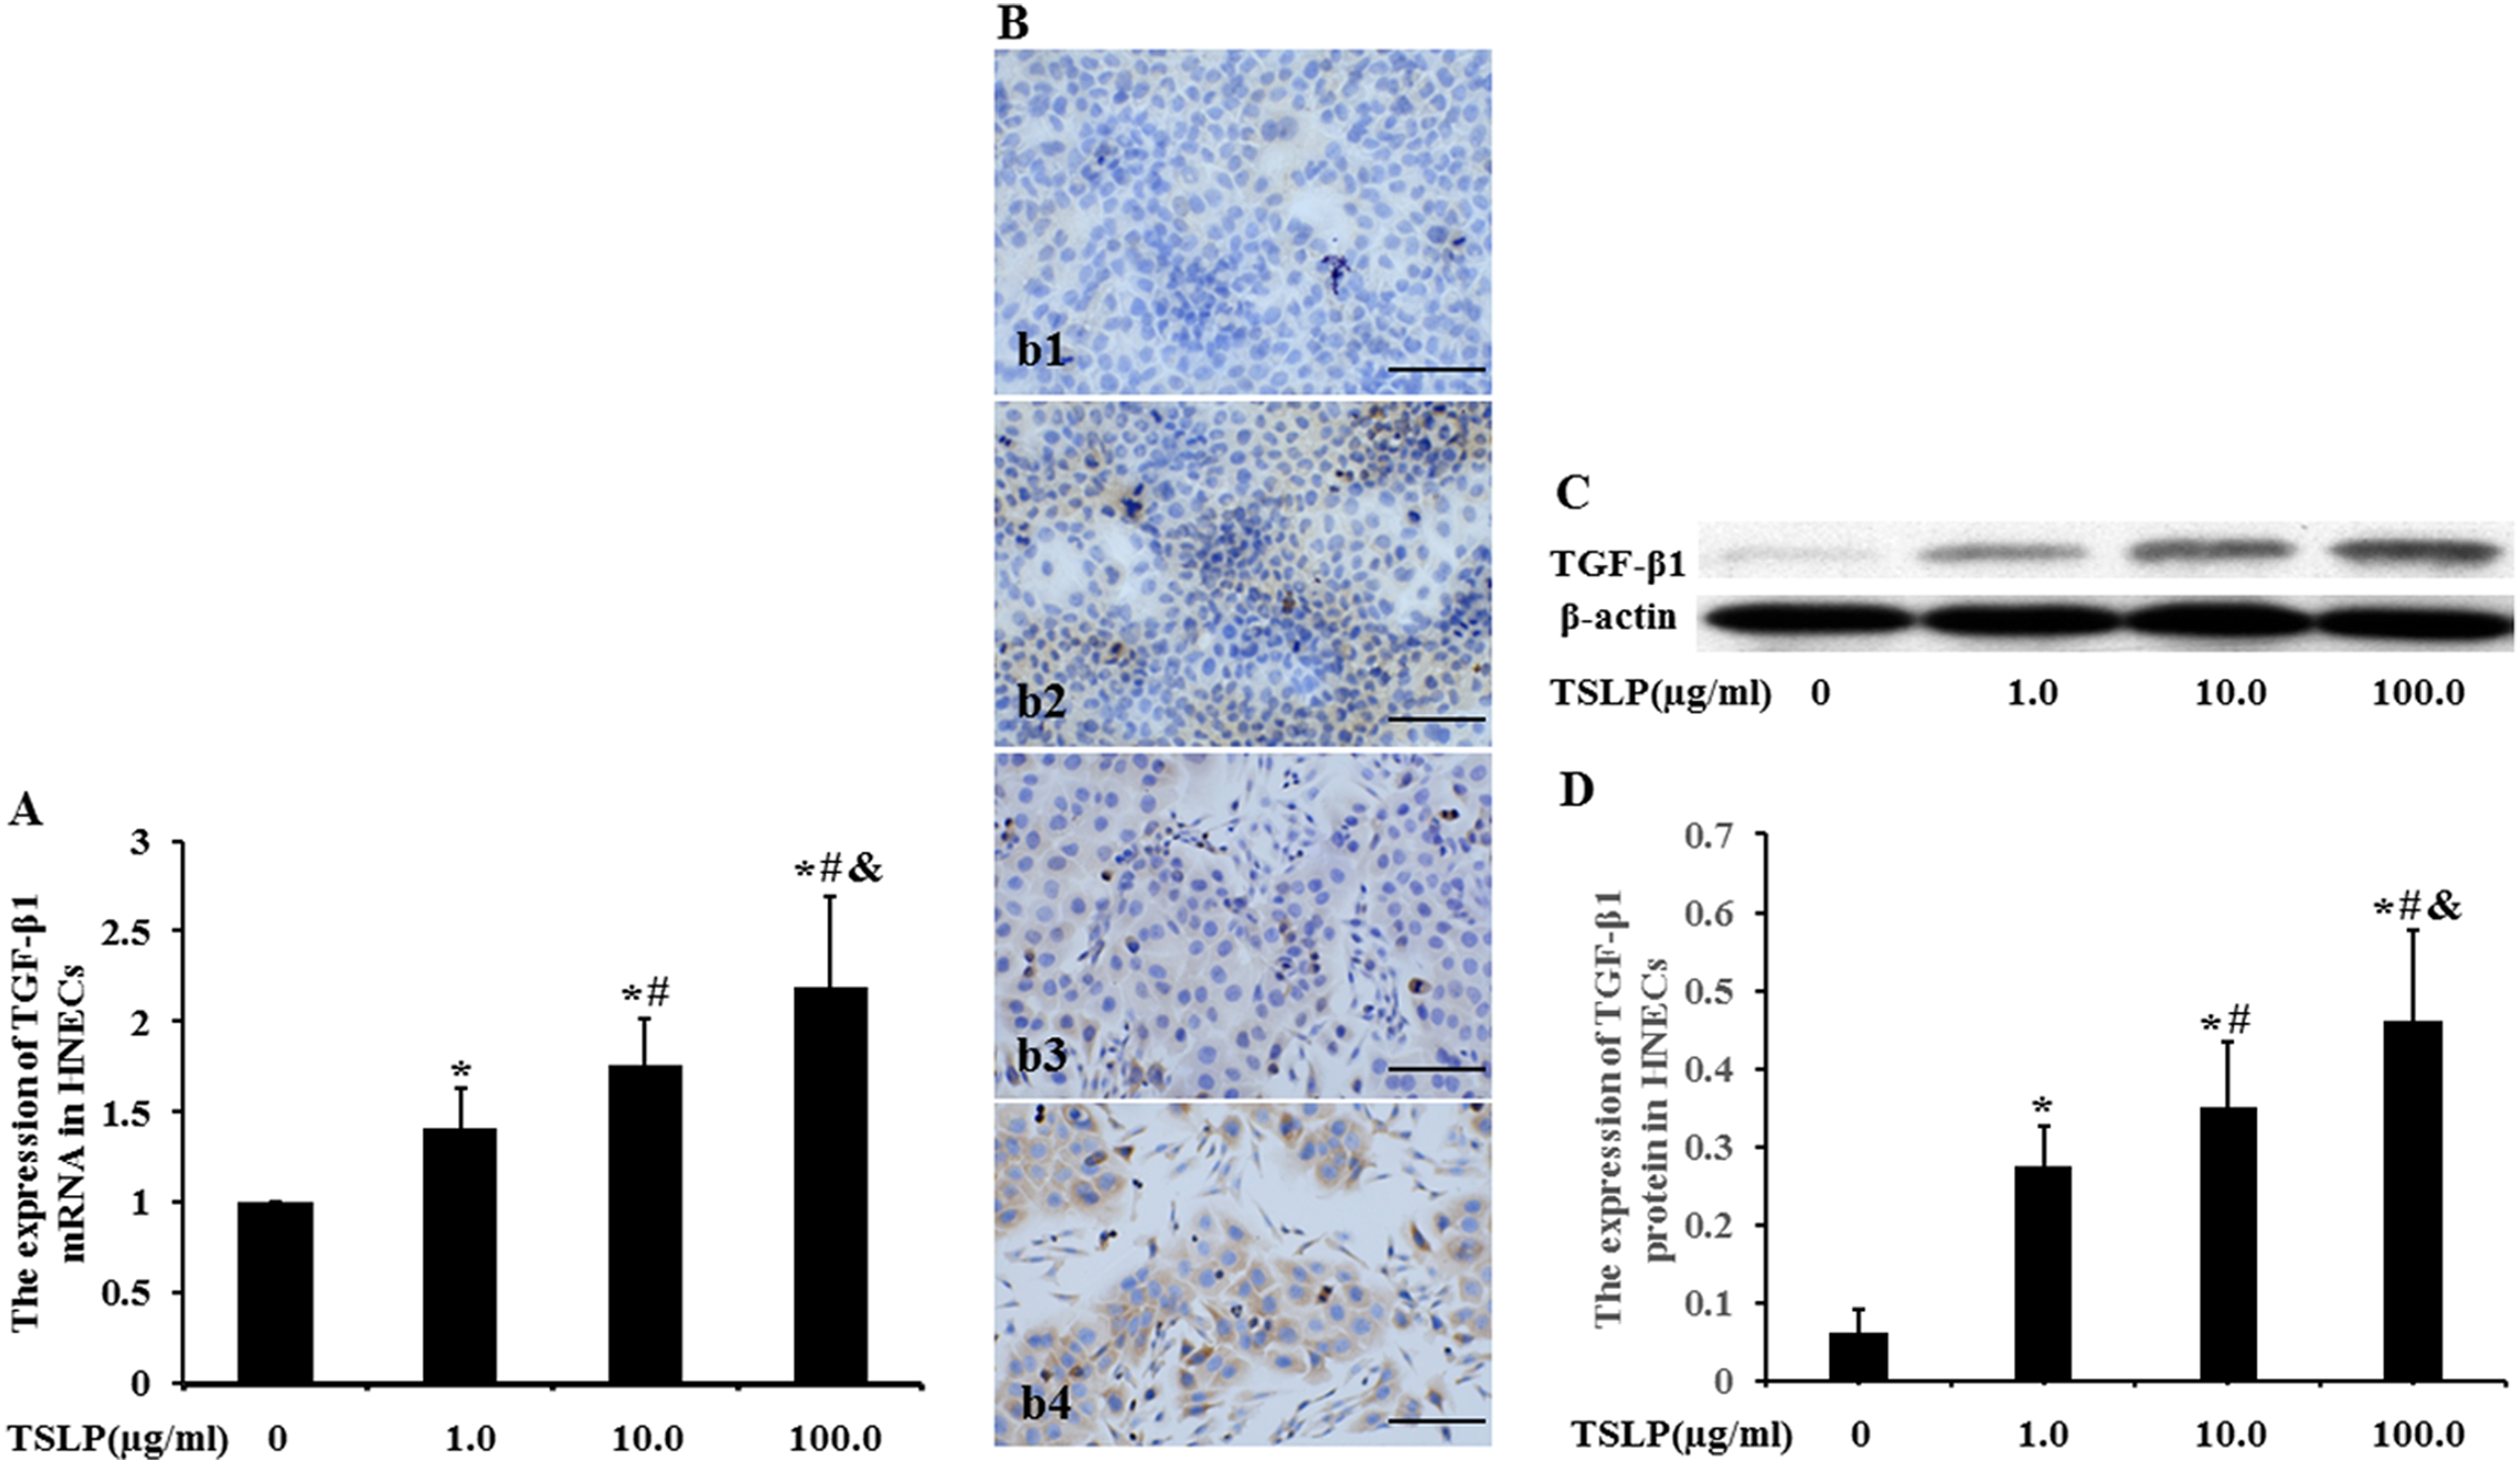
The expression of TGF-β1 mRNA and protein in HNECs. The cells were stimulated with TSLP (0, 1.0, 10.0, and 100.0 µg/mL) for 48 h. The level of TGF-β1 mRNA was determined by real-time polymerase chain reaction (PCR) (A). The location of TGF-β1 protein was detected by immunocytochemistry (B). (b1) Stimulation with 0 µg/mL of TSLP. (b2) Stimulation with 1.0 µg/mL of TSLP. (b3) Stimulation with 10.0 µg/mL of TSLP. (b4) Stimulation with 100.0 µg/mL of TSLP (scale bars = 200 µm). The level of TGF-β1 protein was detected by Western blotting (C and D). β-actin was used as loading control. The intensity of TGF-β1 bands was normalized to the intensity of β-actin bands. The data were presented as mean ± standard deviation (n = 8). *P < .05 versus induction with 0 µg/mL of TSLP, #P < .05 versus induction with 1.0 µg/mL of TSLP, and &P < .05 versus induction with 10.0 µg/mL of TSLP.
The location of TGF-β1 protein was assayed by using immunocytochemistry (Figure 1B). We observed that TGF-β1 protein was expressed in the cytoplasm. The level of TGF-β1 protein was assayed by using Western blotting (Figure 1C). Compared to 0 µg/mL of TSLP, the level of TGF-β1 protein was, respectively, increased by 3.47-fold, 4.70-fold, and 6.49-fold following stimulation with 1.0, 10.0, and 100.0 µg/mL of TSLP (P < .05) (Figure 1D). Compared to 1.0 µg/mL of TSLP, 10.0 and 100.0 µg/mL of TSLP led to a 27.50% and 67.40% increase in TGF-β1 expression, respectively (P < .05); 100.0 µg/mL of TSLP upregulated TGF-β1 protein level by 31.29% compared to 10.0 µg/mL of group.
As shown in the results from Figure 1, TSLP induced the production of TGF-β1 mRNA and protein in a concentration-dependent fashion. The TGF-β1 expression showed a significantly higher level following stimulation with 100.0 µg/mL of TSLP than any other concentration. We hereby chose 100.0 µg/mL as optimal concentration to stimulate HNECs, and assayed epithelial marker E-cadherin and mesenchymal markers such as vimentin and FSP1, investigating the effect of TSLP on the EMT in HNECs.
The location of E-cadherin protein was assayed by using immunocytochemistry (Figure 2A). We observed that E-cadherin protein was expressed in the cell membrane and cytoplasm. The level of E-cadherin protein was assayed by using Western blotting (Figure 2B). There was no difference in the expression of E-cadherin protein between control cells and vehicle-stimulated cells (P > .05) (Figure 2C). The expression of E-cadherin protein in TSLP-stimulated cells was, respectively, decreased by 58.08% and 56.90% compared to that in control cells and vehicle-stimulated cells (P < .05), while the expression induced by SB431542 plus TSLP was increased by 66.22% compared to TSLP alone (P < .05).
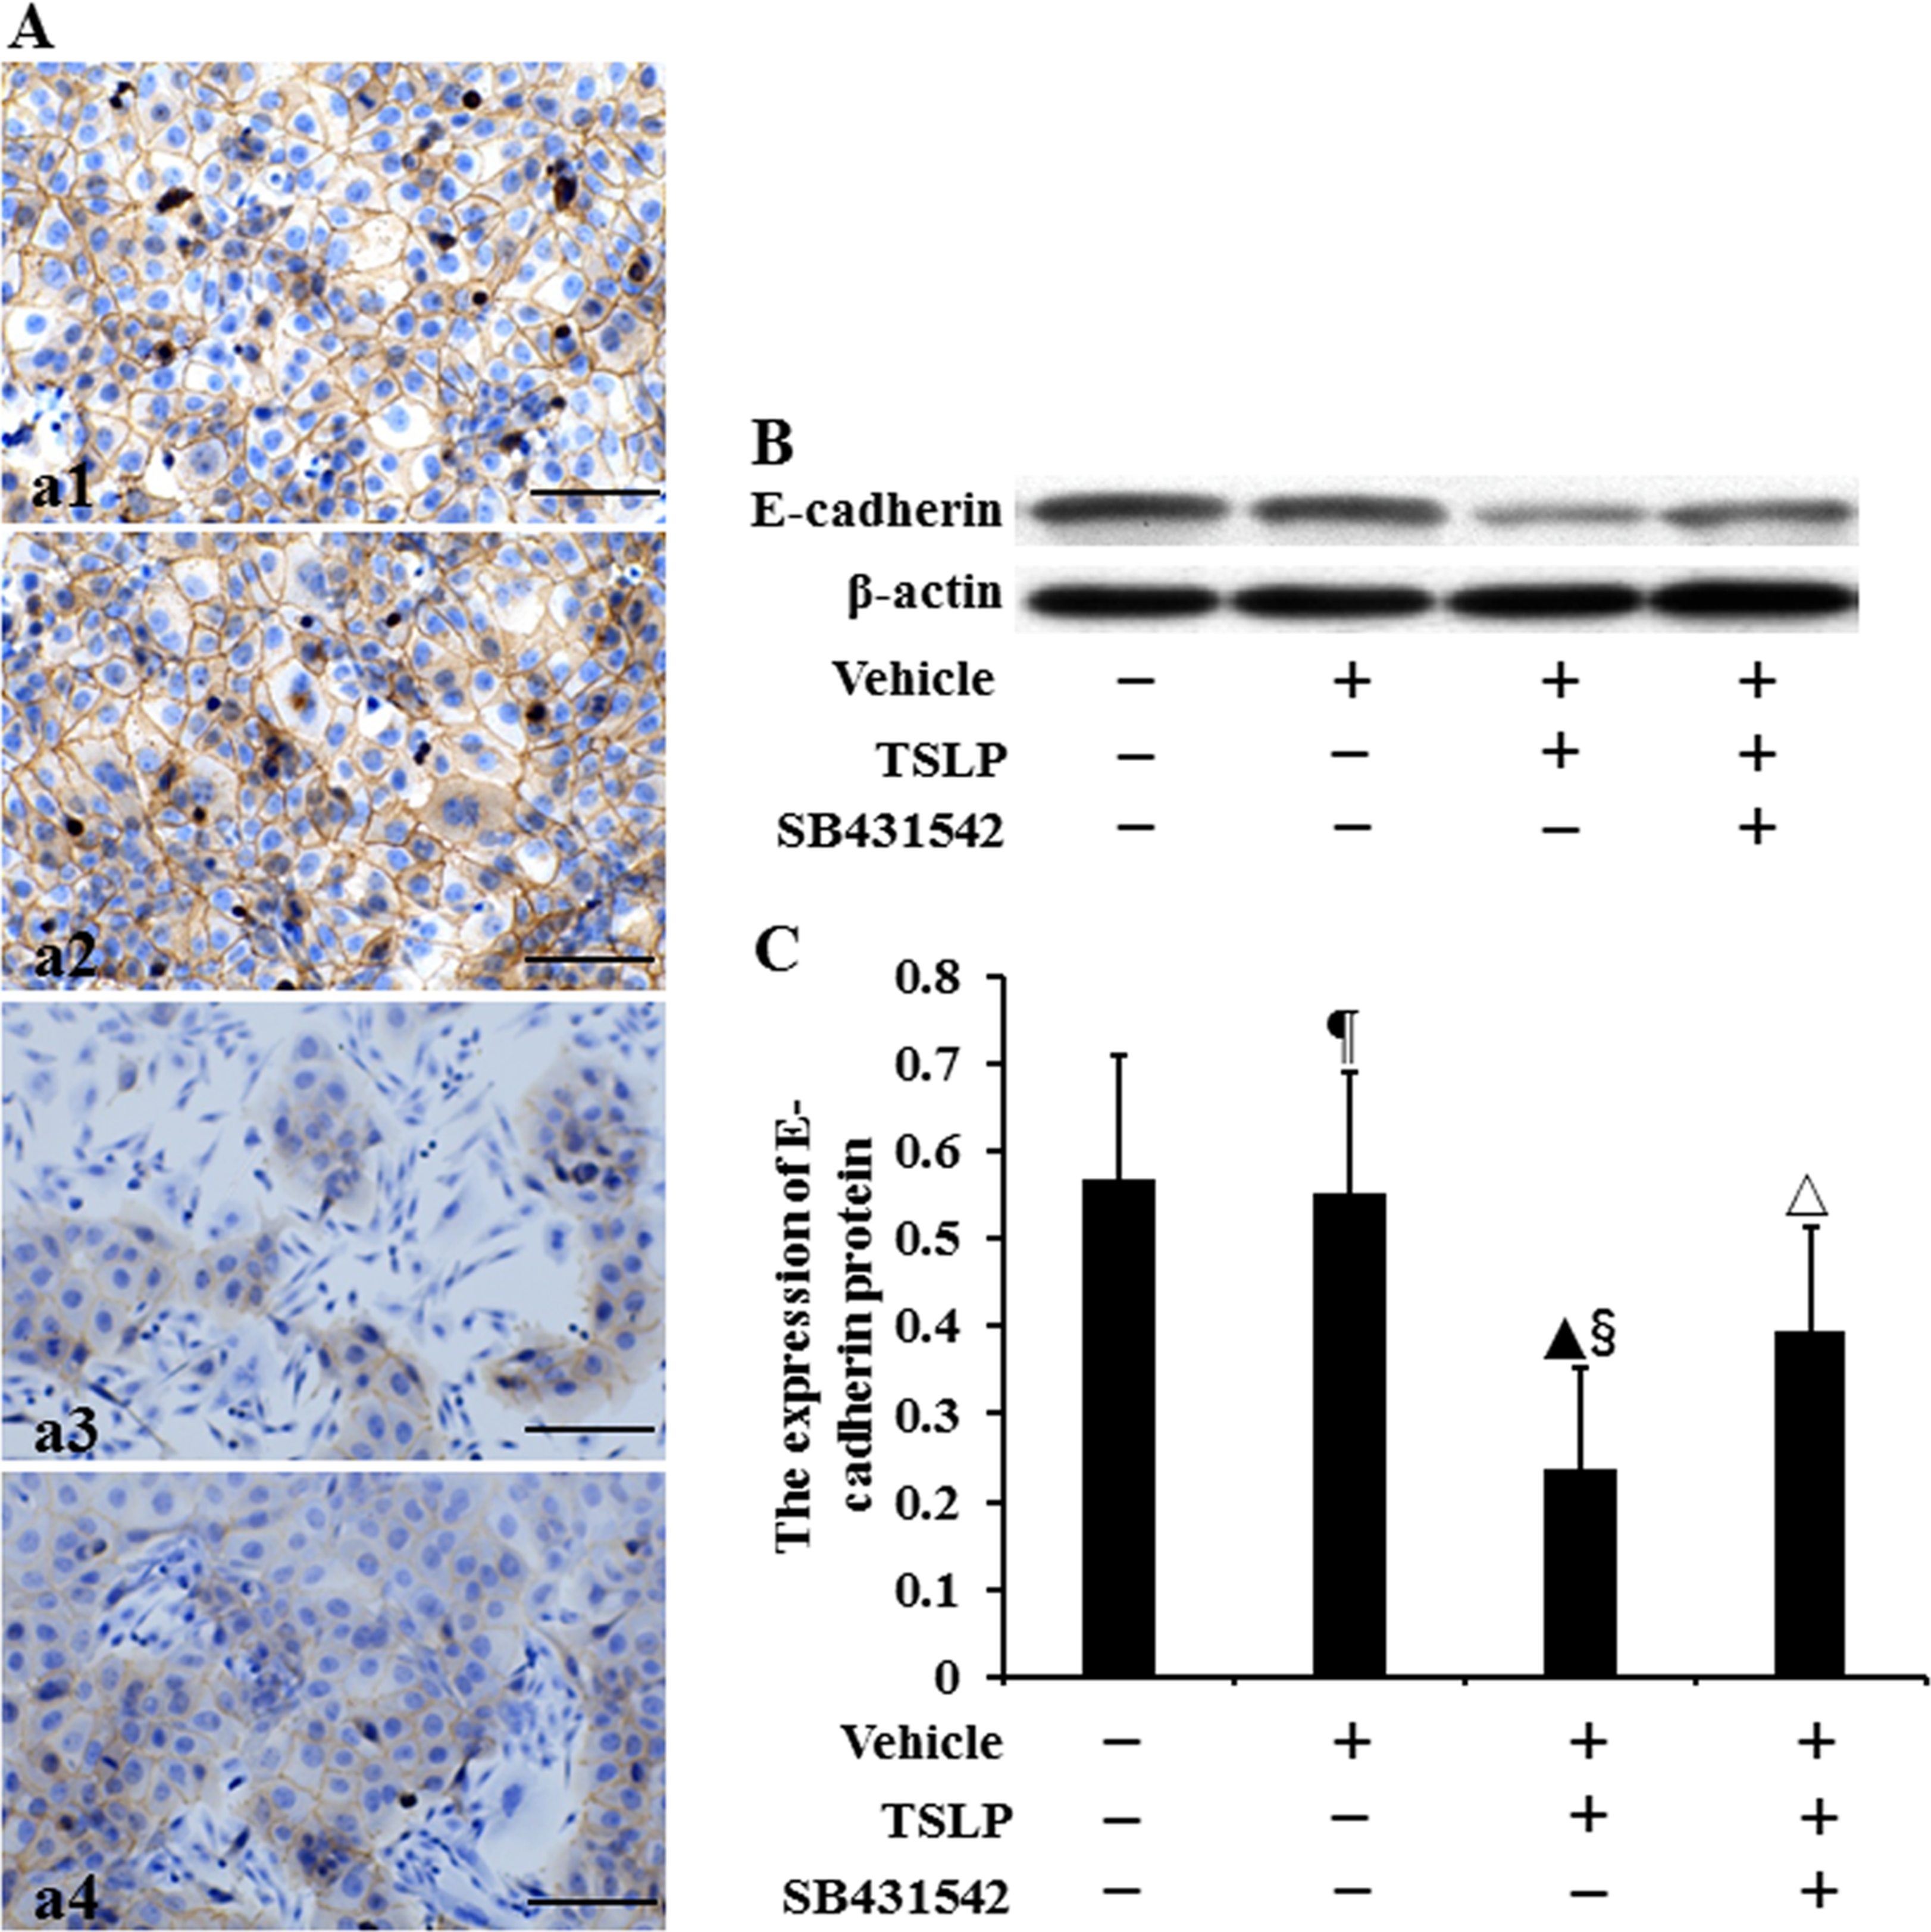
The expression of E-cadherin protein in HNECs. The cells were stimulated with TSLP (100.0 ng/mL) for 48 h with or without SB431542 (100.0 ng/mL) pretreatment one hour before TSLP stimulation. The location of E-cadherin protein was detected by immunocytochemistry (A). (a1) Control. (a2) Stimulation with only vehicle. (a3) Stimulation with TSLP. (a4) Stimulation with TSLP in the presence of SB431542 pretreatment (scale bars = 200 µm). The level of E-cadherin protein was detected by Western blotting (B and C). β-actin was used as loading control. The intensity of E-cadherin bands was normalized to the intensity of β-actin bands. The data were presented as mean ± standard deviation (n = 8). ¶P > .05 versus control cells, ▴P < .05 versus control cells, §P < .05 versus induction with only vehicle, and △P < .05 versus induction with TSLP alone.
The location of vimentin protein was assayed by using immunocytochemistry (Figure 3A). We observed that vimentin protein was expressed in the cytoplasm. The level of vimentin protein was determined by Western blotting (Figure 3B). No difference was observed in the expression of vimentin protein between control cells and vehicle-stimulated cells (P > .05) (Figure 3C). The expression in TSLP-stimulated cells was, respectively, increased by 2.45-fold and 2.32-fold compared to that in control cells and vehicle-stimulated cells (P < .05). Compared to TSLP alone, the level of vimentin protein was decreased by 36.29% in treatment with SB431542 plus TSLP (P < .05).
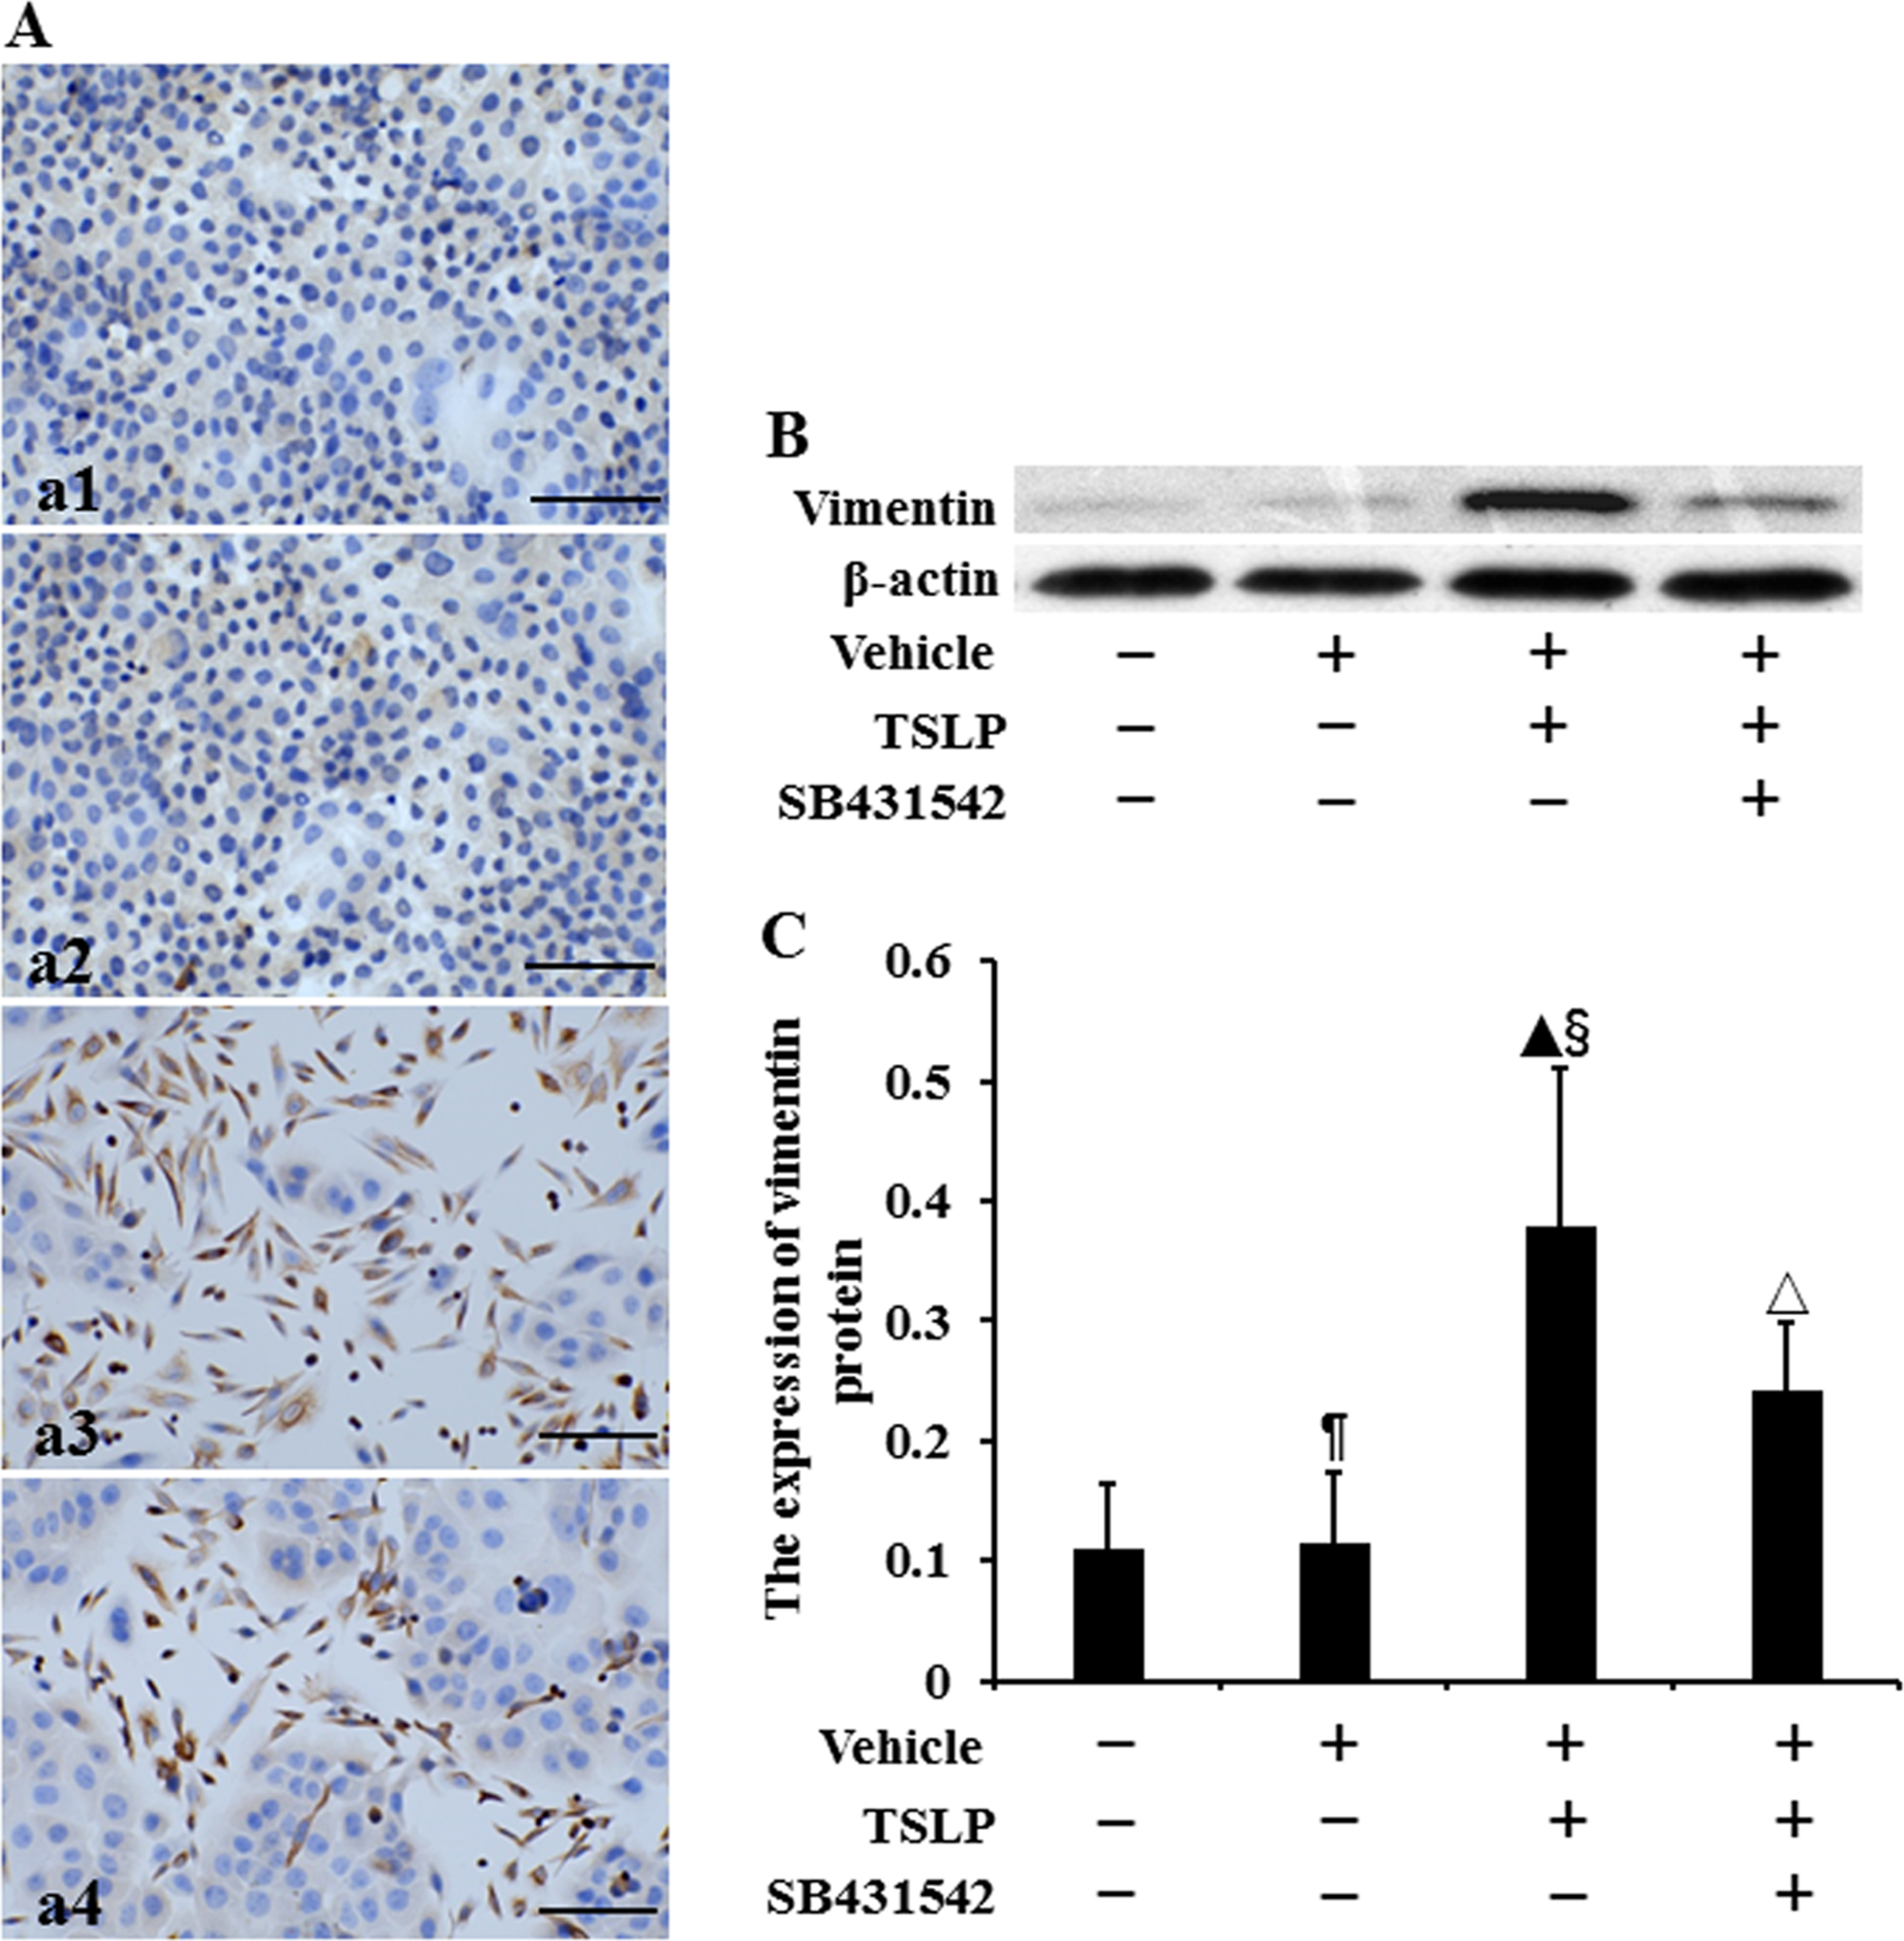
The expression of vimentin protein in HNECs. The cells were stimulated with TSLP (100.0 ng/mL) for 48 h with or without SB431542 (100.0 ng/mL) pretreatment one hour before TSLP stimulation. The location of vimentin protein was detected by immunocytochemistry (A). (a1) Control. (a2) Stimulation with only vehicle. (a3) Stimulation with TSLP. (a4) Stimulation with TSLP in the presence of SB431542 pretreatment (scale bars = 200 µm). The level of vimentin protein was detected by Western blotting (B and C). β-actin was used as loading control. The intensity of vimentin bands was normalized to the intensity of β-actin bands. The data were presented as mean ± standard deviation (n = 8). ¶P > .05 versus control cells, ▴P < .05 versus control cells, §P < .05 versus induction with only vehicle, and △P < .05 versus induction with TSLP alone.
The location of FSP1 protein was assayed by using immunocytochemistry (Figure 4A). We observed that FSP1 protein was expressed in the cytoplasm and cell nucleus. The level of FSP1 protein was determined by Western blotting (Figure 4B). Figure 4C showed that there was no difference in the expression of FSP1 protein between control cells and vehicle-stimulated cells (P > .05) (Figure 4C). The FSP1 expression was, respectively, increased by 1.54-fold and 1.49-fold in TSLP-stimulated cells compared to that in control cells and vehicle-stimulated cells (P < .05). When the cells were preincubated with SB431542 prior to TSLP, FSP1 expression was reduced by 36.29% compared to TSLP alone (P < .05).
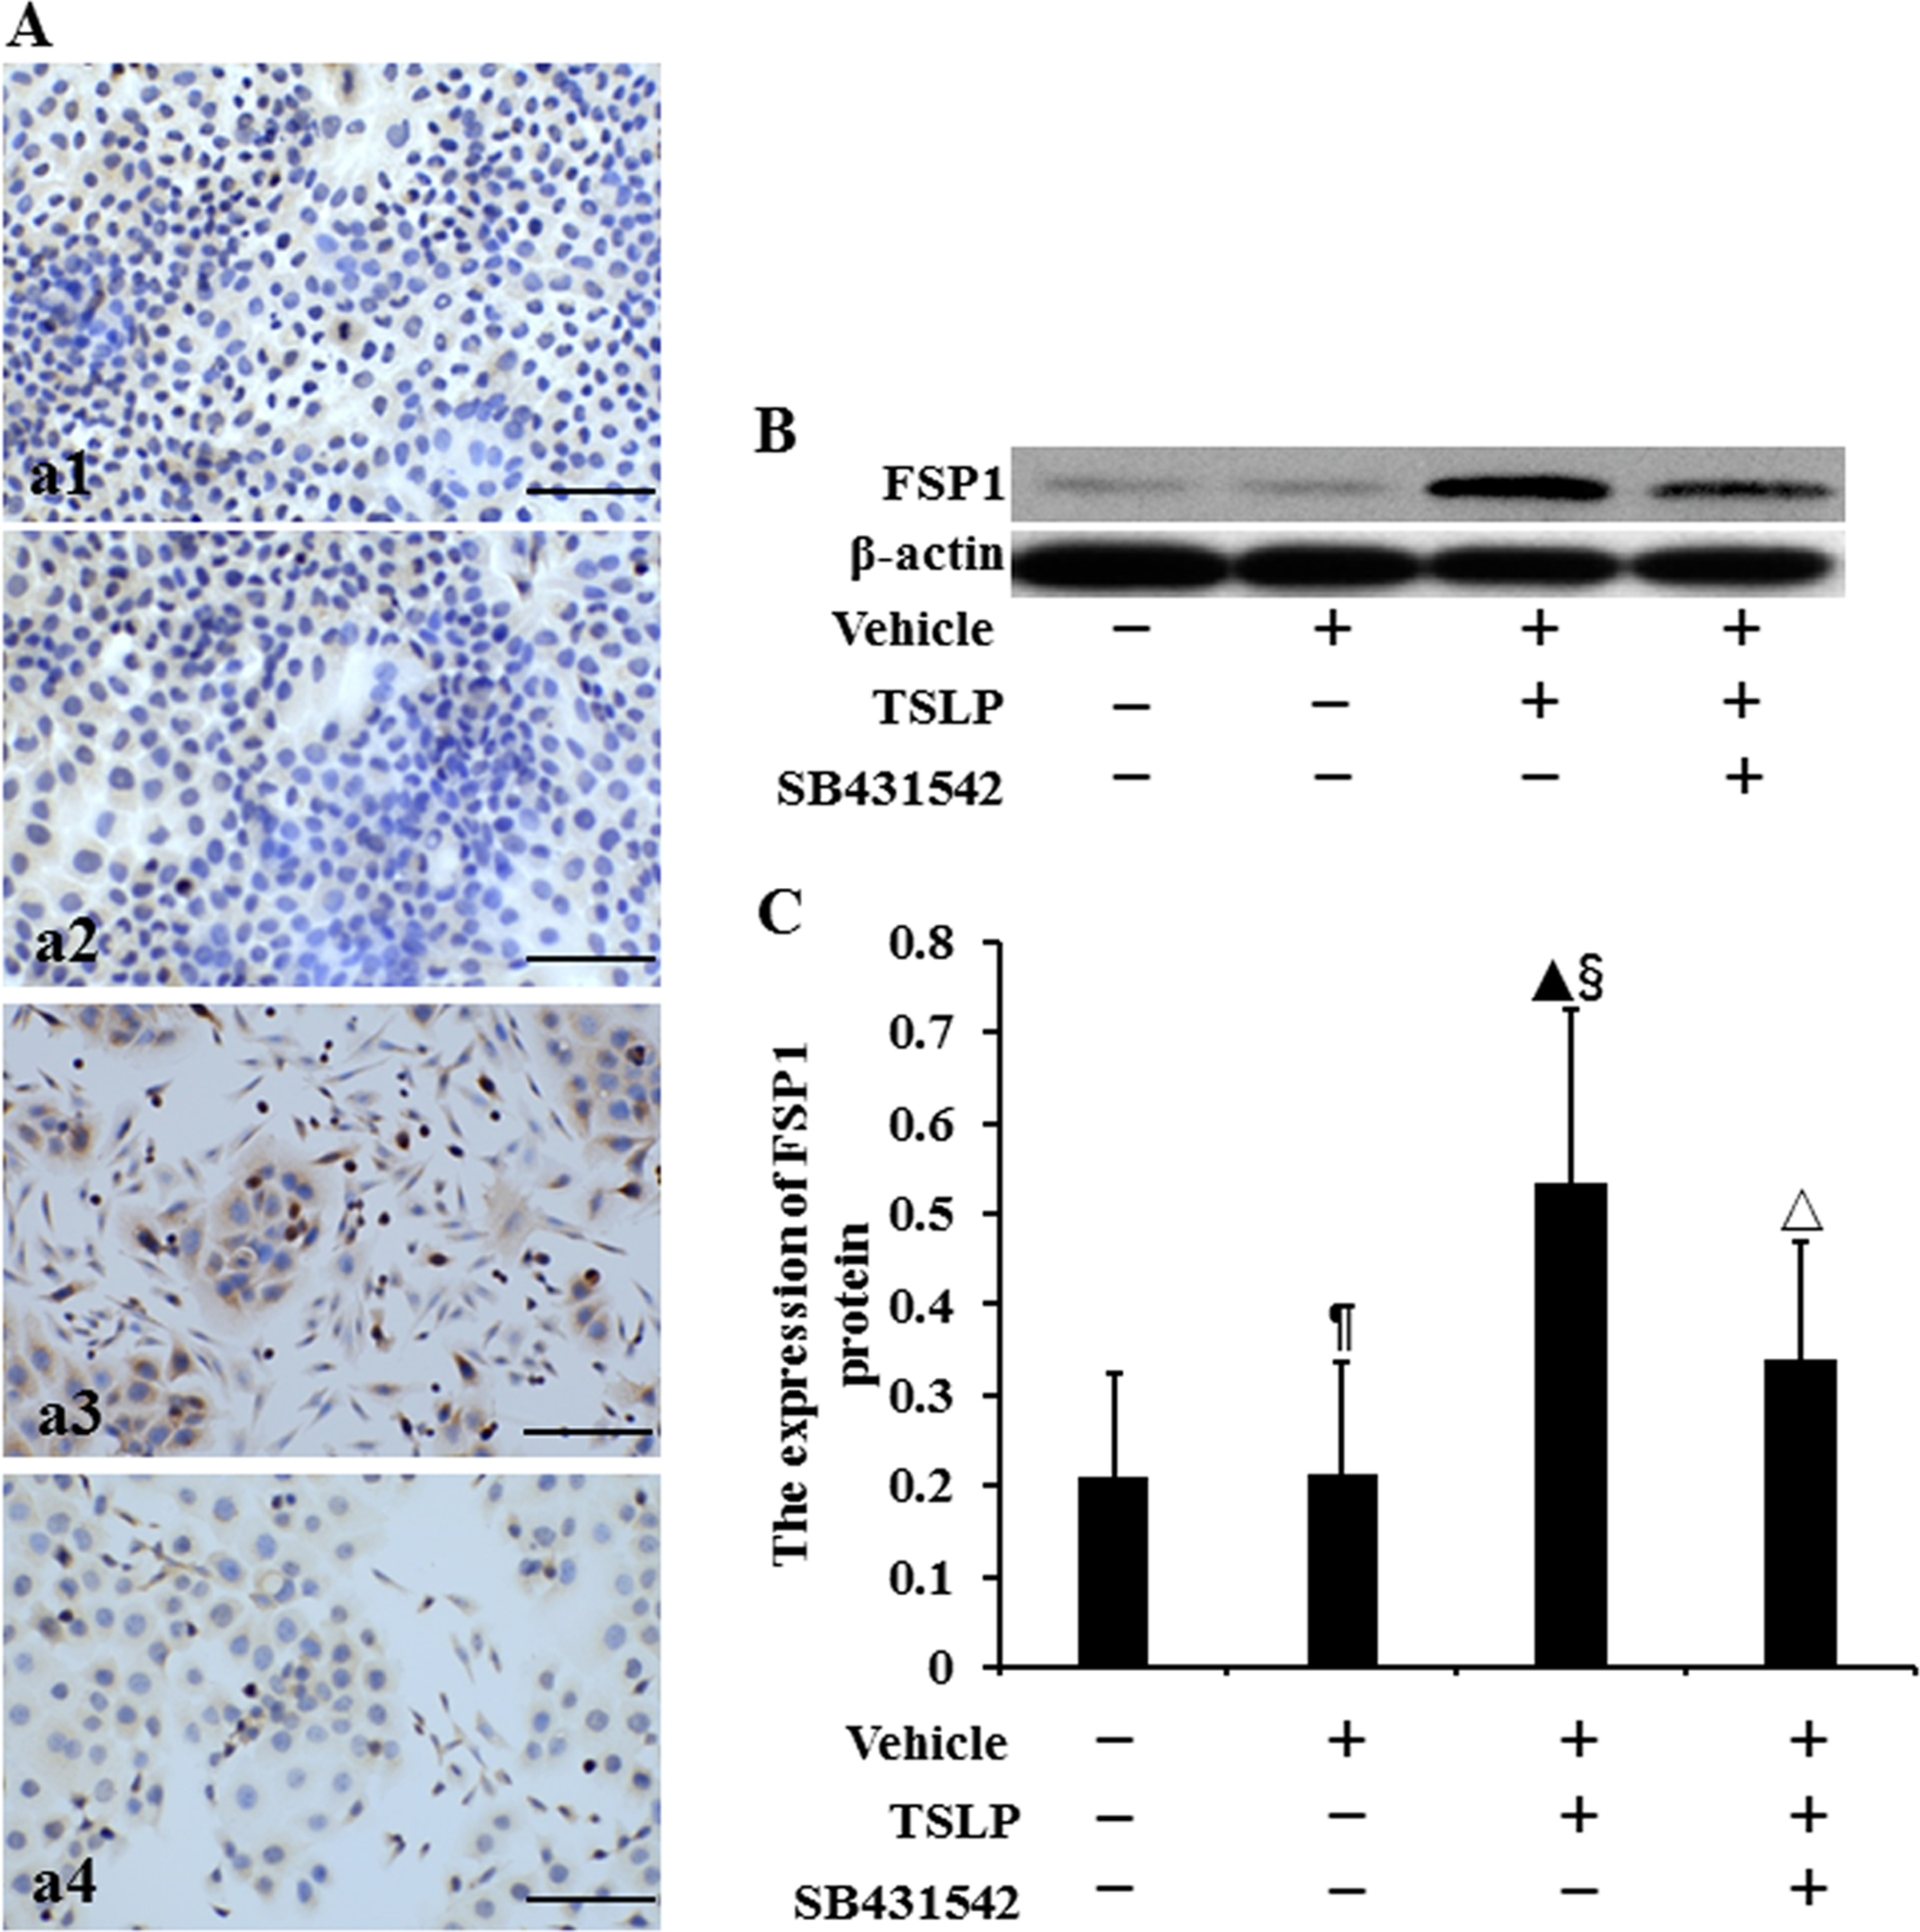
The expression of FSP1 protein in HNECs. The cells were TSLP (100.0 ng/mL) for 48 h with or without SB431542 (100.0 ng/mL) pretreatment one hour before TSLP stimulation. The location of FSP1 protein was detected by immunocytochemistry (A). (a1) Control. (a2) Stimulation with only vehicle. (a3) Stimulation with TSLP. (a4) Stimulation with TSLP in the presence of SB431542 pretreatment (scale bars = 200 µm). The level of FSP1 protein was detected by Western blotting (B and C). β-actin was used as loading control. The intensity of FSP1 bands was normalized to the intensity of β-actin bands. The data were presented as mean ± standard deviation (n = 8). ¶P > .05 versus control cells. ▴P < .05 versus control cells, §P < .05 versus induction with only vehicle, and △P < .05 versus induction with TSLP alone.
An inverted phase-contrast microscope was used to observe the morphology of the cells. Control cells and vehicle-stimulated cells maintained a classic cobblestone epithelial morphology (Figure 5A and B). After the stimulation with TSLP, the cells displayed a spindle-shape and fibroblast-like morphology (Figure 5C), indicating that TSLP-induced HNECs transformed into fibroblasts, but the addition of SB431542 inhibited these morphological alterations (Figure 5D).
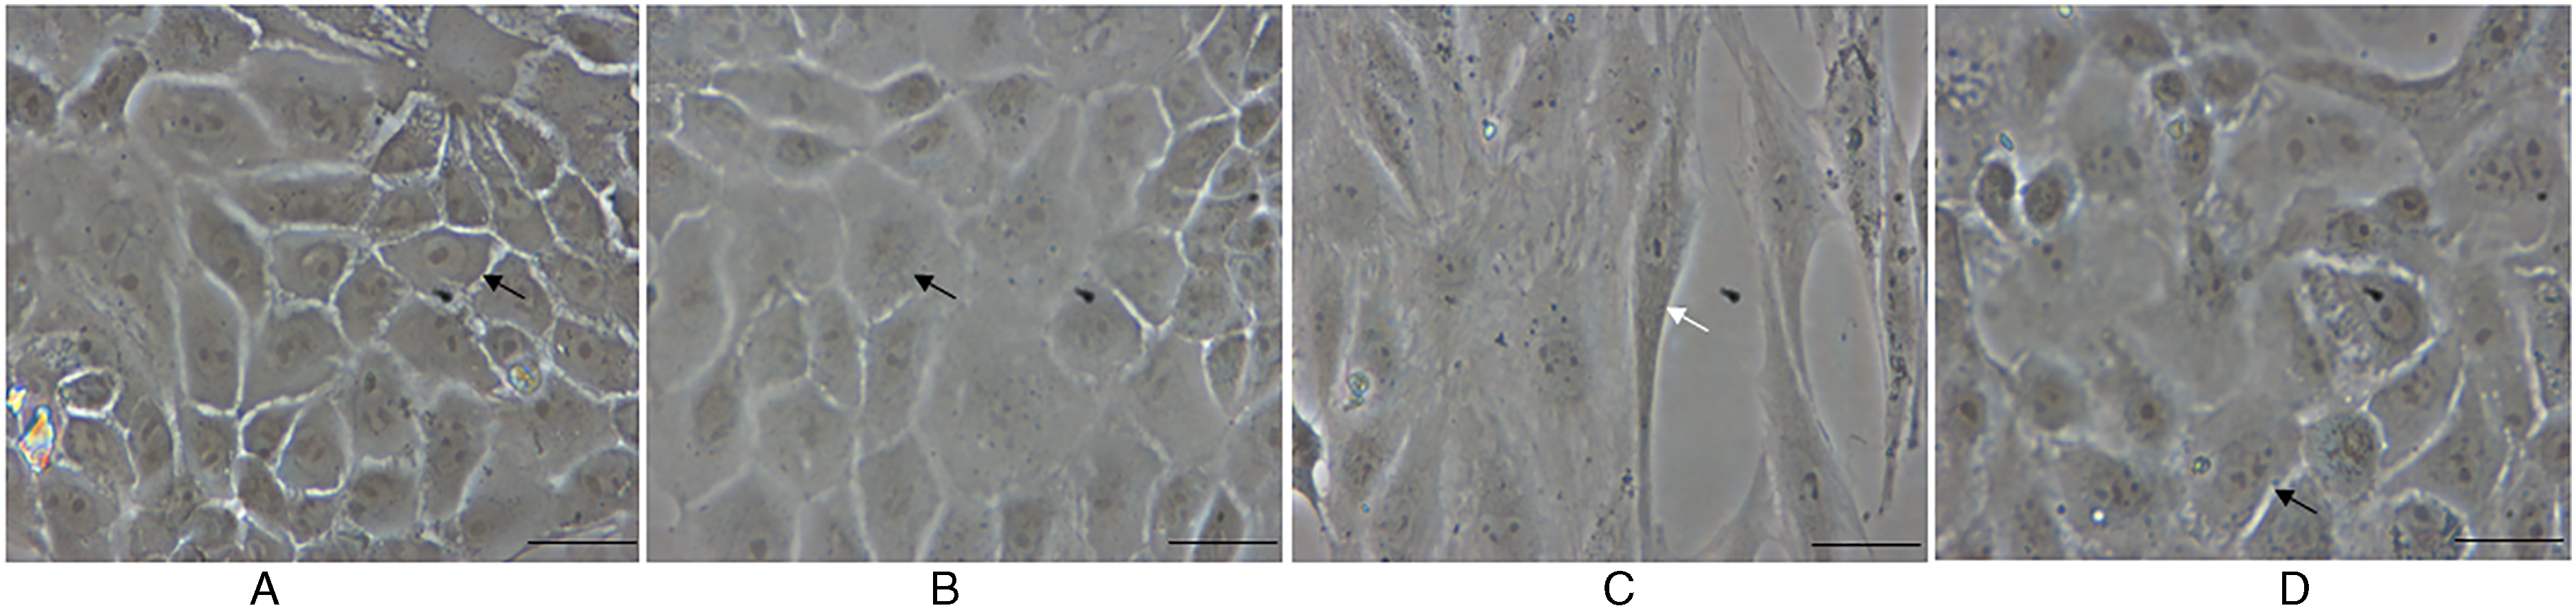
Changes of cell morphology. (A) Control, (B) Stimulation with only vehicle, (C) Stimulation with thymic stromal lymphopoietin (TSLP; 100.0 µg/mL) for 48 h, (D) Stimulation with TSLP (100.0 µg/mL) for 48 h in the presence of SB431542 (100.0 ng/mL) pretreatment one hour before TSLP stimulation (scale bars = 400 µm). Black arrow represented epithelial cells. White arrow represented fibroblasts.
To evaluate the effect of TSLP on the ECM production by HNECs, we assayed the concentrations of collagens I and III in culture supernatants by ELISA. As shown in Figure 6, no difference was observed in the supernatant levels of collagens I collagens I and III between control cells and vehicle-stimulated cells (P > .05). The levels of collagens I and III induced by TSLP were, respectively, 2.21-fold and 1.37-fold higher than that in control group (P < .05), and the values were, respectively, 1.71-fold and 1.14-fold higher than that in vehicle-stimulated cells (P < .05). Stimulation with SB431542 prior to TSLP reduced the levels of collagens I and III by 38.05% and 28.35%, respectively (P < .05), when compared with TSLP alone. These results showed that TSLP promoted the ECM secretion by HNECs through activation of TGF-β1 signaling.
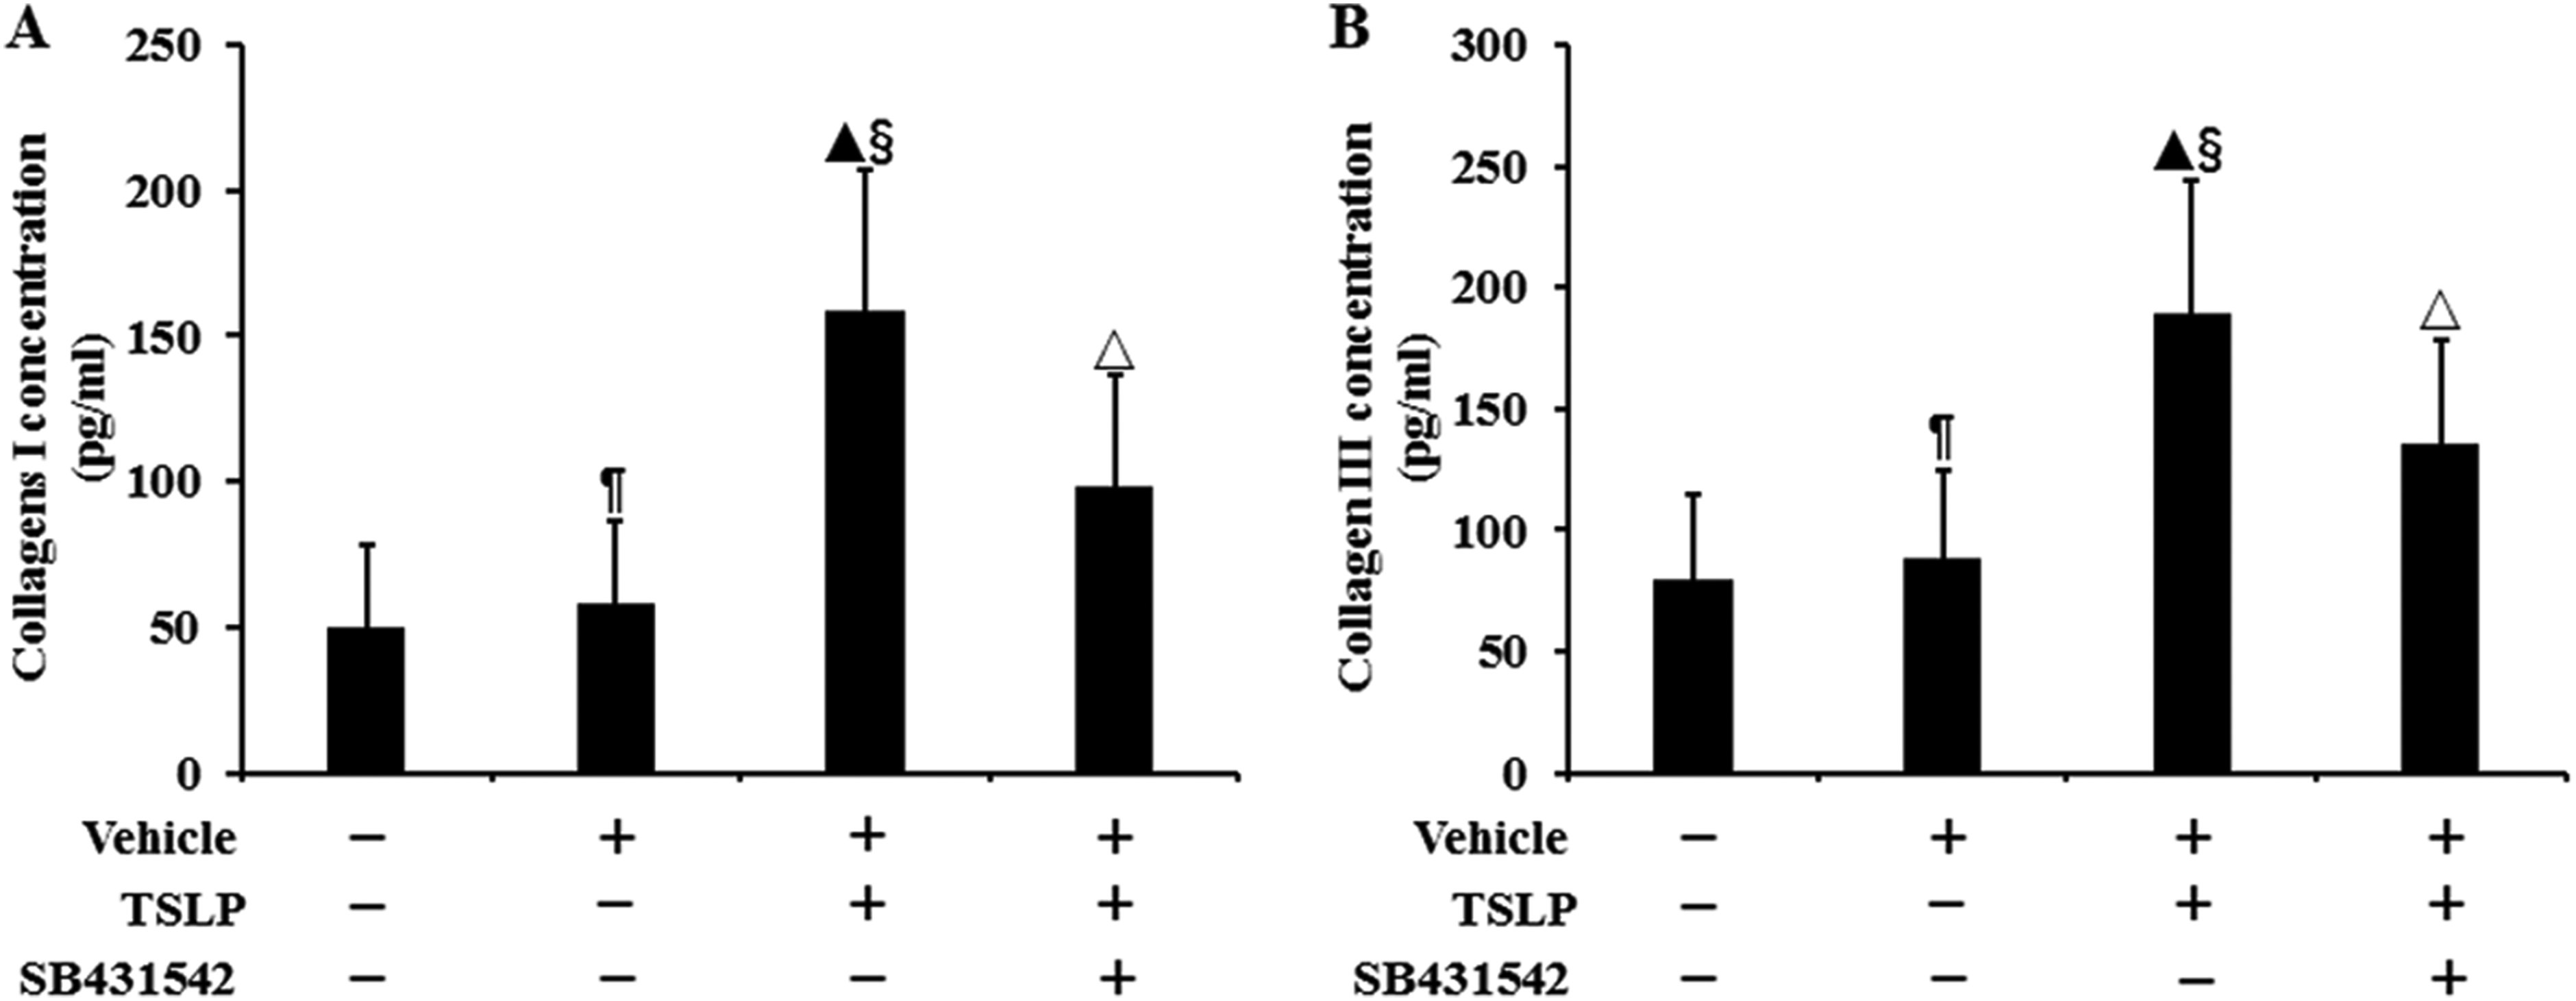
The concentrations of collagens I and III protein in culture supernatants by using enzyme-linked immunosorbent assay (ELISA). The cells were stimulated with TSLP (100.0 ng/mL) for 48 h with or without SB431542 (100.0 ng/mL) pretreatment one hour before TSLP stimulation. The data were presented as mean ± standard deviation (n = 8). ¶P > .05 versus control cells, ▴P < .05 versus control cells, §P < .05 versus induction with only vehicle, and △P < .05 versus induction with TSLP alone.
The location of p-Smad2 protein was assayed by using immunocytochemistry (Figure 7A). We observed that p-Smad2 protein was expressed in the cytoplasm and cell nucleus. Western blotting was used to detect the level of p-Smad2 protein (Figure 7B). When the intensity of p-Smad2 bands was normalized to the intensity of Smad2 bands, there was no difference in the expression of p-Smad2 protein between control cells and vehicle-stimulated cells (P > .05) (Figure 7C). The level of p-Smad2 protein in TSLP-treated cells was, respectively, increased by 3.36-fold and 3.22-fold compared to that in control cells and vehicle-stimulated cells (P < .05), whereas TSLP plus SB431542 decreased p-Smad2 expression by 37.68% compared to TSLP alone. When the intensity of p-Smad2 bands was normalized to the intensity of β-actin bands, no difference was observed in the level of p-Smad2 protein between control cells and vehicle-stimulated cells (P > .05) (Figure 7C). The expression of p-Smad2 protein in TSLP-treated cells was, respectively, increased by 3.39-fold and 3.26-fold compared to that in control cells and vehicle-stimulated cells (P < .05). SB431542 plus TSLP decreased the expression of p-Smad2 protein by 43.09% compared to TSLP alone (P < .05).
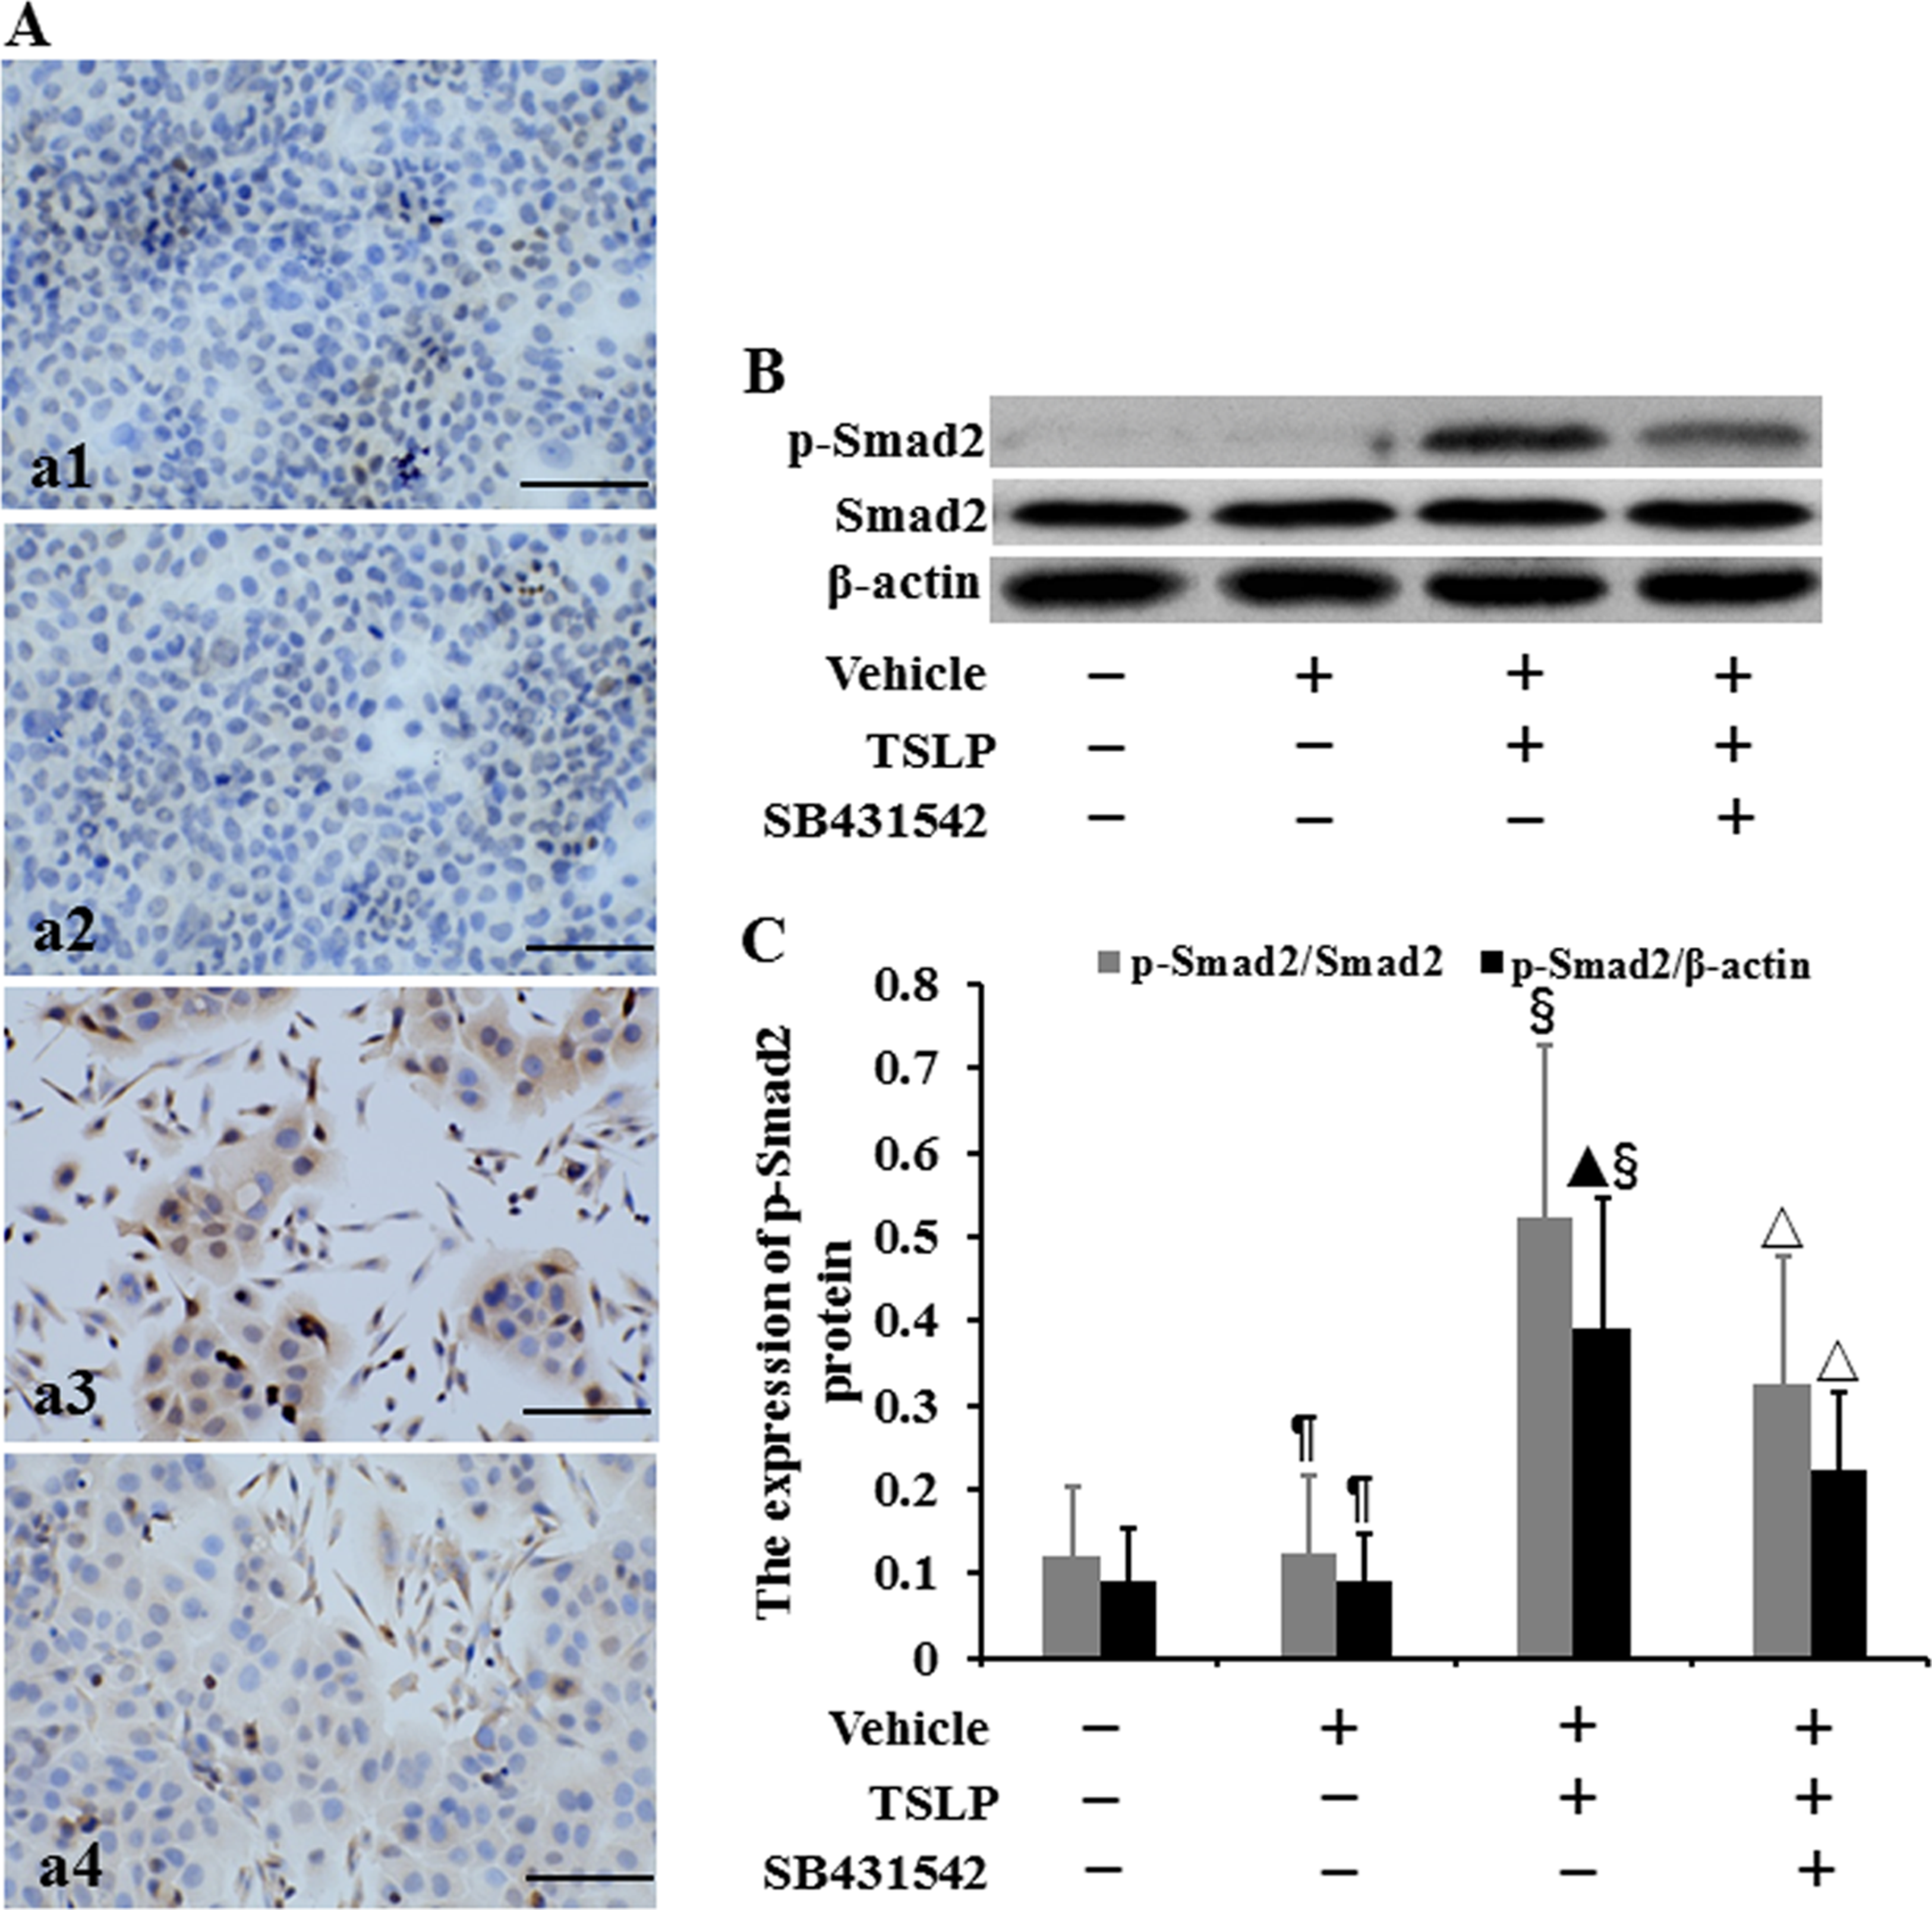
The expression of p-Smad2 protein in HNECs. The cells were stimulated with TSLP (100.0 ng/mL) for 48 h with or without SB431542 (100.0 ng/mL) pretreatment one hour before TSLP stimulation. The location of p-Smad2 protein was detected by immunocytochemistry (A). (a1) Control. (a2) Stimulation with only vehicle. (a3) Stimulation with TSLP. (a4) Stimulation with TSLP in the presence of SB431542 pretreatment (scale bars = 200 µm). The level of p-Smad2 protein was detected by Western blotting (B and C). β-actin and Smad2 were used as loading control. The intensity of p-Smad2 bands was, respectively, normalized to the intensity of β-actin and Smad2 bands. The data were presented as mean ± standard deviation (n = 8). ¶P > .05 versus control cells, ▴P < .05 versus control cells, §P < .05 versus induction with only vehicle, and △P < .05 versus induction with TSLP alone.
The location of p-Smad3 protein was assayed by using immunocytochemistry (Figure 8A). We observed that p-Smad3 protein was expressed in the cytoplasm and cell nucleus. The level of p-Smad3 protein was determined by Western blotting (Figure 8B). When the intensity of p-Smad3 bands was normalized to the intensity of Smad3 bands, there was no difference in the level of p-Smad3 protein between control cells and vehicle-stimulated cells (P > .05) (Figure 8C). The expression of p-Smad3 protein in TSLP-induced cells was, respectively, increased by 3.57-fold and 3.51-fold compared to that in control cells and vehicle-stimulated cells, while TSLP plus SB431542 decreased p-Smad3 expression by 35.17% compared to TSLP alone (P < .05). When the intensity of p-Smad3 bands was normalized to the intensity of β-actin bands, no difference was observed in the level of p-Smad3 protein between control cells and vehicle-stimulated cells (P > .05) (Figure 8C). The level of p-Smad3 protein was, respectively, increased by 3.91-fold and 3.84-fold in TSLP-treated cells compared to that in control group and vehicle group (P < .05), whereas TSLP plus SB431542 reduced p-Smad3 expression by 42.50% compared to TSLP alone (P < .05).
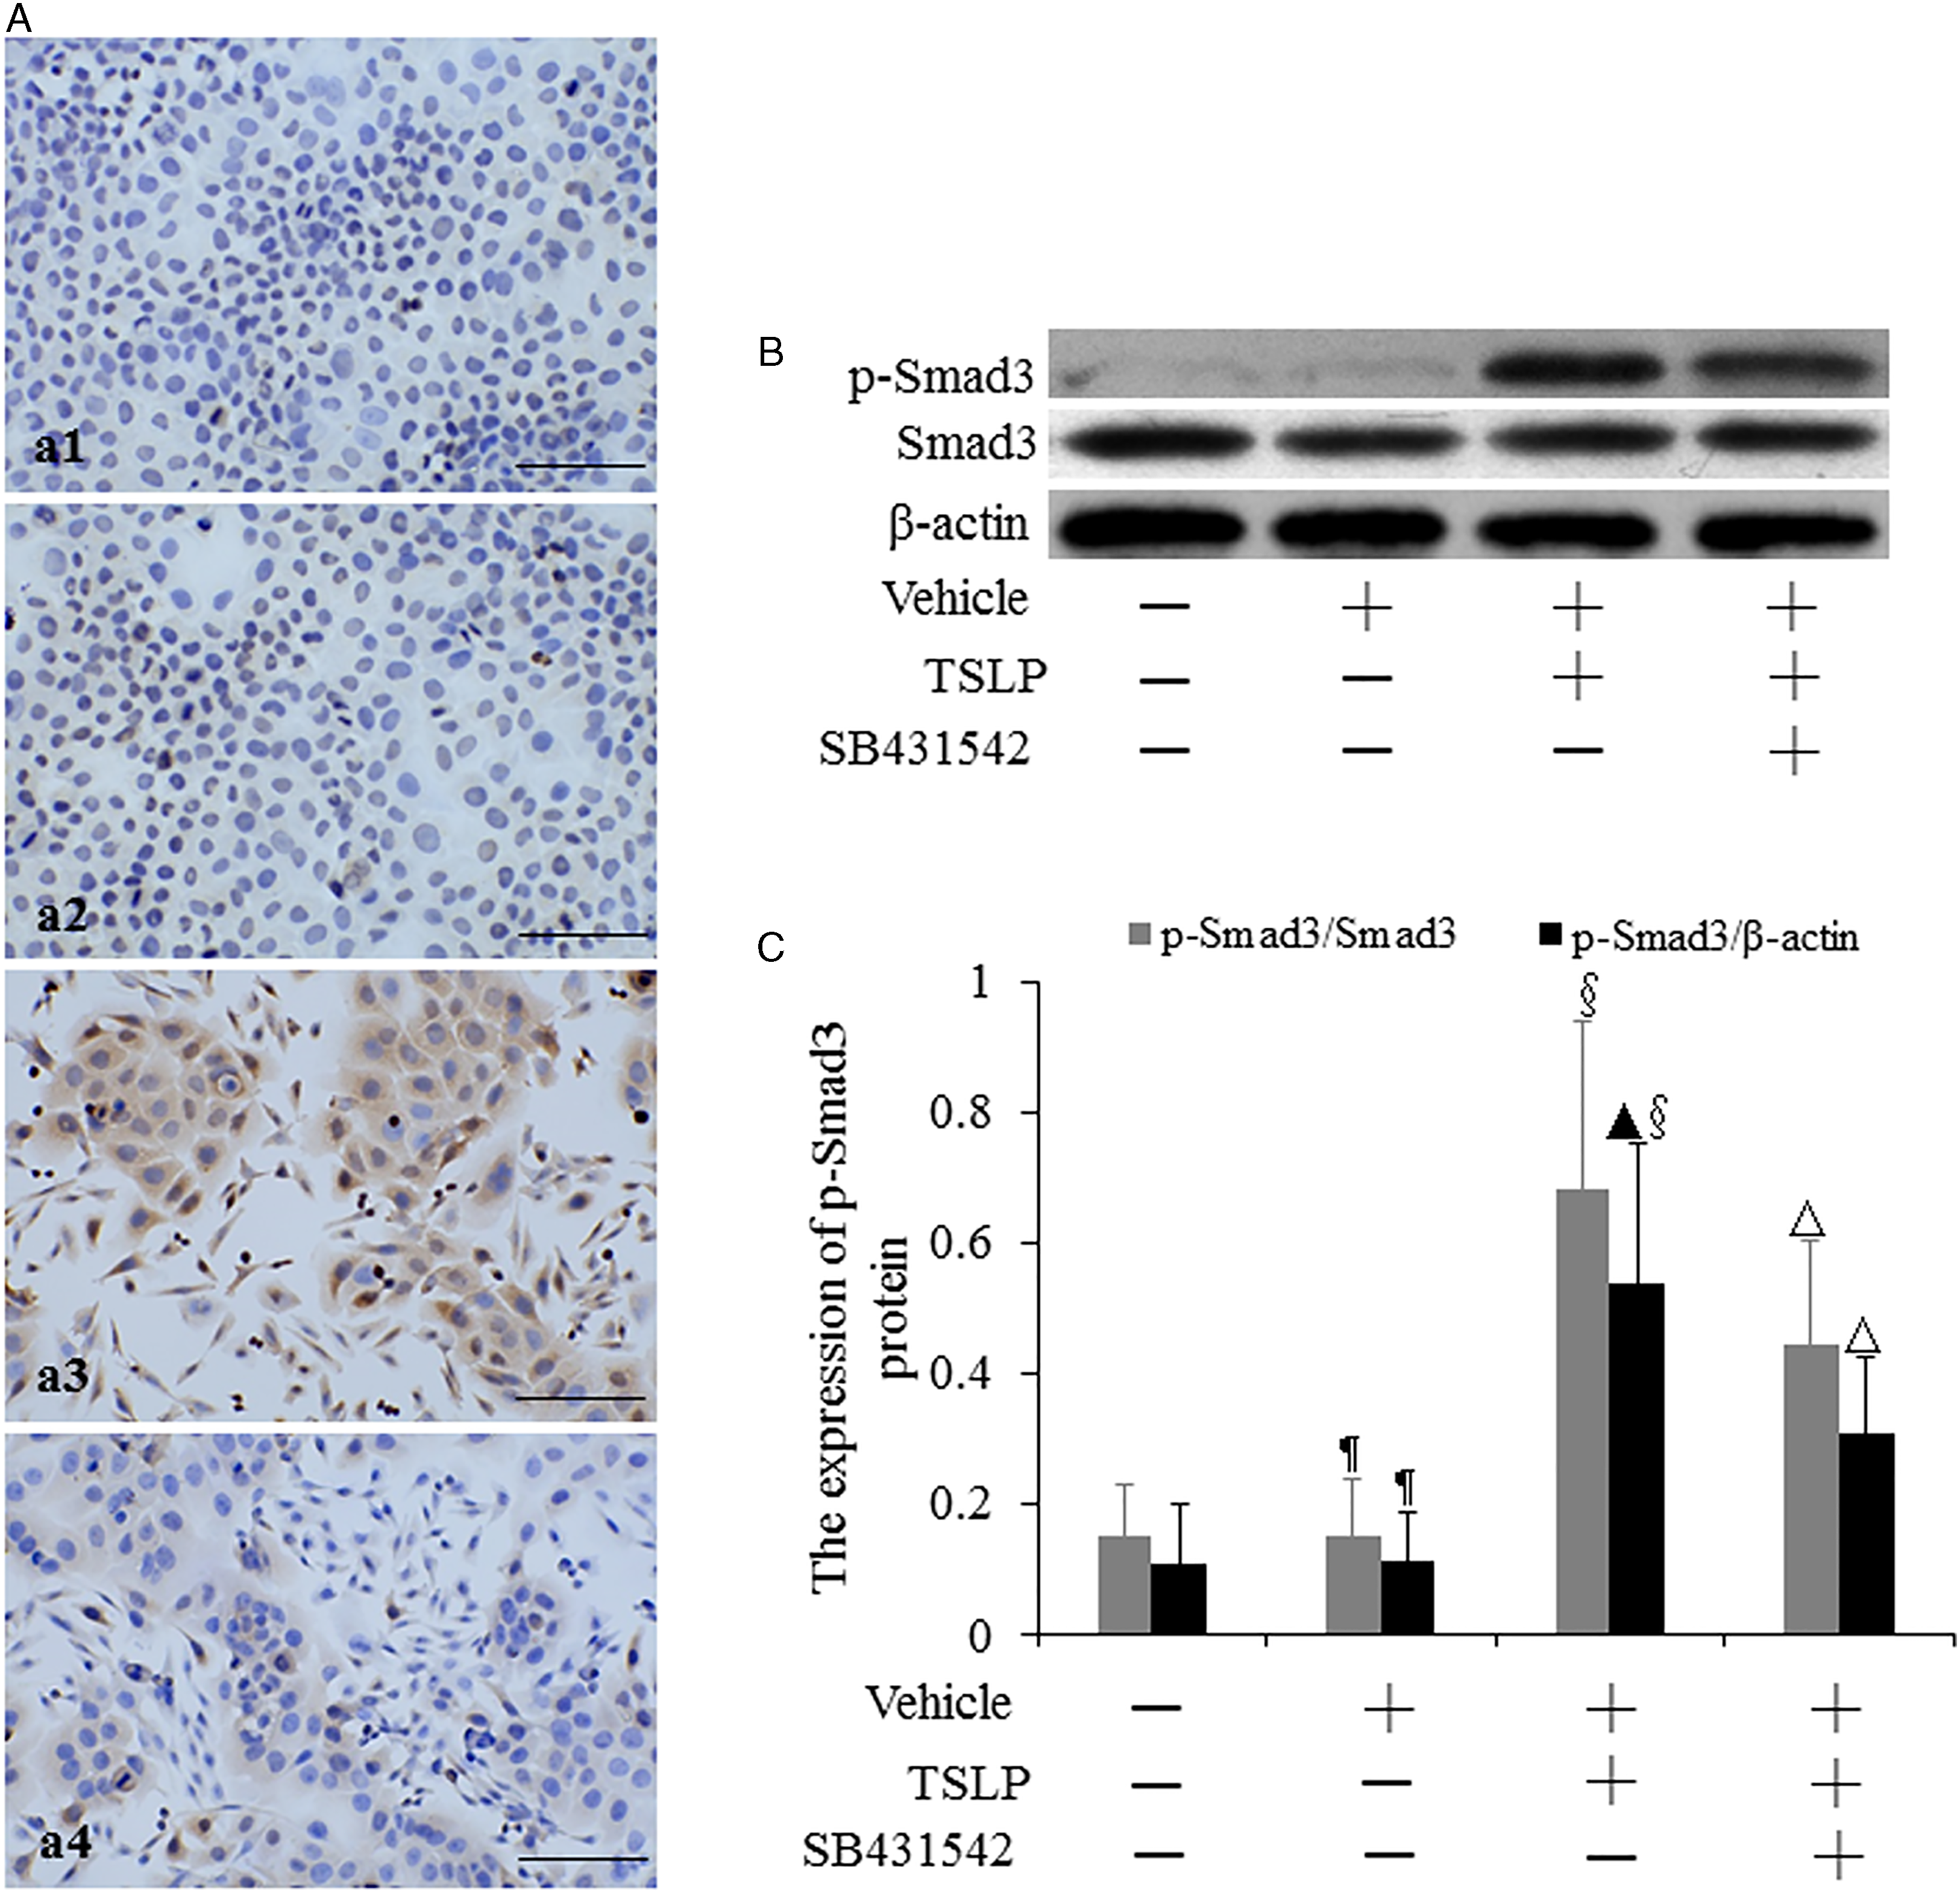
The expression of p-Smad3 protein in HNECs. The cells were stimulated with TSLP (100.0 ng/mL) for 48 h with or without SB431542 (100.0 ng/mL) pretreatment one hour before TSLP stimulation. The location of p-Smad3 protein was detected by immunocytochemistry (A). (a1) Control. (a2) Stimulation with only vehicle. (a3) Stimulation with TSLP. (a4) Stimulation with TSLP in the presence of SB431542 pretreatment (scale bars = 200 µm). The level of p-Smad3 protein was detected by Western blotting (B and C). β-actin and Smad3 were used as loading control. The intensity of p-Smad3 bands was, respectively, normalized to the intensity of β-actin and Smad3 bands. The data were presented as mean ± standard deviation (n = 8). ¶P > .05 versus control cells, ▴P < .05 versus control cells, §P < .05 versus induction with only vehicle, and △P < .05 versus induction with TSLP alone.
Discussion
In the present study, we found that TSLP acted on HNECs, inducing the gene transcription and protein synthesis of TGF-β1. Furthermore, we demonstrated that TSLP-mediated activation of TGF-β1 signaling induced the EMT in HNECs through induction of Smad2/3 phosphorylation.
TGF-β1 displays pro-inflammatory properties by being a potent chemotactic factor and activator for inflammatory cells and plays a key role in airway inflammation in allergic diseases. 35 Its expression is increased in the nasal mucosa of AR patients. 36 The treatment with TGF-β1 neutralizing antibody ameliorates airway inflammation in a murine model of AR and restores the Th1/Th2 balance. 37 TGF-β1 is produced by several inflammatory cells infiltrated in airway mucosa such as eosinophils, lymphocytes, and macrophages, as well as by structural cells of airway wall including fibroblasts, endothelial cells, and smooth muscle cells. 35 Recent study has shown that nasal epithelial cells also have the capability to produce TGF-β1 during wound repair. 38 However, the upstream molecules that regulate TGF-β1 expression in nasal epithelial cells remain obscure in AR.
TSLP, which induces the production of pro-inflammatory cytokines and chemokines through activation of distinct immune and nonimmune cells, is an important factor necessary and sufficient for the initiation and potentiation of allergic airway inflammation. 39 - 41 To investigate the effect of TSLP on TGF-β1 production in HNECs, different concentrations of TSLP were used to stimulate the cells. We found that TSLP increased the levels of TGF-β1 mRNA and protein in a concentration-dependent fashion. The published report also demonstrated that TSLP induced TGF-β1 expression in human bronchial epithelial cells. 28 Hence, TSLP induced HNECs to produce TGF-β1.
The EMT is a pathophysiological process induced by multiple signaling pathways centered on TGF-β1. 32 In our results, TGF-β1 showed a significantly higher level after incubation with 100.0 µg/mL of TSLP than any other concentration. We chose 100.0 µg/mL as optimal concentration to stimulate HNECs, investigating the effect of TSLP on the EMT in HNECs. Our result showed that TSLP significantly decreased the expression of epithelial marker E-cadherin, but increased the production of mesenchymal markers vimentin and FSP1, and the morphology of the cells was transformed into fibroblast-like shape, indicating TSLP contributed to the EMT in HNECs.
TGF-β1 signals through a heteromeric receptor complex consisting of TGF-β receptor type I (TGF-βRI) and TGF-β receptor type II (TGF-βRII) on the cell membrane. 42 In this study, a selective inhibitor of TGF-β1 receptor (SB431542) was used to block TGF-β1 signaling. We found that the addition of SB431542 reversed the expression changes of EMT markers and the morphological alterations mediated by TSLP. The data presented herein were consistent with that of previous report showing that blockage of TGF-β1 signaling inhibited TSLP-mediated EMT in human bronchial epithelial cells. 28 Therefore, TSLP induced the EMT in HNECs through TGF-β1 signaling.
Nasal remodeling is characterized by aberrant deposition of excessive ECM components including collagen I and collagen III in AR. 43 Epithelial cells are not professional secretory cells and produce few ECM proteins under normal conditions, whereas epithelial cells undergoing EMT have the capability to produce the ECM components. 44 Our results showed that TSLP markedly increased collagens I and III production by HNECs, while preincubation with SB431542 prior to TSLP reversed these effects. These results suggested that the activation of TGF-β1 signaling was involved in TSLP-induced ECM production by HNECs.
TGF-β1 initiates downstream signaling events by binding to TGF-βRII, and then TGF-βRI is recruited into a complex where it is phosphorylated by TGF-βRII. The activated TGF-βRI phosphorylates Smad2/3, thus inducing their association with Smad4 followed by the translocation of the heteromeric complex to the nucleus where they potentiate the transcription of target genes.42,45 TGF-β1 induces the EMT process through activation of Smad2/3 pathway in many types of epithelial cells, including alveolar epithelial cells, renal proximal tubular epithelial cells, intrahepatic biliary epithelial cells, and pancreatic ductal epithelial cells. 46 - 49 To further investigate the mechanism underlying TSLP-induced EMT in HNECs, we assayed the levels of p-Smad2/3 protein. Our results showed that TSLP increased the expression of p-Smad2/3 protein in HNECs, while the addition of SB431542 attenuated TSLP-mediated Smad2/3 phosphorylation, indicating TSLP induced the EMT in HNECs through TGF-β1/Smad2/3 signaling.
A reliance on pharmacological inhibitor is one weakness of the present study. We will further evaluate this mechanism through the deletion of TGF-βRI or TGF-βRII gene in HNECs. There are other limitations in this study. Our present data are from the in vitro experiments, but it remains unknown whether these effects can be transferred into the in vivo situation of experimental AR. We will further evaluate the effects of TSLP on the EMT in a murine model of AR. Our study does not include a healthy control, and we will investigate whether HNECs from AR patients are more prone to undergoing EMT in response to TSLP by including healthy controls as comparisons.
Conclusion
TSLP induced the EMT in HNECs through TGF-β1/Smad2/3 signaling, leading to the production of ECM components. These factors contributed to the nasal remodeling in AR. This description indicated that TSLP was an activator of the EMT in HNECs and might be a potential target for anti-EMT and the alleviation of airway remodeling in AR.
Footnotes
Author Contributions
HW: Manuscript drafting and review and final approval. WW: Study design, acquisition, data analysis and interpretation, manuscript drafting and review. QJ: Manuscript review, study concept, data collection and analysis. YP: Data acquisition and analysis of, and manuscript review.
Declaration of Conflicting Interests
The author(s) declared no potential conflicts of interest with respect to the research, authorship, and/or publication of this article.
Funding
The author(s) received no financial support for the research, authorship, and/or publication of this article.