
Abstract
Background
Obtaining insurance approval is a necessary component of healthcare in the United States and denials of these claims have been estimated to result in a loss of 3% to 5% of revenue.
Objective
Examine the trends in insurance denials for rhinological procedures.
Methods
A retrospective review of deidentified financial data of patients who were treated by participating physicians across 3 institutions from January 1, 2021, to June 30, 2023. The data was queried for rhinological and non-rhinological procedures via CPT codes. Cumulative insurance denials were calculated and stratified by procedure and insurance type. Write-offs were dollar amounts associated with final denials.
Results
A sample of 102,984 procedures and visits revealed a final denial rate between 2.2% and 2.9% across institutions (p = .72). The top three rhinological procedures for final write-offs were: nasal endoscopy (16.24%, $111,836.87), nasal debridement or polypectomy (6.48%, $79,457.51), and destruction of intranasal lesion (2.11%, $56,932.20). The write-off percentage for each procedure was highest among commercial insurance payers as opposed to Medicare or Medicaid.
Conclusion
Final denial rates of rhinology procedures ranged between 2% and 3%. Common procedures such as nasal endoscopy and nasal debridement are among the highest written-off procedures. Insurance denials can lead to notable revenue loss. Rhinology practices must continue to remain knowledgeable of the changes and effects of insurance reimbursement on their practice.
Keywords
Introduction
The United States (US) spends more than 15% of its gross domestic product on healthcare, higher than any other developed nation and the closest being Germany at 12.7%. 1 Healthcare spending garnered further attention during a 2009 US presidential address, and it was suggested that physicians may recommend treatment based on insurance reimbursements rather than the ideal treatment for the patient. 2 To reduce healthcare expenditures, the medical community has increasingly developed more evidence-based clinical practice guidelines, while insurance companies have increased the implementation of prior authorizations. Insurance companies claim that prior authorizations assist in decreasing healthcare consumption and costs, but results are conflicting with some even suggesting that appropriate clinical decisions are altered to avoid prior authorizations.3-5
Among the many complexities of the US healthcare system, approval for procedures can be a complex and costly process for physicians and patients alike. Institutional-level data regarding lost revenue due to denials is scarce, but health systems have been estimated to lose 3% to 5% of revenue as a result of insurance denials. 6 This loss of revenue can be very detrimental as hospital profit margins may be slim. Additionally, mean Medicare reimbursement for the top 20 otolaryngology procedures has decreased by almost 40% over the last 20 years, 7 further highlighting the importance of an effective revenue cycle management program.
A proactive approach to preventing loss of revenue first requires an understanding of which procedures, how often, and in what settings, coverage is denied. To our knowledge, there is no literature that examines insurance denials for rhinological procedures. Herein, we aim to understand trends in insurance denials for rhinological procedures with a multi-institution analysis inclusive of both academic and private practice (PP).
Materials and Methods
Study Design
Deidentified data was obtained from the billing departments of three institutional sites: Houston Methodist (HM) Hospital in Houston, Texas, Cedars Sinai (CS) Hospital in Los Angeles, California, and Kentuckiana ENT PP, in Louisville, Kentucky. A retrospective coding review was executed for rhinological clinic procedures, operating room surgeries, and clinic visits performed by academic rhinologists and PP otolaryngologists (2 from HM, 2 from CS, and 5 from PP) between January 1, 2021, and June 30, 2023. Each billing department was asked to compile all insurance denials during the designated time. Initial denials were defined as claims rejected by an insurance company within 1 month of submission, whereas final denials were claims that received a final decision of rejection after submission of a rebuttal or requested document.
Subsequently, the final write-off for each claim was calculated and defined as the dollar amount associated with the unreceived payment based on the average payment previously received for the given visit or procedure for each respective institution. The top 3 procedures for the final write-off were determined for each respective institution and the combined sample. For the top 3 procedures in the sample, the final denials and write-offs were stratified by insurance type which was defined as private, Medicare, or Medicaid.
Patient Population
Patients were included if they received any clinical care in the clinic, hospital, or operating room by the participating physicians at the three sites. CPT codes and E&M visits were analyzed and classified as rhinologic or non-rhinologic. The CPT codes utilized to identify procedures can be found in the appendix (Supplemental Table 1).
Statistical Analysis
Categorical variables were summarized by frequency and percentage and comparisons were completed via chi-square analysis. Continuous comparisons were completed with an analysis of variance test. A p-value of <.05 was considered to indicate a statistically significant difference for all statistical tests. All data analyses were performed using SPSS (IBM Corporation, Armonk, NY).
Results
Procedures Completed
A total of 102,984 procedures between January 1, 2021, and June 30, 2023, were analyzed. Initial denial rates were 10.53% for HM, 4.70% for CS, and 3.71% for PP (p < .05). Final denial rates were 2.63% for HM, 2.9% for CS, and 2.22% for PP (p = .72).
Final Write-Offs
The procedures for final write-offs among the three sites can be seen in Table 1. The top three rhinological procedures for final write-offs for HM were: nasal endoscopy (NE) (14.5%, $17,337.87), nasal debridement or polypectomy (NDP) (10.0%, $21,456.51), and destruction of intranasal lesion (DIL) (6.60%, $47,363.20). The top three rhinological procedures for final write-offs for CS were: NE (23.61%, $27,287.00), skull-based procedures (5.25%, $4,491.00), and DIL (2.30%, $6,197.00). The top three rhinological procedures for final write-offs for PP were: NE (15.30%, $67,212.00), NDP (5.72%, $53,739.00), and frontal sinus surgery (1.19%, $44,502.00).
The Frequency of Final Denials of Rhinological Procedures for Each Institution.
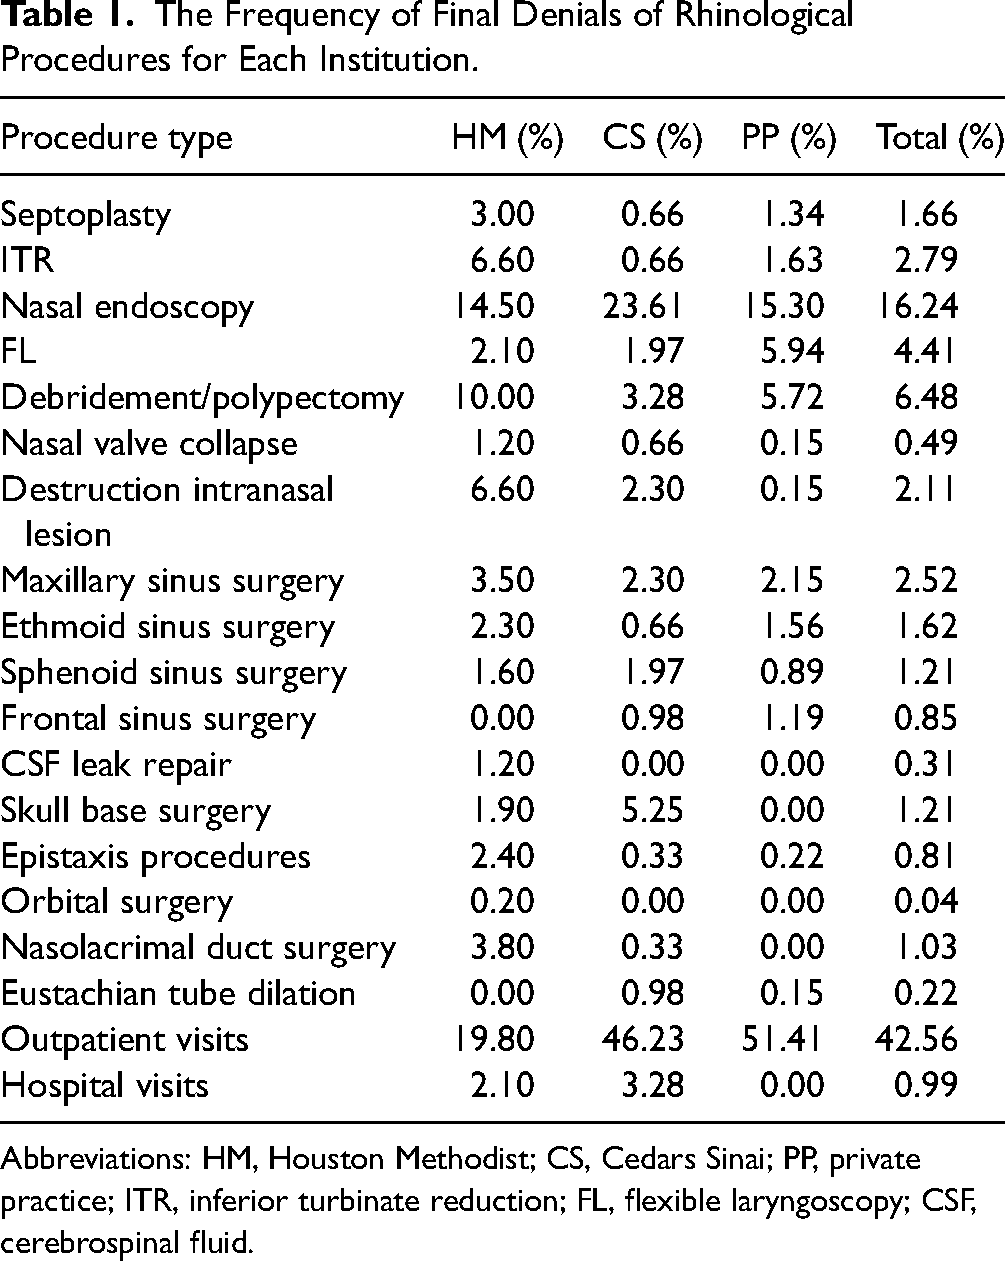
Abbreviations: HM, Houston Methodist; CS, Cedars Sinai; PP, private practice; ITR, inferior turbinate reduction; FL, flexible laryngoscopy; CSF, cerebrospinal fluid.
The top three most costly rhinological procedures for final write-offs combined among all three sites were: NE (16.24%, $111,836.87), NDP (6.48%, $79,457.51), and DIL (2.11%, $56,932.20) (Table 2). The total number and types of procedures performed were only available at HM, which revealed the following proportions of write-offs: 1.64% (n = 5,061) of nasal endoscopies, 4.34% (n = 1,313) of debridement or polypectomies, 9.43% (n = 403) of DIL.
The Cost of Final Write-Offs Within Each Institution by Rhinological Procedure.
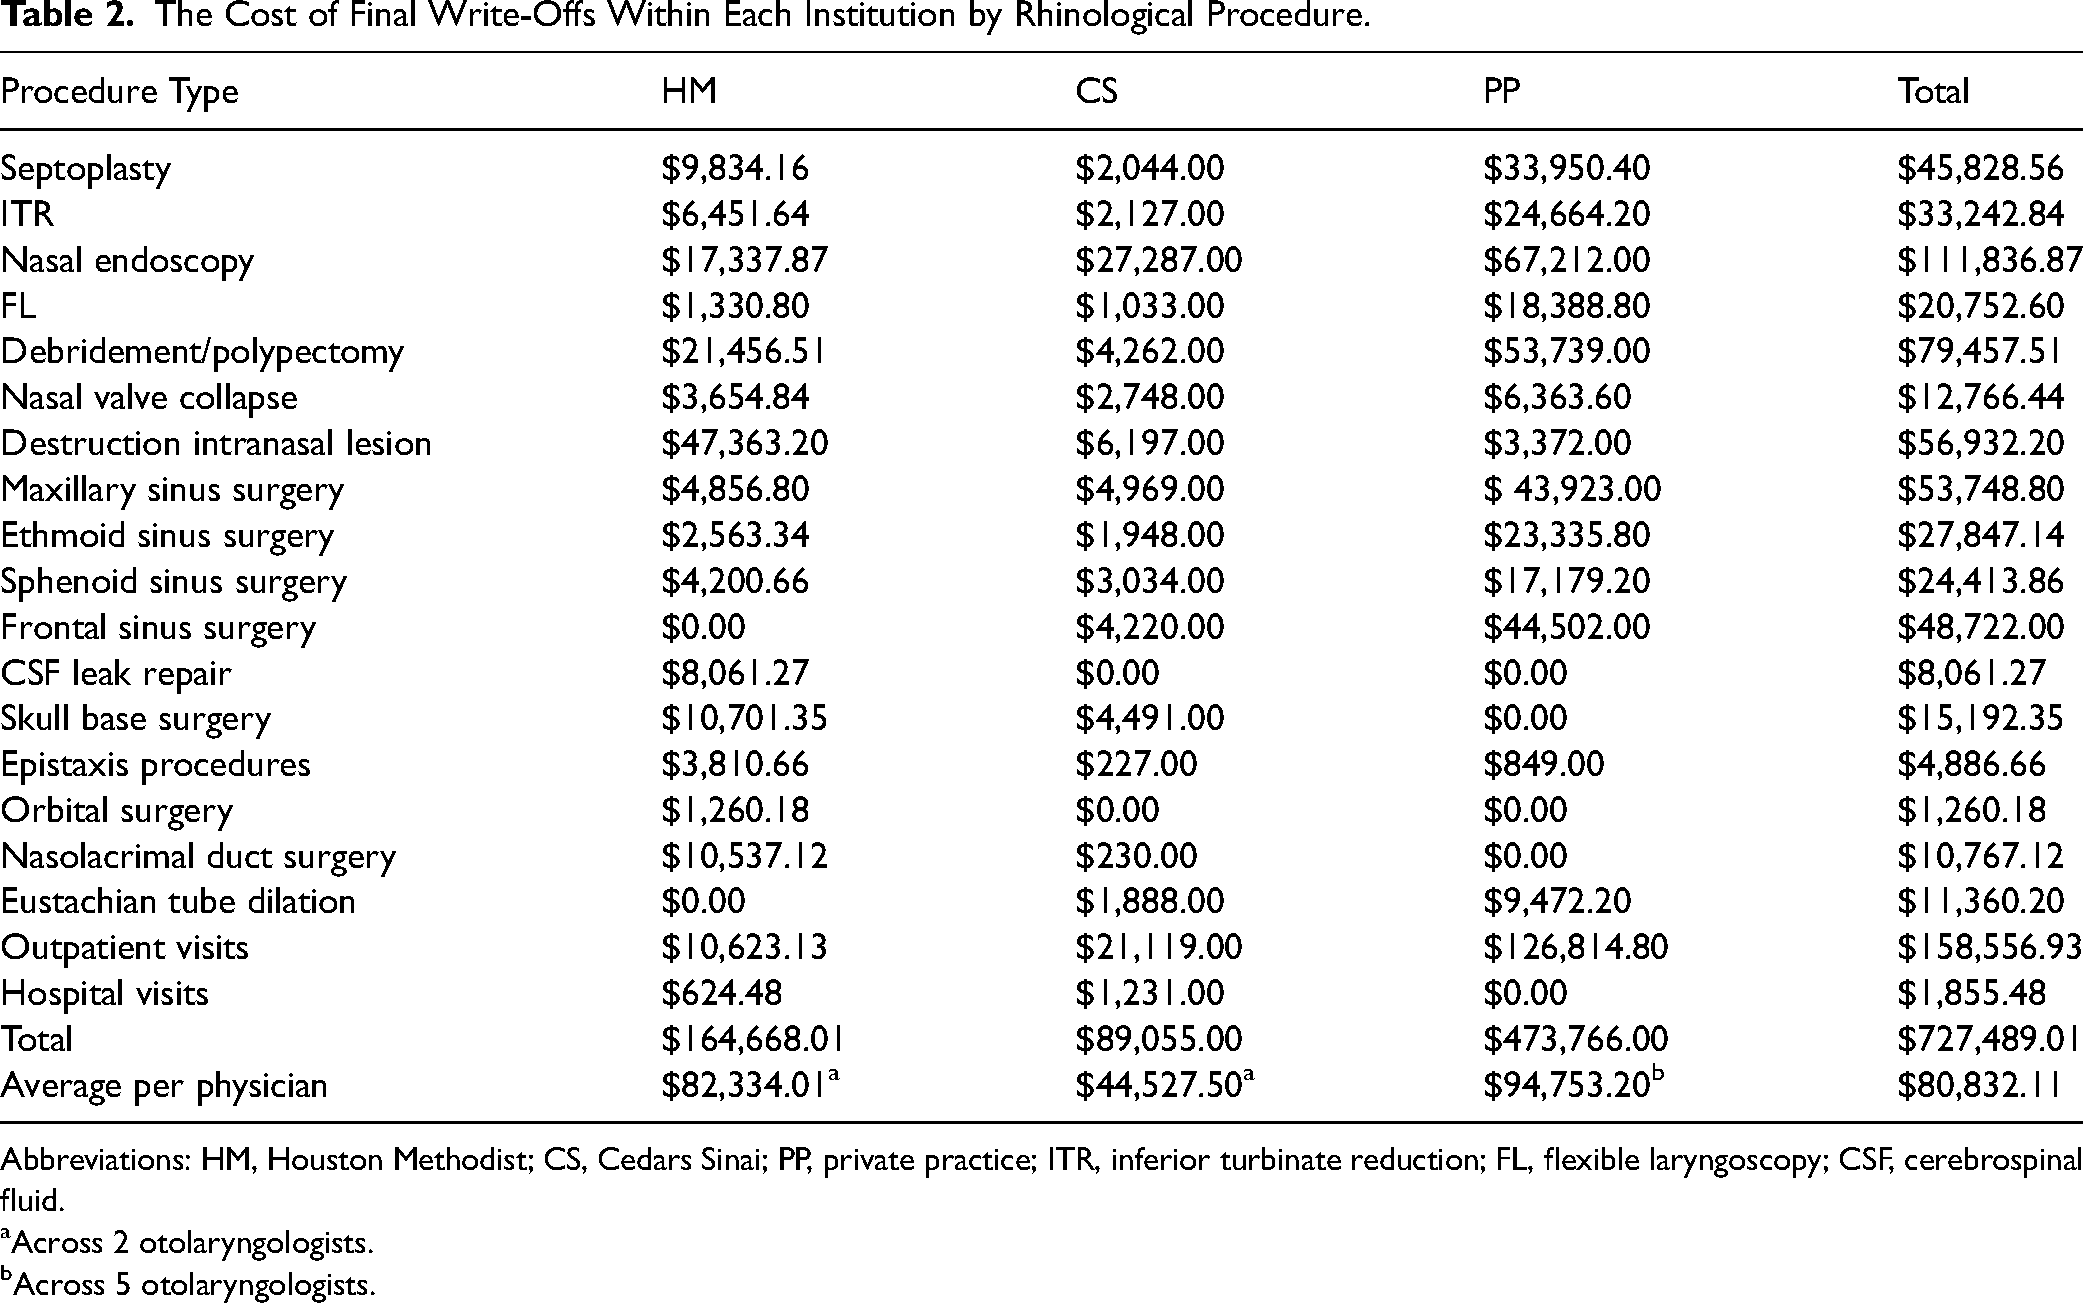
Abbreviations: HM, Houston Methodist; CS, Cedars Sinai; PP, private practice; ITR, inferior turbinate reduction; FL, flexible laryngoscopy; CSF, cerebrospinal fluid.
Across 2 otolaryngologists.
Across 5 otolaryngologists.
A total of 395 outpatient clinic visits accounting for $158,556 were written off among the sites. Excluding the amount for non-rhinological procedures, the average for total final write-offs per physician was $32,332.84 per year. The average total write-off for the top three most costly rhinological procedures per physician was $11,032.29 per year.
Insurance
Information regarding insurance was available only for HM and CS. For NE, claims filed under private insurance had the highest final write-off percentage of 72.9% (314 out of 431), followed by Medicare at 17.9% (77 out of 431), Medicaid at 7.4% (32 out of 431), and Veteran Affairs at 0.23% (1 out of 431). For NDP, claims filed under private insurance had the highest final write-off percentage of 82.2% (171 out of 208), followed by Medicare at 12.5% (26 out of 208), and Medicaid at 4.3% (9 out of 208). Finally, for DIL, claims filed under private insurance had the highest final write-off percentage of 80.0% (74/93), followed by Medicare at 17.2% (16 out of 93), and Medicaid at 3.2% (3 out of 93).
Discussion
The role of insurance in approval and reimbursement for rhinological procedures is complex. Within the United States, obtaining insurance authorization is a tiresome component of medical practice and is becoming more critical to maintain revenue as reimbursement rates for otolaryngological procedures steadily decline. 8 Insurance denials are another concerning issue for medical practices as Singh et al 9 noted a 2.56% increase over a 3-year time frame. Although not specific to rhinology, this study highlights the growing occurrence of denials by insurers which practices can only combat by increasing their administrative staff, further burdening revenue and profitability.
This study provides several new findings to the field of rhinology where the insurance reimbursement and denials literature is scarce. First, a significant difference in initial denial rates was present between the 3 sites (p ≤ .05). This relationship may be attributable to the relatively high rate of HM (10.53%) in comparison to the other sites which were relatively similar (4.70% vs. 3.71%, p < .05). While it is plausible to posit HM's higher rate is due to the department's recent inception, this is less likely when considering the rhinologists’ extensive experience in clinical practice and documentation. Another possibility could be state-specific factors as a prominent Texas insurer has one of the highest national denial rates for issuers receiving more than 5 million claims. 10
The final denial rates among the three sites did not differ as they ranged from 2.22% to 2.9%. This is most certainly due to HM's denial rate normalizing to the other sites’ rates after successfully overturning 75% of initial denials, in line with overturn rates reported in the literature.9,11 Determining the true cause of denials can be a challenging endeavor as payers are reluctant to reveal their criteria and in fact, have little incentive to do so. The Center for Medicare and Medicaid Services has attempted to create more transparency by requiring private insurers in the HealthCare.gov Marketplace to report their reason for denial. However, the impact of this policy is questionable as more than 75% of in-network claims are denied due to “all other reasons,” while 14% and 8% are denied due to an excluded service or lack of preauthorization/referral, respectively. 10 When querying for reason for initial and final denial, there was no adequate data available at all three of the institutions. Most reasons stated were difficult to interpret and coded in terminology that was not understood.
For the 9 physicians involved in the study, approximately $80,000 worth of rhinological procedures were written off over a 2.5-year period. This equates to a loss of about $32,000 per year which could be directed toward hiring support staff such as a medical assistant or purchasing imaging equipment. When examining each respective institution, the significant loss of revenue remains as per year write-offs for HM ($32,933.60) and PP ($37,901.28) were similar to the aggregate, but CS ($17,811.00) was much less. Comparing CS and HM, both academic practices with 2 physicians in the sample, can reveal the difference in per year write-off may be a result of HM writing off almost 7 times the amount CS did for DIL.
Regarding procedural write-offs, the high dollar-value write-off procedures included NE, debridement/polypectomy, and destruction of intranasal lesion. Due to its frequency, NE has been known to be one of the highest-reimbursed clinical procedures within the field of otolaryngology.12,13 The common use of NE and debridement may account for the cumulative dollar amounts and percentages of denials. Furthermore, posterior nasal nerve ablation devices are often billed under “destruction of intranasal lesion” along with nasal valve radiofrequency ablation. Several insurances consider this procedure to be “investigational” and often are not covered which may explain the high final write-off amount. 14 In terms of insurance types, private insurance had the highest denial rates. Rhinologists may need to account for these denial rates when considering financial reimbursement for their procedures.
This study provides a unique look into claim denials within rhinology and is strengthened by the inclusion of both academics and PPs that are in distinct areas of the US. However, there are a few limitations to this study that should be considered. The 3 practices included all have robust billing departments that are responsible for disputing denials, a luxury that other practices may be unable to afford. This shows that practices may lose a fair amount of revenue even with dedicated staff, but also limits generalizability to practices with similar resources. Furthermore, the authors could not present definitive reasons for denial of these procedures as payers are reluctant to reveal this information without considerable persistence. This tendency of payers is unlikely to change without political and policy changes that create a more transparent environment. Other weaknesses include the availability of insurance types from only 2 out of 3 sites and a lack of individual patient data. Lastly, the study timeline partially includes the COVID-19 pandemic which may be a possible confounder. Rhinologists, whether in academic or PP, may consider this data as a part of their reimbursement planning and budgeting for their practices.
Conclusion
Insurance may deny between 2% and 3% of claims for rhinological procedures after appealing initial denials. This is further highlighted by the significant amount of revenue that is written-off which equates to $32,000 per year. The most common procedures that are written off include NE and nasal debridement. Moving forward, rhinology practices should be cognizant of the changes and effects of insurance denials on their practice.
Supplemental Material
sj-docx-1-ajr-10.1177_19458924241242856 - Supplemental material for Multi-Institutional Analysis of Insurance Denial Patterns Within Rhinology *
Supplemental material, sj-docx-1-ajr-10.1177_19458924241242856 for Multi-Institutional Analysis of Insurance Denial Patterns Within Rhinology * by Tyler A. Janz, Najm S. Khan, Aatin K. Dhanda, Masayoshi Takashima and Arthur W. Wu, Dennis M. Tang, Thomas S. Higgins, Murugappan Ramanathan, Omar G. Ahmed in American Journal of Rhinology & Allergy
Footnotes
Declaration of Conflicting Interests
The authors declared the following potential conflicts of interest with respect to the research, authorship, and/or publication of this article: Omar G. Ahmed is a consultant for Aerin Medical and Medtronic ENT, which are not affiliated with this study. Mas Takashima is a consultant for Neurent Medical and Medtronic ENT, which are not affiliated with this study. Dennis Tang is a consultant for Acclarent, 3-D Matrix, and Aerin Medical, which are not affiliated with this study. Thomas Higgins is a speaker for Regeneron/Sanofi, consultant for Medtronic, Stryker, and Optinose, and investigator for GSK, AstraZeneca, Neurent Medical, Optinose, Biohaven, and Gossamer, which are not affiliated with this study. All other authors declare that there is no conflict of interest.
Ethical Committee Approval
Ethical approval for this study was not sought for the present study because the financial data was deidentified by each institution’s billing department.
Funding
The authors received no financial support for the research, authorship, and/or publication of this article.
Supplemental Material
Supplemental material for this article is available online.
References
Supplementary Material
Please find the following supplemental material available below.
For Open Access articles published under a Creative Commons License, all supplemental material carries the same license as the article it is associated with.
For non-Open Access articles published, all supplemental material carries a non-exclusive license, and permission requests for re-use of supplemental material or any part of supplemental material shall be sent directly to the copyright owner as specified in the copyright notice associated with the article.