
Abstract
Objective
To investigate water and lipid composition changes in knee subchondral bone marrow and cartilage in chronic kidney disease (CKD) patients compared with age- and sex-matched healthy controls using magnetic resonance spectroscopy (MRS) and T2 mapping.
Design
This IRB-approved case-control study included 20 CKD patients (12 men, 8 women) and 20 age- and sex-matched healthy controls (10 men, 10 women). MRS and T2 measurements were performed on regions of interest in the knee subchondral bone and cartilage. Water content, lipid composition, fat content, and the unsaturation index (UI) were quantified using LCModel. Differences between groups were assessed using independent samples T-tests.
Results
The CKD group showed a significantly higher lipid UI compared with controls (P = 0.035). In subgroup analysis, women with CKD had significantly higher water content (4.7 ppm), lower fat content, and higher lipid UI than female controls (P = 0.023, 0.048, and 0.018, respectively). No significant differences were observed between men with CKD and male controls (all P > 0.4). Among CKD patients, men had significantly lower lipid composition (5.3 ppm) and lipid UI compared with women (P = 0.026 and 0.012, respectively). T2 values were significantly elevated in CKD patients (P = 0.016 for men; P = 0.031 for women).
Conclusions
Quantitative MRS and T2 mapping are feasible tools for assessing CKD-related changes in the knee joint. Increased unsaturated lipid content and water in subchondral bone may contribute to early degenerative changes.
Keywords
Introduction
Patients with chronic kidney disease (CKD) have complex disorders of mineral and bone metabolism which include biochemical abnormalities, bone diseases, and extra-skeletal calcifications.1,2 CKD patients, especially those with end-stage renal disease, often have clinical symptoms including bone pain, joint pain, bone deformity, and bone fracture. However, the abnormal bone structure and function from CKD can begin many years before these symptoms appear in patients with kidney disease. Musculoskeletal problems significantly limit quality of life in patients with renal failure.3,4
It has been shown that the prevalence of CKD and osteoarthritis (OA) comorbidity is rising, likely due to aging populations and shared risk factors such as hypertension, obesity, and metabolic syndrome. 5 A hospital-based study by Muyodi et al. 6 reported a CKD prevalence of 61.9% among OA patients, with stage 3A and 3B CKD accounting for 45.5% and 13.7% of cases, respectively—particularly in individuals over the age of 65. Similarly, another study found that 16 out of 34 patients with inflammatory arthritis were also diagnosed with CKD. 7 In addition, 53.9% of long-term hemodialysis patients with CKD were diagnosed with OA, with the prevalence increasing proportionally with the duration of dialysis treatment.8,9 However, the overlap in epidemiology and radiographic features of CKD arthropathy with that of other arthritic diseases, such as degenerative OA, renders diagnostic confirmation more difficult.
The mechanisms underlying CKD arthropathy are multifactorial, involving parathyroid hormone (PTH), amyloidosis, inflammatory cytokines, and uremic toxins.10 -13 Secondary hyperparathyroidism increases osteoclastic activity, causing bone resorption at subchondral, endosteal, and subperiosteal sites, which leads to abnormal bone turnover and arthropathy. OA is a degenerative joint disease characterized by cartilage degradation, subchondral bone remodeling, and synovial inflammation.14,15 As OA progresses, cartilage loss and subchondral bone exposure promote vascular invasion and further degeneration.
Previous studies showed that the magnetic resonance spectroscopy (MRS) provides a noninvasive method for quantifying biochemical or metabolic changes in tissues. In the case of lumbar spine bone marrow, the water and lipids contents can be measured using MRS.16 -19 A recent study showed that CKD patients have significantly higher lumbar spine bone marrow fat than healthy adults. 20 Different compartments of lipids can be also investigated using MRS. Of particular interest are indices that provide measures of the unsaturation levels among the triglycerides, which may have potential medical applications.21 -23 While MRS has been widely applied in brain, muscle, prostate, and spinal marrow imaging, its use in evaluating the knee subchondral bone remains limited . 24
In addition, magnetic resonance (MR) T2 mapping has proven to be a sensitive method for evaluating cartilage composition, particularly collagen matrix integrity and water content.25 -30 T2 relaxation time serves as a reliable indicator of tissue properties, and therefore, it may be used as an objective diagnostic tool in early cartilage degeneration damage before morphological abnormalities appear. In the context of CKD, where biochemical alterations may precede structural damage, combining T2 mapping with MRS may provide a more comprehensive evaluation of joint health.
Therefore, in this case-control study, we aimed to use quantitative MRS to evaluate early changes in knee subchondral bone marrow—focusing on water content, lipid composition, fat content, and the unsaturation index (UI)—in patients with CKD. In addition, we also assessed cartilage integrity using T2 mapping. To our knowledge, few studies have examined the concurrent use of MRS and T2 mapping to investigate alterations in the knee joints of CKD patients.
Materials and Methods
Patient Population
This study was approved by the Institutional Review Board of our hospital. All participants provided written informed consent to undergo non-contrast MR studies, including conventional MR images and MRS of the knee during the period of 1 January 2014 to 31 December 2014. Inclusion criteria were age 20 years and above, and fulfillment of the criteria indicated in the clinical practice guidelines of the National Kidney Foundation Disease Outcomes Quality Initiative (K/DOQI) for CKD. This includes those with estimated glomerular filtration rate (eGFR) < 60 ml/min with features of CKD for >3 months. Exclusion criteria were having renal tubular acidosis, Fanconi syndrome, rheumatoid arthritis, or multiple myeloma and administration of medications affecting bone metabolism such as steroids, bisphosphonates, and calcitonin during the past 3 months preceding the study. As the bone composition is associated with sex, age, and body mass index (BMI),31,32 water content and lipid composition in bone marrow might change with these parameters. Thus, the anthropometric data (sex, age, and BMI defined as body weight in kilograms divided by squared height in meters) of CKD patients were collected to recruit gender-, age-, and BMI-matched normal subjects as controls. After exclusion of subjects who failed to meet the criteria mentioned above, a total of 20 patients with CKD (12 men and 8 women, mean age: 56.10 ± 7.04 years) and 20 normal controls (10 men and 10 women, mean age: 57.10 ± 6.32 years) were enrolled in this study. In addition to magnetic resonance imaging (MRI) assessments, several clinical parameters were documented for each participant. Bone mineral density (BMD) was measured using dual-energy X-ray absorptiometry (DEXA) to assess bone health. The severity of osteoarthritic changes in the knee was graded radiographically using the Kellgren-Lawrence (KL) system. Furthermore, knee pain and functional limitations were evaluated using the Western Ontario and McMaster Universities Osteoarthritis Index (WOMAC) pain score.
Routine MRI Protocol
All the studies were performed using a 3.0 Tesla (T) whole body imaging system (Discovery MR750, GE Healthcare, Waukesha, WI). To assess the condition of the knee subchondral bone, the imaging protocol included an axial T1-weighted image acquired using a spin-echo sequence for positioning with the following parameters: repetition time (TR) = 600 ms, echo time (TE) = 14 ms, number of excitations (NEX) = 1, matrix size = 256 × 256, slice thickness = 5 mm, and acquisition time = 2 minutes 35 seconds. Subsequently, oblique sagittal T2-weighted fat suppression images were obtained by using a multi-slice turbo spin-echo sequence. These conventional MR images were interpreted by an experienced musculoskeletal radiologist (G-S.H., 30 years). Size of cartilage lesions (area of cartilage loss) was estimated to be a % of the cartilage surface area of each individual region and given a modified MRI Osteoarthritis Knee Score (MOAKS) as follows: grade 0 = none, grade 1 = 10%, grade 2 = 10%-75%, and grade 3 = >75%. 33 The femoral and tibial surfaces were divided into five separate regions: medial and lateral central femur (MFc and LFc), medial and lateral posterior femur (MFp and LFp), and medial and lateral anterior, central, and posterior tibia (MTa, MTc, and MTp; LTa, LTc, and LTp). Thus, the regions of the medial femorotibial joint (MFTJ) were the MFc, MFp, MTa, MTc, and MTp and those of the lateral femorotibial joint (LFTJ) were the LFc, LFp, LTa, LTc, and LTp. The maximum MOAKS for the MFTJ and LFTJ was 30.
MRS Protocol and Quantification
MRS acquisition was performed in subchondral bone using point-resolved spectroscopy (PRESS) for voxel localization. An automatic global shimming procedure was performed before each acquisition. MRS acquisition parameters were TR of 1,500 ms, TE of 35 ms to minimize T2 weighting, acquisition of 128 signals for each of the 4,096 data points without water suppression, and a spectral bandwidth (BW) of 5,000 Hz. The size of the voxel of interest (VOI) was set at 20 × 20 × 10 mm3 and the acquisition time was 4 minutes 24 seconds. Each voxel was positioned by the same investigator in the middle of the subchondral bone of all CKD patients and normal controls (
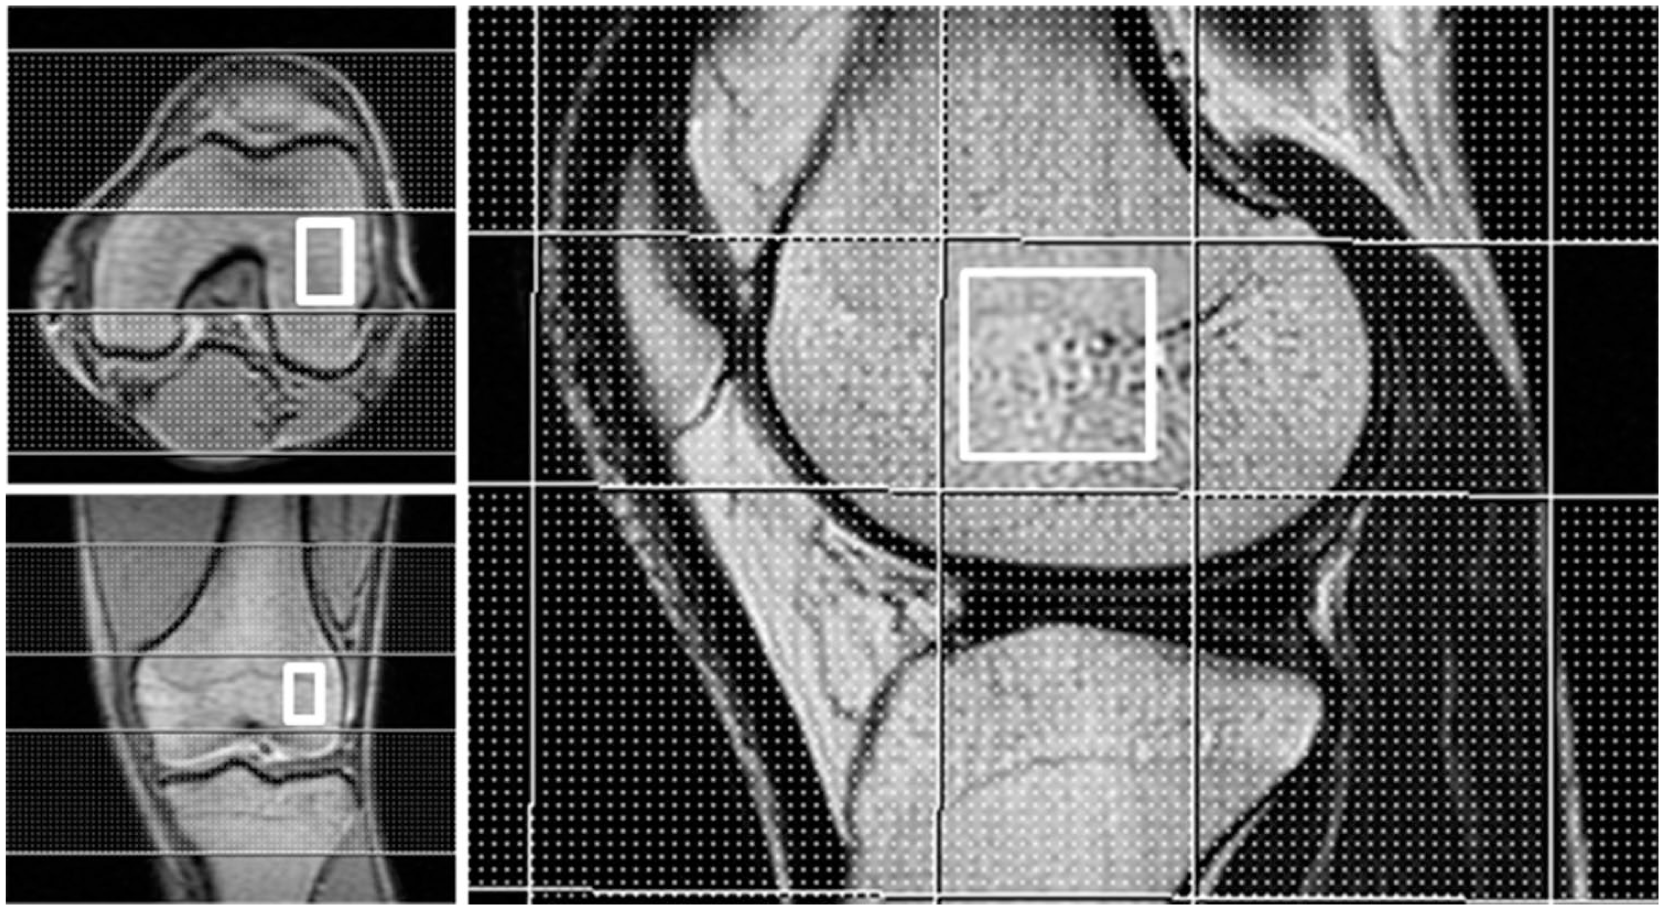
Single voxel proton MR spectroscopy (SV-1H-MRS) acquired from knee subchondral bone using point-resolved spectroscopy (PRESS) acquisition. A rectangular PRESS box was positioned in the middle of the subchondral bone. The sagittal T2-weighted fast spin echo sequence was used for visual assessment of subchondral bone and for prescription of the spectral acquisition box. Single voxel 1H-MRS was acquired in knee subchondral bone marrow using the PRESS sequence.
Acquired proton MRS spectra showed a dominant peak at 1.30 ppm and a series of lipid peaks at 3.0 T (

where Iwater was the absolute concentration of water and Ifat was the 1.3 ppm lipids. Similarly, the fat content in bone marrow was calculated using the equation:

Marrow lipid UI was estimated using the equation:

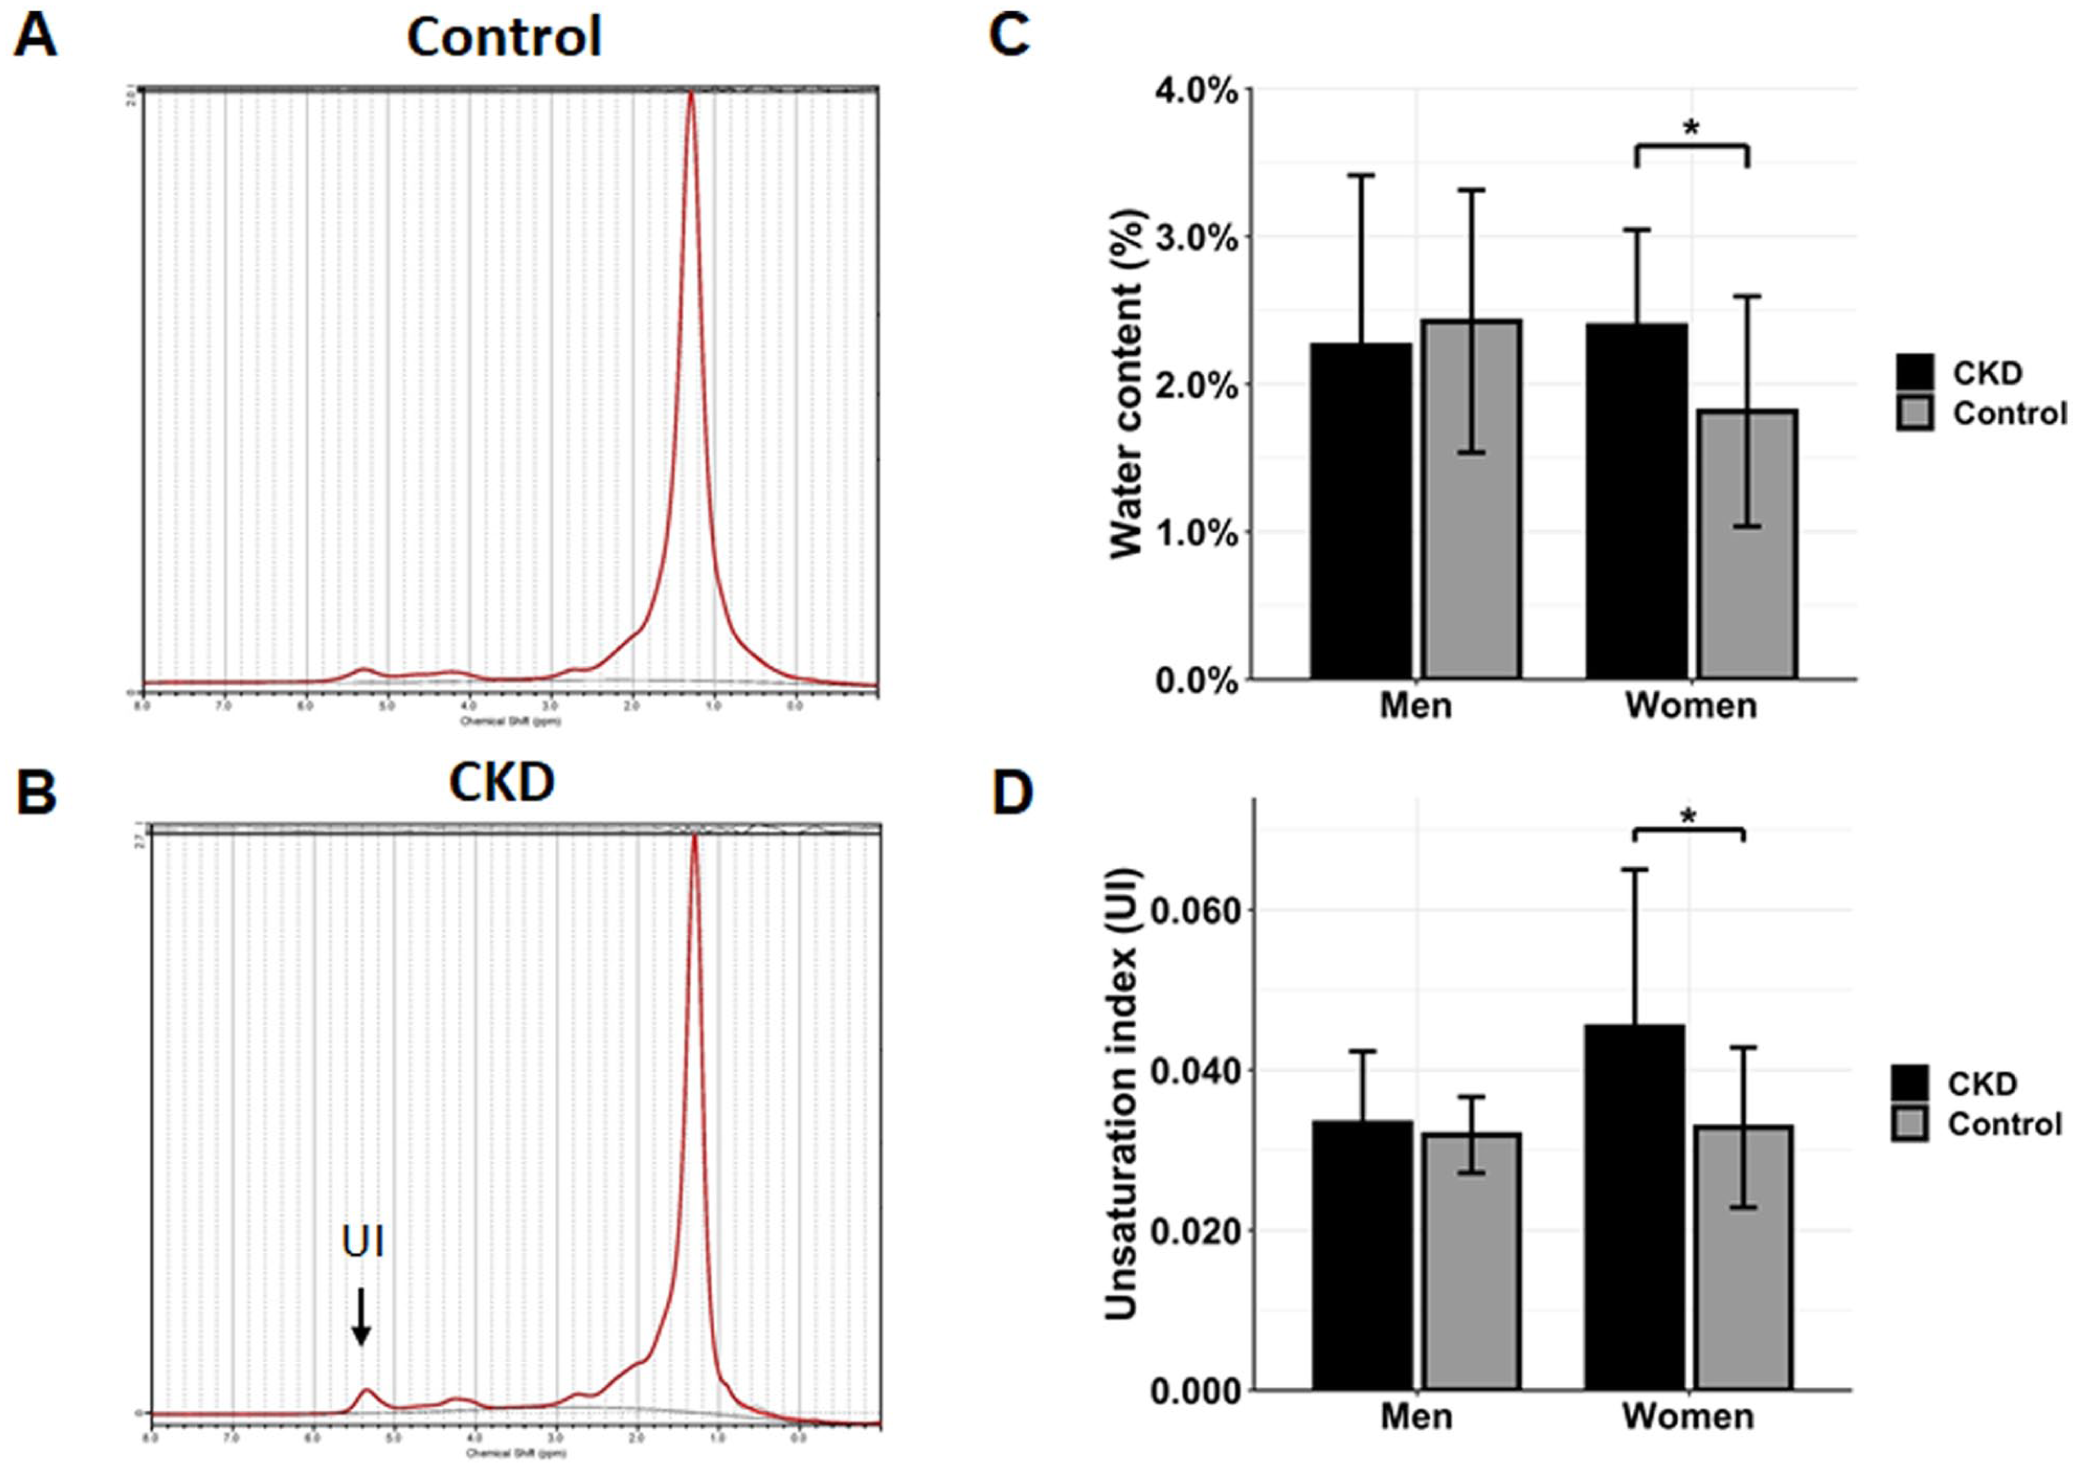
Alterations in unsaturated lipid and water content in subchondral bone marrow of CKD patients. ((
1H-MRS Spectral Peak Assignments Analyzed in This Study (3.0 T Magnetic Field).
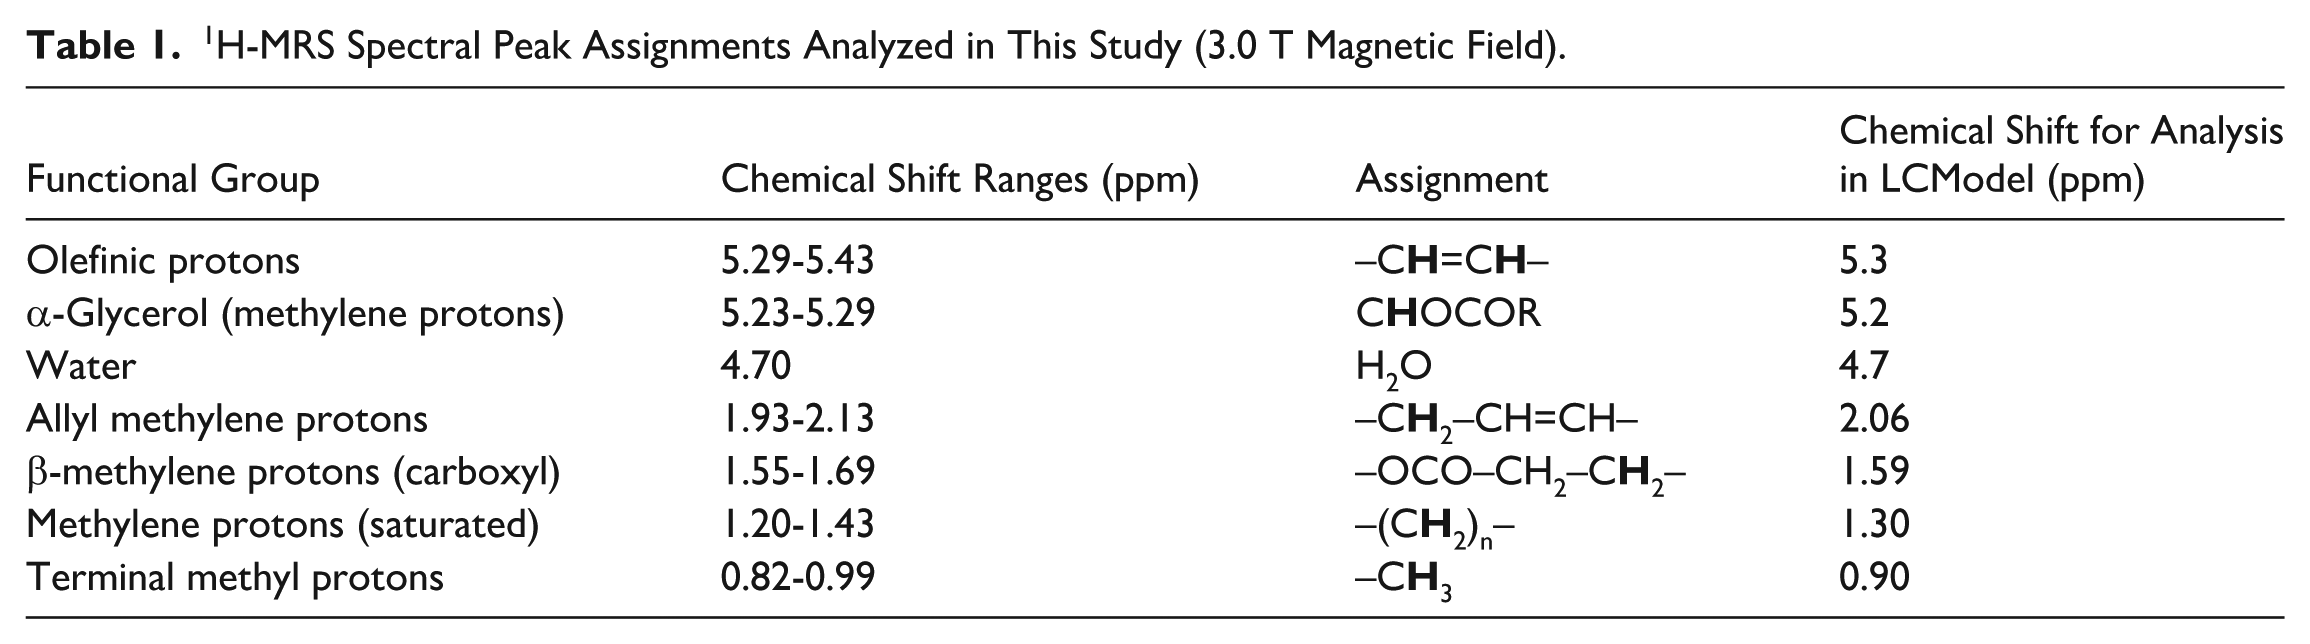
where IOlefinic was the absolute concentration of functional groups with olefinic group (L53), and IMethylene and IMethyl were absolute concentrations of the methylene groups (L13, L16, L21, and L52) and methyl group (L09), respectively.
T2 Mapping Protocol and Quantification
To understand the structural properties of the knee cartilage, both the anterior horns and posterior horns of the medial and lateral menisci were selected as regions of interest (ROIs), and MR images in the sagittal plane were acquired. After 3-plane scout localizer imaging, 20 contiguous axial T1-weighted images were acquired for the purpose of later slice positioning using a spin echo sequence with repetition time (TR) = 600 ms, echo time (TE) = 14 ms, number of excitations (NEX) = 1, matrix size = 256 × 256, slice thickness = 5 mm, and acquisition time = 2 minutes 35 seconds. From a total of 20 axial slices, the single axial plane showing the largest width of femoral condyles on both the medial and lateral sides of the knee joint, covering most of the menisci, were selected manually as the reference plane. Based on the selected axial reference plane, the sagittal planes for the posterior horns of the knee menisci were acquired by placing 9 contiguous slices with orientation parallel to the long axes of the femoral condyles. The T2 quantification was based on the multi-echo fast spin-echo sequence with the following parameters 37 : TR = 2500 ms, field of view (FOV) = 14 cm, matrix = 256 × 256, slice thickness = 2 mm, slice gap = 1 mm, BW = 31.25 kHz. As to articular cartilage, the imaging parameters were the same as those of the menisci except for magnetization preparation TE = 6.8/13.6/20.5/27.3/34.1/40.9/47.8/54.6 ms and acquisition time of 11 minutes 40 seconds. Fat suppression was used to improve the tissue contrast of the images so that the derived T2 value was less prone to inaccuracy representing fat signal contamination from partial volume effects.
After completion of image acquisition, the data were transferred to a workstation for data processing and quantification of T2 relaxation in the cartilage and meniscus. T2 maps were reconstructed by using the least-square single-exponential curve-fitting algorithm with the equations below to fit the T2 images pixel by pixel:

ROIs were placed manually on the femorotibial cartilage by referencing to the first-echo image used to calculate the mean and standard deviation of the T2 relaxation time. The cartilage compartments analyzed included the lateral femoral condyle (LFC), medial femoral condyle (MFC), lateral tibia (LT), and medial tibia (MT). Color-coded quantitative T2 maps in control and CKD patients with the segmented femoral condyle and tibia compartments are displayed in
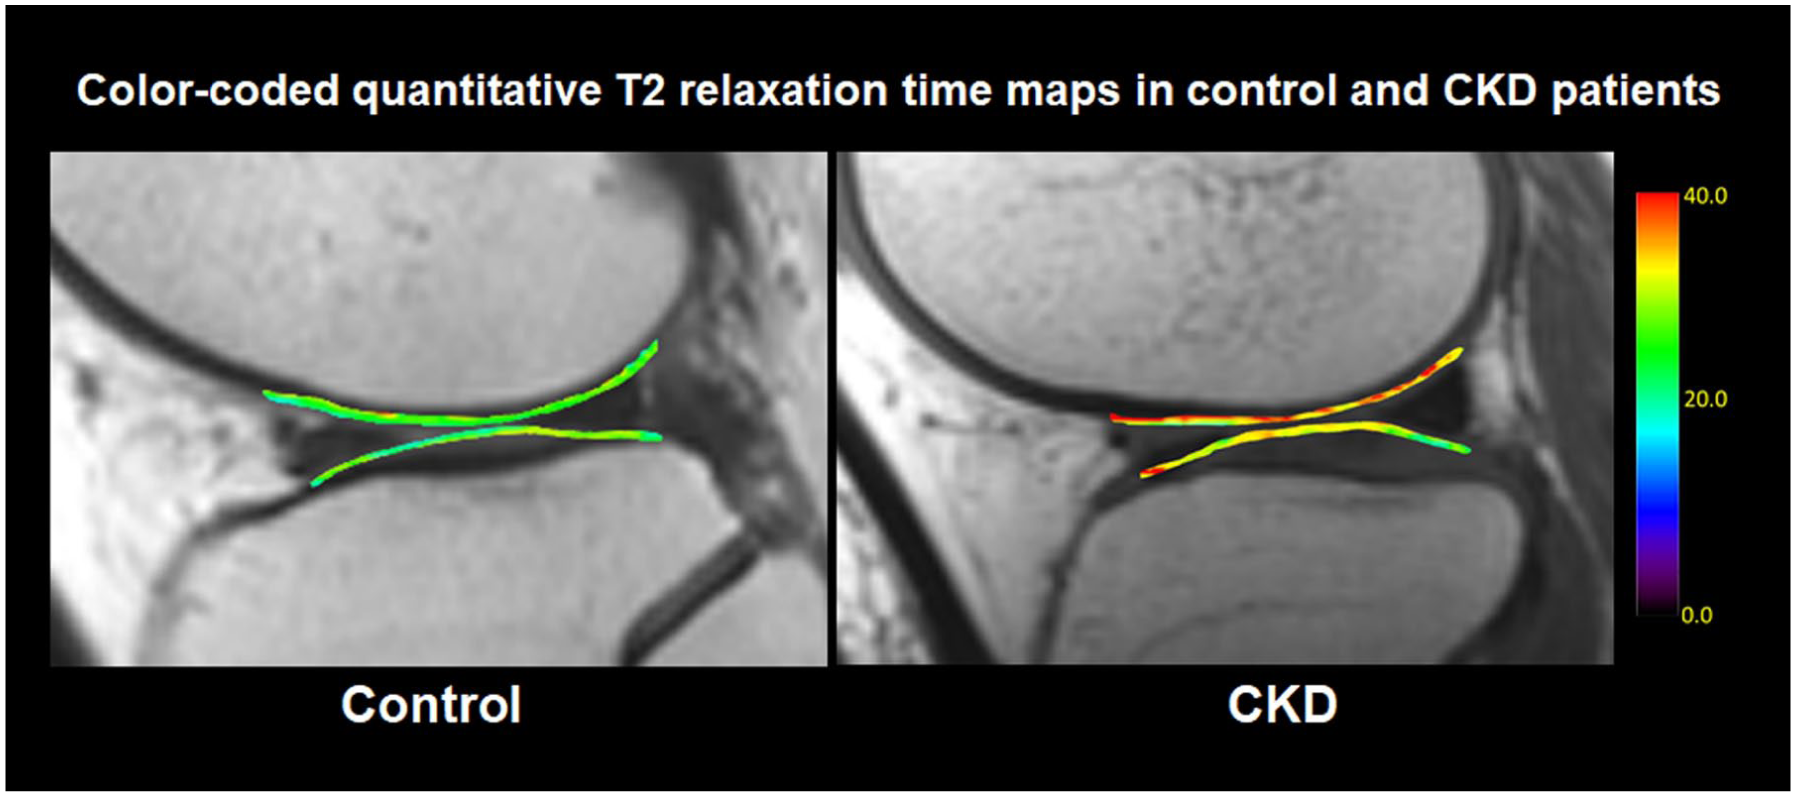
Color-coded quantitative T2 maps of the segmented femoral condyle and tibia compartments in cartilage between groups. T2 quantification maps reveal significantly elevated T2 values in CKD compared with controls.
Statistical Analysis
In this study, we assigned men with CKD to Group 1 (n = 12), women with CKD to Group 2 (n = 8), and their age- and sex-matched controls to Group 1C (n = 10) and Group 2C (n = 10). Independent sample t-tests were used for comparing the mean ages, BMIs, eGFR, WOMAC pain score, BMD, KL grade, and MOAKS between the CKD patients and control groups (i.e., Group 1 vs. Group 1C, Group 2 vs. Group 2C). We also used the independent samples T-test to compare water content, lipid composition, and UI in the bone marrow of the knee joints between the CKD patients and control groups. All data were analyzed using the Statistical Package for Social Sciences, Version 20.0 (SPSS, Chicago, IL). Differences were considered statistically significant when the P value was below 0.05.
Results
Characteristics and Clinical Parameters
Overview of Clinical Characteristics in All Subjects (n = 40).
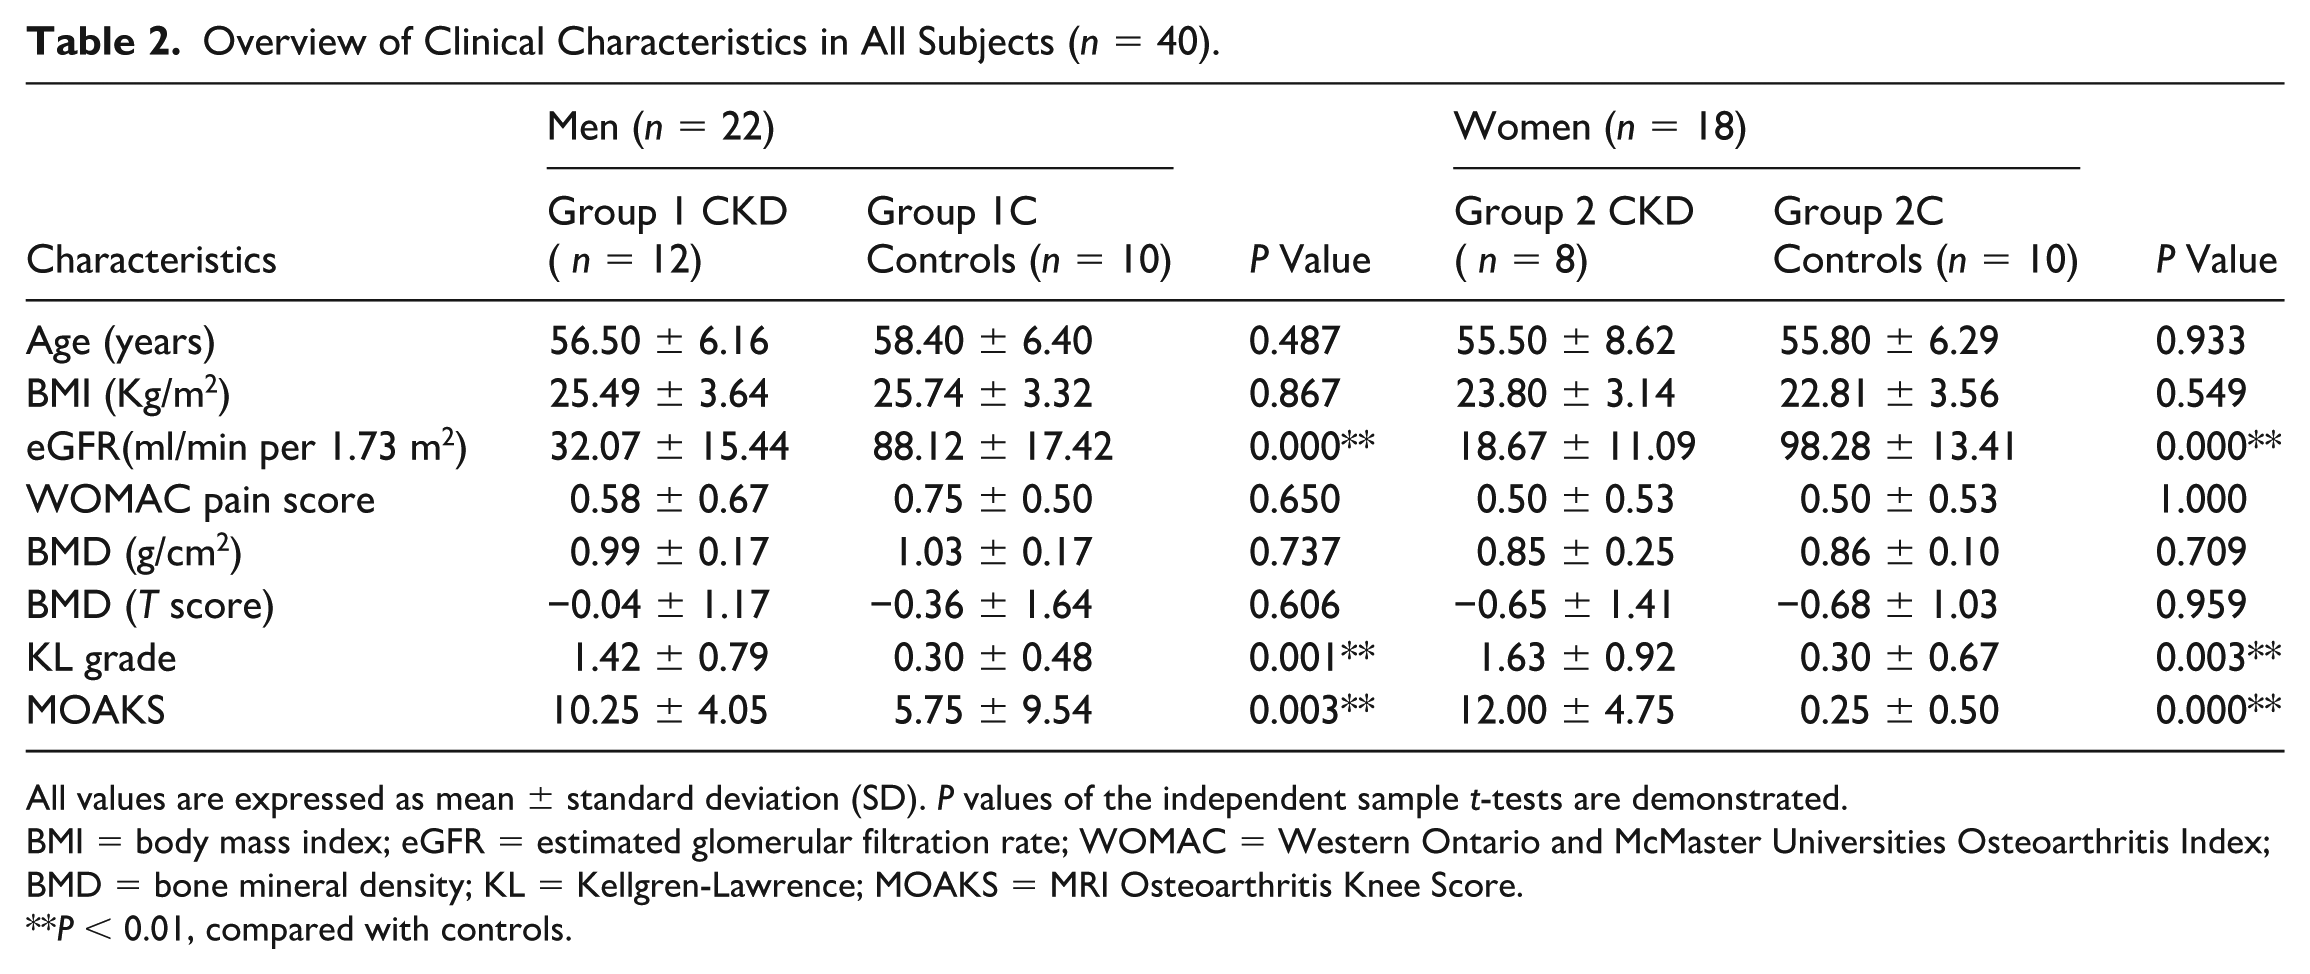
All values are expressed as mean ± standard deviation (SD). P values of the independent sample t-tests are demonstrated.
BMI = body mass index; eGFR = estimated glomerular filtration rate; WOMAC = Western Ontario and McMaster Universities Osteoarthritis Index; BMD = bone mineral density; KL = Kellgren-Lawrence; MOAKS = MRI Osteoarthritis Knee Score.
P < 0.01, compared with controls.
MRS Parameters in the Subchondral Bone Compared between CKD and Control Groups
Mean Water Content, Lipid Compositions, and Unsaturation Index of Lipids in the Knee Subchondral Bone of CKD Patients and Controls.
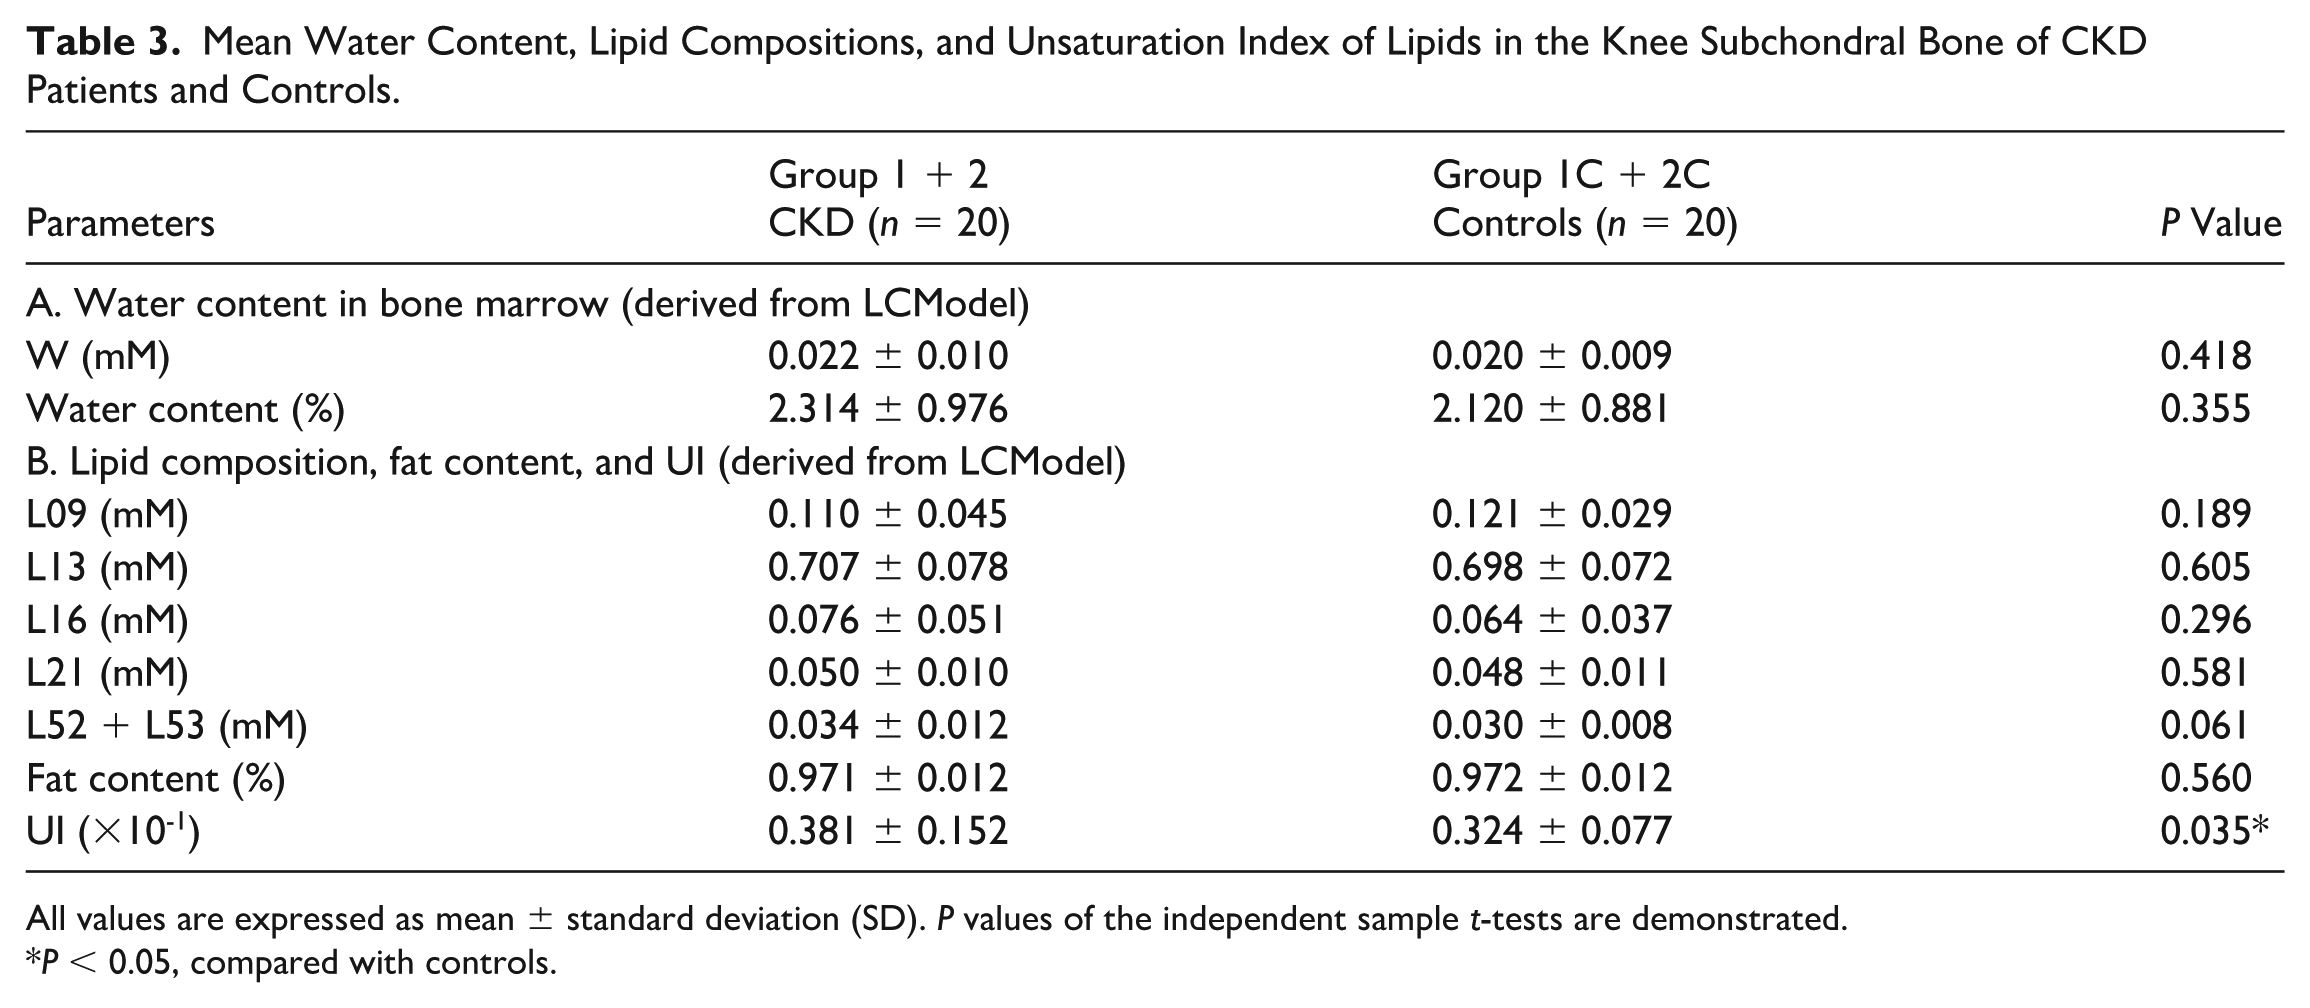
All values are expressed as mean ± standard deviation (SD). P values of the independent sample t-tests are demonstrated.
P < 0.05, compared with controls.
MRS Parameters in the Subchondral Bone Compared between Sex-Specific Subgroups
Mean Water Content, Lipid Composition, and Unsaturation Index of Lipids in the Knee Subchondral Bone of CKD Patients and Controls.
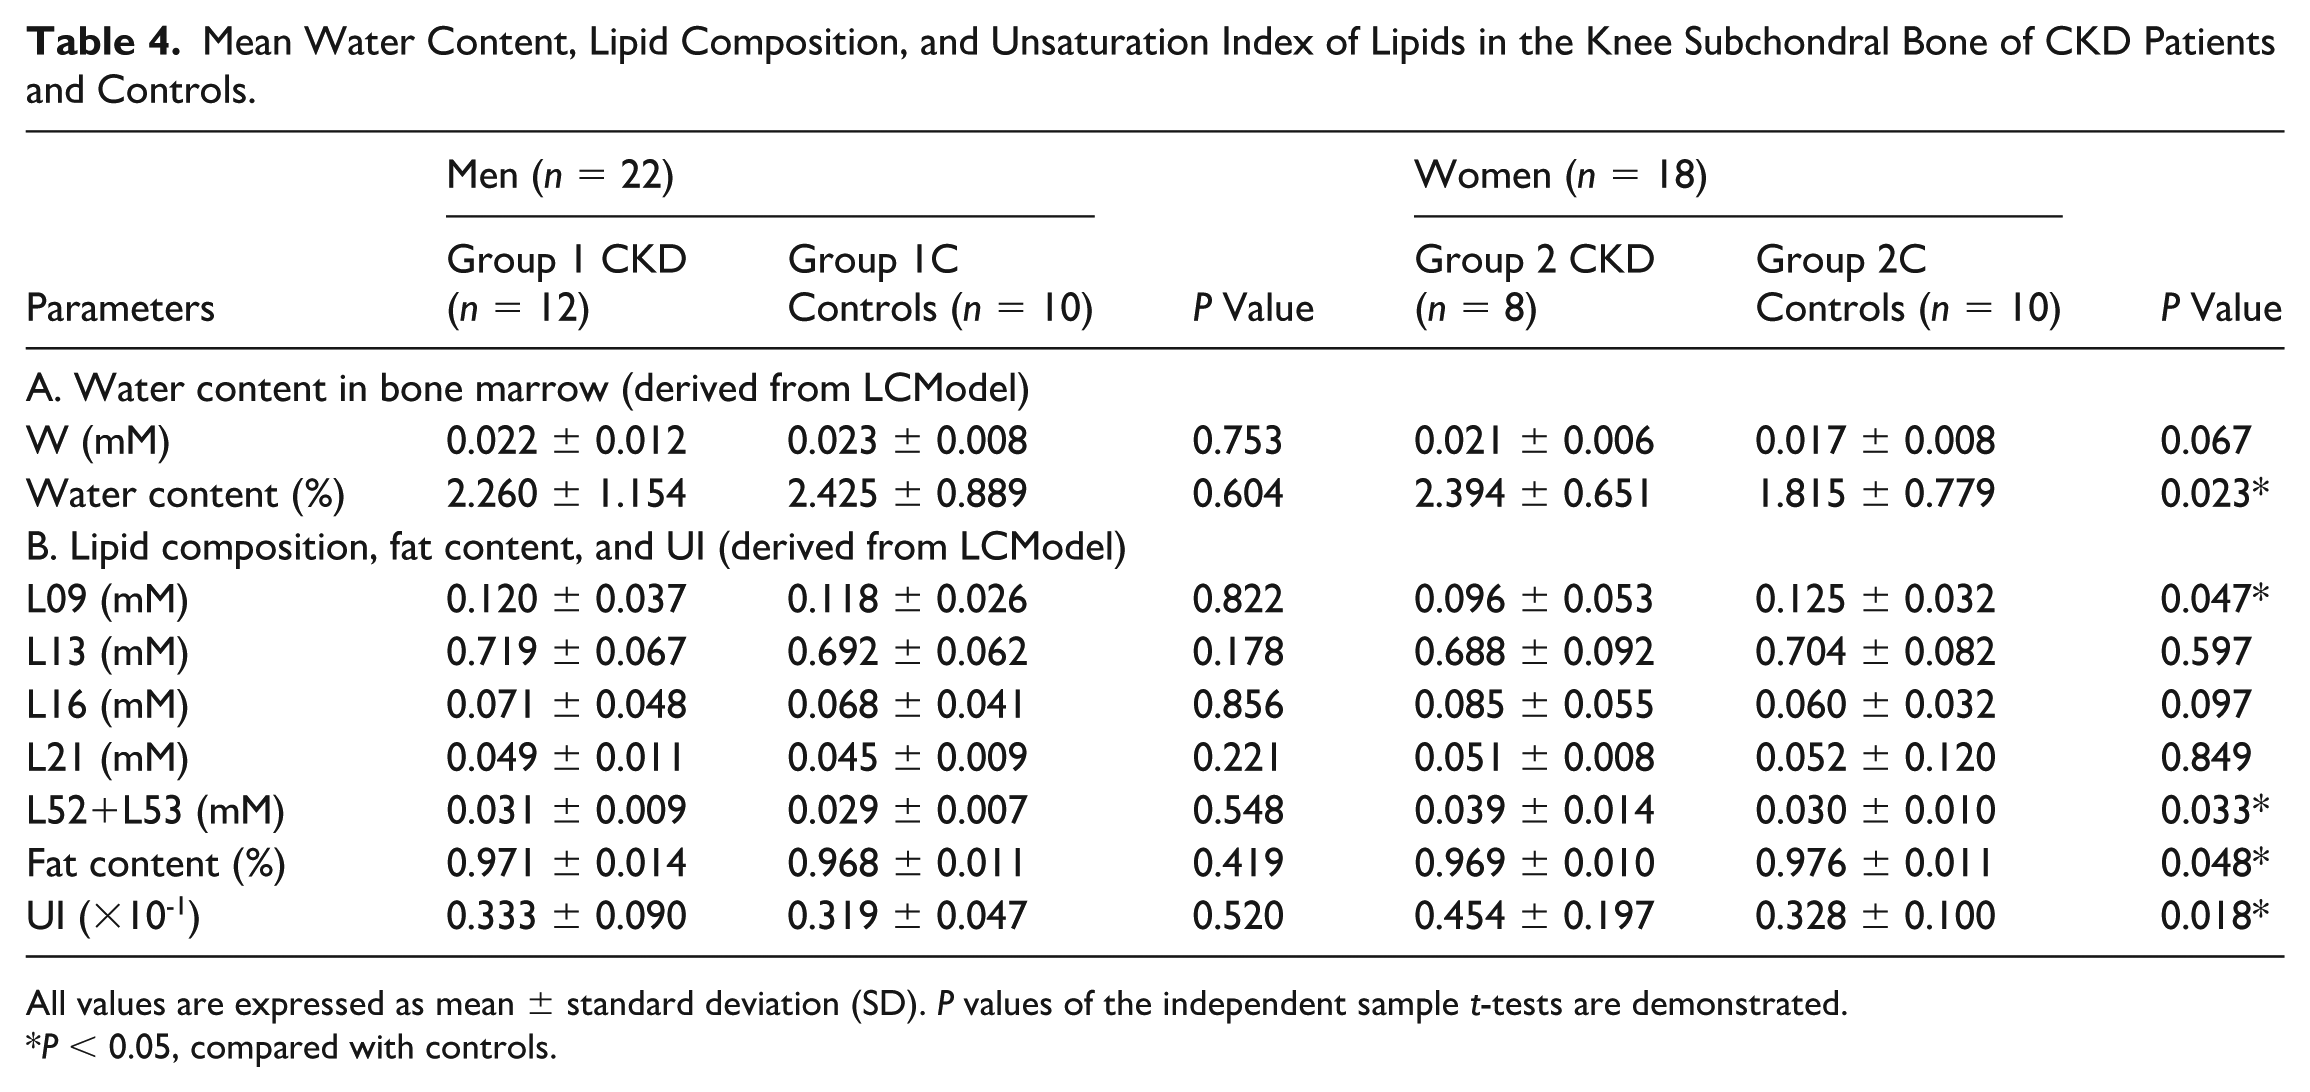
All values are expressed as mean ± standard deviation (SD). P values of the independent sample t-tests are demonstrated.
P < 0.05, compared with controls.
MRS Parameters in the Subchondral Bone Compared between CKD Groups
Mean Water Content, Lipid Composition, and Unsaturation Index of Lipids in the Knee Subchondral Bone of CKD Patients.
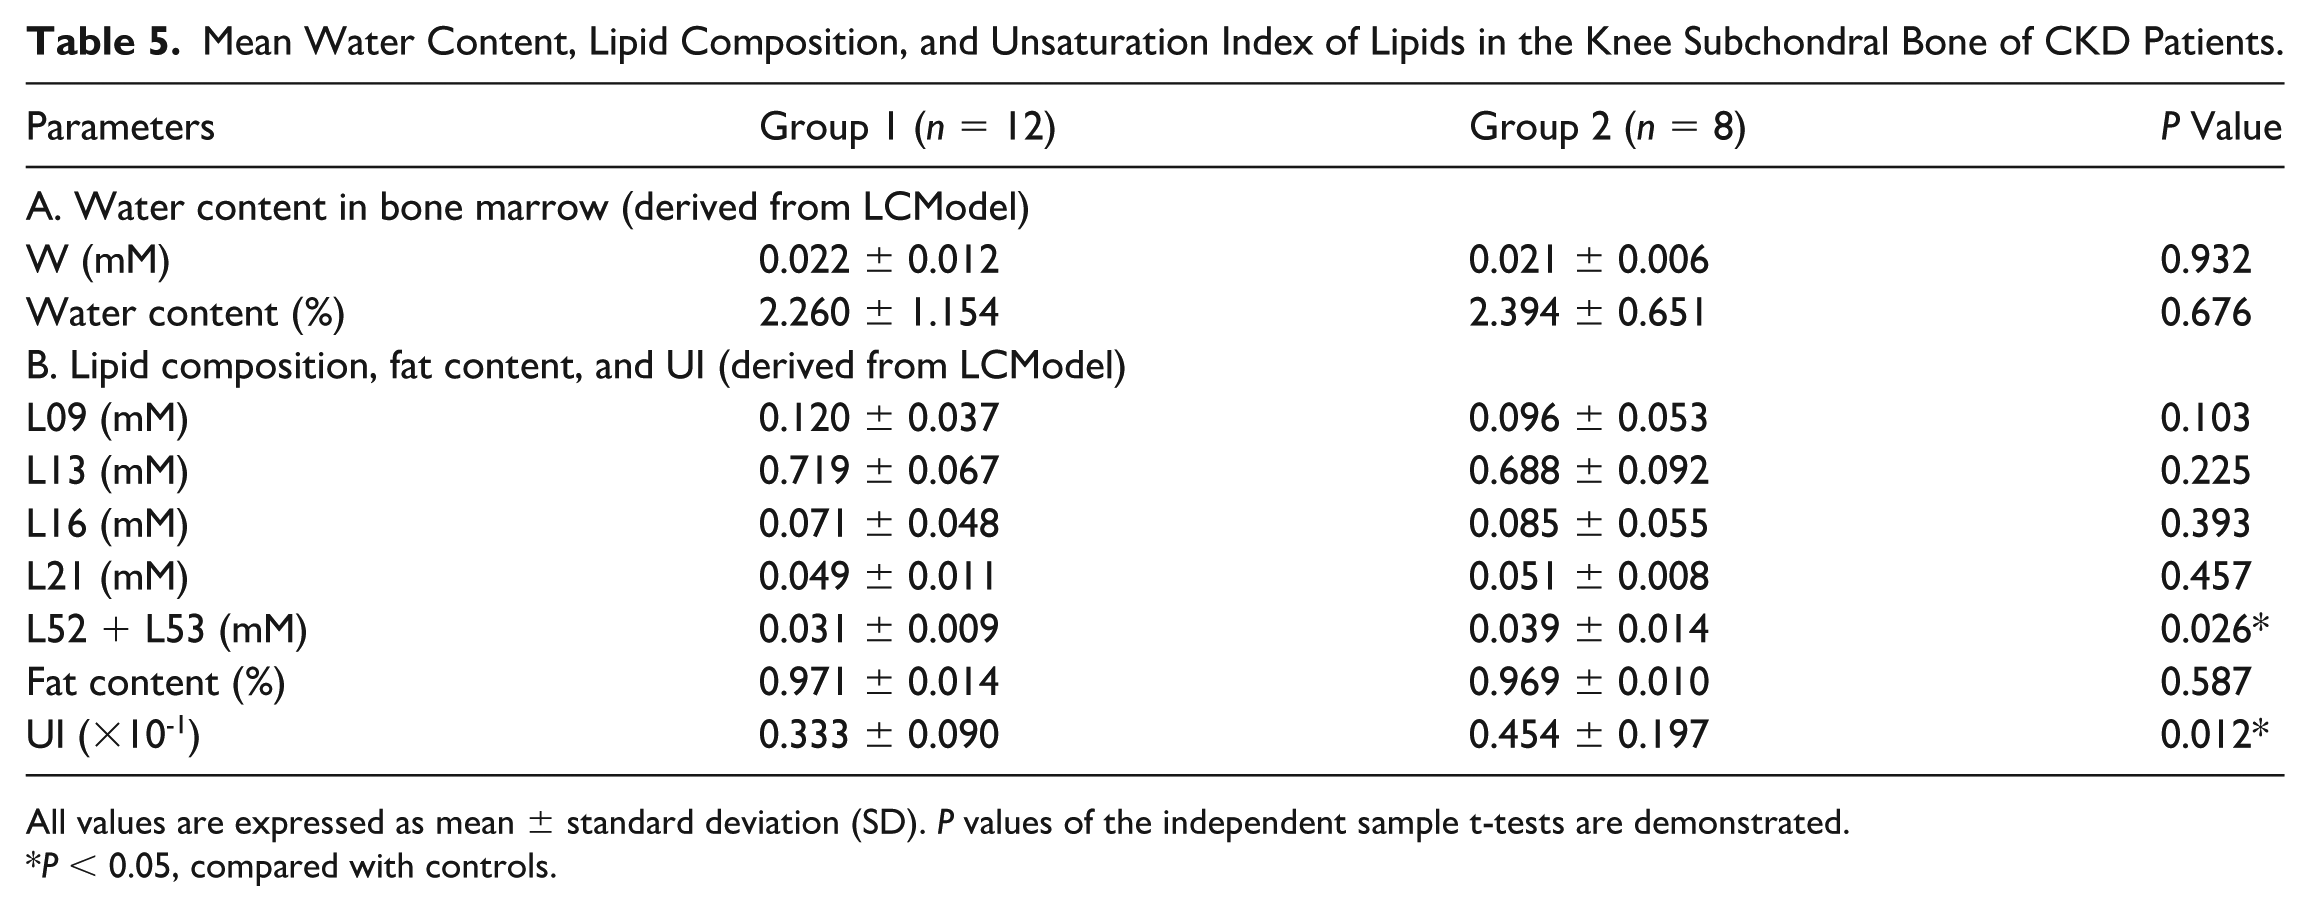
All values are expressed as mean ± standard deviation (SD). P values of the independent sample t-tests are demonstrated.
P < 0.05, compared with controls.
T2 Values in Cartilage Compared between Sex-Specific Subgroups
Mean T2 Values (ms) in the Cartilage of CKD Patients and Controls.
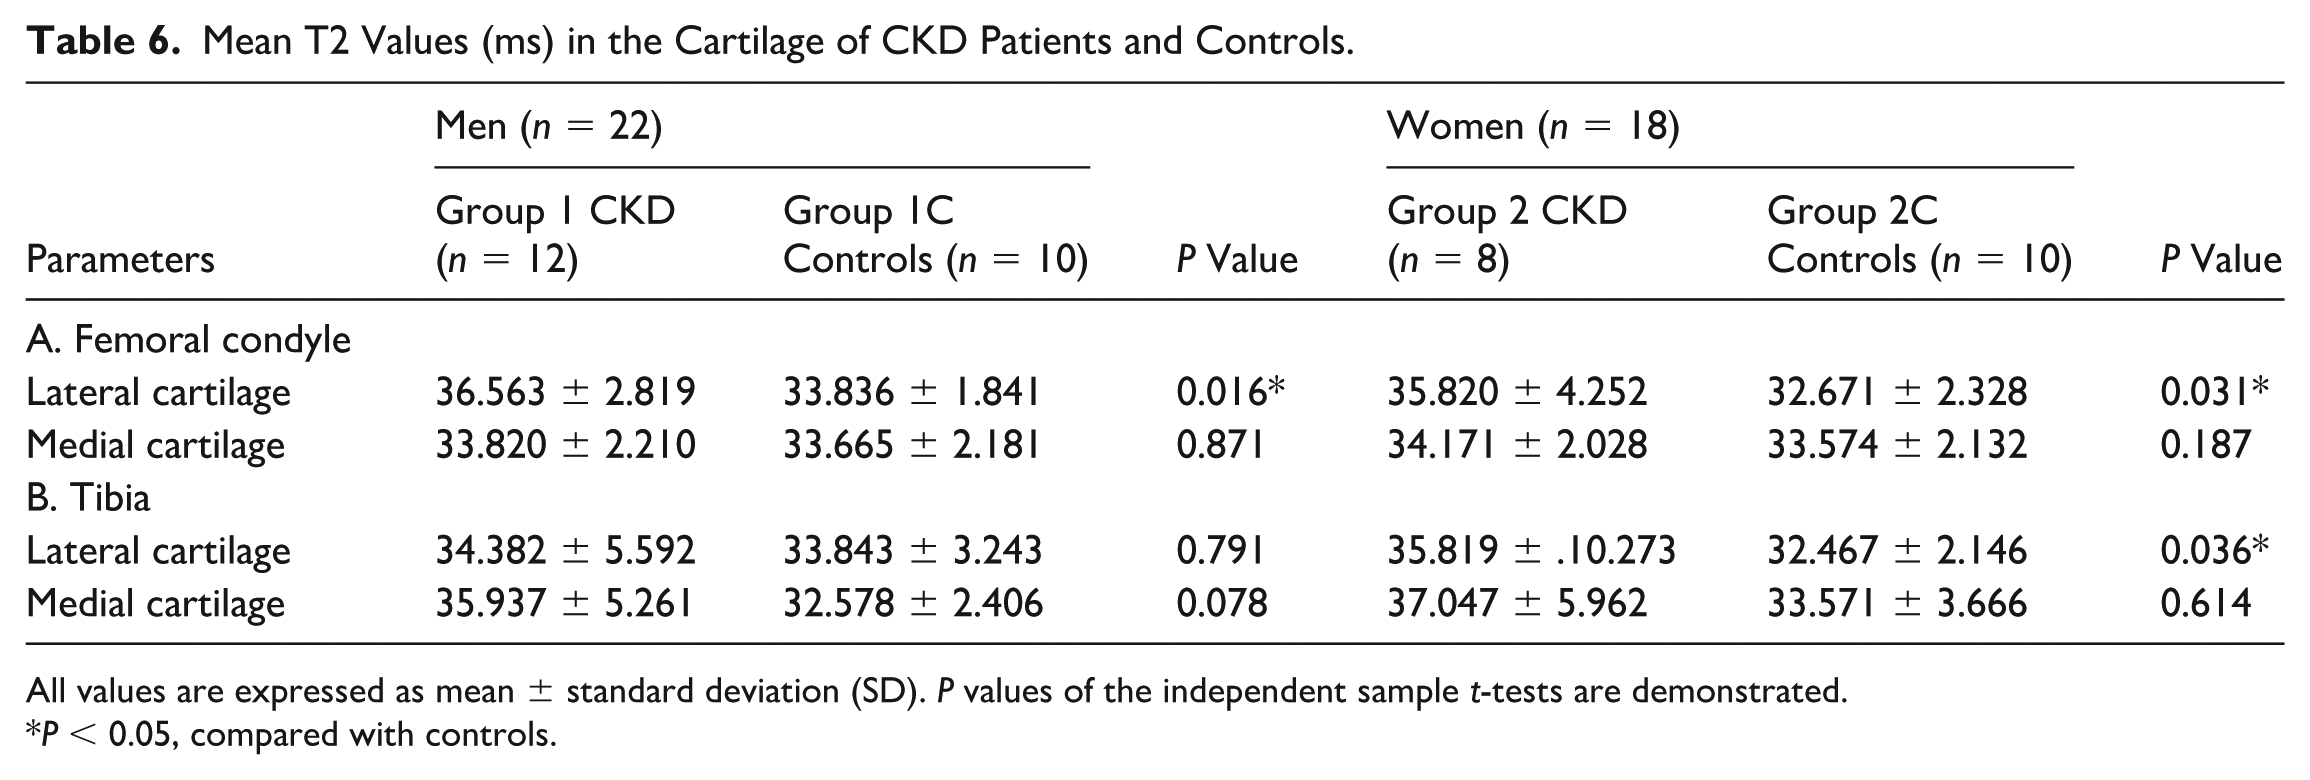
All values are expressed as mean ± standard deviation (SD). P values of the independent sample t-tests are demonstrated.
P < 0.05, compared with controls.
Discussion
This study demonstrates that patients with CKD exhibited significantly higher KL grades compared with their age- and BMI-matched controls, indicating more pronounced radiographic features of knee OA. Furthermore, semi-quantitative MRI evaluation using the cartilage loss score of the MOAKS—focused on articular cartilage damage—also revealed significantly elevated scores in CKD patients relative to controls. The concurrently higher KL and MOAKS scores in the CKD group suggest a pattern of accelerated or more severe joint degeneration relative to individuals without kidney dysfunction. These findings underscore the importance of early musculoskeletal evaluation in CKD patients and support the notion that kidney dysfunction may be an independent risk factor for the development or progression of knee OA.
In addition to structural changes, this study further demonstrates that MRS and T2 mapping are effective noninvasive imaging tools for detecting early biochemical alterations in the subchondral bone marrow and cartilage of patients with CKD. Among the key findings, CKD patients exhibited significantly elevated lipid UI compared with healthy controls, indicating altered lipid metabolism associated with CKD. These changes were particularly pronounced in women with CKD, whose subchondral bone marrow also showed increased water content and decreased fat content—findings suggestive of early bone marrow edema (BME) or disrupted marrow fat homeostasis.
Increased marrow water content in women with CKD (
The elevated UI of lipids observed in CKD patients, particularly in women, reflects a dynamic shift in the fatty acid composition of the bone marrow microenvironment. UI provides a measure of fatty acid unsaturation, which may reflect metabolic demand or stress responses in marrow cells and osteoblasts. Although previous studies have not reported increased UI in the knee subchondral bone marrow of CKD patients, similar findings have been documented in the serum of CKD patients, where elevated levels of free fatty acids—particularly unsaturated fatty acids—were associated with enhanced lipogenesis and inflammation. 42
Mechanistically, increased unsaturated fatty acids may arise from upregulation of genes involved in fatty acid synthesis and desaturation, such as fatty acid synthase (FASN), stearoyl-CoA desaturase-1 (SCD1), apolipoprotein B (ApoB), and microsomal triglyceride transfer protein (MTTP). This metabolic shift has also been implicated in cardiovascular disease, where unsaturated fatty acids were linked to inflammation and adverse outcomes.43,44
Moreover, studies outside nephrology have reported similar lipid alterations in osteoporotic bone. For example, osteoporotic femurs with fragility fractures demonstrated decreased level of stearic acid (a saturated fatty acid) and increased level of oleic acid (a monounsaturated fatty acid), suggesting a preferential use of saturated fats as energy substrates during bone repair and an anti-inflammatory role of unsaturated fats via downregulation of cyclooxygenase-2 (COX-2) expression in the marrow. 45 By analogy, the increased UI in our CKD cohort—particularly in women—may represent an adaptive response to increased metabolic demands or low-grade inflammation in early-stage bone injury.
Interestingly, no significant differences in MRS parameters were observed between male CKD patients and male controls, suggesting sex-specific mechanisms in CKD-related marrow changes. Prior imaging study show that female marrow fat and unsaturation indices rise more sharply with age—particularly around menopause—consistent with the loss of estrogen-mediated regulation of lipid metabolism and Wnt signaling. 46 In contrast, CKD cohorts such as the Age Gene/Environment Susceptibility (AGES)-Reykjavik study report that elevated sclerostin correlates with increased marrow adiposity in men but not in women, highlighting divergent hormonal and Wnt-pathway regulation across sexes. 47
These biological differences provide a mechanistic context for our findings. The absence of detectable MRS abnormalities in male CKD patients may reflect distinct endocrine and metabolic responses—namely, estrogen deficiency-driven shifts toward adipogenesis in women versus sclerostin-mediated Wnt inhibition in men. Such sex-dependent pathways, influencing mesenchymal stem cell fate and osteoblast activity, may also explain the epidemiologic pattern in which CKD is more prevalent in women yet progresses more rapidly in men.48 -50
T2 mapping further supported these findings by revealing increased relaxation times in CKD patients, particularly within the LFC and LT cartilage. This is consistent with cartilage degeneration and increased water content, which have been associated with early osteoarthritic changes. Similar observations have been reported in animal models of CKD, particularly in rats subjected to 5/6 nephrectomy, where increased T2* values in femoral and tibial cartilage were accompanied by histological evidence of cartilage thinning and matrix disruption. 51 These preclinical findings support the notion that CKD leads to early degenerative changes in joint tissues, validating the clinical observations in this study. These alterations may be driven by CKD-related inflammation, vascular changes, or biochemical imbalances that affect subchondral bone and cartilage integrity.
Our findings highlight the clinical utility of combining quantitative MRS and T2 mapping as noninvasive imaging tools for detecting early structural and compositional changes in CKD-related arthropathy. The observed differences, especially in women, suggest that MRS may be sensitive enough to detect subclinical metabolic changes in the bone-fat axis before the onset of radiographic joint damage. This integrative approach could facilitate early diagnosis and clarify the metabolic mechanisms underlying CKD-associated musculoskeletal complications. Furthermore, the observed MRS and T2 mapping changes may reflect early stages of CKD-MBD progression. Altered marrow fat composition and prolonged T2 relaxation likely represent disruptions in bone turnover and matrix mineralization preceding measurable bone loss. An increased UI may indicate suppressed osteoblastic activity and lipid remodeling driven by secondary hyperparathyroidism or sclerostin-mediated Wnt inhibition. Collectively, these imaging markers may serve as sensitive, noninvasive indicators of subclinical CKD-MBD activity, providing potential biomarkers for early disease monitoring and therapeutic evaluation.
In the context of contemporary CKD-MBD care, early changes in lipid unsaturation or T2 relaxation may serve as useful indicators for clinical risk stratification. Beyond standard laboratory markers such as PTH and calcium-phosphate levels, laboratory assessments alone cannot fully capture the determinants of skeletal fragility. Current imaging tools such as DXA or vertebral fracture assessment primarily quantify bone mass and may miss early changes in bone strength or quality. By contrast, quantitative MRS and T2 mapping can provide additional insight into microstructural and compositional aspects of skeletal integrity—including mineralization and collagen matrix features—which have been underscored in the Chronic Kidney Disease-Mineral and Bone Disorder: Conclusions from a Kidney Disease: Improving Global Outcomes (KDIGO) Controversies Conference as critical components of comprehensive skeletal evaluation in CKD. 52
Our study has several limitations. First, this was an exploratory study comparing two groups of CKD patients, and the significant findings reported here require validation in larger, methodologically rigorous cohorts. Second, the sample size was modest, which limits statistical power, particularly for subgroup analyses, and may increase the risk of type II error. Third, this study is limited by cross-sectional design, which precludes evaluation of disease progression over time. Future longitudinal studies with larger cohorts are warranted to validate these findings and to explore the potential of MRS parameters as predictors of skeletal complications in CKD.
In conclusion, this study demonstrates that quantitative MRS and T2 mapping are feasible and informative tools for assessing early biochemical and structural alterations in the knee joints of patients with CKD. Elevated marrow lipid unsaturation and water content—especially among women—may reflect subclinical manifestations of CKD-MBD or altered marrow metabolism. These findings suggest a potential role for MRS-derived parameters as early imaging biomarkers of skeletal involvement in CKD. Future longitudinal studies are warranted to validate these observations and explore their predictive value for CKD-related skeletal outcomes.
Footnotes
Acknowledgements
The authors thank the MRI technologists at Tri-Service General Hospital for their assistance with image acquisition and the patients and volunteers who participated in this study.
Ethical Considerations
This study was approved by the Institutional Review Board of Tri-Service General Hospital (IRB No. 100-05-254).
Author Contributions
G-S.H., S-W.C. and C-Y.W. contributed to study concept and design, procurement of study funds, performance of experiments, data analysis, and interpretation; Y-J.H., Y-J.P., and S.H-H.Y. provided study materials, performed experiments, did data analysis and interpretation; Y-C.C., Y-C.H. and H-S.L. contributed to data analysis and interpretation, and statistical analysis; Y-C.L. collected and assembled the data. All authors contributed to writing the manuscript, read and approved the submitted version, and revised the manuscript.
Funding
The authors disclosed receipt of the following financial support for the research, authorship, and/or publication of this article: The study was supported by grants from the Civilian Foundation of Tri-Service General Hospital (TSGH-C102-049).
Declaration of Conflicting Interests
The authors declared no potential conflicts of interest with respect to the research, authorship, and/or publication of this article.
Data Availability Statement
The corresponding authors can provide the data supporting the present study upon reasonable request.