
Abstract
This article presents a longitudinal test of three proposed functions of overconfidence. In a sample of 894 high school boys surveyed across two school years, we examined whether overconfidence in sporting ability and intelligence predicts improved mental health, motivation, and popularity. Both sporting and intelligence overconfidence showed positive cross-sectional associations with mental health outcomes, but there was little evidence that overconfidence predicted improved mental health over time. Some evidence emerged that overconfidence in sporting ability, but not intellectual ability, predicted increased effort, but neither type of overconfidence predicted improvements in ability over time. Finally, sporting but not intellectual overconfidence predicted increased popularity over time. These results suggest that overconfidence is associated with increased social success over time in at least some domains, and contradict the oft-cited possibility that overconfidence leads to increasingly deleterious outcomes over time.
After decades of research, it is clear that overconfidence is widespread (Alicke & Sedikides, 2009). A majority of people report that they are better than average across a variety of domains, despite the improbability of this being the case (Dunning, Heath, & Suls, 2004; Guenther & Alicke, 2010). Further, overconfidence persists even when its costs are both salient and immediate (Ehrlinger, Johnson, Banner, Dunning, & Kruger, 2008; Williams & Gilovich, 2008), and cross-cultural studies suggest that overconfidence may be common in all societies (Gaertner, Sedikides, & Cai, 2012; Sedikides, Gaertner, & Toguchi, 2003; Sedikides, Gaertner, & Vevea, 2005).
The prevalence of overconfidence is puzzling from an evolutionary standpoint because inaccurate perceptions are likely to incur costs (such as poorly calibrated risk-taking) and thus lower chances of reproductive success. One explanation for this puzzle is that overconfidence might offset these costs by increasing the success of the overconfident, thereby enabling overconfident individuals to outcompete those with more accurate perceptions. Three (nonexclusive) accounts have been proposed to explain how overconfidence could provide such benefits.
The most widespread account within psychology posits that overconfidence is beneficial because feeling positively about oneself improves mental health (Alicke, 1985; Brown, 1986) and can buttress people’s inner lives in times of stress (Taylor & Brown, 1988). Although mental well-being does not have direct fitness benefits, it is one link in a chain to fitness-relevant outcomes (Haselton & Nettle, 2006; Krebs & Denton, 1997). For example, happier people are healthier, have better job performance, and are more likely to become and stay married (Barak, 2006; Judge, Erez, & Bono, 1998; Lyubomirsky, King, & Diener, 2005).
The second account proposes that overconfidence may increase motivation. Optimistic beliefs cause people to frame situations in terms of gains rather than losses, making them more likely to pursue their goals (Sternberg & Kolligian, 1990) and to work longer and harder on them (Felson, 1984; Weiner, 1979). A willingness to pursue difficult or long-shot goals may have been adaptive if it inspired our ancestors to tackle tasks with low likelihoods of success, but with probability-weighted benefits that outweighed the costs of trying (Haselton & Nettle, 2006). Indeed, mathematical simulations have confirmed that when the benefits of entering competitive settings typically outweigh the costs of failure, it is adaptive for individuals to be overconfident about their abilities and chances of succeeding (Johnson & Fowler, 2011; Ramirez & Marshall, 2015).
The third and final account proposes that overconfidence may help us to make more positive social impressions (Trivers, 2000, 2011; von Hippel & Trivers, 2011). As social creatures, the positive regard of those around us has important consequences—it creates opportunities to form alliances with others, gain positions of leadership, and attract the interest of romantic partners. Many of the qualities that create this positive regard (such as competence, intelligence, and experience) are not directly visible and must be inferred from verbal and nonverbal cues. Among the strongest of these cues is confidence.
People appear to rely on a “confidence heuristic” when assessing others, presuming that confidence signals knowledge and ability across a variety of domains (Cutler, Penrod, & Stuve, 1988; Locke & Anderson, 2015; Price & Stone, 2004; Tenney & Spellman, 2011). This may be because confidence is an outward reflection of our assessment of our own abilities; if confidence and ability have reliably covaried across evolutionary time, it would be adaptive to rely on confidence when judging others’ ability. Consistent with this possibility, people prefer confident individuals as leaders (Conger & Kanungo, 1987) and romantic partners (Murphy et al., 2015). By projecting their overly positive self-views as increased confidence, overconfident individuals may hijack the confidence heuristic, causing others to share their inflated beliefs in their own abilities and gaining the accompanying social benefits.
Existing Research
The literature provides a mix of findings, with evidence for and against each account. These mixed results have been driven in part by differences in the way overconfidence is measured in different research traditions (Gramzow, Elliot, Asher, & McGregor, 2003; Kurt & Paulhus, 2008; Kwan, John, Kenny, Bond, & Robins, 2004). Several methods that have been used to measure overconfidence in the past are not necessarily appropriate to test the adaptive theories described above. Most notably, some researchers have operationalized overconfidence as rating oneself more highly than others do, measuring overconfidence by comparing self-reports to observations made by others (Colvin, Block, & Funder, 1995; Paulhus, 1998). Such measures capture only those aspects of overconfidence that have proved unconvincing—individuals who have successfully spread their overly positive self-views to others would not appear overconfident on these measures. Thus, the standard form of measurement in more recent studies of these three accounts of overconfidence has been to compare an individual’s perception of their own abilities or performance to some verifiable measure, such as an intelligence test (Dufner et al., 2012).
Cross-sectional work using the latter type of measure has largely told a positive story of overconfidence. Overconfidence is associated with good mental health (Dufner et al., 2012; Kurman & Sriram, 1997; Paulhus, Harms, Bruce, & Lysy, 2003), increased motivation and task persistence (Parker, de Bruin, Yoong, & Willis, 2012; Tenney, Logg, & Moore, 2015 1 ), and increased perceptions of status and competence by others (Anderson, Brion, Moore, & Kennedy, 2012; Dufner, Reitz, & Zander, 2015; Kennedy, Anderson, & Moore, 2013; Lamba & Nityananda, 2014). The social benefits of overconfidence diminish when it is deliberately revealed (Tenney, MacCoun, Spellman, & Hastie, 2007), suggesting that without such revelations, it is often accepted as legitimate confidence.
Some theorists have argued, however, that any cross-sectional benefits of overconfidence must be fleeting—that it will be challenged by realistic feedback (from peers or the environment), and so positive initial impressions and increased self-esteem will evaporate (Frey & Voland, 2011; Paulhus, 1998; Robins & Beer, 2001). According to this perspective, overconfidence is ultimately a maladaptive trait that persists for unknown reasons. This “realism” account predicts longitudinal costs of overconfidence despite cross-sectional gains, while adaptive accounts of overconfidence require that the benefits do not dissipate over time.
Longitudinal examinations of overconfidence are critical for disentangling these competing predictions, but such studies are sparse and have yielded mixed results. In support of the motivational account of overconfidence, two studies have shown that intelligence overconfidence predicts improved future grades (Blanton, Buunk, Gibbons, & Kuyper, 1999; Wright, 2000). However, a third study found that it instead predicted academic disengagement over time and no improvement in grades (Robins & Beer, 2001). Similarly, two studies have found longitudinal benefits of intelligence overconfidence on mental health (Dufner et al., 2012, 2015), while a third found deteriorating mental health over time (Robins & Beer, 2001). In contrast, social benefits of overconfidence have been more consistent, with overconfidence predicting higher peer perceptions of status and ability over time (Anderson et al., 2012; Lamba & Nityananda, 2014), increases in likability, and an increase in nominations for several social roles (e.g., work partner, friend; Dufner et al., 2012, 2015). 2
This body of longitudinal work provides some support for all three adaptive accounts of overconfidence but remains inconclusive for several reasons. First, the studies to date have differed substantially in sample, measurement, and timescale. While the social account of overconfidence has the most consistent support so far, this account was not tested in the key study reporting negative longitudinal outcomes (Robins & Beer, 2001). Thus, it is difficult to determine whether results truly vary by account, or because of measurement idiosyncrasies of specific studies. To date, no single longitudinal study has tested all the three accounts, which would enable clearer distinctions between them. Second, the existing longitudinal research has focused solely on overconfidence in intelligence, while cross-sectional work indicates that the effectiveness of overconfidence may differ across domains (Gabriel, Critelli, & Ee, 1994). Thus, it would be premature to infer that the evidence for positive effects of intellectual overconfidence generalizes to other domains.
Third, although several studies suggest that overconfidence in intellectual domains leads to improved future performance, little is known about how this might happen. The motivational account would suggest that these benefits are due to increased effort (driven by high-performance expectations), but this has yet to be tested. Finally, although all longitudinal studies thus far have shown positive social outcomes of overconfidence, the scope of these outcomes has been limited. Overconfident individuals seem to be perceived more positively and accorded more status by their peers over time, but this effect has primarily been demonstrated within work groups (Anderson et al., 2012; Dufner et al., 2012). Effects on classroom social nominations were also largely driven by nominations for someone who would be good to “ask for help with work” or to “work with on a project” (Dufner et al., 2015).
If overconfidence does tap the confidence heuristic to create positive social impressions, it should also increase popularity more generally by building friendships and coalitional ties. Status and popularity are very different social outcomes, and one does not necessarily imply the other (Carlson & DesJardins, 2015). Social outcome measures that tap popularity and extend beyond those influenced directly by competence are required to evaluate the full scope of the social account of overconfidence.
The present study addressed these issues by examining mental health, social, and performance benefits of overconfidence in a single longitudinal sample and by measuring overconfidence in both intelligence and sporting ability to provide a test of the generalizability of its effects across domains. We also included measures of effort to test its role in mediating the effects of overconfidence on performance. Finally, we measured social outcomes in a real-world setting via social network analyses that quantify popularity and social closeness using the friendship networks of entire cohorts of students.
Method
Participants
Participants were 894 boys who attended a large private boys’ school in Australia (two cohorts of Year 8 students 3 [n = 182 and n = 157], and one cohort each of Year 9 [n = 191], Year 10 [n = 169], and Year 11 students [n = 195]). Sample size was determined by the total number of available students we were able to survey at least twice across the 3 years of our study, which in most cases provided 80% power to detect even small effects (Gignac & Szodorai, 2016). 4 The median age was 14 at Time 1, with a range from 12 to 17 years.
Design
The study followed five cohorts of students across two school years each, with each wave of data collected toward the end of the Australian school year (i.e., September or October). At each wave, surveys were distributed to students (mostly as links to digital surveys to be completed on tablet computers) while they were in a class in which time had been allocated for the survey. The measures for this study were interleaved with other instruments that were part of a larger research project contracted by the school regarding various school-related activities and attitudes. The entire survey took about 30 min to complete. With student consent, the school administration provided data regarding students’ athletic performance as well as their grades and teacher-rated effort scores for every class taken during both school years. We report all measures that were part of this study and all data exclusions.
Measures
Intelligence and sporting self-ratings
As part of the surveys they completed at the end of each year, students rated how they compared to other members of their class in the categories of intelligence and sport. Students used percentile sliders to indicate where they fell in each category, where 0 was described as “At the very bottom, worse than 99% of my peers at [school]” 5 and 100 as “At the very top, better than 99% of my peers at [school].” The sample exhibited overconfidence on average, with the mean response to both the intelligence (M = 72.38, standard deviation [SD] = 18.21) and sporting ability (M = 70.29, SD = 25.09) measures being significantly above the scale midpoint of 50%, t(893) = 36.76, p < .001 and t(893) = 24.18, p < .001, respectively.
Criterion measures
When measuring overconfidence, one key concern is the degree to which the criterion matches the self-evaluation. If self-ratings are broader than the criterion (e.g., participants self-rate on their general intelligence but are only tested on verbal intelligence), the self-ratings might contain true knowledge of unmeasured aspects of ability (e.g., spatial intelligence), which would incorrectly appear to be overconfidence. This problem can be largely eliminated by asking participants to estimate their performance on a specific test, rather than their ability in general (Anderson et al., 2012; Murphy et al., 2015). 6 However, while effective, this approach captures a very narrow aspect of overconfidence, which may be only tangentially related to overconfidence in the abilities of interest.
Thus, a common alternative approach is instead to measure abilities broadly enough to match self-ratings—for example, by asking about general academic ability and then aggregating grades across many subjects (Dufner et al., 2015; Robins & Beer, 2001; Wright, 2000). We took this latter approach by asking participants to self-rate on their abilities in the general domains of intelligence and sport. We then measured sporting ability with five indicators covering multiple forms of strength, speed, agility and endurance, and measured intellectual ability with both a general reasoning test and students’ aggregate grades across all subjects.
Sporting ability
Sporting ability measures from physical education testing were provided by the school but were not available for all cohorts at both time points. At Time 1, these measures included a 40-m sprint time, the Illinois Agility Test time (in which participants run a specific path through a series of cones), maximum vertical jump height, number of laps on a “beep test” (in which participants must run the same distance repeatedly, each time outracing a successively shorter timer), and maximum repetitions of a thoracic pull (pull-ups). At Time 2, the school replaced pull-ups with push-ups. The sporting measures had high reliability (Time 1: α = .85; Time 2: α = .86) and were used as indicators on a single latent variable, which we refer to as sporting ability.
Intellectual ability
Intellectual ability was measured in two ways. First, we used the Allwell Test of General Reasoning (hereafter the “Allwell”), which tests verbal and numerical skills. The school administered the Allwell at different points in time for different cohorts, but always before our Time 1 surveys. Second, the school provided student grades for all classes for the calendar year of testing, which were averaged to create grade point average (GPA) measures at each time point. The Allwell and Time 1 GPA were used as indicators on a single latent variable, which we refer to as intellectual ability.
Mental health measures
Four self-report measures of mental health were included in counterbalanced order in the surveys. First, students completed the Single Item Self-Esteem Scale (Robins, Hendin, & Trzesniewski, 2001): “I have high self-esteem” (on a 4-point scale ranging from strongly disagree to strongly agree). Second, they completed the student version of the Satisfaction with Life Scale (Diener, Emmons, Larsen, & Griffin, 1985): for example, “my life is just right” on a 4-point scale ranging from never to almost always (α = .89 at both time points). Third, they completed the Hospital Anxiety and Depression Scale (Zigmond & Snaith, 1983), which asks how students have been feeling over the last week and has separate anxiety (e.g., “I get sudden feelings of panic”; Time 1: α = .82; Time 2: α = .86) and depression (e.g., “I feel as if I am slowed down”; Time 1: α = .71; Time 2: α = .77) components. Responses were provided on a 4-point scale from most of the time to not at all (reverse-scored). Finally, students completed a 10-item abbreviated version of the University of Los Angeles, California (UCLA)–Revised Loneliness Scale (Peplau & Cutrona, 1980; e.g., “I feel isolated from others”) on a 4-point scale ranging from never to often (Time 1: α = .86; Time 2: α = .87).
Academic effort
Teachers graded student effort in each class on a 5-point scale from significant improvement needed to excellent. The effort ratings were averaged within calendar years to form an effort score for each student at each time point (intraclass correlations at Time 1 and Time 2 were .34 and .29, respectively).
Sporting effort
At both time points, students reported whether they engaged in 19 cocurricular activities offered by the school. Twelve of these were sport related and were used to form a sporting cocurricular measure as one indicator of sporting effort. This measure was right skewed and so was subjected to a square root transformation. At Time 2, students were also asked “How many hours have you spent exercising and/or playing sport/training in a typical week?”
Popularity (social networks)
Popularity was measured using indices calculated from a social network analysis. This analysis builds networks by treating individuals as nodes, with ties between individuals represented by links connecting these nodes (Marsden, 1990). To capture the social networks within the school, each survey included a question that asked students to nominate up to 10 of their “closest friends in [school].” Networks were then formed using directed links (Scott & Carrington, 2011), adding a connection from each student to each student they named as a friend. 7 Where nominations were reciprocated, links traveled in both directions.
Students primarily named friends within their own cohort, so separate networks were created for each cohort. Social network indices were then calculated within each network. Four “local” network measures of friendship were computed for each participant: in-degree, the number of students who named the participant as a friend; out-degree, the number of friends the participant named; degree, the sum of in-degree and out-degree (Freeman, 1979); and percentage of mutual ties, the fraction of times, where possible, that the participant’s friend nominations were reciprocated (see Figure 1).
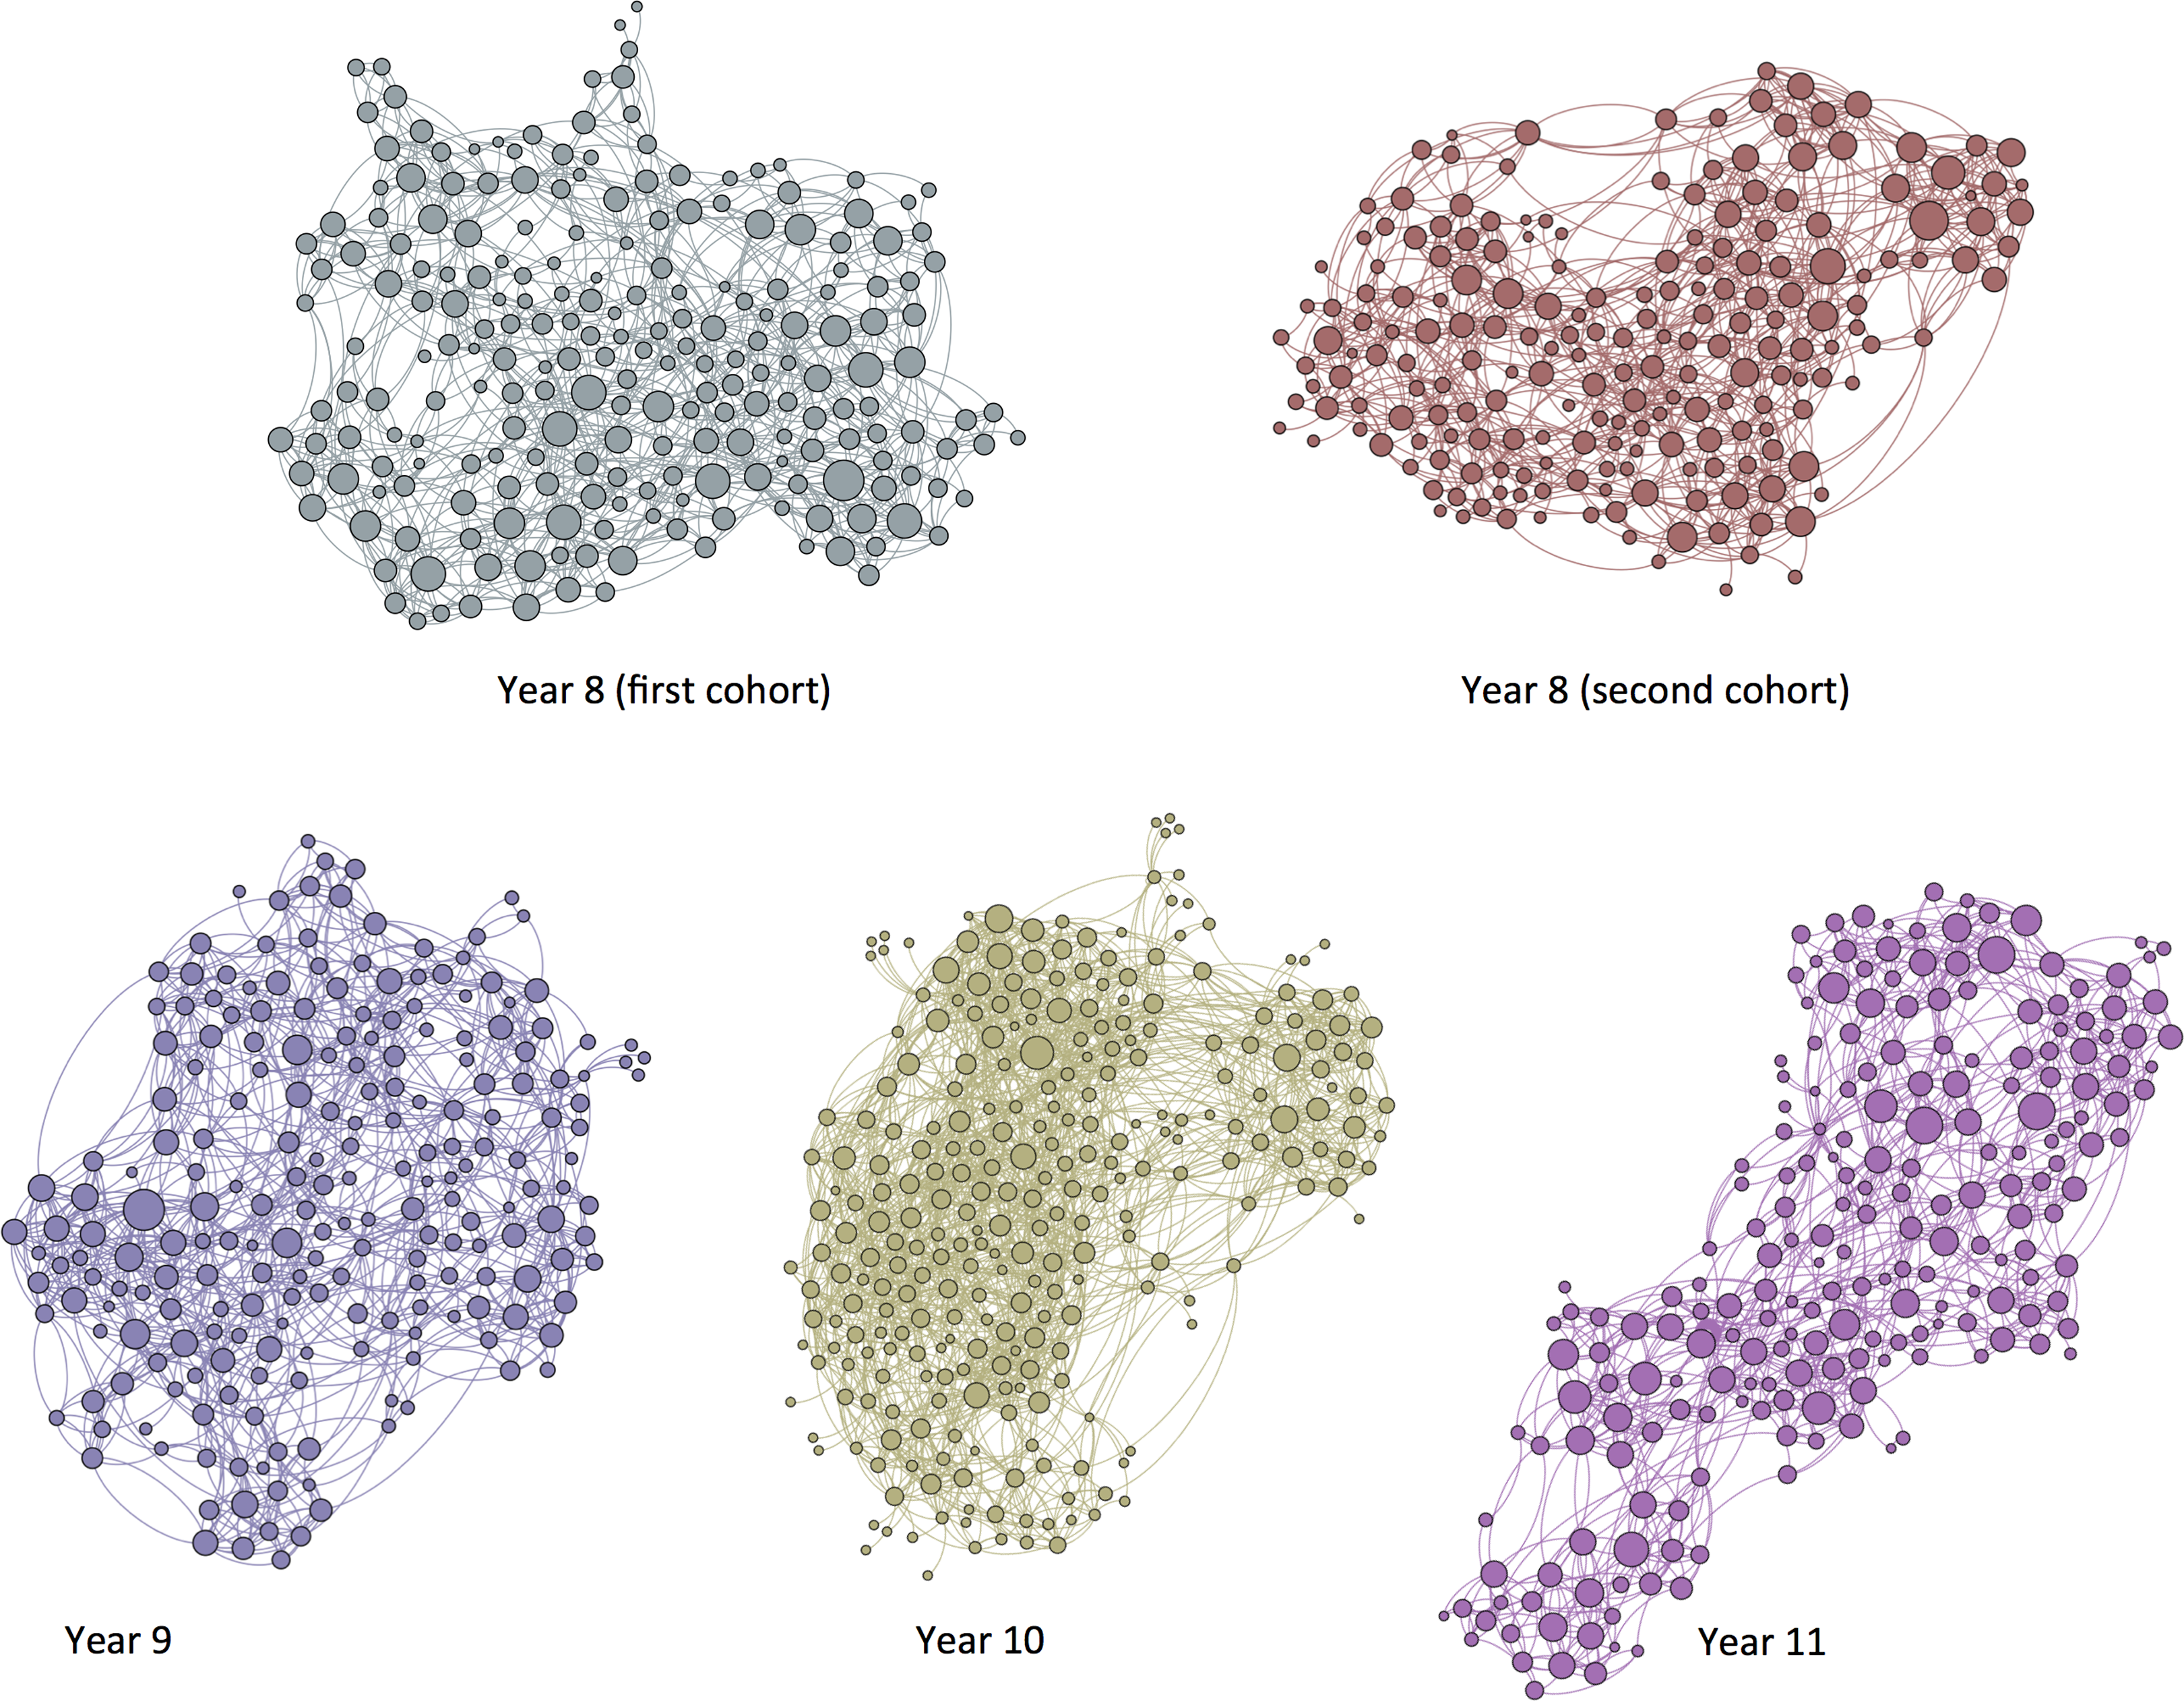
Visualizations of networks for each of the five cohorts, with nodes sized relative to in-degree.
Three “global” network measures of popularity were also calculated. The first was closeness centrality, the inverse of the average distance from each participant to each other participant in the network (Freeman, 1979; Marsden, 1990). Closeness centrality captures the extent to which a student is well connected, indicating in how few steps he could reach any other person in the network through friendship ties. The second, number of triangles, counts how many pairs of a participant’s friends were themselves friends (forming a triadic closure). Triadic closures are believed to represent particularly strong friendships (Granovetter, 1983), so this measure captures both the quantity and quality of each participant’s friendships. The final measure, Page-Rank, is calculated using the same algorithm that indexes the popularity of web pages (Brin & Page, 1998). It can be thought of as the amount of time a person would spend with each student in the network if ties between individuals were perpetually followed at random.
Results
Modeling Overconfidence
Overconfidence is typically modeled by regressing participants’ self-ratings onto their ability scores and saving the residuals, or equivalently, by including self-ratings in a regression while controlling for ability. Both approaches control for the variance in self-ratings due to actual ability, and any remaining effects of self-ratings are assumed to be effects of overconfidence. Nevertheless, problems have recently been raised with testing the incremental predictive validity of a variable of interest (such as self-ratings) over and above a control variable (such as actual ability) using observed measures. Because observed measures rarely have perfect reliability, controlling for them may not account for the overlap between constructs at the latent level. This problem can create false positives such that the variable of interest appears to have incremental validity when in reality it does not (Yarkoni & Westfall, 2016). In our case, such a possibility would give the impression that overconfidence is associated with outcomes that are in truth driven by ability.
To avoid this problem, we follow Westfall and Yarkoni’s (2016) advice by modeling the control variables as latent constructs. For all analyses, we use structural equation modeling, treating each ability measure as a latent variable. For sporting ability, we fixed the loadings of each indicator to the best fit from a confirmatory factor analysis 8 (see Figure 2). For intellectual ability, because we had only two indicators, we fixed the loadings of each indicator (Allwell and GPA) to the square root of their correlation with each other (see Figure 3).
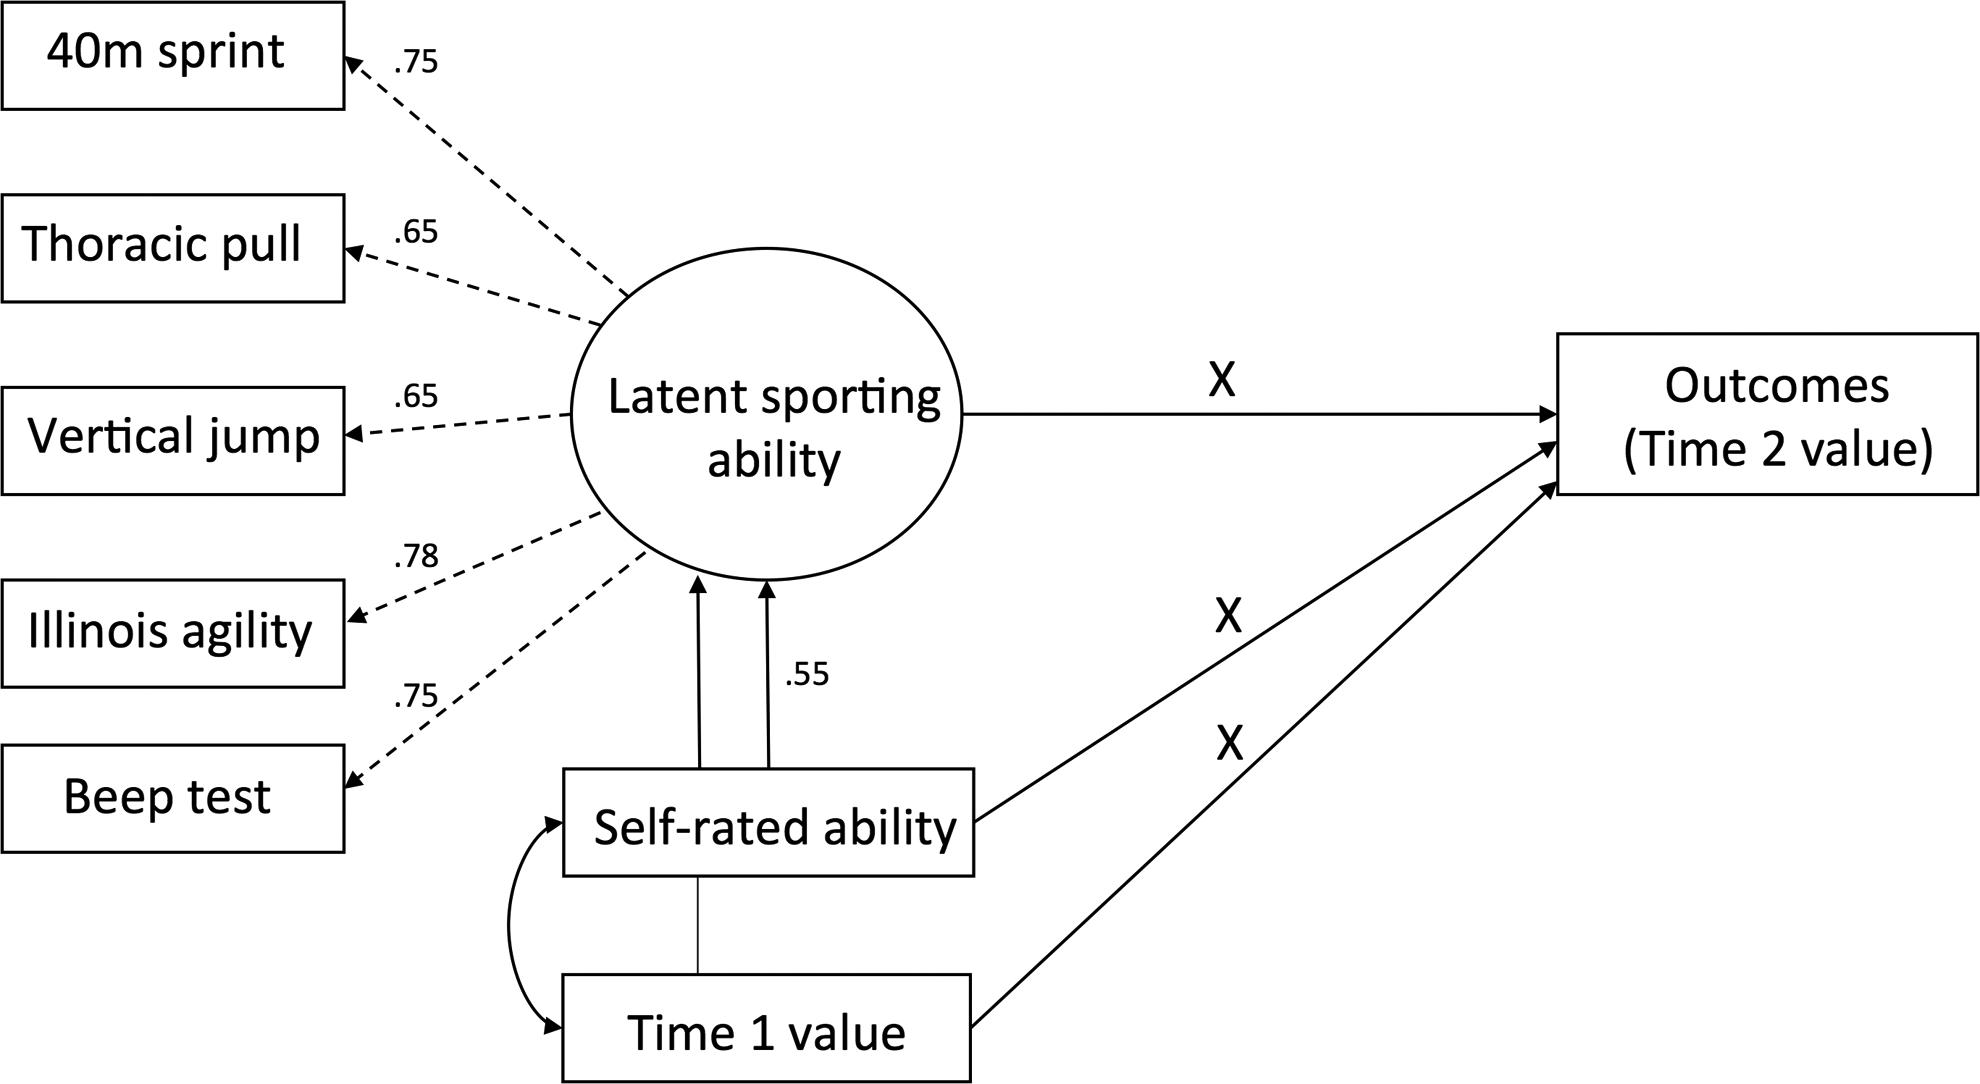
Template for latent sporting longitudinal models (except predicting Time 2 sporting ability; see Supplemental Materials, Table S1). Control variables (e.g., cohort) not shown. Covariances were specified between all predictors (including the latent ability indicator). Values represented by an X are reported in subsequent tables. For cross-sectional models, there was no Time 1 value.
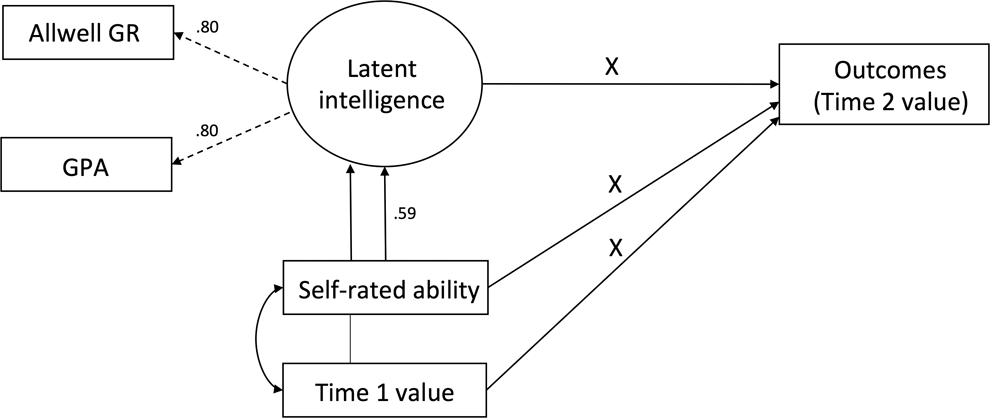
Template for latent intelligence longitudinal models. Control variables (e.g., cohort) not shown. Covariances were specified between all predictors (including the latent ability indicator). Values represented by an X are reported in subsequent tables. For cross-sectional models, there was no Time 1 value.
Self-ratings of both sporting ability and intelligence were strongly associated with the relevant latent ability indicator (β = .55, 95% confidence interval [CI] = [0.46, 0.63], β = .58, 95% CI [0.52, 0.65], respectively). These coefficients are among the highest reported in the literature (Anderson et al., 2012; Dufner et al., 2015), suggesting that our ability measures were sufficiently broad to match our self-rating variables. We examined overconfidence by measuring the effects of self-ratings while controlling for the relevant latent ability measure (see Figures 1 and 2 for model specifications). 9
We restricted the sample for each analysis to only students with scores on all relevant observed variables and at least one ability indicator, using full information maximum likelihood estimation to estimate paths for participants with missing data on other indicators. While some χ2/df scores were above 3, other fit indices indicated acceptable fit for all models (Comparitive Fit Index [CFIs] above .95, Tucker Lewis Index [TLIs] above .92, Standardized Root Mean Square Residual [SRMRs] below .06, Root Mean Square Error of Approximation [RMSEAs] below .071). The N for each analysis, as well as the beta weights and confidence intervals, are reported in Tables 1–6.
Betas and Confidence Intervals for Latent Models Predicting Cross-Sectional Mental Health Outcomes.
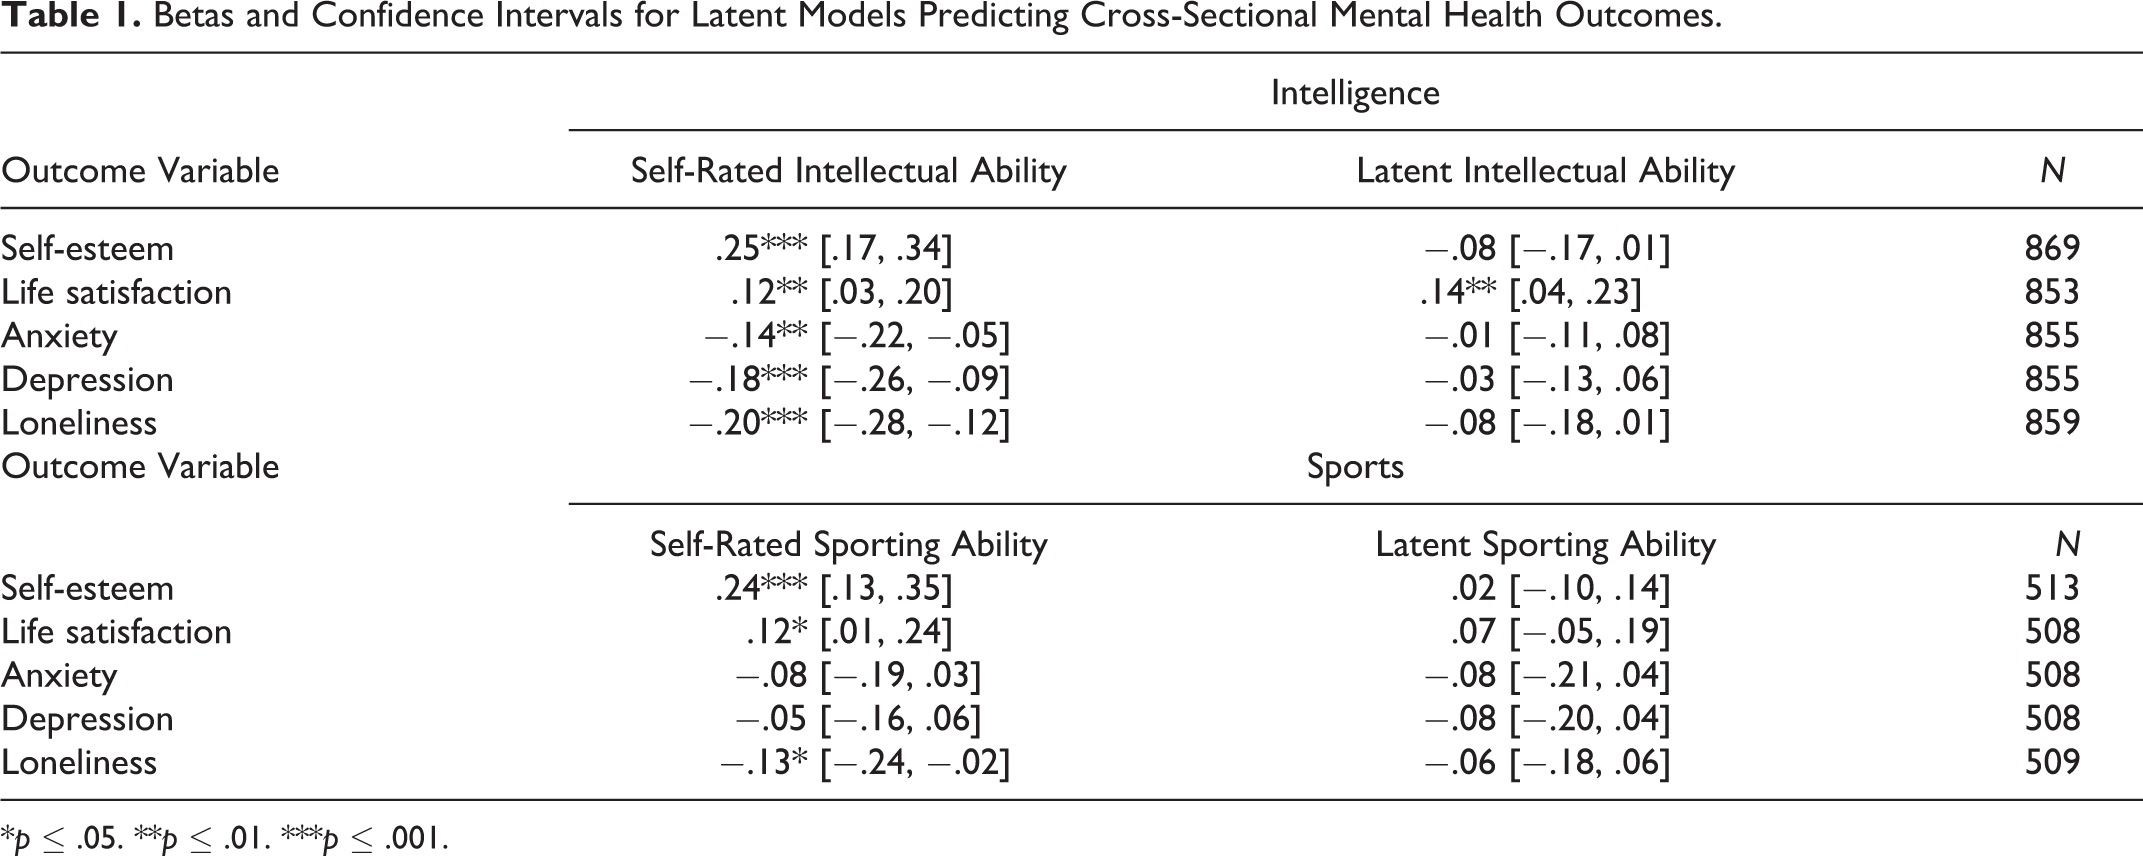
*p ≤ .05. **p ≤ .01. ***p ≤ .001.
Betas and Confidence Intervals for Latent Models Predicting Longitudinal Mental Health Outcomes.
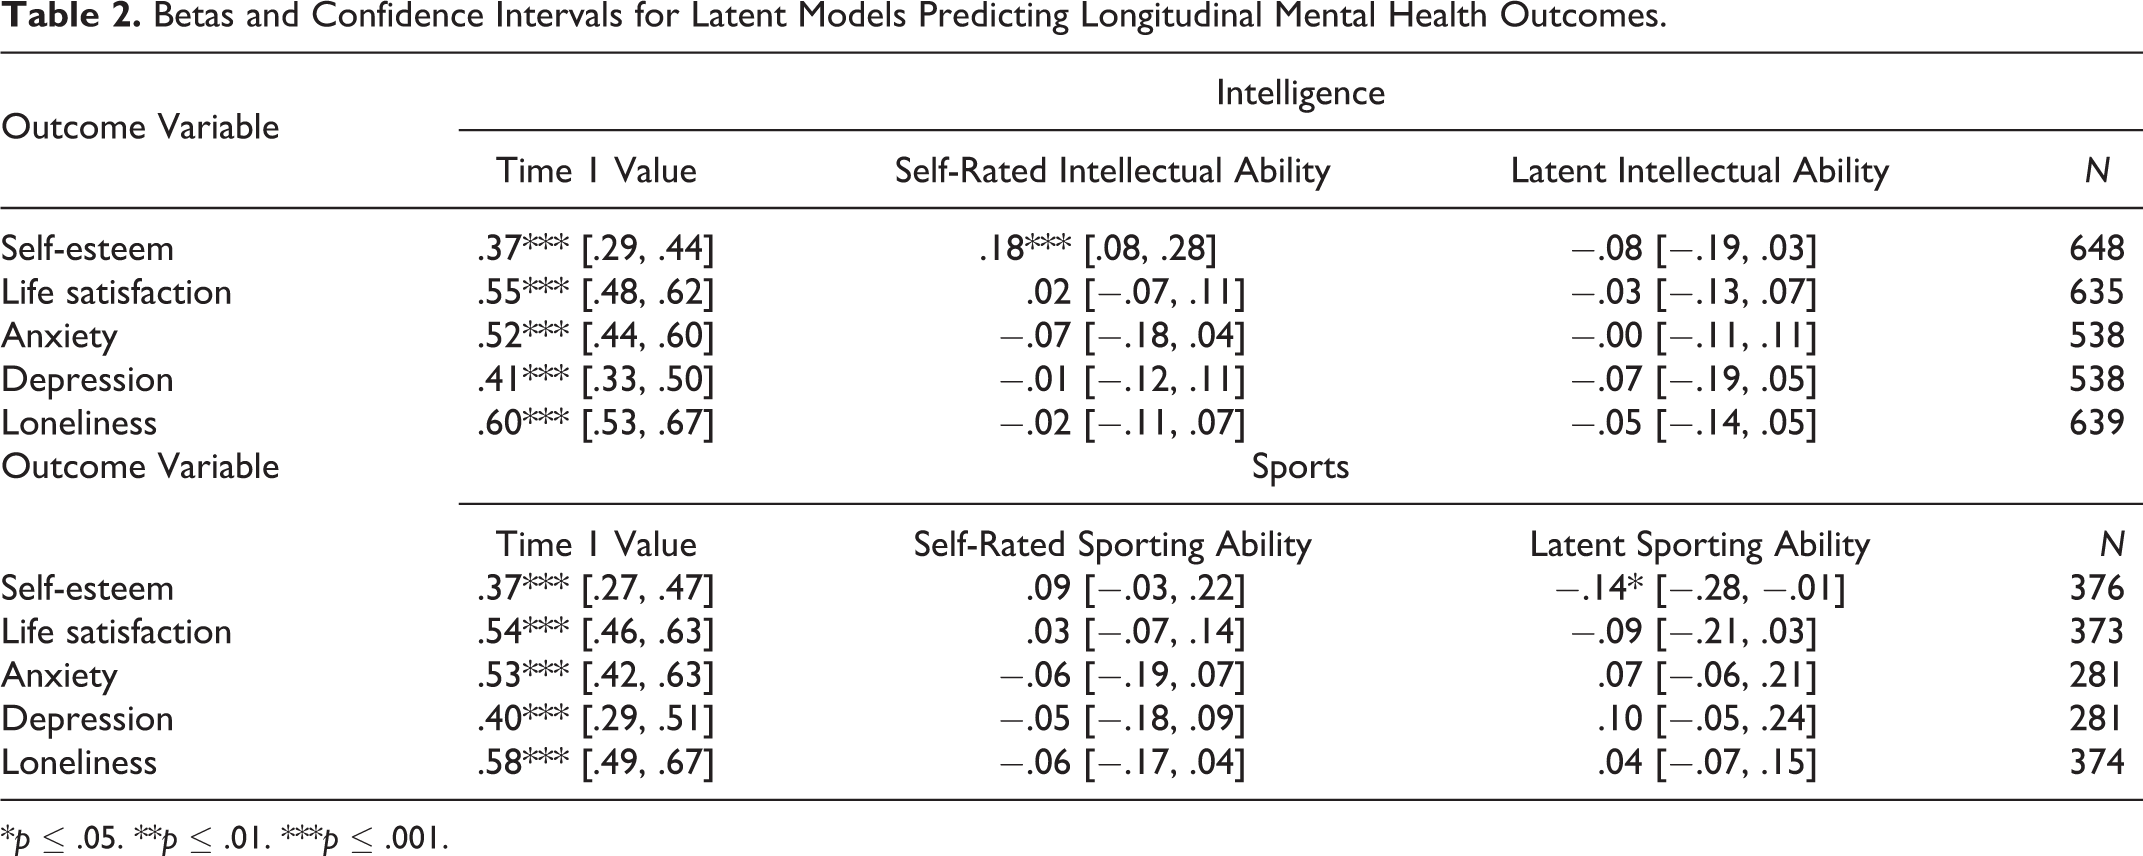
*p ≤ .05. **p ≤ .01. ***p ≤ .001.
Betas and Confidence Intervals for Latent (Sport) and Observed (Intelligence) Models Predicting Cross-Sectional Motivational Outcomes.
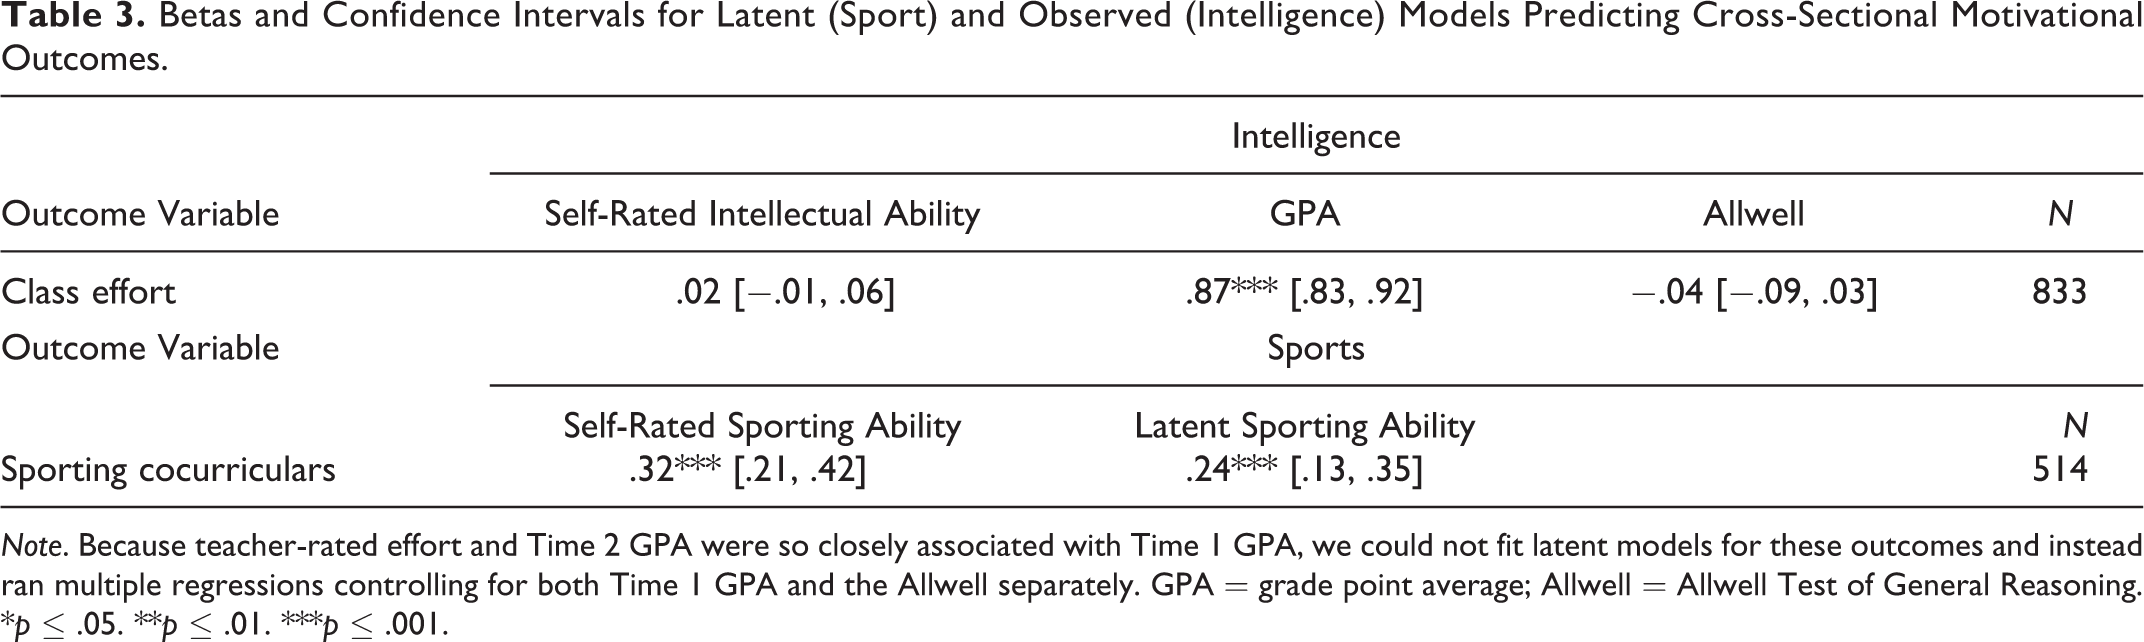
Note. Because teacher-rated effort and Time 2 GPA were so closely associated with Time 1 GPA, we could not fit latent models for these outcomes and instead ran multiple regressions controlling for both Time 1 GPA and the Allwell separately. GPA = grade point average; Allwell = Allwell Test of General Reasoning.
*p ≤ .05. **p ≤ .01. ***p ≤ .001.
Betas and Confidence Intervals for Latent (Sport) and Observed (Intelligence) Models Predicting Longitudinal Motivational Outcomes.
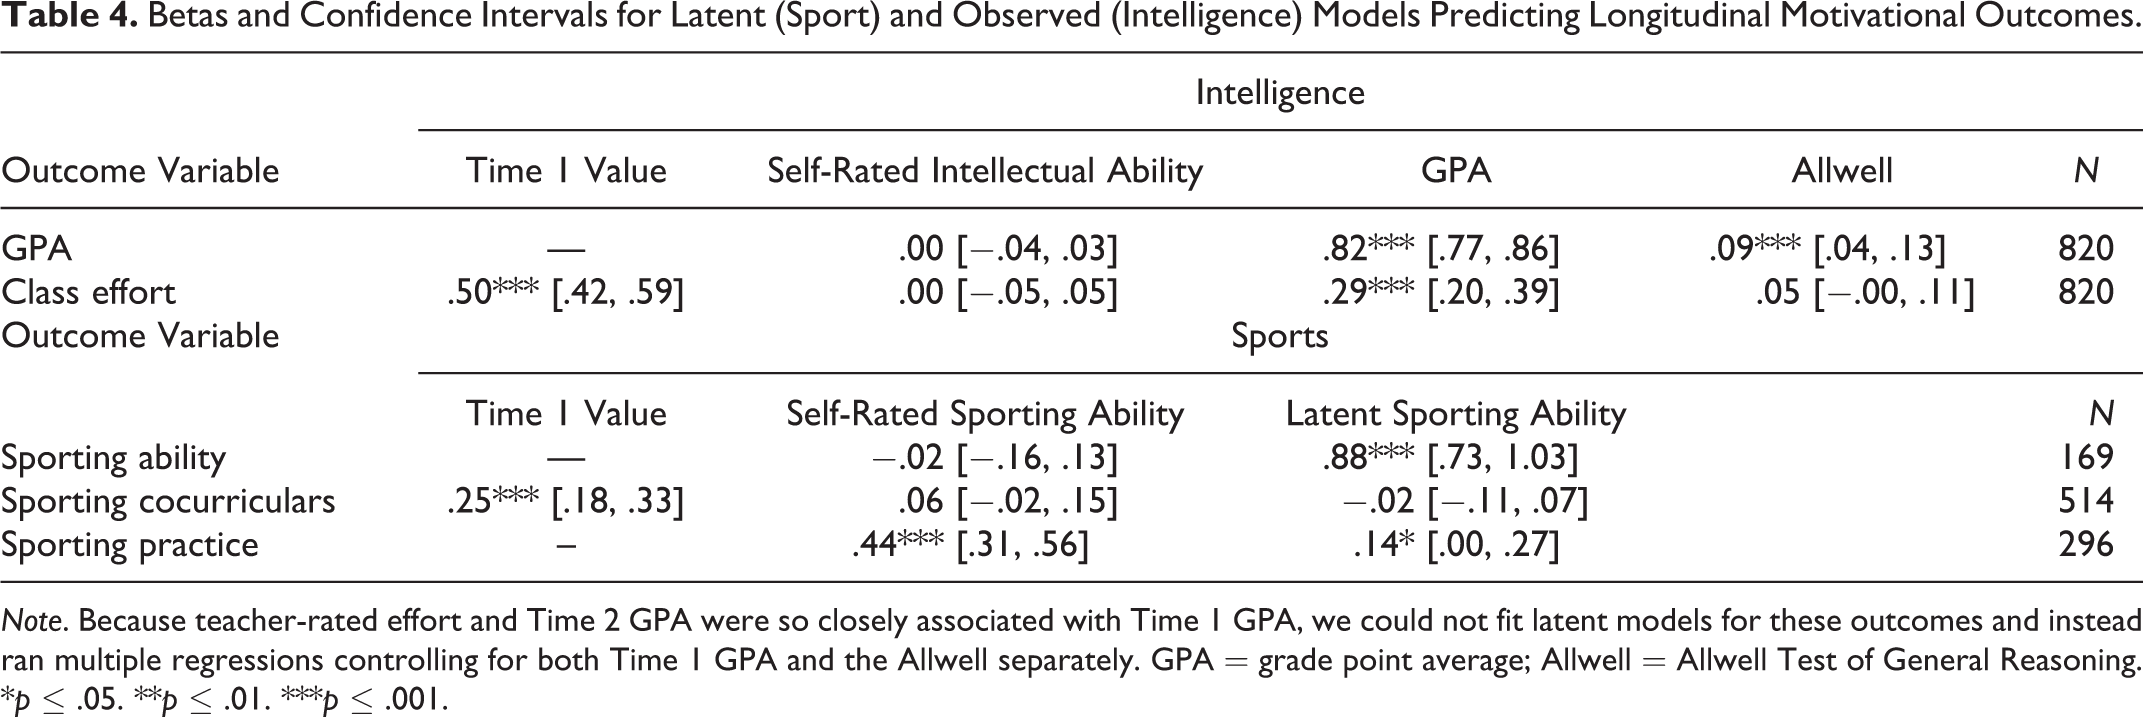
Note. Because teacher-rated effort and Time 2 GPA were so closely associated with Time 1 GPA, we could not fit latent models for these outcomes and instead ran multiple regressions controlling for both Time 1 GPA and the Allwell separately. GPA = grade point average; Allwell = Allwell Test of General Reasoning.
*p ≤ .05. **p ≤ .01. ***p ≤ .001.
Standardized Betas and Confidence Intervals for Latent Models Predicting Cross-Sectional Social Outcomes.
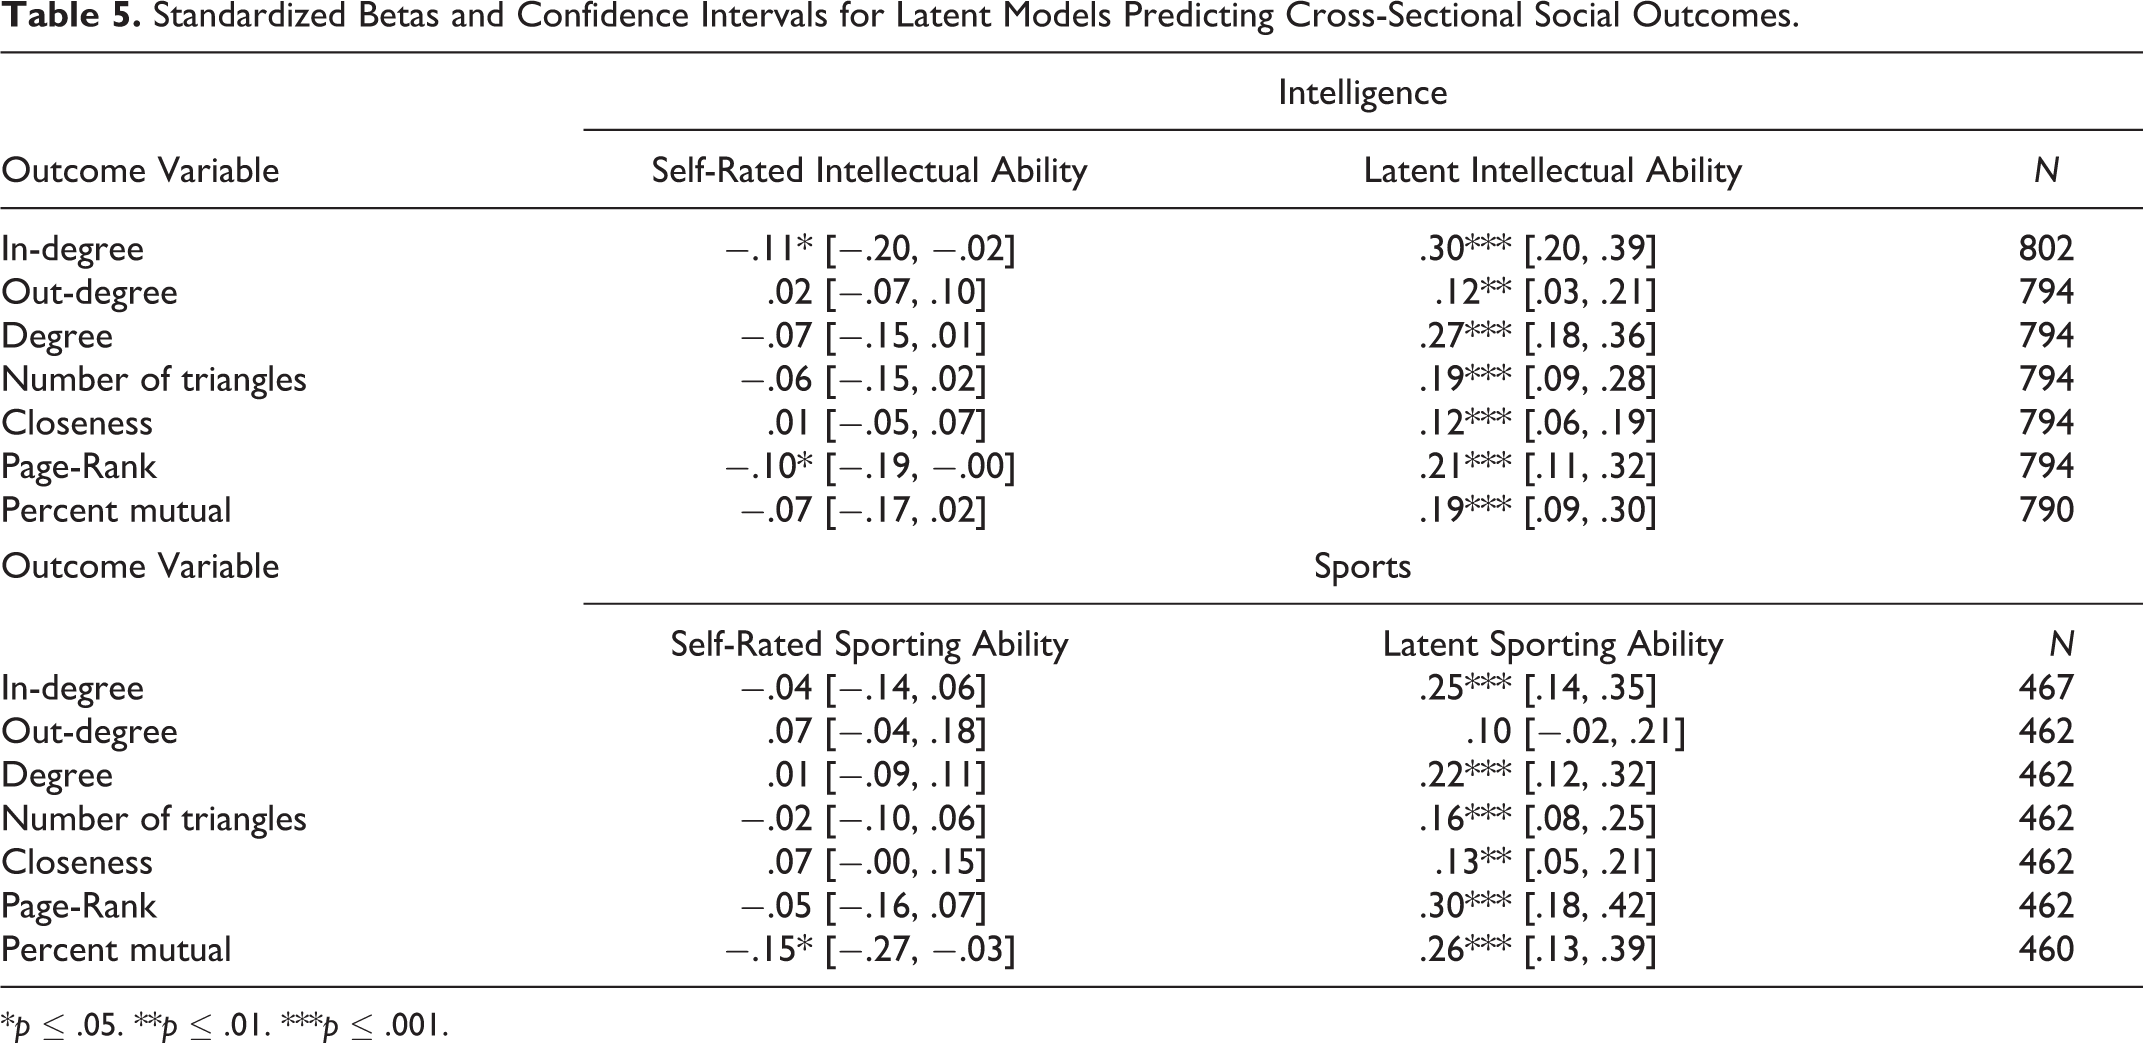
*p ≤ .05. **p ≤ .01. ***p ≤ .001.
Standardized Betas and Confidence Intervals for Latent Models Predicting Longitudinal Social Outcomes.
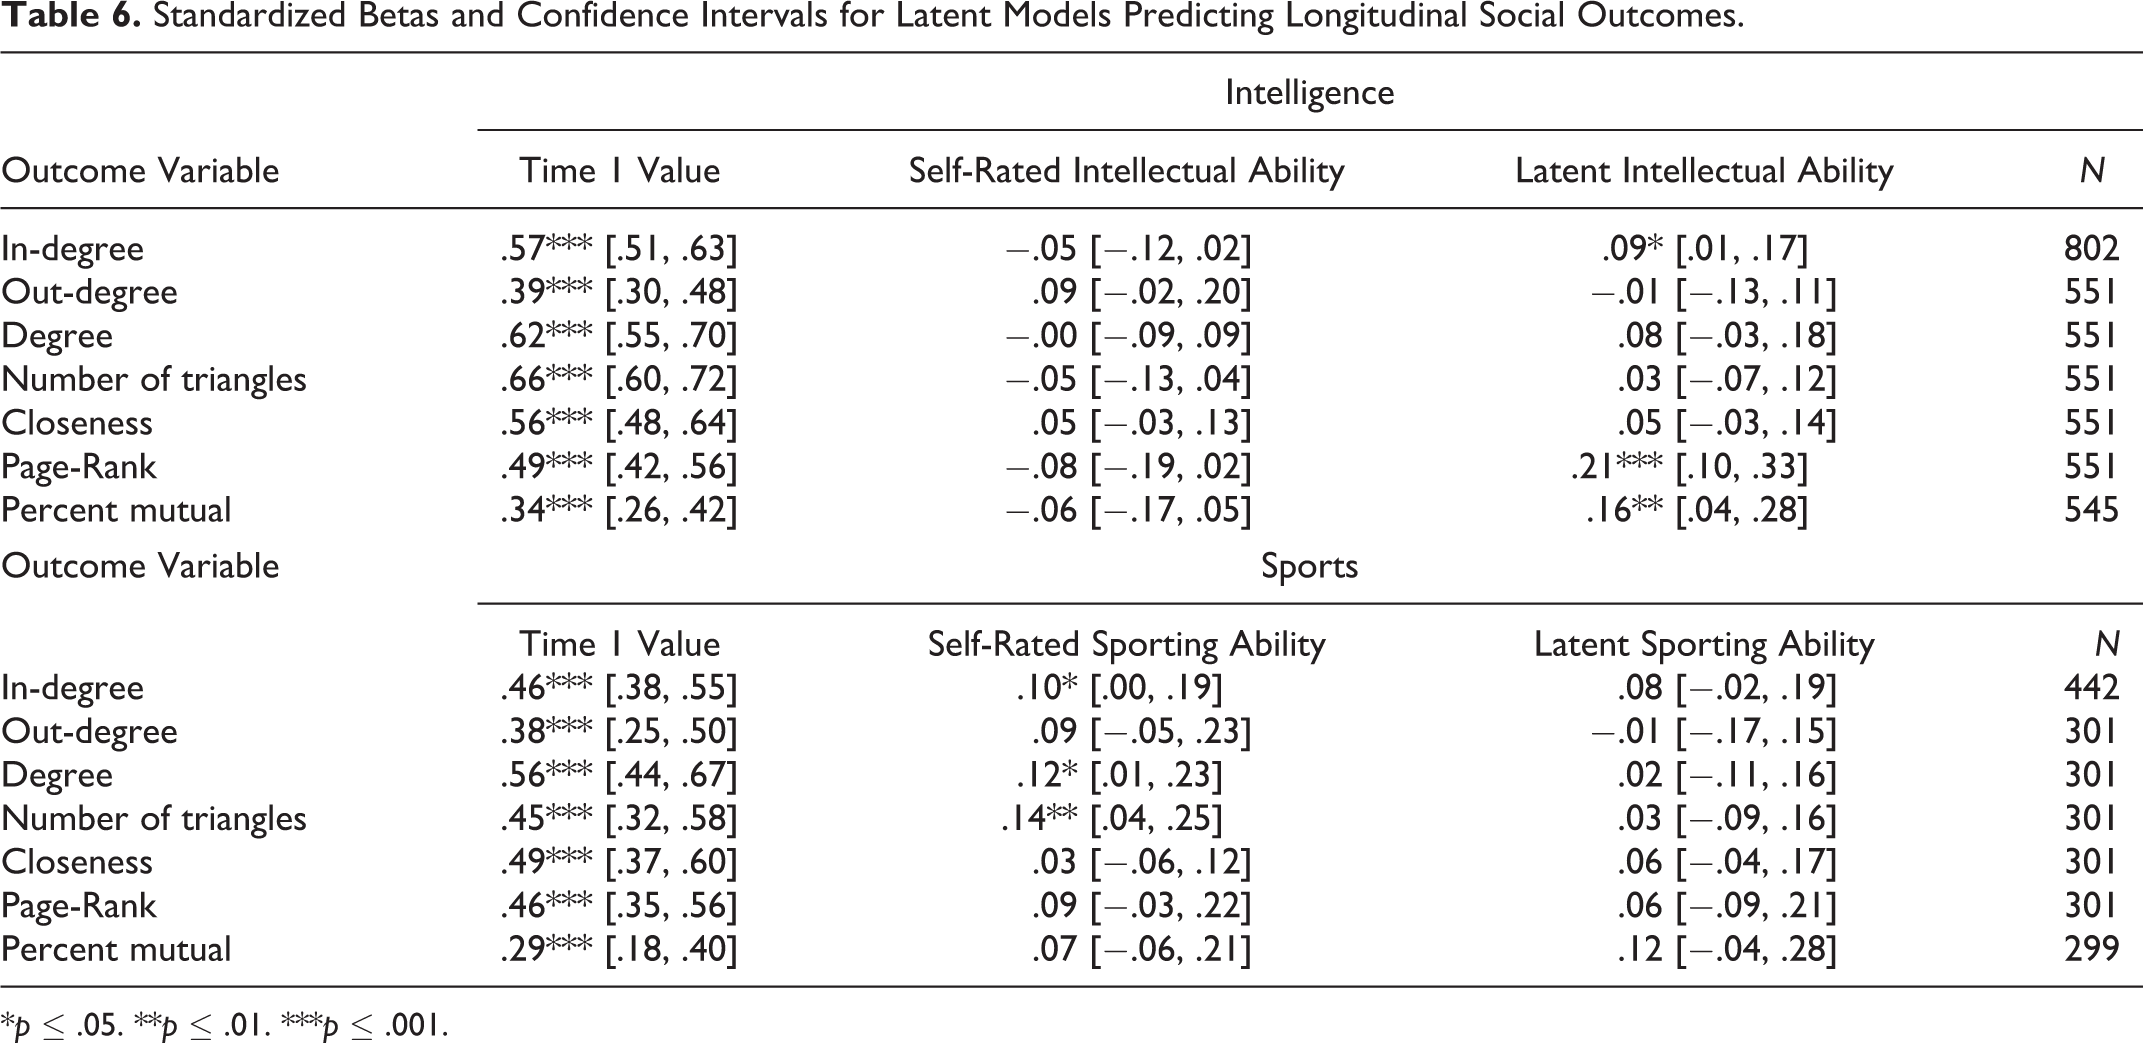
*p ≤ .05. **p ≤ .01. ***p ≤ .001.
The Effects of Overconfidence on Mental health
Cross-sectionally, intelligence overconfidence was significantly related to better outcomes on all mental health measures, and sporting overconfidence was related to higher self-esteem and life satisfaction, and less loneliness, but not to anxiety or depression (see Table 1). Longitudinally, intelligence overconfidence predicted significant increases in self-esteem, but no changes in other mental health indicators. No significant associations emerged between sporting overconfidence and change in mental health (see Table 2).
The Effects of Overconfidence on Motivation
Cross-sectionally, overconfidence in intelligence was not associated with teacher ratings of effort in the classroom. Sporting overconfidence, however, was associated with engagement in more sport-related cocurricular activities at Time 1, suggesting increased effort in the sporting domain (see Table 3).
Longitudinally, intelligence overconfidence did not predict increases in teacher-rated effort or improvement in grades across time. Sporting overconfidence was associated with students reporting more hours practiced at Time 2; however, sporting overconfidence did not predict an increase in sporting cocurricular activity, and neither overconfidence nor hours practiced predicted increased sporting ability at Time 2 (see Table 4).
The Effects of Overconfidence on Social Outcomes
Cross-sectionally, there was some indication that overconfidence was associated with negative social outcomes. Intelligence overconfidence was associated with lower in-degree and Page-Rank, and sporting overconfidence was associated with fewer mutual ties (see Table 5). Longitudinally, however, a more positive pattern emerged. Intelligence overconfidence predicted no changes over time, but sporting overconfidence predicted increases in in-degree, degree, and number of triangles (see Table 6). Thus, sporting overconfidence was associated with increased popularity over time, while intelligence overconfidence was not.
Discussion
The current study found that overconfidence tended to be associated with better mental health cross-sectionally, but the only longitudinal finding regarding mental health was that intelligence overconfidence predicted increased self-esteem. In this sense, the current results add to the mixed longitudinal findings regarding mental health, but they show no support for the alternative hypothesis that overconfidence is associated with poorer mental health over time. Results for the motivational account were also mixed. Overconfidence was associated with self-reported sporting engagement at Time 1, and predicted self-reported practice at Time 2. However, overconfidence did not predict objective outcomes, such as teacher-reported effort or increases in sporting or academic ability. Nevertheless, there was again no evidence that overconfidence was associated with decreased motivation over time.
Cross-sectionally, there was some evidence of a negative association between overconfidence and popularity. However, longitudinal results were substantially more positive. Intelligence overconfidence predicted no changes, but sporting overconfidence predicted increased popularity across three important social network metrics. These findings highlight the importance of investigating overconfidence across multiple domains, given that sporting but not intelligence overconfidence was associated with increased popularity over time. Nevertheless, it is unclear why sporting overconfidence predicted enhanced social outcomes while intelligence overconfidence did not. One possibility is that athleticism was more socially valued than intelligence in this all-boys sample. If students were aware of this, those who were overconfident in their sporting ability may have displayed more overall confidence than those overconfident in their intelligence. This remains an open question for future research.
Although some commentators have suggested that overconfidence should be most helpful in initial interactions (Paulhus, 1998), it is important to note that sporting overconfidence in this study was instead primarily associated with social benefits a year later. Immediate social benefits of overconfidence have mostly been shown in experiments where task performance is a highly salient factor and impressions must be formed quickly. Our work suggests that in real life, overconfidence may work at a slower pace through the cumulative effects of more confident actions and demeanor, rather than the conspicuous displays that may come to mind when envisioning an overconfident person.
Why then was overconfidence in sport associated with gains in popularity over time, when peers can so easily challenge our overconfident perceptions and “burst our bubbles”? One possibility, of course, is that participants’ peers continued to believe their overconfident self-perceptions. It is also possible, however, that peers may not be motivated to puncture these perceptions, even if they find them implausible. In most social situations people gain little from denigrating close others. To the extent that overconfidence is associated with adaptive outcomes, people may actually gain from the positive illusions of others in their social network and thus have little incentive to undermine them.
Caveats
Several limitations of our study should be kept in mind when interpreting these results. First, it remains possible that participants’ self-ratings included some true knowledge of ability (or potential) that we could not fully capture, despite our best attempts to measure the ability criterion broadly. For example, some participants might have had important knowledge of future events, such as having just been accepted into a varsity sports team. Of course, if our overconfidence measures tapped true ability in this way, we would expect them to predict increased ability at Time 2, which was not the case. Nonetheless, we cannot fully exclude this possibility, and our results should be interpreted with a degree of caution. Ideally, future studies would replicate our findings using an alternative measurement approach (such as asking participants to self-rate their performance on a specific test), as convergence across these two approaches would yield stronger evidence than either one alone.
Given that overconfidence was not manipulated, a separate concern is that we cannot be certain that the longitudinal associations we have found represent causal effects. It is possible, for example, that third variables might account for our results. Self-report biases are a particular concern here, as participants who exaggerate their self-ratings might also exaggerate other positive self-report variables. The association between sporting overconfidence and hours practiced (a self-report variable), for instance, must be taken with a grain of salt, as similar associations were not found with objectively measured ability. The same caveat holds for self-reported mental health outcomes. It is worth noting, however, that one of our key social outcomes (in-degree) is based entirely on the reports of friends. Thus, the association between sporting overconfidence and popularity cannot be explained by self-report biases.
Conclusion
The current results were somewhat mixed, but one possibility that emphatically was not supported by this study is that overconfidence leads to deleterious outcomes over time. In every outcome tested, overconfidence was associated with either no change over time or a change in the positive direction. The current study also added clarity to a mixed literature by testing all three major accounts for an adaptive function of overconfidence in a single, longitudinal setting. This approach minimizes the possibility that the greater support we found for the social benefits of overconfidence is a product of differences in our sample or measures.
Future research is needed to understand the differences between the domains of athletic and intelligence overconfidence, but this study nevertheless provided evidence that overconfidence can be associated with longitudinal social benefits. Furthermore, this finding emerged with measures of popularity in real-world social networks. These results suggest that although overconfidence might well have associated costs, the benefits may more than offset these costs—which would go a long way toward explaining the ubiquity of overconfidence.
Supplemental Material
Supplemental Material, SPPS699252_suppl_mat - A Longitudinal Test of Three Theories of Overconfidence
Supplemental Material, SPPS699252_suppl_mat for A Longitudinal Test of Three Theories of Overconfidence by Sean C. Murphy, Fiona Kate Barlow, and William von Hippel in Social Psychological and Personality Science
Footnotes
Declaration of Conflicting Interests
The author(s) declared no potential conflicts of interest with respect to the research, authorship, and/or publication of this article.
Funding
The author(s) disclosed receipt of the following financial support for the research, authorship, and/or publication of this article: This research was supported by Grant DP160100942 from the Australian Research Council.
Notes
Supplemental Material
The supplemental material is available in the online version of the article.
References
Supplementary Material
Please find the following supplemental material available below.
For Open Access articles published under a Creative Commons License, all supplemental material carries the same license as the article it is associated with.
For non-Open Access articles published, all supplemental material carries a non-exclusive license, and permission requests for re-use of supplemental material or any part of supplemental material shall be sent directly to the copyright owner as specified in the copyright notice associated with the article.