
Abstract
The relationship between social status and green consumption is pivotal in addressing the climate crisis, yet previous research reveals conflicting perspectives. We analyze a nationally representative panel survey of more than 63,000 British respondents, tracking their green consumption, attitudes, and behaviors across multiple years. The findings reveal a previously unidentified S-shaped relationship between social status and green consumption, challenging existing models that propose inverted U-shaped, negative linear, or positive linear associations. This S curve demonstrates a gradual increase in green consumption at lower levels of social status, followed by a steep rise in the middle range and then a leveling off among the highest-status individuals. Crucially, this pattern persists even when we control for income, with high-status individuals exhibiting stronger proenvironmental attitudes and engaging more in nonpecuniary green behaviors. These findings offer insights for policymakers and marketers aiming to promote eco-friendly behaviors across socioeconomic segments.
The escalating climate crisis poses an unprecedented threat to the future of the planet, making green consumption—the practice of choosing eco-friendly products and services 1 —increasingly crucial (Intergovernmental Panel on Climate Change [IPCC], 2018). Recent estimates suggest that changes in people’s daily routines and the adoption of low-carbon technologies could potentially reduce carbon emissions by up to 62% (Climate Change Committee, 2022). However, a persistent gap exists between proenvironmental attitudes and actual behaviors (ElHaffar et al., 2020; Park & Lin, 2020). Bridging this gap requires a deeper understanding of the complex relationship between social and psychological factors that shape consumer preferences and decisions.
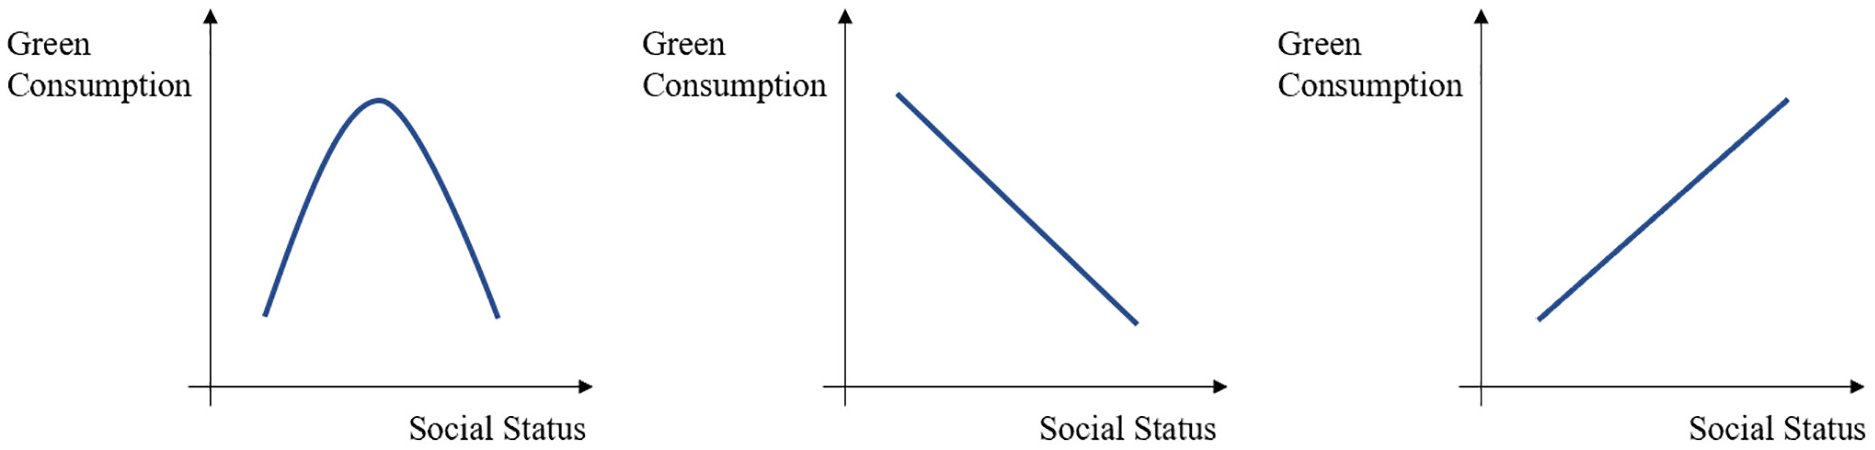
This research focuses on social status as an important determinant of green consumption, a factor that has sparked considerable debate in the literature given differing theoretical predictions and empirical findings about its influence on eco-friendly behaviors. Specifically, prior research suggests three possible patterns: an inverted U shape, in which green consumption peaks at moderate levels of social status and then declines at both low and high levels (Chen et al., 2023; Yan et al., 2021); a negative linear relationship, in which green consumption decreases as social status increases (Lee & Winterich, 2022; Ward et al., 2019); and a positive linear relationship, in which green consumption increases as social status increases (Griskevicius et al., 2010; Sexton & Sexton, 2014).
To resolve this ambiguity, we employ a large-scale, nationally representative panel survey of U.K. respondents tracked over multiple years. By applying rigorous theory-pruning methods (Leavitt et al., 2010; Tierney et al., 2020), we aim to determine the nature of the social status–green consumption relationship in this large dataset.
Social Status and Green Consumption: Three Theoretical Models
Model 1: The Inverted U-Shaped Model
First, Yan et al. (2021) proposed an inverted U-shaped relationship between social status and green consumption, with the middle class exhibiting the highest levels of green consumption (Figure 1, left). This model, which draws on optimal distinctiveness theory (Brewer, 1991), posits that the middle class engages in green consumption to align with social norms and differentiate themselves from other classes. Chen et al. (2023) further support this perspective, examining proenvironmental engagement through the lens of the middle-status anxiety hypothesis. Their study suggests that the moral identity of the middle class drives heightened green engagement, reinforcing the inverted U-shaped model.
Proposed Models of the Social Status–Green Consumption Relationship
Model 2: The Linear Negative Model
The second model proposes a negative, potentially linear relationship between social status and green consumption (Figure 1, center). In other words, individuals of higher status engage in less green consumption than those of lower status. The theoretical underpinning of this model is rooted in the concept of entitlement: higher-status individuals, feeling more entitled, may opt for products with greater environmental costs (Lee & Winterich, 2022). In support of this model, Ward et al. (2019) further demonstrate that status-driven individuals often choose harmful luxury items, such as leather goods made from endangered animals or cultured pearls. These choices signal dominance over nature and others, aligning with the negative linear model.
Model 3: The Linear Positive Model
The third model proposes a positive, potentially linear relationship between social status and green consumption (Figure 1, right). This model, grounded in costly signaling theory, suggests that high-status individuals engage more in green consumption as a way to signal desirable traits to others. Griskevicius et al. (2010) provide foundational support for this model, demonstrating that activating status motives leads people to prefer green products to luxurious nongreen alternatives, particularly in visible contexts. Building on this perspective, Sexton and Sexton (2014) introduce the concept of “conspicuous conservation,” in which high-status individuals use eco-friendly products as symbols of their environmental commitment. While these initial studies suggest a positive association without explicitly specifying linearity, other research provides more direct evidence supporting a linear relationship. For example, Zabkar and Hosta (2013) found a clear positive correlation between social status and willingness to engage in environmentally conscious consumer behavior.
Evaluating and Extending Models of Social Status and Green Consumption
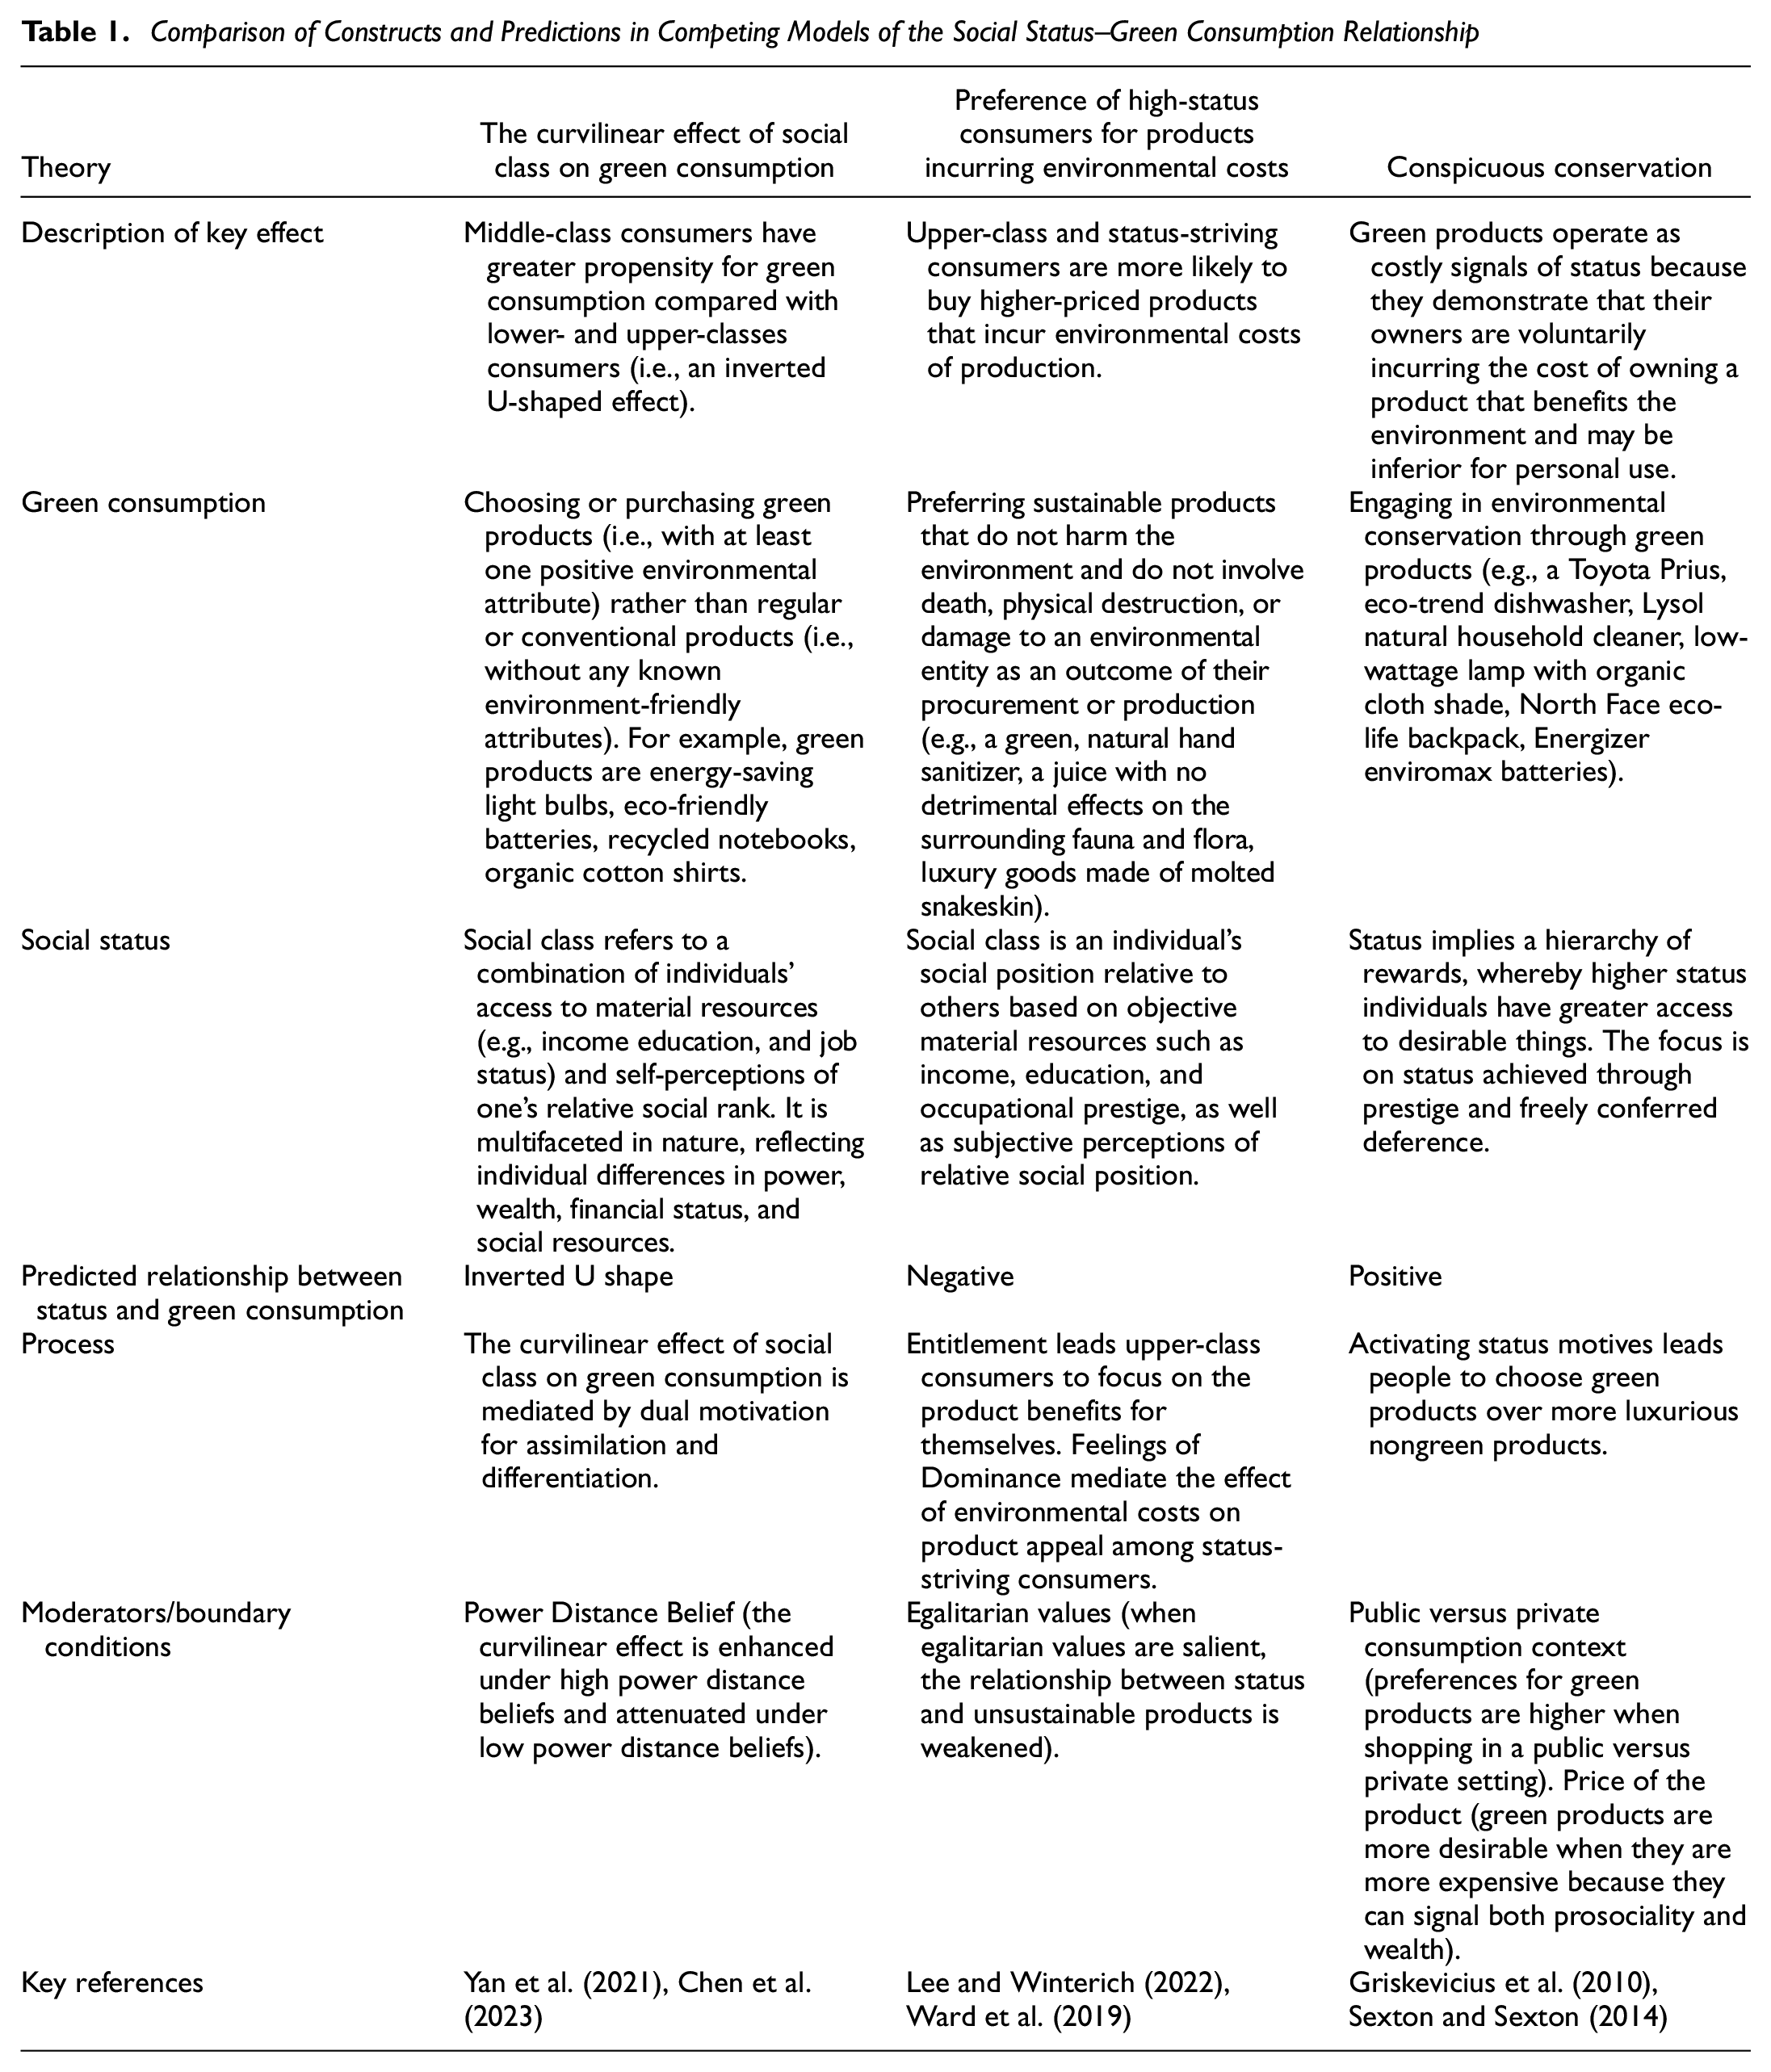
While three distinct models have been proposed to explain the relationship between social status and green consumption, empirical evidence supporting these models remains inconclusive. This ambiguity stems from two potential limitations in existing research: inadequate sample representativeness and a restricted range of measured behaviors. Our study addresses these limitations by using a nationally representative panel survey of more than 63,000 British respondents. We measure a comprehensive set of green consumption measures, including purchasing recycled products, choosing low-emission vehicles, and installing renewable energy systems. This approach enables us to capture a more comprehensive picture of green consumption across different social strata. To ensure valid comparisons with previous research (Leavitt et al., 2010), we verified the conceptual alignment of key variables (Table 1) and conducted pretests (supplemental material [SM]-A, Appendix) to confirm the measures’ consistency across studies.
Comparison of Constructs and Predictions in Competing Models of the Social Status–Green Consumption Relationship
Our analysis reveals a previously unidentified S-shaped relationship between social status and green consumption. This S curve demonstrates a gradual increase in green consumption at lower levels of social status, followed by a steep rise in the middle range, and then a leveling off among the highest-status individuals. Beyond evaluating the existing models, we aim to provide some preliminary evidence for the underlying motivations driving the social status–green consumption relationship. We consider two primary possibilities. First, high-status individuals may genuinely hold stronger green attitudes than other people, leading them to prioritize green consumption regardless of financial cost (Levine & Strube, 2012). Second, higher incomes might simply enable individuals to more easily afford green products and services, which tend to command a price premium in the market (McKinsey, 2023), without environmental attitudes being a key driver.
To differentiate between these possibilities, we examine both green consumption behaviors and environmental attitudes across the social status spectrum. We also distinguish between objective and subjective measures of social status. Moreover, we analyze nonpecuniary green behaviors, such as recycling and using reusable bags, which require effort but minimal financial investment. This comprehensive approach helps us disentangle the effects of attitudes, financial resources, and status on environmental behavior. By considering multiple facets of green consumption and social status, we aim to extend previous research and provide a clear understanding of the social status–green consumption relationship.
Method
Open Practices Statement
The data we use are publicly available, and the code to replicate our results is available on the Open Science Framework (OSF) website (https://osf.io/4w69t/?view_only=e77ff93bb0864233afaab76aac39796e). The analyses were not pre-registered.
Data Source and Sample Characteristics
We analyzed data from the Understanding Society survey (www.understandingsociety.ac.uk), a nationally representative, longitudinal study of U.K. households. This comprehensive panel survey encompasses a core sample of approximately 40,000 households, recruited to reflect the U.K. population’s demographics. Data collection occurs through face-to-face interviews in overlapping 24-month waves, with specific topics like green consumption and attitudes assessed on a rotating basis.
Our analysis included more than 150,000 observations from respondents tracked between 2009 and 2022. To account for potential confounding factors, we controlled for key demographic variables known to influence sustainable behaviors (Brough et al., 2016; Haws et al., 2014; Roberts, 1995), including age (M = 47.46 years, SD = 18.61), gender (54.13% female), employment status (53.9% currently with paid work), marital status (53.6% married), and the number of children in the household (M = 0.72, SD = 1.08). In terms of ethnicity, most of the sample (74.81%) identified as White. Additional sample information is available in SM-B.
Measurement Timeline and Data Structure
Social status indicators and green consumption were measured at various points across the survey waves. Social status metrics were collected in each wave, while green consumption measures were primarily captured in Waves 4 and 10, with additional items in Waves 1, 6, 8, and 13. Table 2 provides a timeline of the measures. To maximize statistical power and representativeness, we used all available data for each analysis. Consequently, sample sizes vary across models because of the rotating nature of some measures and patterns of missing data.
Timings for Measures from Understanding Society
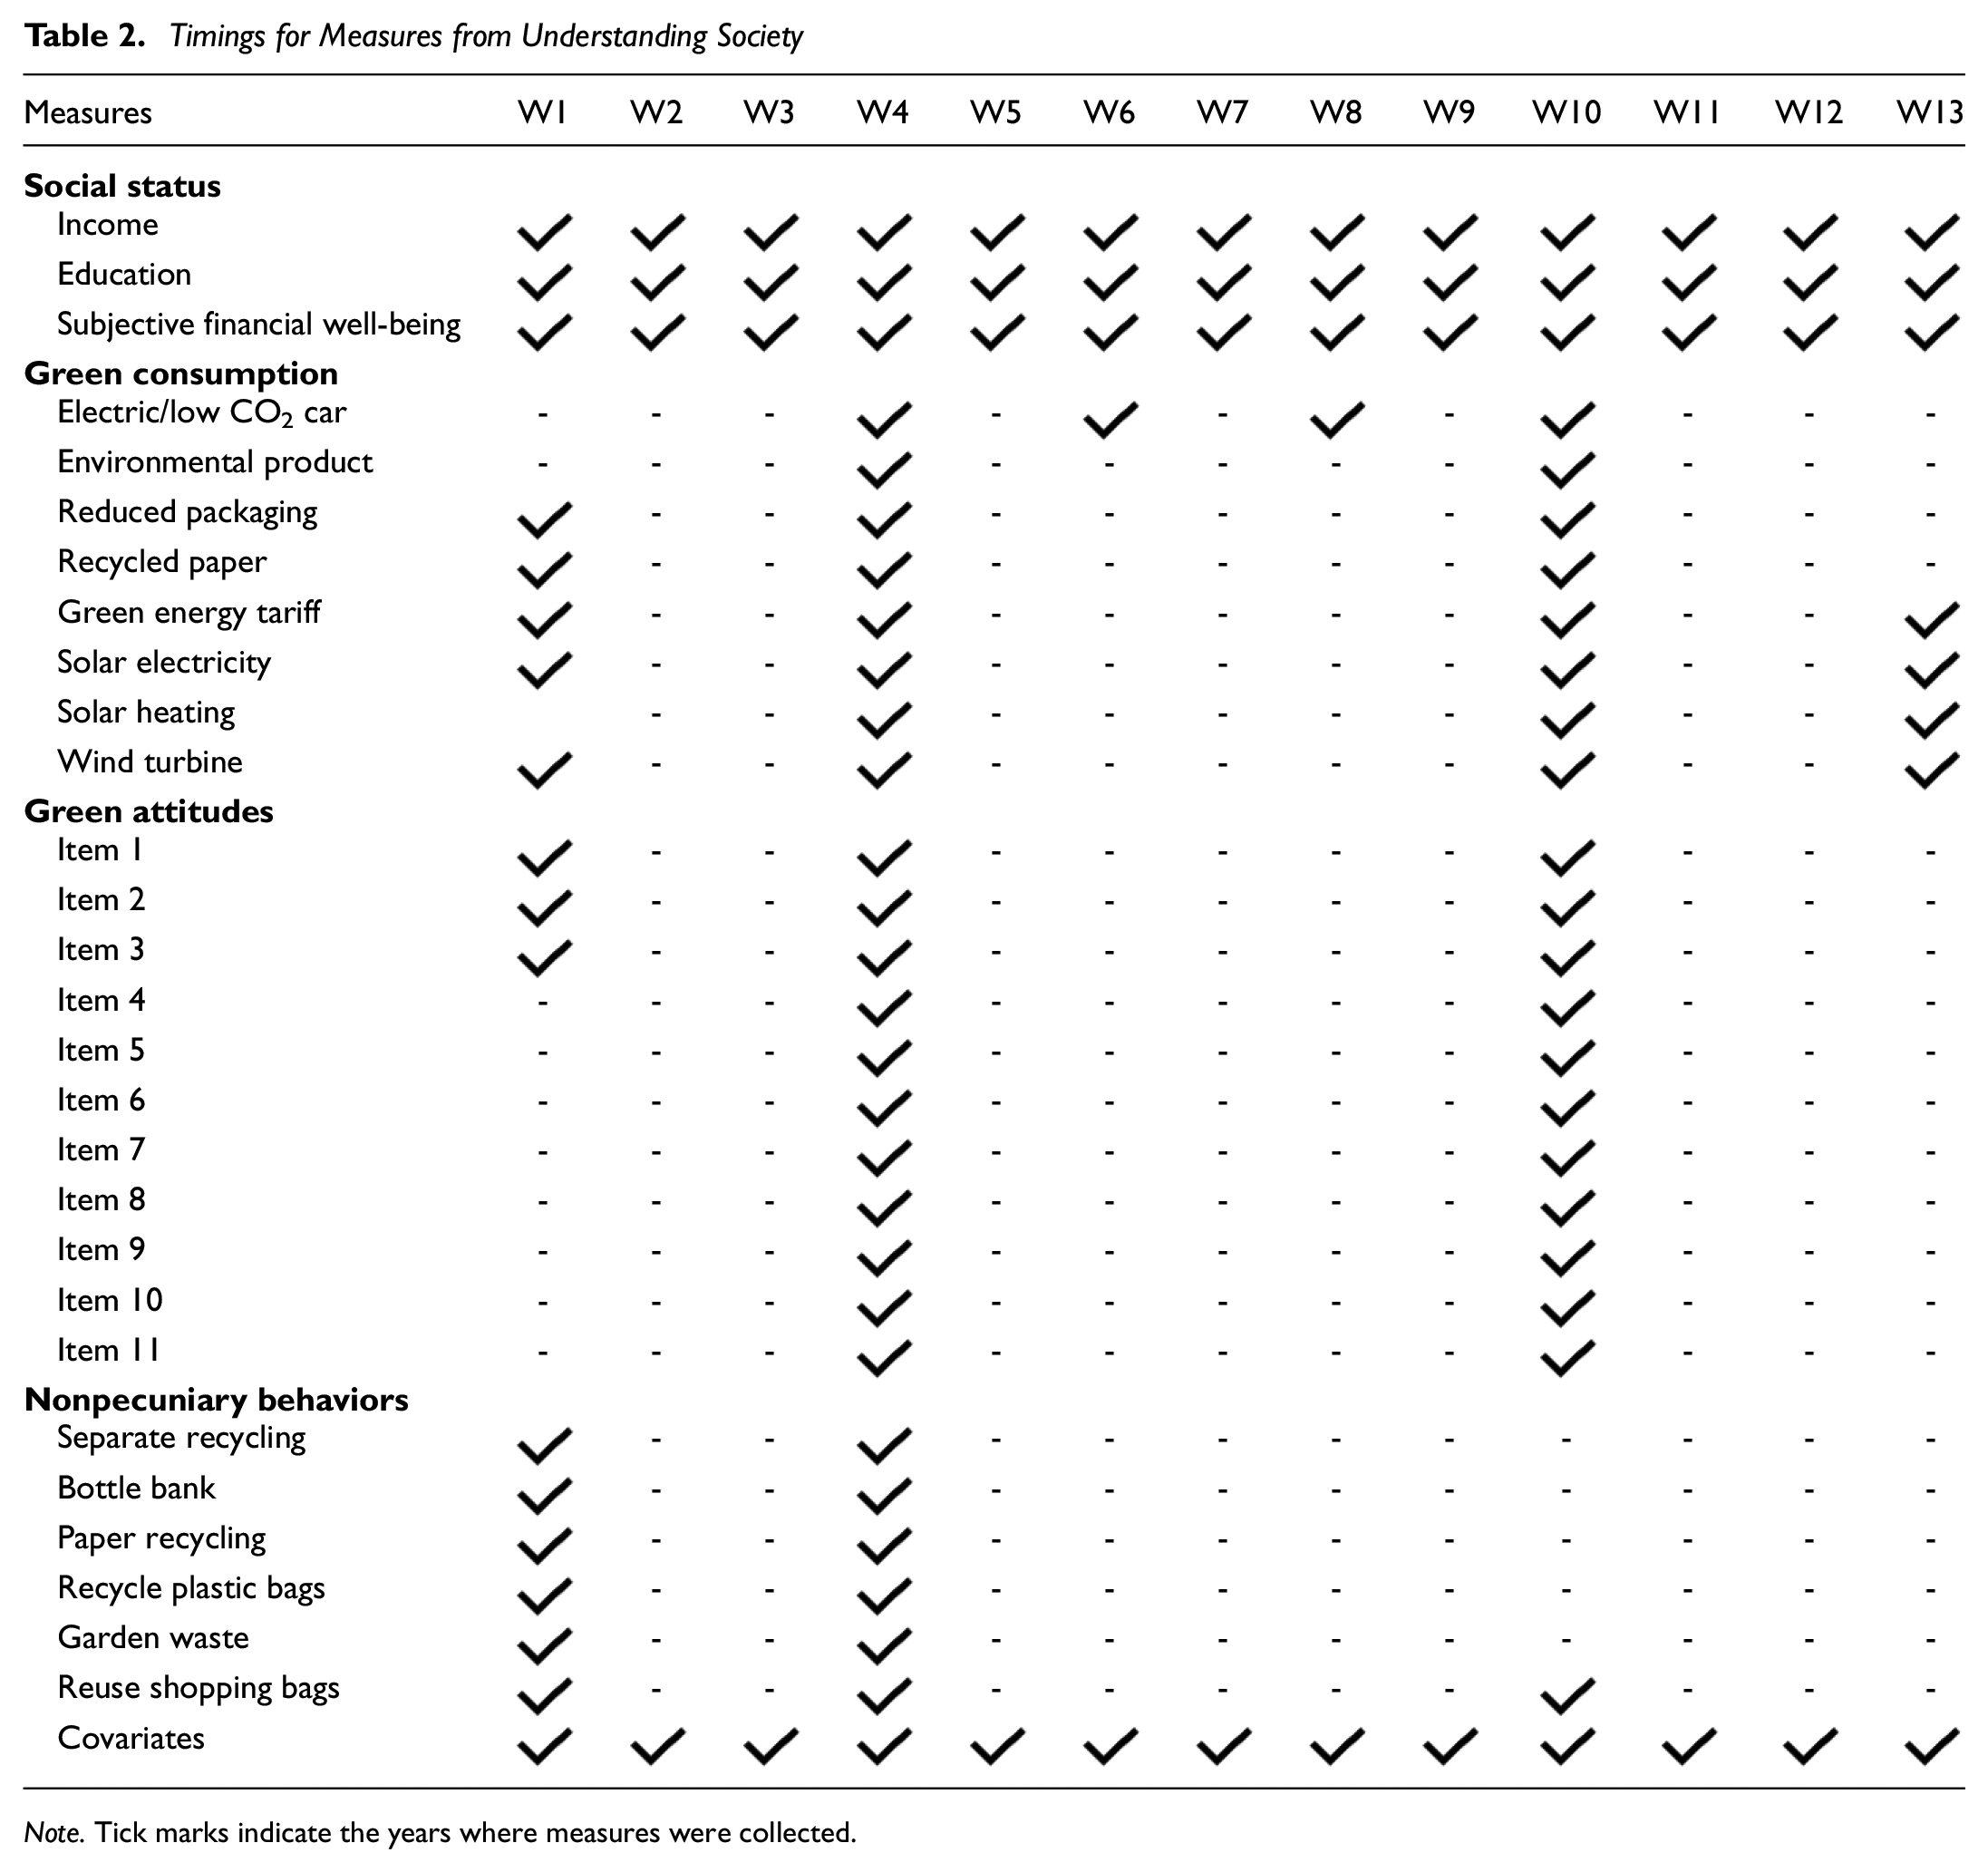
Note. Tick marks indicate the years where measures were collected.
Measures
Green Consumption
We operationalized green consumption using eight items from the Understanding Society survey (Table 3). These items assess respondents’ frequency or likelihood of engaging in eco-friendly consumption behaviors, ranging from everyday choices (e.g., purchasing recycled paper products) to more substantial investments (e.g., installing solar panels). Responses were standardized and recoded for consistency, with higher scores indicating greener choices. We analyzed these measures both individually and as a composite index of green consumption (α = .62). 2
Wording and Descriptive Statistics of Items Measuring Green Consumption
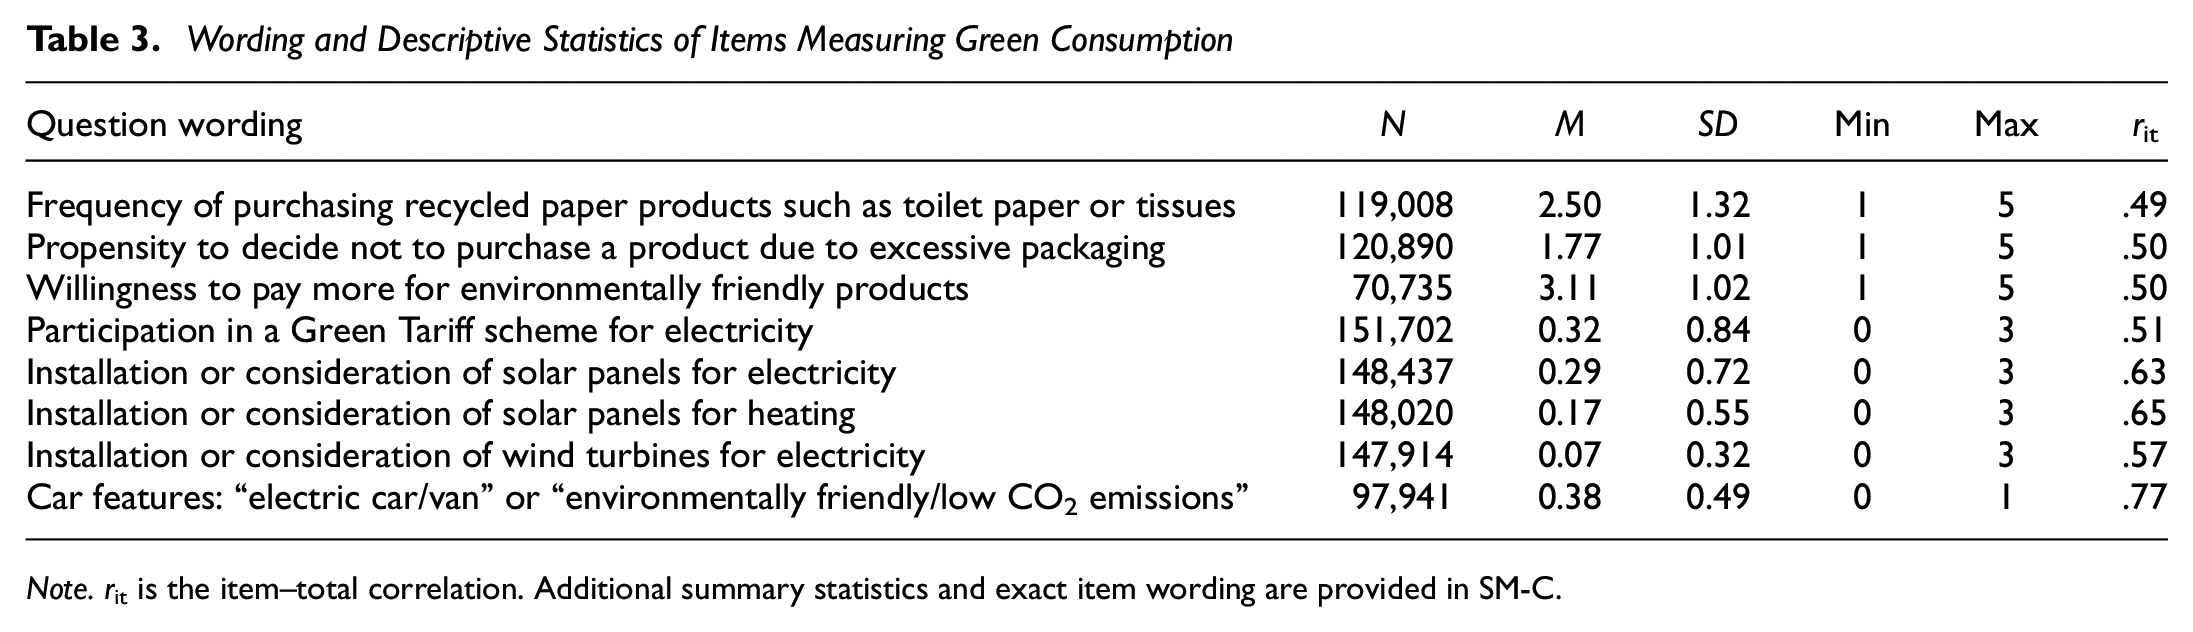
Note. rit is the item–total correlation. Additional summary statistics and exact item wording are provided in SM-C.
Social Status
Consistent with prior research (Anderson et al., 2012; Kraus et al., 2012), we employed a multidimensional measure of social status, incorporating both objective measures in the form of income and education and subjective assessments in the form of self-reports of financial well-being. Specifically, income was based on respondents’ mean annual income in British pounds (£), which we winsorized at 1% and 99% to reduce the influence of outliers (M = £20,418.35, SD = £18,133.52). Education was based on respondents’ highest educational qualification in the United Kingdom, ranging from 1 (no qualifications) to 17 (higher degree) (M = 8.35, SD = 6.18). Subjective financial well-being was based on respondents’ self-reported assessment of how well they managed financially on a 5-point scale (1 = finding it very difficult, 5 = living comfortably) (M = 3.85, SD = 1.01). We computed a composite score of overall social status by standardizing and averaging the three measures. Although not necessary for formative constructs such as social status (Bollen & Lennox, 1991), we found positive correlations among all status measures (income and education: r = .32; income and financial situation: r = .22; education and financial situation: r = .12; all ps < .001). Figure 2 shows that the composite variable follows a normal distribution.
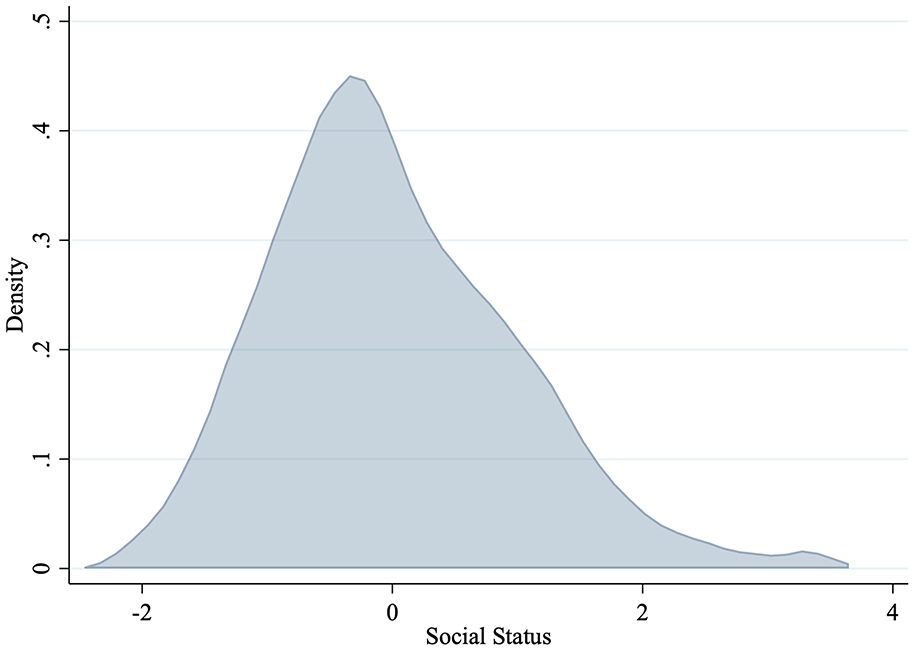
Kernel Density Plot of the Distribution of Social Status
Green Attitudes
We assessed respondents’ green attitudes using an 11-item scale (α = .78) adapted from the 2007 and 2009 U.K. government surveys of public attitudes to the environment (Thornton, 2009). This scale evaluates individuals’ environmental concerns, endorsement of sustainable lifestyles, and awareness of climate change threats (e.g., “Which of these would you say best describes your current lifestyle?” 1 = I don’t really do anything that is environmentally friendly, 5 = I’m environmentally friendly in everything I do). We coded all responses such that higher scores indicated stronger environmental attitudes. The complete list of items is available in SM-D.
We validated the scale’s unidimensionality through an exploratory factor analysis using principal factoring. The results revealed a single dominant factor (eigenvalue = 3.02) accounting for 96.52% of the variance, supporting the scale’s reliability as a measure of green attitudes.
Nonpecuniary Green Behaviors
To disentangle the effects of green attitudes from income, we also examined nonpecuniary green behaviors that do not require monetary expenditure. The Understanding Society dataset provided five items measuring recycling habits (e.g., frequency of recycling various materials) and the use of reusable shopping bags, primarily measured in Waves 1 and 4 (see Table 4 and SM-E for details). By analyzing these behaviors alongside green consumption, we aimed to determine whether financial accessibility was the primary driver of eco-friendly behaviors among high-status individuals.
Wording and Descriptive Statistics of Items Measuring Nonpecuniary Green Behavior
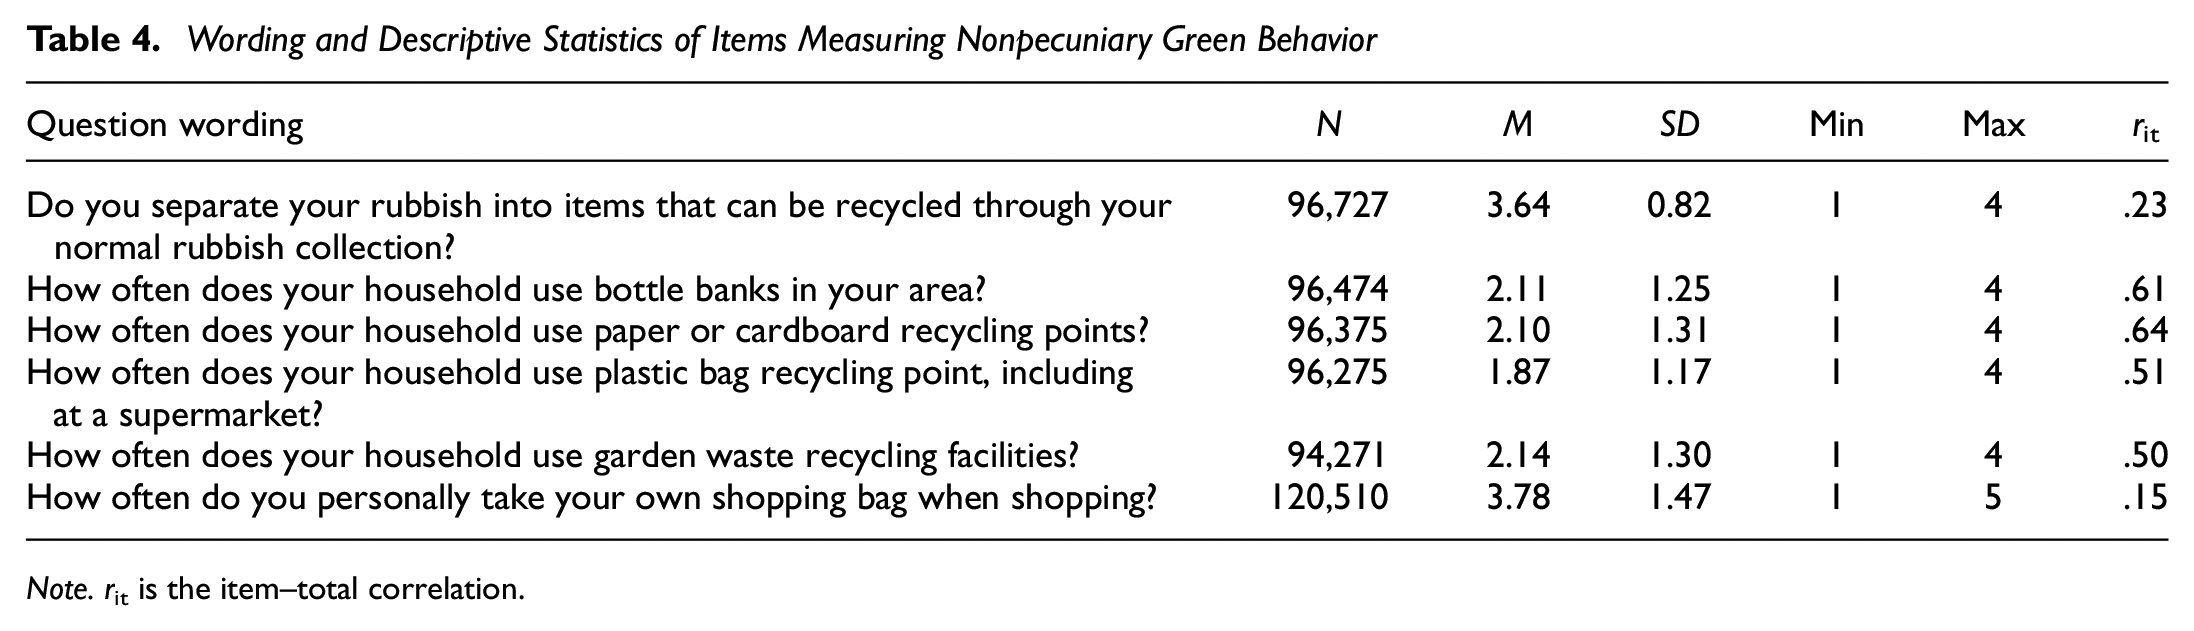
Note. rit is the item–total correlation.
While recycling and reusing bags are generally cost-free and widely accessible (Oluwadipe et al., 2022), we acknowledge that some recycling behaviors might require resources more readily available to affluent individuals, such as dedicated waste disposal or storage space. To address this, we excluded answers from respondents who indicated that particular behaviors did not apply to their circumstances (1.39%–1.58% for recycling facilities, 3.59% for garden waste). With these exclusions, and to avoid the potential bias of a composite measure that might exclude individuals with missing data on any single behavior, we analyzed each nonpecuniary eco-friendly behavior separately.
Results
Relationship Between Social Status and Green Consumption
Our analysis reveals a complex, S-shaped relationship between social status and green consumption, challenging existing inverted U-shaped and linear models. We began with binned scatterplots (Figure 3) to visually examine the relationship without imposing any predetermined functional form. These plots suggest a positive, non-linear association between social status and various green consumption behaviors. To quantify this relationship, we employed multilevel polynomial regressions, accounting for nested data structures and controlling for covariates. We fitted polynomial models of different orders (linear, quadratic, and cubic) to capture the possible different forms of the relationship, selecting the best-fitting highest-order model for each green consumption item using a backward elimination procedure (SM-F).
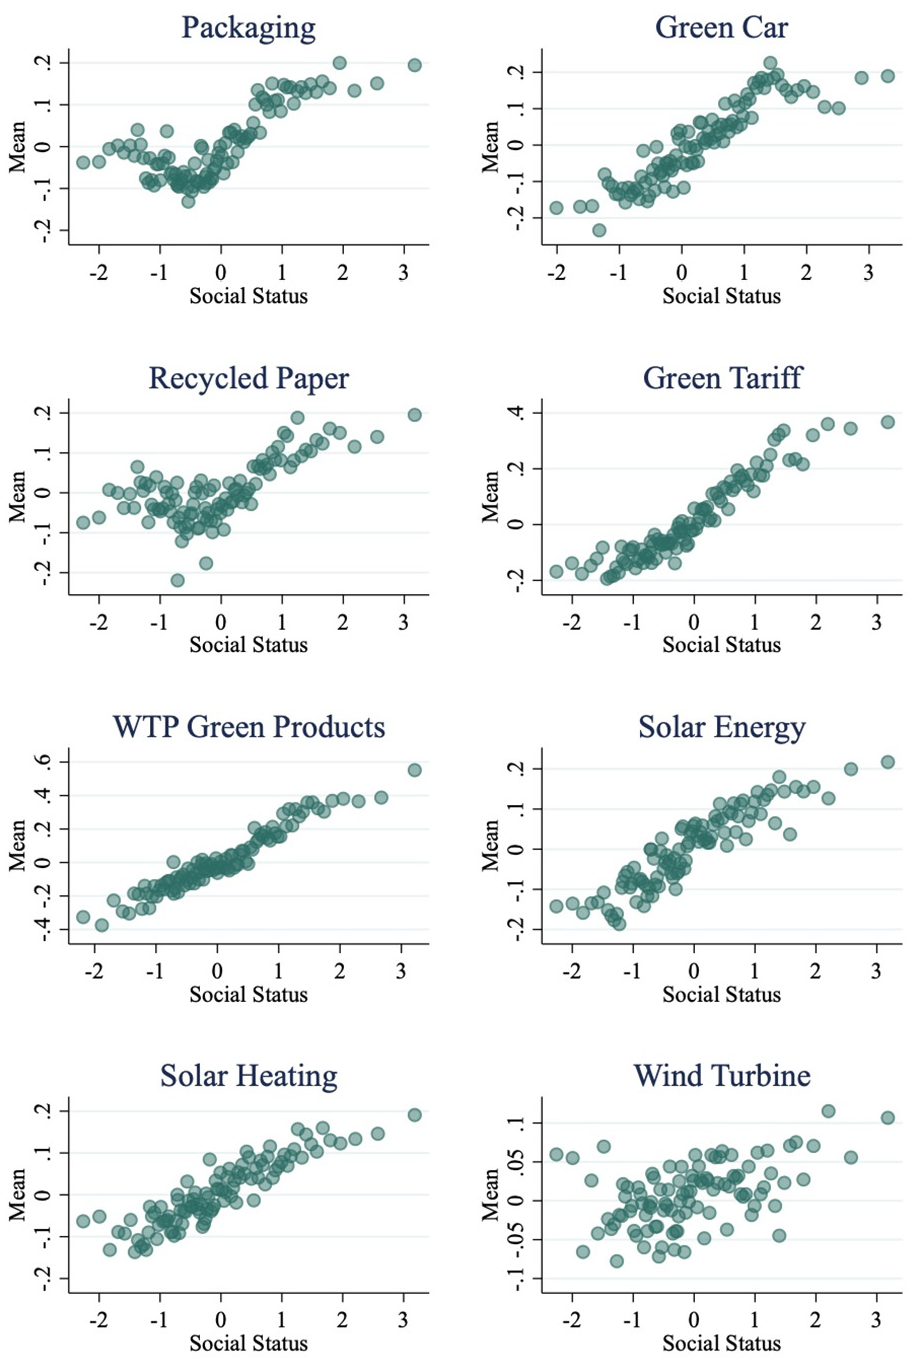
Binned Scatterplot of Social Status and Green Consumption
Our results (Table 5) confirm a significant relationship between social status and all green consumption items. For most measures, this relationship is cubic, indicating an S-shaped pattern. This pattern suggests a gradual increase in green consumption at lower levels of social status, followed by a steeper rise in the middle range of social status and then a leveling off among the highest-status individuals. Specifically, we observed cubic relationships for minimal packaging (b 3 = −.01, SE = 0.001, z = −8.03, p < .001), green car ownership (b 3 = −.009, SE = 0.002, z = −5.83, p < .001), use of recycled paper products (b 3 = −.007, SE = 0.001, z = −5.04, p < .001), participation in green tariffs (b 3 = −.012, SE = 0.001, z = −8.44, p < .001), willingness to pay for green products (b 3 = −.005, SE = 0.002, z = −3.14, p = .002), solar energy adoption (b 3 = −.004, SE = 0.001, z = −2.64, p = .008), and solar heat installation (b 3 = −.003, SE = 0.001, z = −2.98, p = .003). The only exception was wind turbine ownership, which exhibited a quadratic relationship (b 2 = .007, SE = 0.002, z = −6.32, p < .001).
Multilevel Regression Models Predicting Green Consumption From Social Status and Covariates
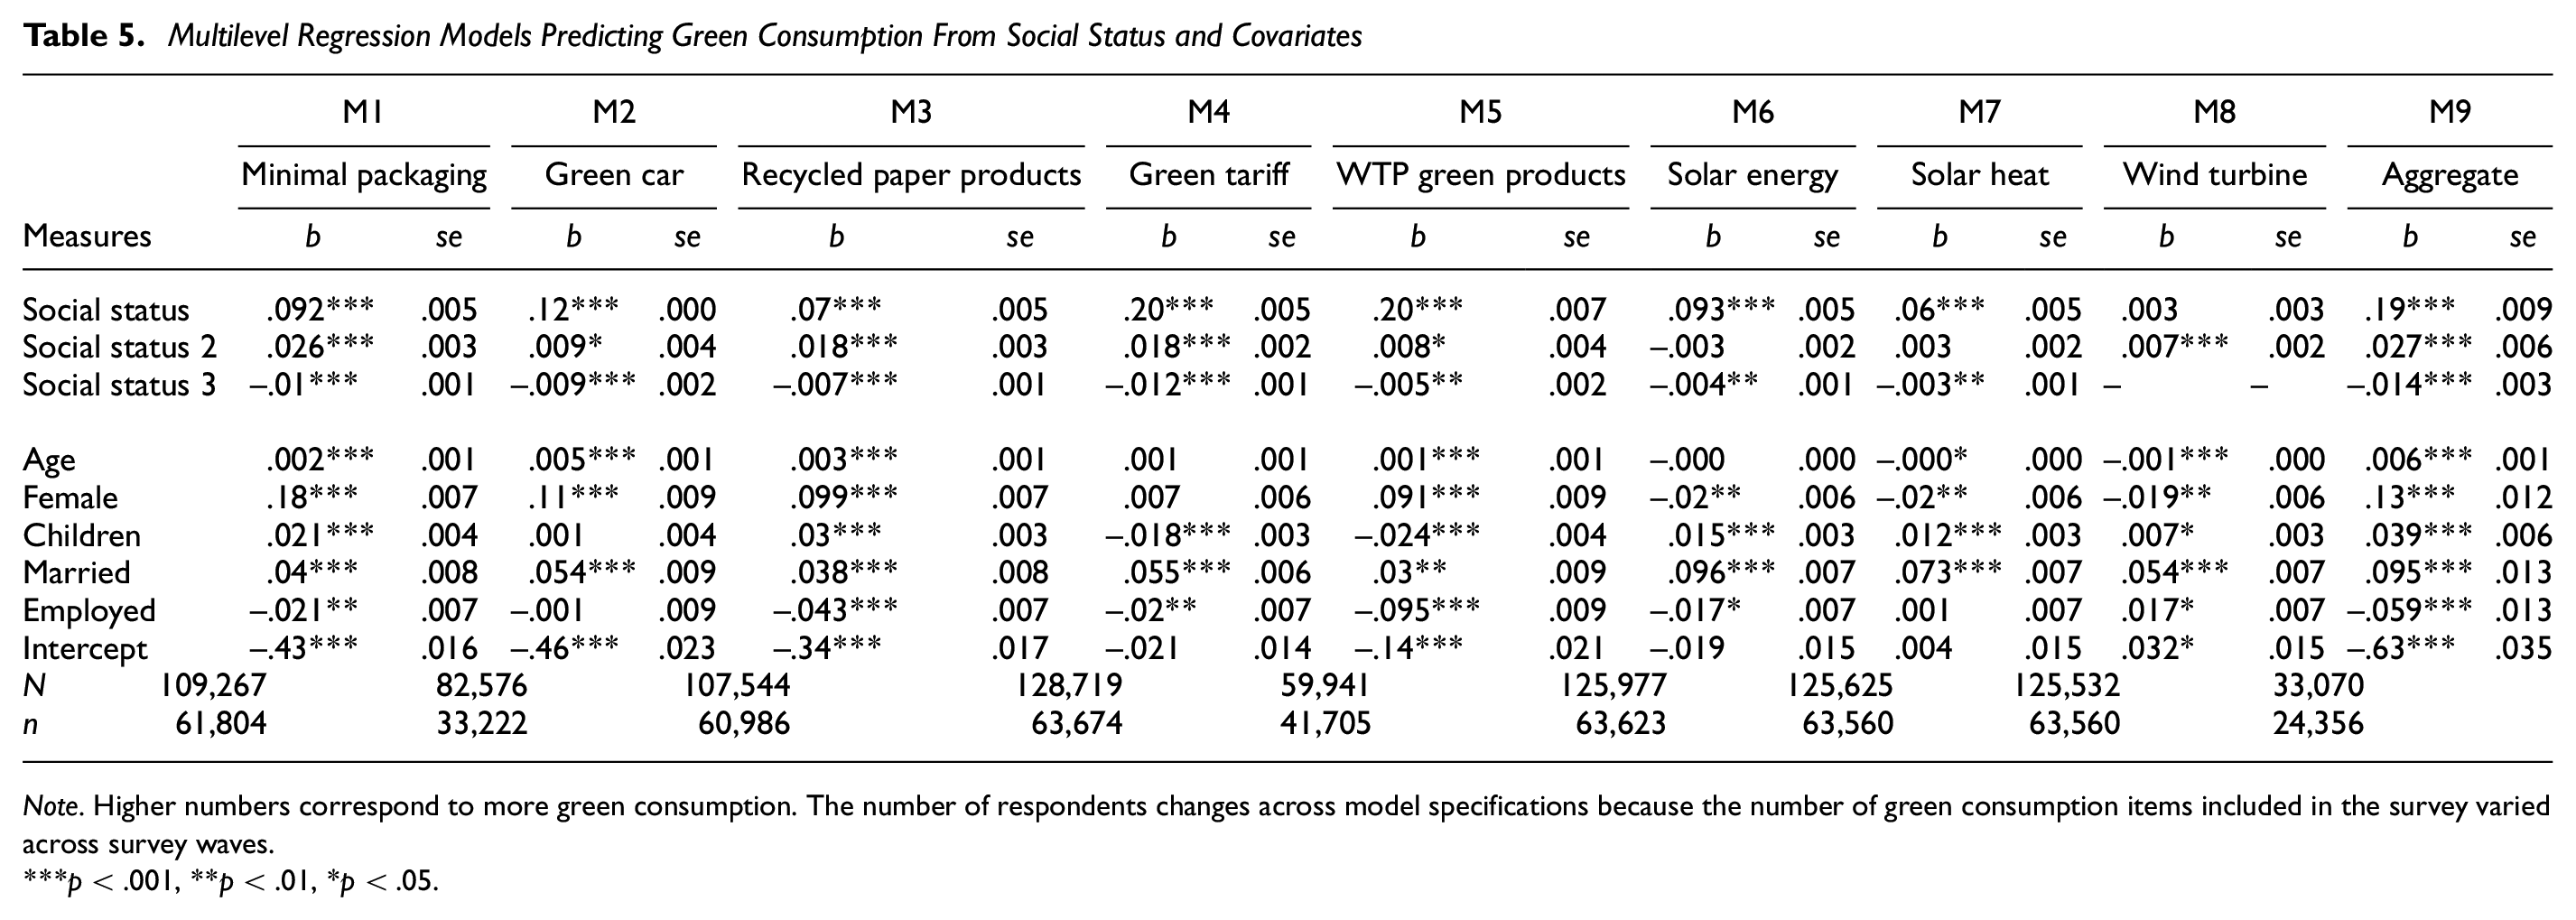
Note. Higher numbers correspond to more green consumption. The number of respondents changes across model specifications because the number of green consumption items included in the survey varied across survey waves.
p < .001, **p < .01, *p < .05.
Figures 4 and 5 depict the green consumption levels along the social status continuum. The S-shaped pattern is particularly pronounced for the aggregate measure of green consumption (aggregate: b 3 = −.014, SE = 0.003, z = −5.54, p < .001; Figure 5). Importantly, the linear component of the relationship is positive for all items, indicating that higher social status generally correlates with increased green consumption. The S-shaped curve suggests that the effect of social status on environmental behavior is not uniform across the status spectrum but rather varies in strength at different levels.
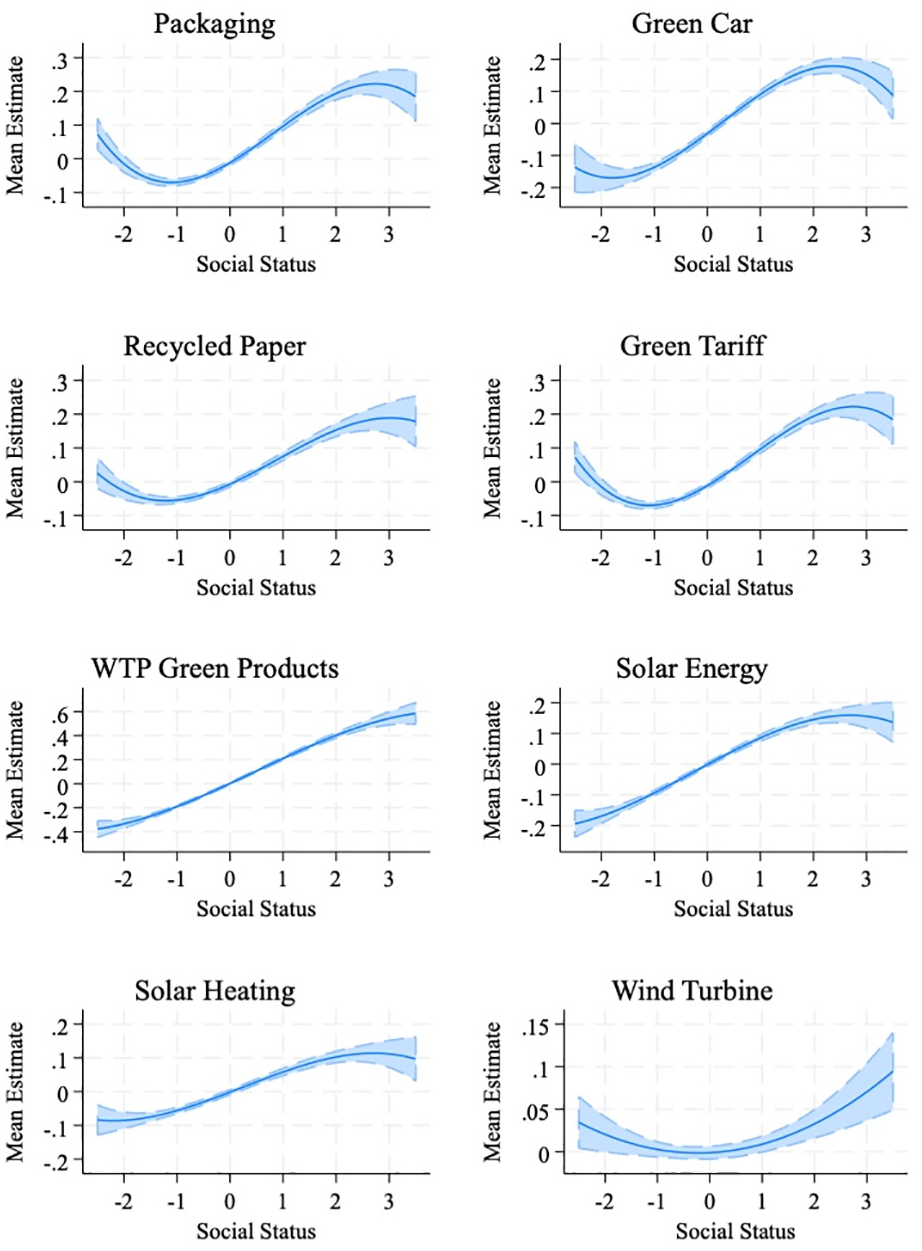
Plots of the Relationships Between Social Status and Green Consumption
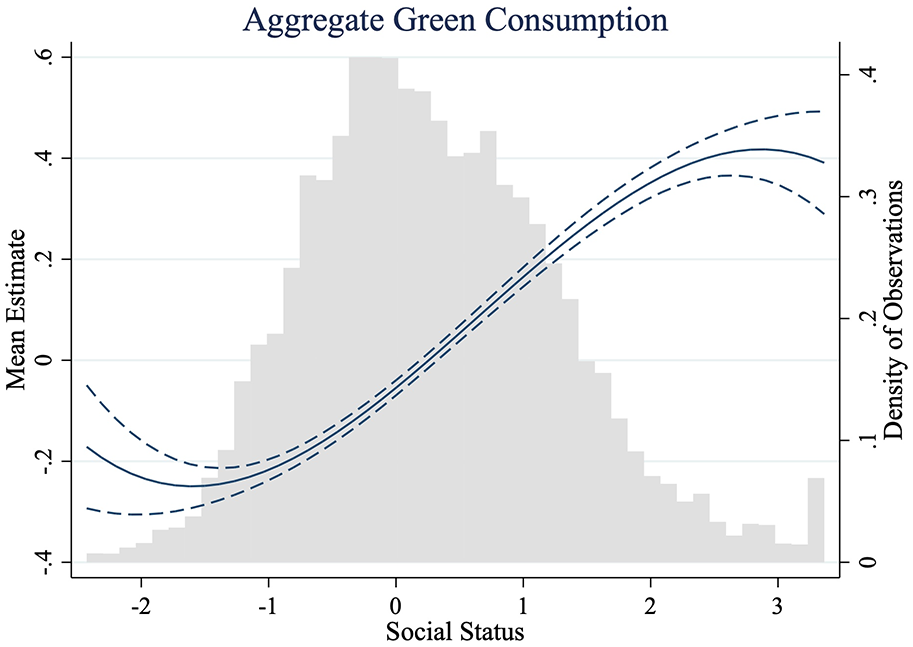
Aggregate Green Consumption as a Function of Social Status
Differentiating Objective and Subjective Social Status: Distinct Patterns in Green Consumption
We also conducted separate analyses for objective (income and education) and subjective (self-reported financial well-being) markers of status given that the relationship between these measures is often small-to-moderate (Elbæk et al., 2023; Tan et al., 2020). Indeed, our findings reveal different patterns in their relationships to green consumption, underscoring the value of this differentiated approach.
Objective social status maintains a cubic relationship to overall green consumption (b 3 = −.012, SE = 0.003, z = −4.32, p < .001), similar to our combined status measure. This S-shaped curve (Figure 6, left panel) reveals a complex relationship in which green consumption increases slowly at lower levels of objective status, rises more steeply in the middle range, and continues to increase at a slower rate at the highest levels of status. This pattern suggests that as individuals gain more income and education, their engagement in green consumption consistently increases, though at varying rates across the status spectrum.

Contrasting Effects of Objective and Subjective Status on Aggregate Green Consumption
By contrast, subjective social status shows a quadratic relationship to green consumption (b 2 = −.015, SE = 0.004, z = 3.43, p = .001). The curve (Figure 6, right panel) reveals a different pattern; green consumption is relatively low for individuals with low subjective status, increases at an accelerating rate as subjective status rises, and shows the steepest increase at the highest levels of subjective status. As individuals view their financial situation more positively, they become more likely to engage in green consumption, with this tendency being strongest among those who feel the most financially secure.
These divergent patterns highlight the importance of distinguishing between objective and subjective measures of status in understanding green consumption. Objective status has a more consistent positive effect on green consumption across the status spectrum, possibly reflecting the role of actual resources and knowledge in enabling eco-friendly choices. Subjective status, by contrast, has a stronger influence at higher levels, suggesting that those who perceive themselves as high status are particularly motivated to engage in green consumption, possibly as a form of status signaling or identity expression.
Decoupling Income and Green Attitudes
The contrasting patterns of objective and subjective social status markers raise a key question: do higher levels of green consumption among high-status individuals reflect genuine environmental concern or simply greater financial ability? To answer this question and further unpack the mechanisms behind our observed relationships, we employed three approaches.
First, we excluded income from the status measure, defining social status solely by education and subjective financial well-being. Even with this adjustment, we observed a positive, slightly convex relationship to green consumption (b 2 = .043, SE = 0.005, z = 8.53, p < .001; SM-G). This finding suggests that the association between status and green consumption extends beyond mere income effects, reinforcing the importance of considering both objective and subjective aspects of social status.
Second, we examined green attitudes, finding patterns that mirror our green consumption results. High-status individuals reported significantly stronger environmental attitudes (b 3 = −.010, SE = 0.001, z = −10.40, p < .001; Figure 7), with the relationship following a similar S-shaped curve. This parallel between attitudes and behaviors supports the notion that green consumption choices among high-status individuals likely stem from genuine environmental concern, not merely financial capability.
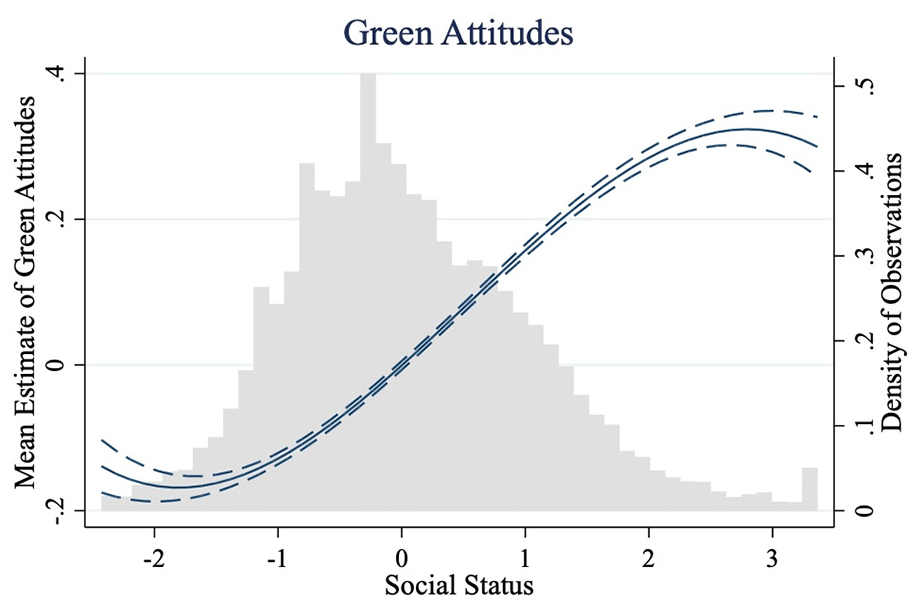
Relationship Between Social Status and Green Attitudes
Third, we analyzed nonpecuniary green behaviors. High-status individuals showed greater engagement in cost-free green behaviors such as recycling and using reusable bags (Figure 8). This result further supports the idea that their commitment to sustainability extends beyond financial considerations, aligning with the positive relationships observed for both objective and subjective status measures. These analyses are presented in SM-E.
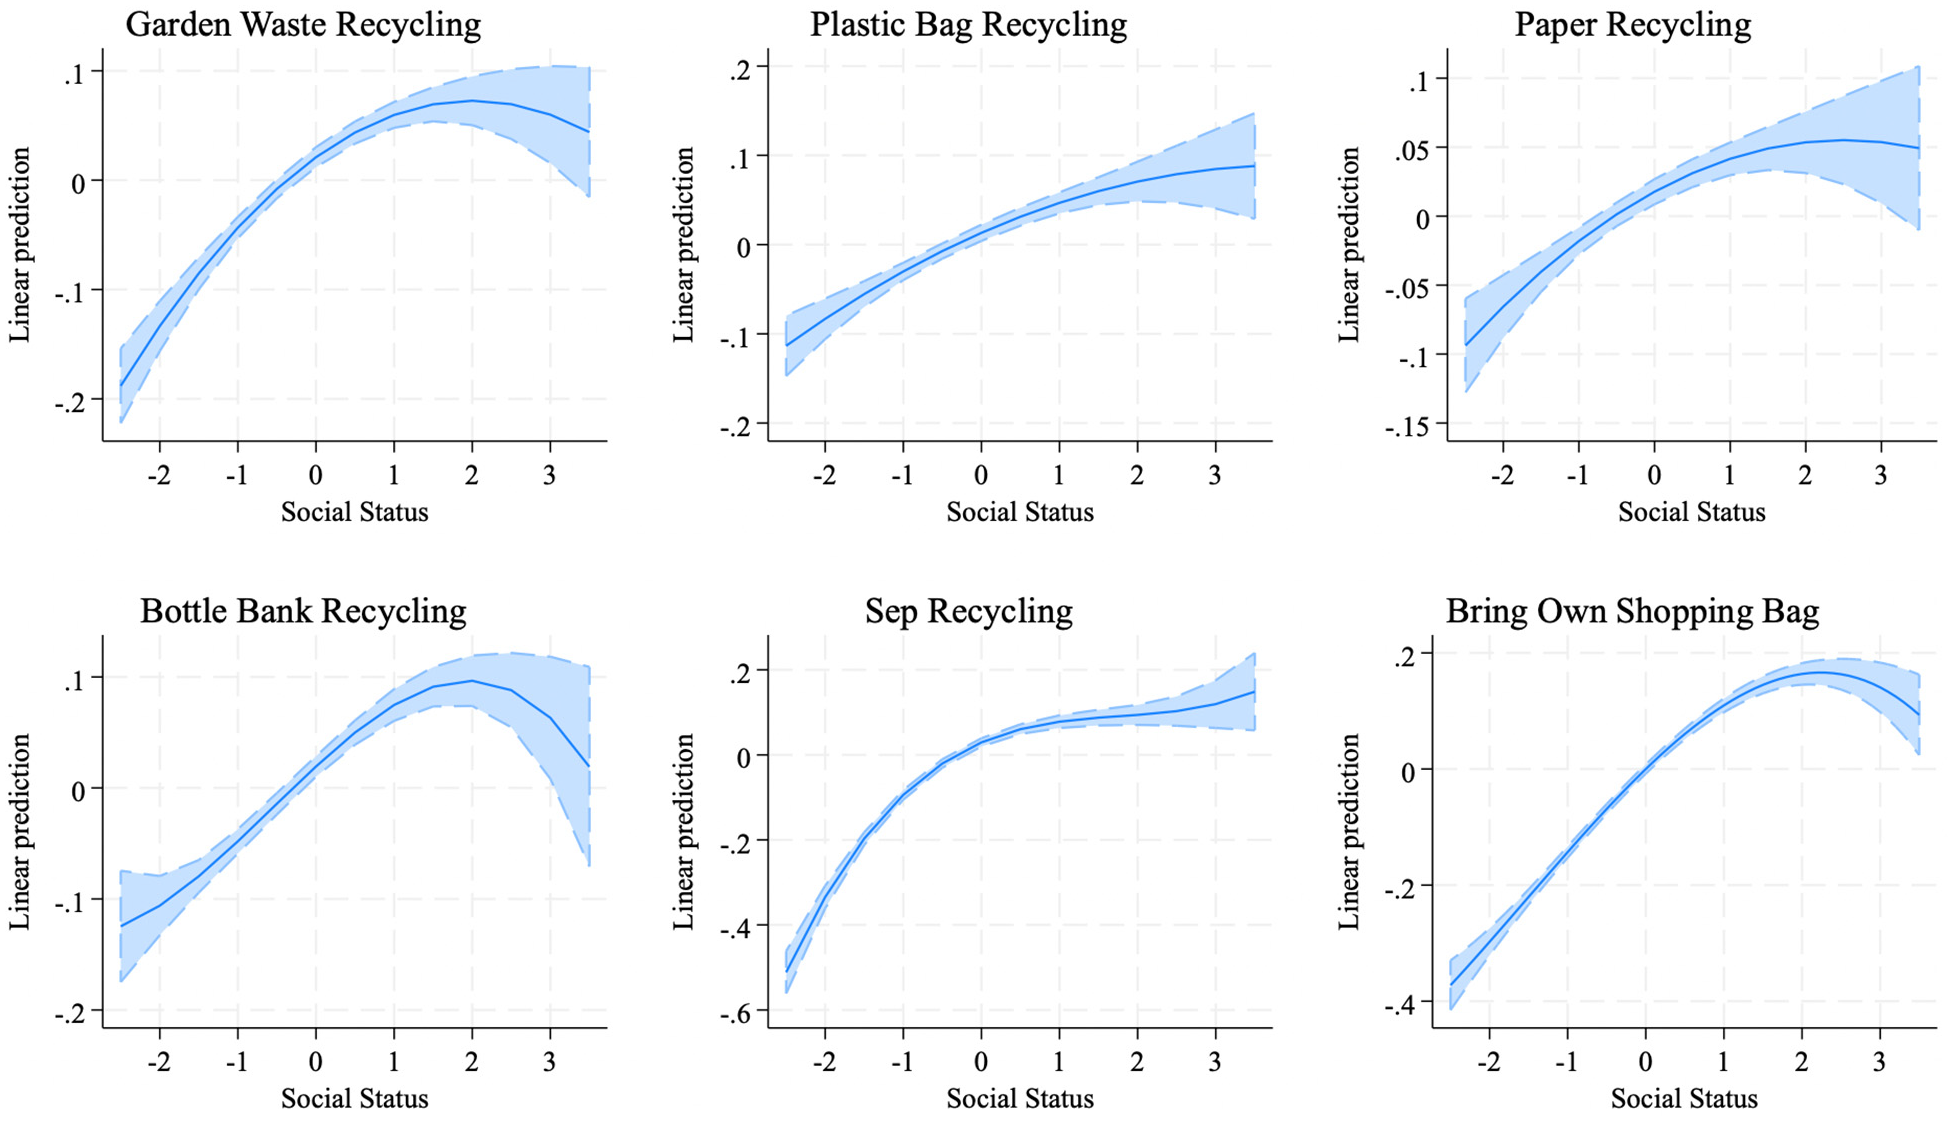
Relationship Between Social Status and Nonpecuniary Green Behaviors
Collectively, these results suggest that while financial capability facilitates green consumption, the link between social status and eco-friendly behaviors is not attributed solely to income. The parallel patterns in attitudes and nonpecuniary behaviors, coupled with distinct effects of objective and subjective status, indicate a complex interplay of factors. High-status individuals’ green choices likely result from a combination of increased resources, stronger environmental attitudes, and status-related motivations that vary across the social spectrum.
General Discussion
Our analysis of a large, nationally representative panel survey reveals a complex, S-shaped relationship between social status and green consumption, challenging existing linear and inverted U-shaped models. This pattern suggests unique constraints and motivations across different social strata, offering new insights into the drivers of environmentally conscious behavior.
Central to our findings is the observation that green consumption increases with social status, but this relationship is not uniform. Instead, it follows a cubic pattern, with the most significant growth occurring among individuals in the middle range of social status. Specifically, we identified a 0.36 standard deviation increase in green consumption between −1 and +1 standard deviations of social status. This increase becomes even more pronounced when comparing the lowest (−2 standard deviations) to the highest (+2 standard deviations) status levels, resulting in a 0.55 standard deviation difference. According to Gignac and Szodorai (2016), these can be considered large effects, underscoring the strong association between social status and green consumption.
The pattern of results suggests unique constraints and motivations at play across different social strata. For low-status individuals, limitations might stem from a lack of awareness about environmental issues, inadequate education on green consumption, or limited access to green products, potentially overriding nascent environmental attitudes (Gleim et al., 2013). While strong green attitudes may be present among high-status individuals, consumption patterns might be influenced by a saturation effect (with the easiest green choices already made) or a shift toward other forms of status signaling that compete with green consumption (Bellezza, 2023).
Our findings also challenge the assumption that financial capabilities alone drive the relationship between social status and green consumption. While income certainly facilitates green consumption, our analysis revealed that social status remains positively associated with green consumption even when income is controlled for. This suggests that factors beyond financial resources, such as green attitudes, are potential drivers. Supporting this, we found that high-status individuals consistently exhibited stronger environmental attitudes, indicating that genuine environmental values may underpin their green consumption choices (Gifford & Nilsson, 2014). This pattern aligns with research highlighting the importance of values in shaping proenvironmental actions (Steg & Vlek, 2009). Furthermore, elites’ greater propensity to engage in nonpecuniary green behaviors, such as recycling and using reusable bags, indicates a commitment to sustainability beyond what their financial resources simply allow.
Implications
Taken together, our findings have implications for both theory development and the design of effective sustainability interventions. First, our findings underscore the need for new theoretical frameworks that integrate both economic and sociopsychological perspectives to fully understand the complex drivers of green consumption at different levels of social status. Future research should investigate the interplay among environmental values, financial resources, social norms, and access to information in shaping green consumption patterns. Particularly crucial is understanding how environmental values interact with economic constraints and social pressures, especially given the observed diminishing returns in green consumption among the highest-status individuals. This plateau effect may result from competing lifestyle demands, ingrained consumption habits, or variations in exposure to environmental messaging among elite groups. Investigating these nuanced dynamics will be essential for developing more comprehensive models of sustainable consumer behavior and crafting targeted interventions that effectively promote green practices across diverse socioeconomic segments.
Second, our findings have significant implications for designing effective interventions. For high-status individuals, who are motivated, at least to some extent, by green attitudes, policymakers and managers should appeal to their green values and promote the environmental benefits of green products or services. These strategies may be more effective than emphasizing the exclusivity or luxury of green products or services (Gifford & Nilsson, 2014; Steg & Vlek, 2009). For low-status individuals, who are less likely to adopt green consumption, policymakers and managers may be able to increase their environmental awareness and concern through education and feedback 3 (Abrahamse et al., 2005). The large effect sizes observed suggest that even modest changes in social status or related factors could lead to significant increases in green consumption behaviors, both at the individual and societal levels.
Limitations and Future Directions
While our study provides valuable insights into the social status–green consumption relationship, several key limitations warrant consideration and suggest avenues for future research. A primary limitation of our study is the potential oversimplification of the mechanisms driving the observed relationships. While we focused on financial resources and green attitudes, alternative explanations remain unexplored. One particularly compelling alternative is the role of time scarcity among lower-status groups. Research indicates that individuals of lower socioeconomic status often face significant time constraints owing to multiple jobs, longer working hours, or more demanding domestic responsibilities (Chatzitheochari & Arber, 2012). These time pressures may inhibit engagement in time-intensive green behaviors, such as carefully sorting recyclables or researching and sourcing eco-friendly products, even when such actions do not require substantial financial investment. Moreover, the concept of scarcity extends beyond time to cognitive resources. As Mullainathan and Shafir (2013) argue, resource scarcity in general can diminish cognitive bandwidth for complex decision-making and problem-solving. This cognitive scarcity may further constrain individuals’ capacity to engage in sustainable behaviors, particularly those requiring careful planning or information processing.
Another limitation is that the correlational nature of our study design limits our ability to establish causality or rule out omitted variable bias. Factors such as personality traits, cultural values, or geographic location may affect both social status and green consumption behaviors (Dietz et al., 2005; Milfont et al., 2014). To help address this limitation, we conducted additional within-subject analyses, reported in SM-H, which revealed a significant, positive relationship between changes in social status and green consumption behaviors over time. While these findings help mitigate concerns about time-invariant alternative explanations, they do not eliminate the possibility of time-invariant confounds. Future research could employ experimental designs to manipulate social status or green attitudes, thereby more directly testing causal relationships.
A further limitation lies in our reliance on a single cultural context. Our UK-based study may not capture the full range of ways social status influences green consumption globally. The relationship between status and environmental behaviors likely varies across cultures with different norms, values, and economic structures (Hofstede, 1980; Stern et al., 1999). For example, in societies where environmental conservation is less integrated into status signaling, the patterns we observe might differ significantly. Future cross-cultural studies could reveal how the status–green consumption relationship varies across different societal contexts and potentially identify universal versus culture-specific aspects of this relationship.
Our reliance on self-reported measures also introduces potential social desirability biases. The infrequent measurement of certain green behaviors in the Understanding Society dataset could also reduce precision in analyzing specific items. Future studies should incorporate more objective measures (e.g., purchase data, energy bills) and expand the range of behaviors examined (Carfagna et al., 2014; Noppers et al., 2014).
Finally, our study’s focus on individual-level consumption behaviors may overlook important systemic factors influencing environmental impact. While higher-status individuals may engage in more visible green consumption, their overall lifestyles often have a larger carbon footprint due to factors like increased travel and larger living spaces (Otto et al., 2019; Wiedmann et al., 2020). Future research could take a more holistic approach, examining how status-related consumption patterns contribute to overall environmental impact. This could involve analyzing the total carbon footprint across status levels and investigating the potential for high-status individuals to offset their higher baseline emissions through green behaviors (Nielsen et al., 2021). Addressing these limitations in future research will not only enhance understanding of the complex social status–green consumption relationship but also provide more nuanced insights for policymakers and marketers aiming to promote sustainable behaviors across diverse socioeconomic segments and cultural contexts.
Supplemental Material
sj-docx-1-spp-10.1177_19485506241295406 – Supplemental material for Sustainability Across the Status Spectrum: The S-Shaped Relationship Between Social Status and Green Consumption
Supplemental material, sj-docx-1-spp-10.1177_19485506241295406 for Sustainability Across the Status Spectrum: The S-Shaped Relationship Between Social Status and Green Consumption by Joe J. Gladstone and Silvia Bellezza in Social Psychological and Personality Science
Footnotes
Appendix
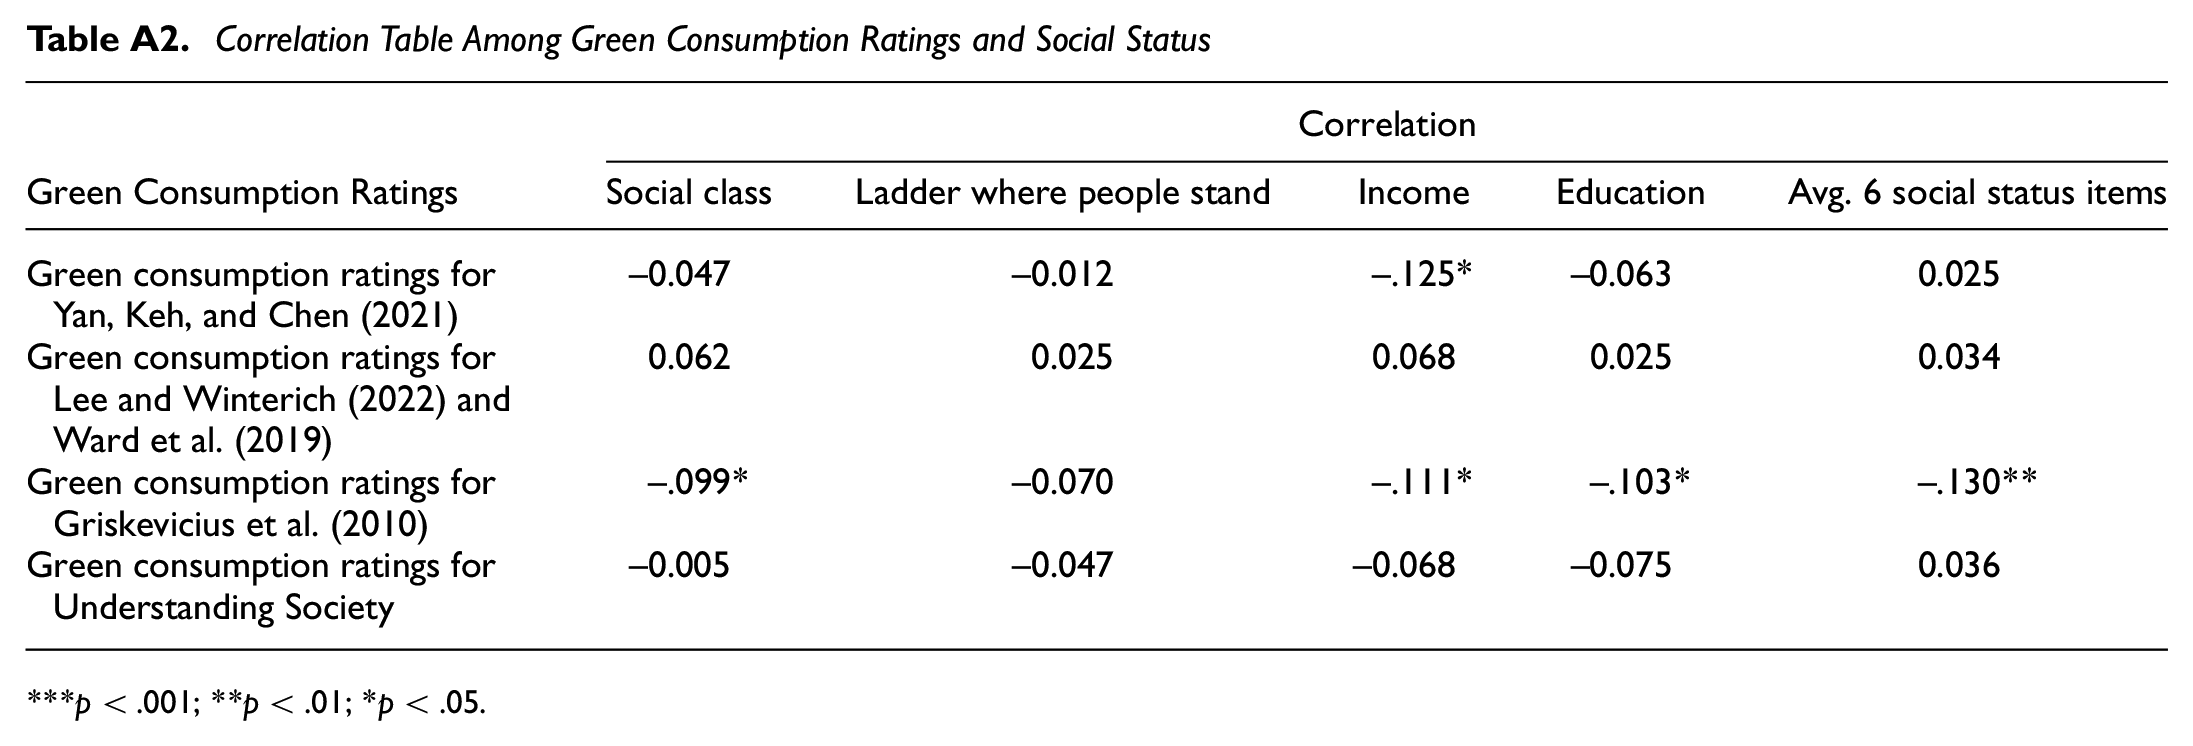
Correlation Table Among Green Consumption Ratings and Social Status
| Correlation | |||||
|---|---|---|---|---|---|
| Green Consumption Ratings | Social class | Ladder where people stand | Income | Education | Avg. 6 social status items |
| Green consumption ratings for Yan, Keh, and Chen (2021) | –0.047 | –0.012 | –.125* | –0.063 | 0.025 |
| Green consumption ratings for Lee and Winterich (2022) and Ward et al. (2019) | 0.062 | 0.025 | 0.068 | 0.025 | 0.034 |
| Green consumption ratings for Griskevicius et al. (2010) | –.099* | –0.070 | –.111* | –.103* | –.130** |
| Green consumption ratings for Understanding Society | –0.005 | –0.047 | –0.068 | –0.075 | 0.036 |
p < .001; **p < .01; *p < .05.
Handling Editor: Danny Osborne
Declaration of Conflicting Interests
The author(s) declared no potential conflicts of interest with respect to the research, authorship, and/or publication of this article.
Funding
The author(s) received no financial support for the research, authorship, and/or publication of this article.
Supplemental Material
The supplemental material is available in the online version of the article.
Notes
Author Biographies
References
Supplementary Material
Please find the following supplemental material available below.
For Open Access articles published under a Creative Commons License, all supplemental material carries the same license as the article it is associated with.
For non-Open Access articles published, all supplemental material carries a non-exclusive license, and permission requests for re-use of supplemental material or any part of supplemental material shall be sent directly to the copyright owner as specified in the copyright notice associated with the article.