
Abstract
Susceptibility weighted imaging (SWI) is an essential magnetic resonance imaging sequence in the assessment of acute ischemic stroke. In this article, we discuss the physics principals and clinical application of conventional SWI and multi-echo SWI sequences. We review the research evidence and practical approach of SWI in acute ischemic stroke by focusing on the detection and characterization of thromboembolism in the cerebral circulation. In addition, we discuss the role of SWI in the assessment of neuroparenchyma by depiction of asymmetric hypointense cortical veins in the ischemic territory (surrogate tissue perfusion), detection of existing microbleeds before stroke treatment and monitoring for hemorrhagic transformation post-treatment. In conclusion, the SWI sequence complements other parameters in the stroke magnetic resonance imaging protocol and understanding of the research evidence is vital for practising stroke neurologists and neuroradiologists.
Introduction
The fundamental physiological parameters in acute ischemic stroke imaging include assessment of the neuroparenchyma, vessel luminal patency and ischemic penumbra. Recent successes from mechanical stent retrieval trials further emphasized the need for patient selection based on time, penumbra and thrombus characterization.1–4 Computed tomography (CT) or magnetic resonance imaging (MRI) angiography are the workhorses for determining the site of vessel occlusion in acute ischemia.5, 6 Both techniques rely on either contrast and/or flow-related enhancement to detect the site of vessel occlusion denoting the location of the proximal end of the thromboembolus but may not fully characterize the distal extent. Susceptibility weighted imaging (SWI) allows direct visualization of the hypointense thomboembolus due to the high level of iron content in the thrombus and due to the increase in deoxyhemoglobin content causing marked T2* shortening in affected vessels downstream from the thrombus.7–10 The magnetic susceptibility effect from the thromboembolus increases its conspicuity and may aid in detecting smaller peripheral thromboemboli or fragmented thrombi distal to an occlusive thromboembolus, otherwise difficult to detect on conventional angiography techniques.7–10 Assessment of brain tissue perfusion in acute stroke is typically performed using either CT or MRI perfusion. SWI complements the existing perfusion technique by providing a rough estimate of tissue perfusion with the prominent hypointense cortical veins in the ischemic territory due to increased concentration of deoxyhemoglobin as seen in SWI. 11 SWI provides a quick snapshot of the state of the brain for existing microbleeds, which may help stratify the patient’s risk of hemorrhage prior to commencement of reperfusion treatment. Finally, SWI is an extremely sensitive technique for the detection of hemorrhagic transformation in the early period after onset of acute stroke. 12
Physics principles
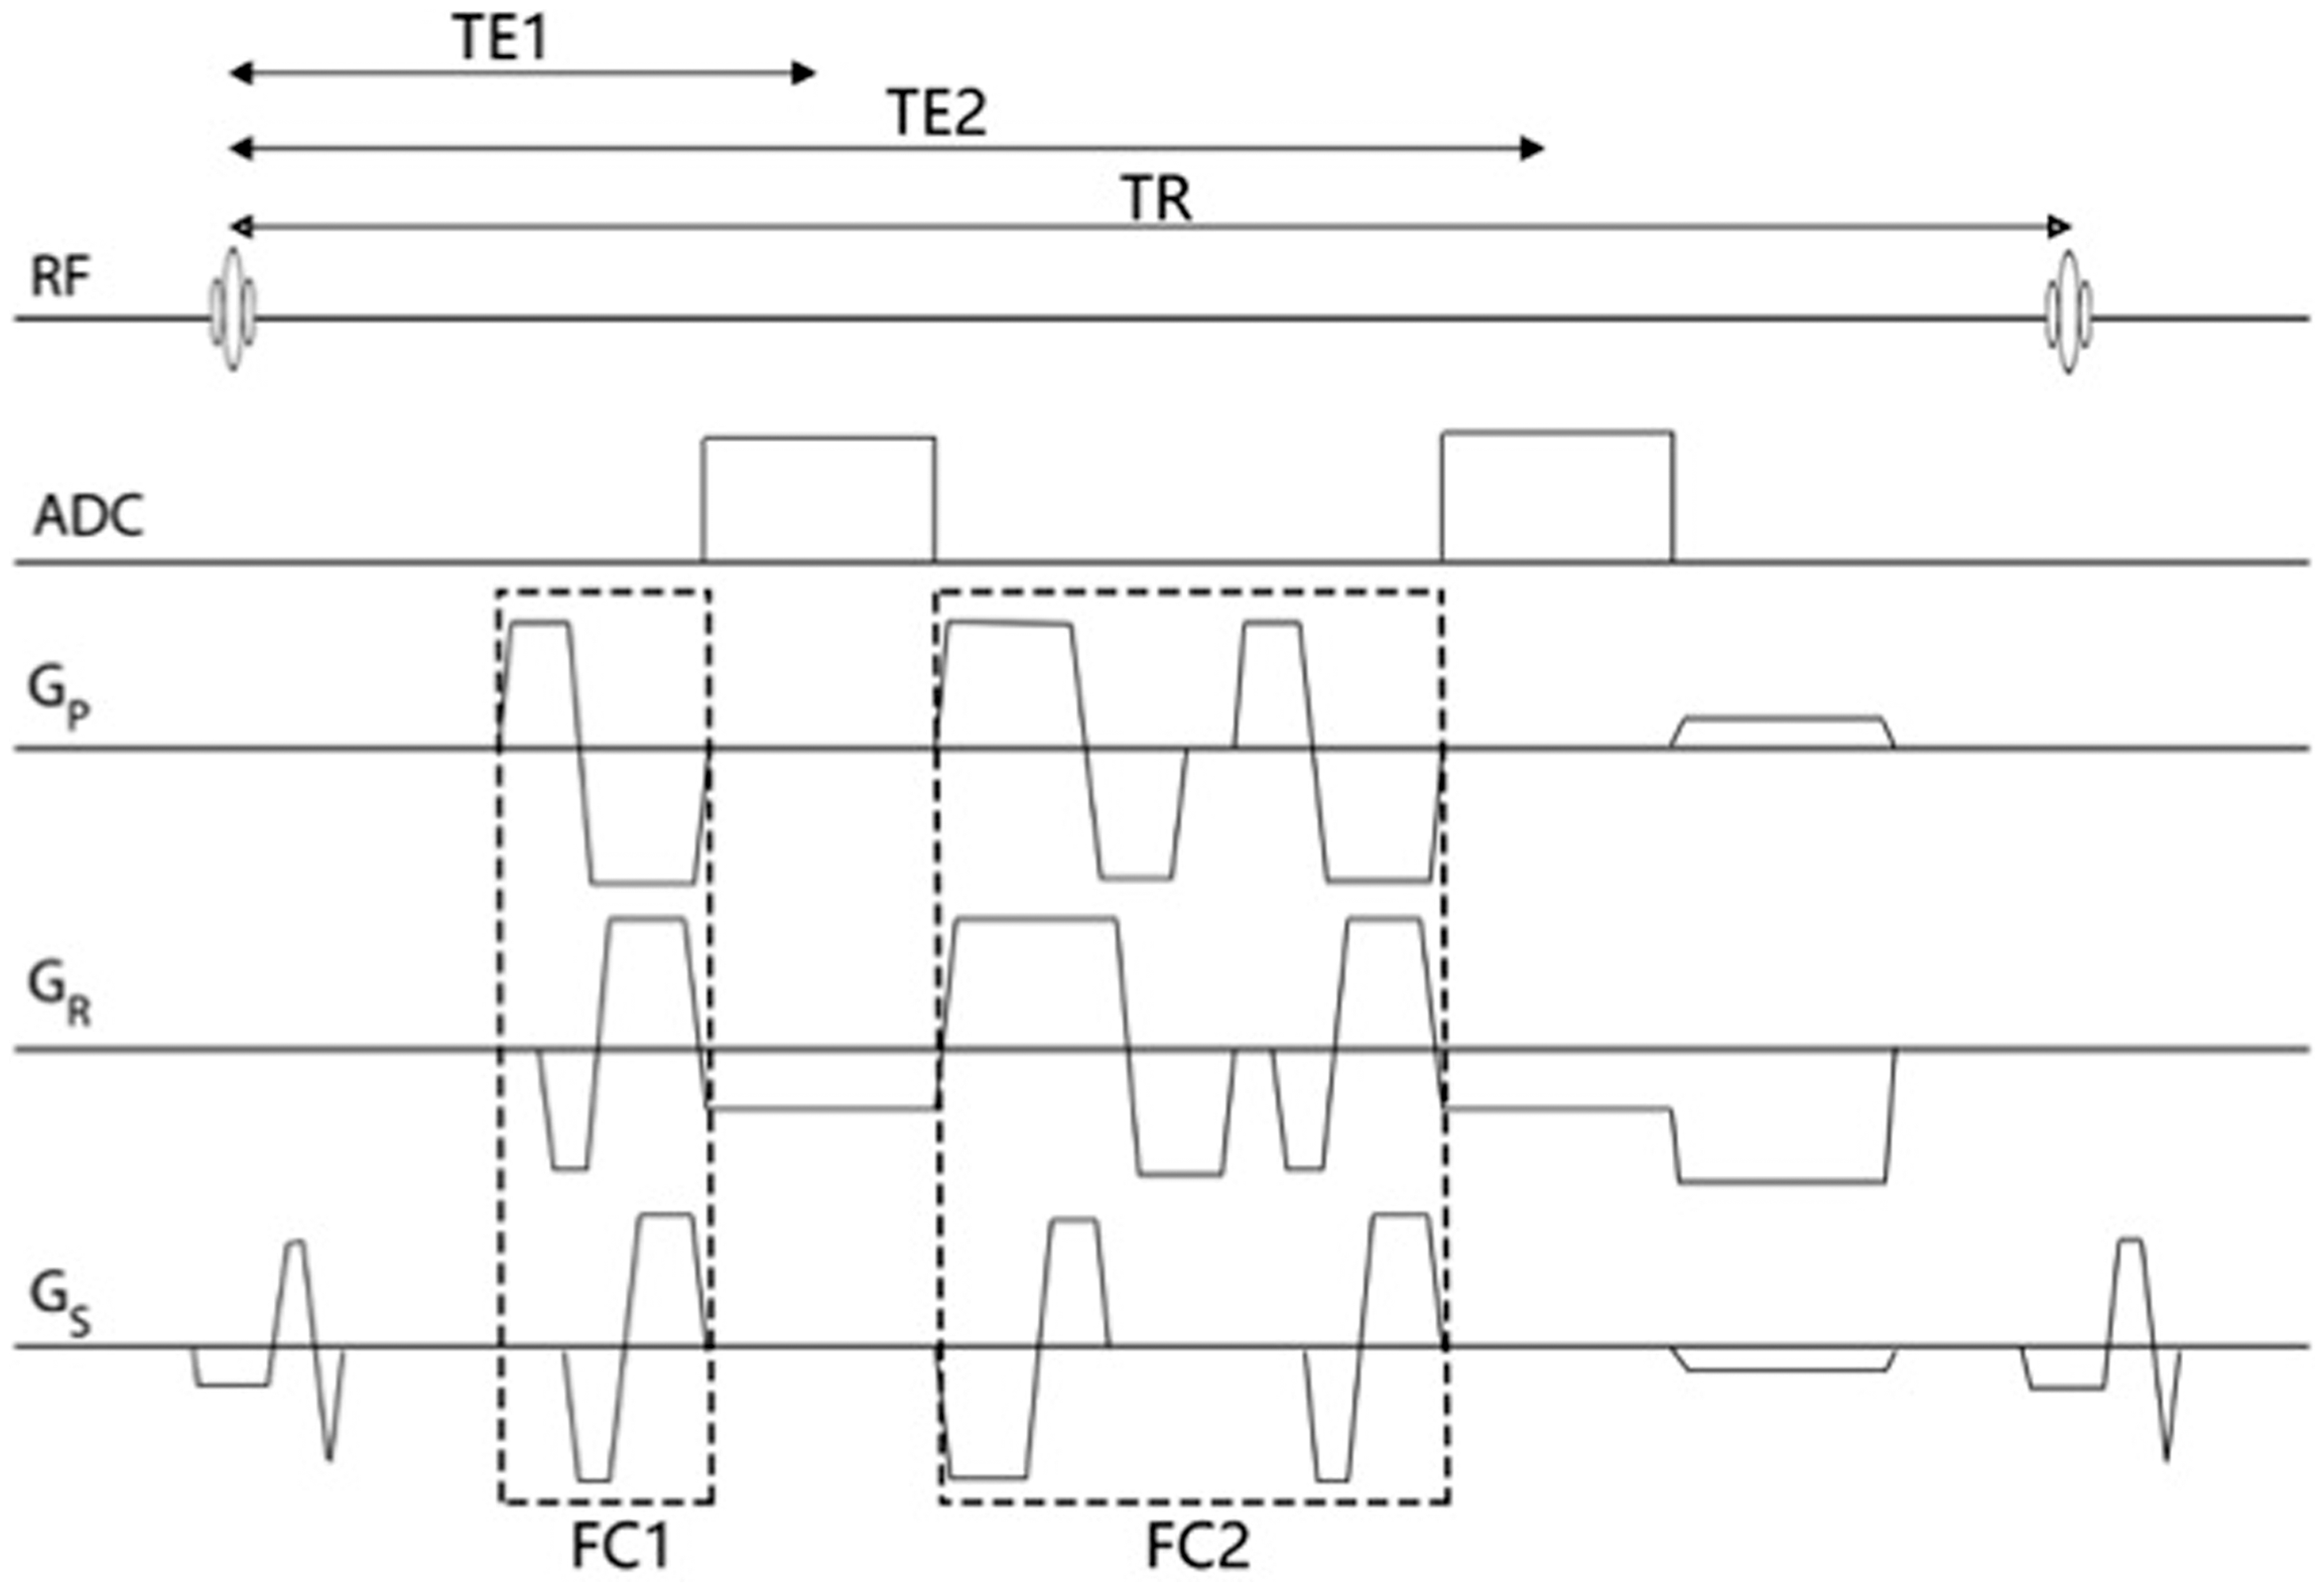
SWI is a three-dimensional fully velocity compensated gradient echo sequence with inherent high spatial resolution.13,14 The SWI sequence encompasses both magnitude and raw phase data to produce images with unique contrast resolution.13,14 The magnitude of the MRI signal is proportional to the net magnetization within a voxel. On the other hand, phase data corresponds to the angle of net transverse magnetization relative to a given axis within the voxel at a given point in time. Any material that is put into an external magnetic field will cause changes in the field and these disruptions of the fields are related to the tissue property known as magnetic susceptibility. Diamagnetic substances (calcification) weaken the external magnetic field resulting in a negative phase shift for a left handed system.13–16 Paramagnetic substances (deoxygenated hemoglobin and hemorrhage throughout stages of hemoglobin degradation) strengthen the external magnetic field producing a positive phase shift for a left handed system.13–16 The signal intensity of the phase image for diamagnetic and paramagnetic substances is specific to the MRI manufacturer. A left-handed MRI system (Siemens, Germany) displays diamagnetic calcium as low signal intensity and paramagnetic heme product as high signal intensity, while the opposite signal intensities apply for the right-handed MRI systems (GE/Philips, USA).13–16 A convenient method to differentiate diamagnetic and paramagnetic phase shift is to compare it to a normal venous structures like the superior sagittal sinus or superficial cortical veins, as paramagnetic substances will demonstrate the same signal shift as seen in normal veins. SWI images are constructed through a series of post-processing steps (Figure 1). First, a high pass filter is applied to the initial raw phase image, which removes unwanted bulk magnetic susceptibility to create a distinctive phase image. This filtered phase image is suitable for diagnostic interpretation and provides information on the structural diamagnetic or paramagnetic composition. From the filtered phase image a mask is generated and applied to the magnitude to accentuate further the contrast difference between structures with and without magnetic susceptibility creating the final SWI image. An additional minimum intensity projection (mIP) can be generated by projecting the minimum signal within a voxel over several slices, usually over four slices, which may aid detection of magnetic susceptible structure or pathology and continuity of the venous system. SWI data can also be acquired as multi-echo sequences (Figure 2). Adjustment of the echo times will ultimately affect the image contrast due to susceptibility effects. This concept can be used to provide contrast separation between the cerebral arteries and veins. Double-echo takes advantage of an additional echo time to allow simultaneous acquisition of magnetic resonance angiography (MRA) and magnetic resonance venography data with the initial shorter time to echo (TE) SWI providing MRA data and the second longer TE SWI providing the venography data.
17
The advantages of the multi-echo sequence include: acquisition of an additional short echo dataset with no increase in scan time; elimination of motion-induced misregistration, which is critical for depicting the site of arterial occlusion on MRA; better differentiation between veins and thromboembolus on the SWI and an MRA of the major arteries (Figure 3).
17
A newer form of processing the SWI phase data can be used to create susceptibility weighted imaging and mapping (SWIM) a form of quantitative susceptibility imaging.
18
The SWIM images in acute stroke allow accurate depiction of the thromboembolus, quantitative analysis of oxygen saturation in the form of asymmetric hypointensity of cortical veins, screening for pre-existing microbleeds and monitoring for hemorrhagic transformation (Figure 3).
19
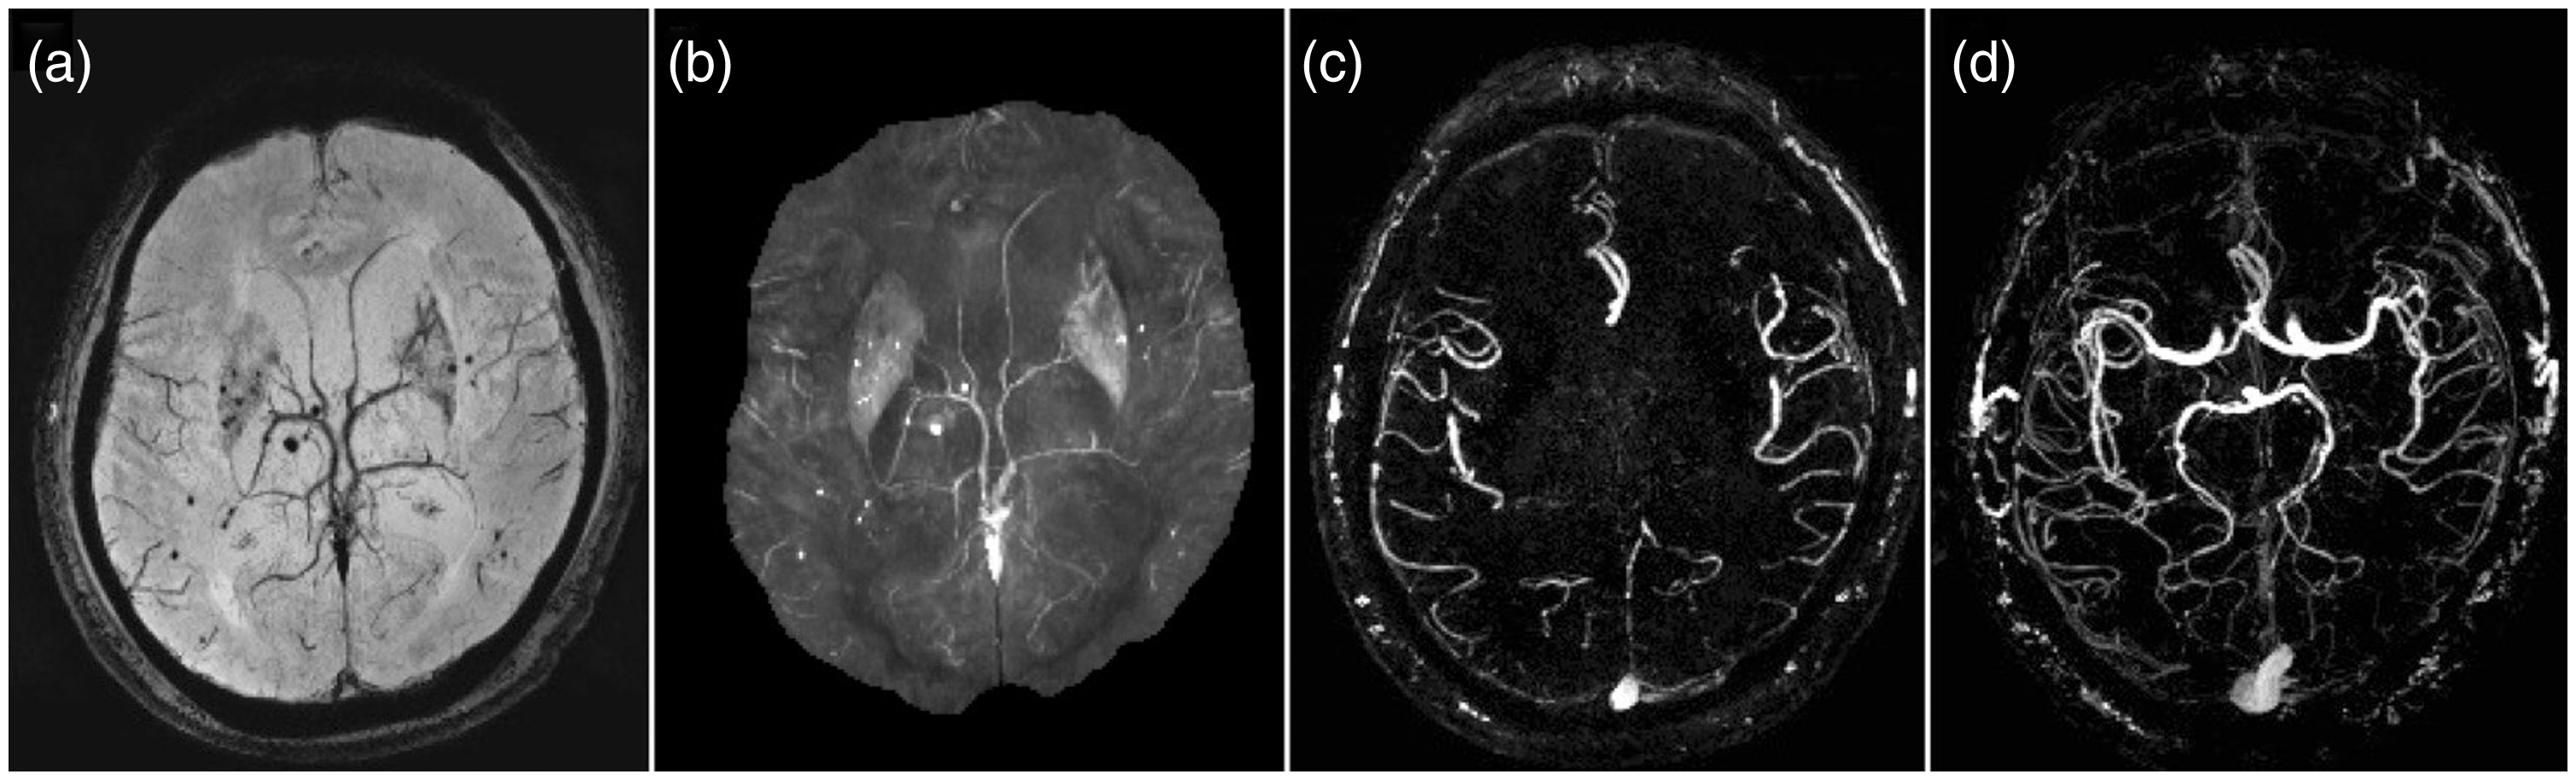
SWI sequence generates two sets of images: raw phase image (a) and magnitude image (c). The raw phase image contains background unwanted low frequency information and requires further high-pass filtering to produce a filtered phase image (b) that is of diagnostic value. The filtered phase image is then converted into a phase mask and combined with the magnitude image to form the final SWI image (d). An additional minimum intensity projection (mIP) image (e) is created by projecting the minimum signal over several slices, usually over four slices. SWI: susceptibility weighted imaging. Double echo gradient echo sequence for SWI. Each echo was fully flow-compensated by nulling the zeroth and first order gradient moment independently. FC1 and FC2 were bipolar gradient lobes for flow compensation for the first and second echo, respectively. One can also set different sampling bandwidth for each echo with this sequence. Gp, Gr and Gs represent the phase-encoding gradient, read-out gradient and slice-selection gradient, respectively. SWI: susceptibility weighted imaging. Strategically acquired gradient echo (STAGE) imaging on a Siemens Trio 3T scanner. Three scans were acquired in 11 minutes covering the whole brain with a resolution of 0.82 × 0.82 × 2.0 mm3 and 56 slices. The first two scans were from a fully flow compensated double echo SWI sequence with a 6° and 24° flip angle, respectively. The two echo times were 7.5 ms and 17.5 ms. SWI (a), susceptibility weighted imaging and mapping (b) and magnetic resonance angiography (c) images, projected over 16 mm, exquisitely depict existing microbleeds as well as the cerebral vasculature. The third scan was an interleaved flow rephased and flow dephased single echo (13 ms) SWI sequence to create a simultaneously acquired MRAV (d), projected over 64 mm, with the background brain tissue removed. Images courtesy of Dr Shuang Xia, Tianjin Number 1 Central Hospital and Yongsheng Chen, Wayne State University. SWI: susceptibility weighted imaging; MRAV: MR angiography and venography.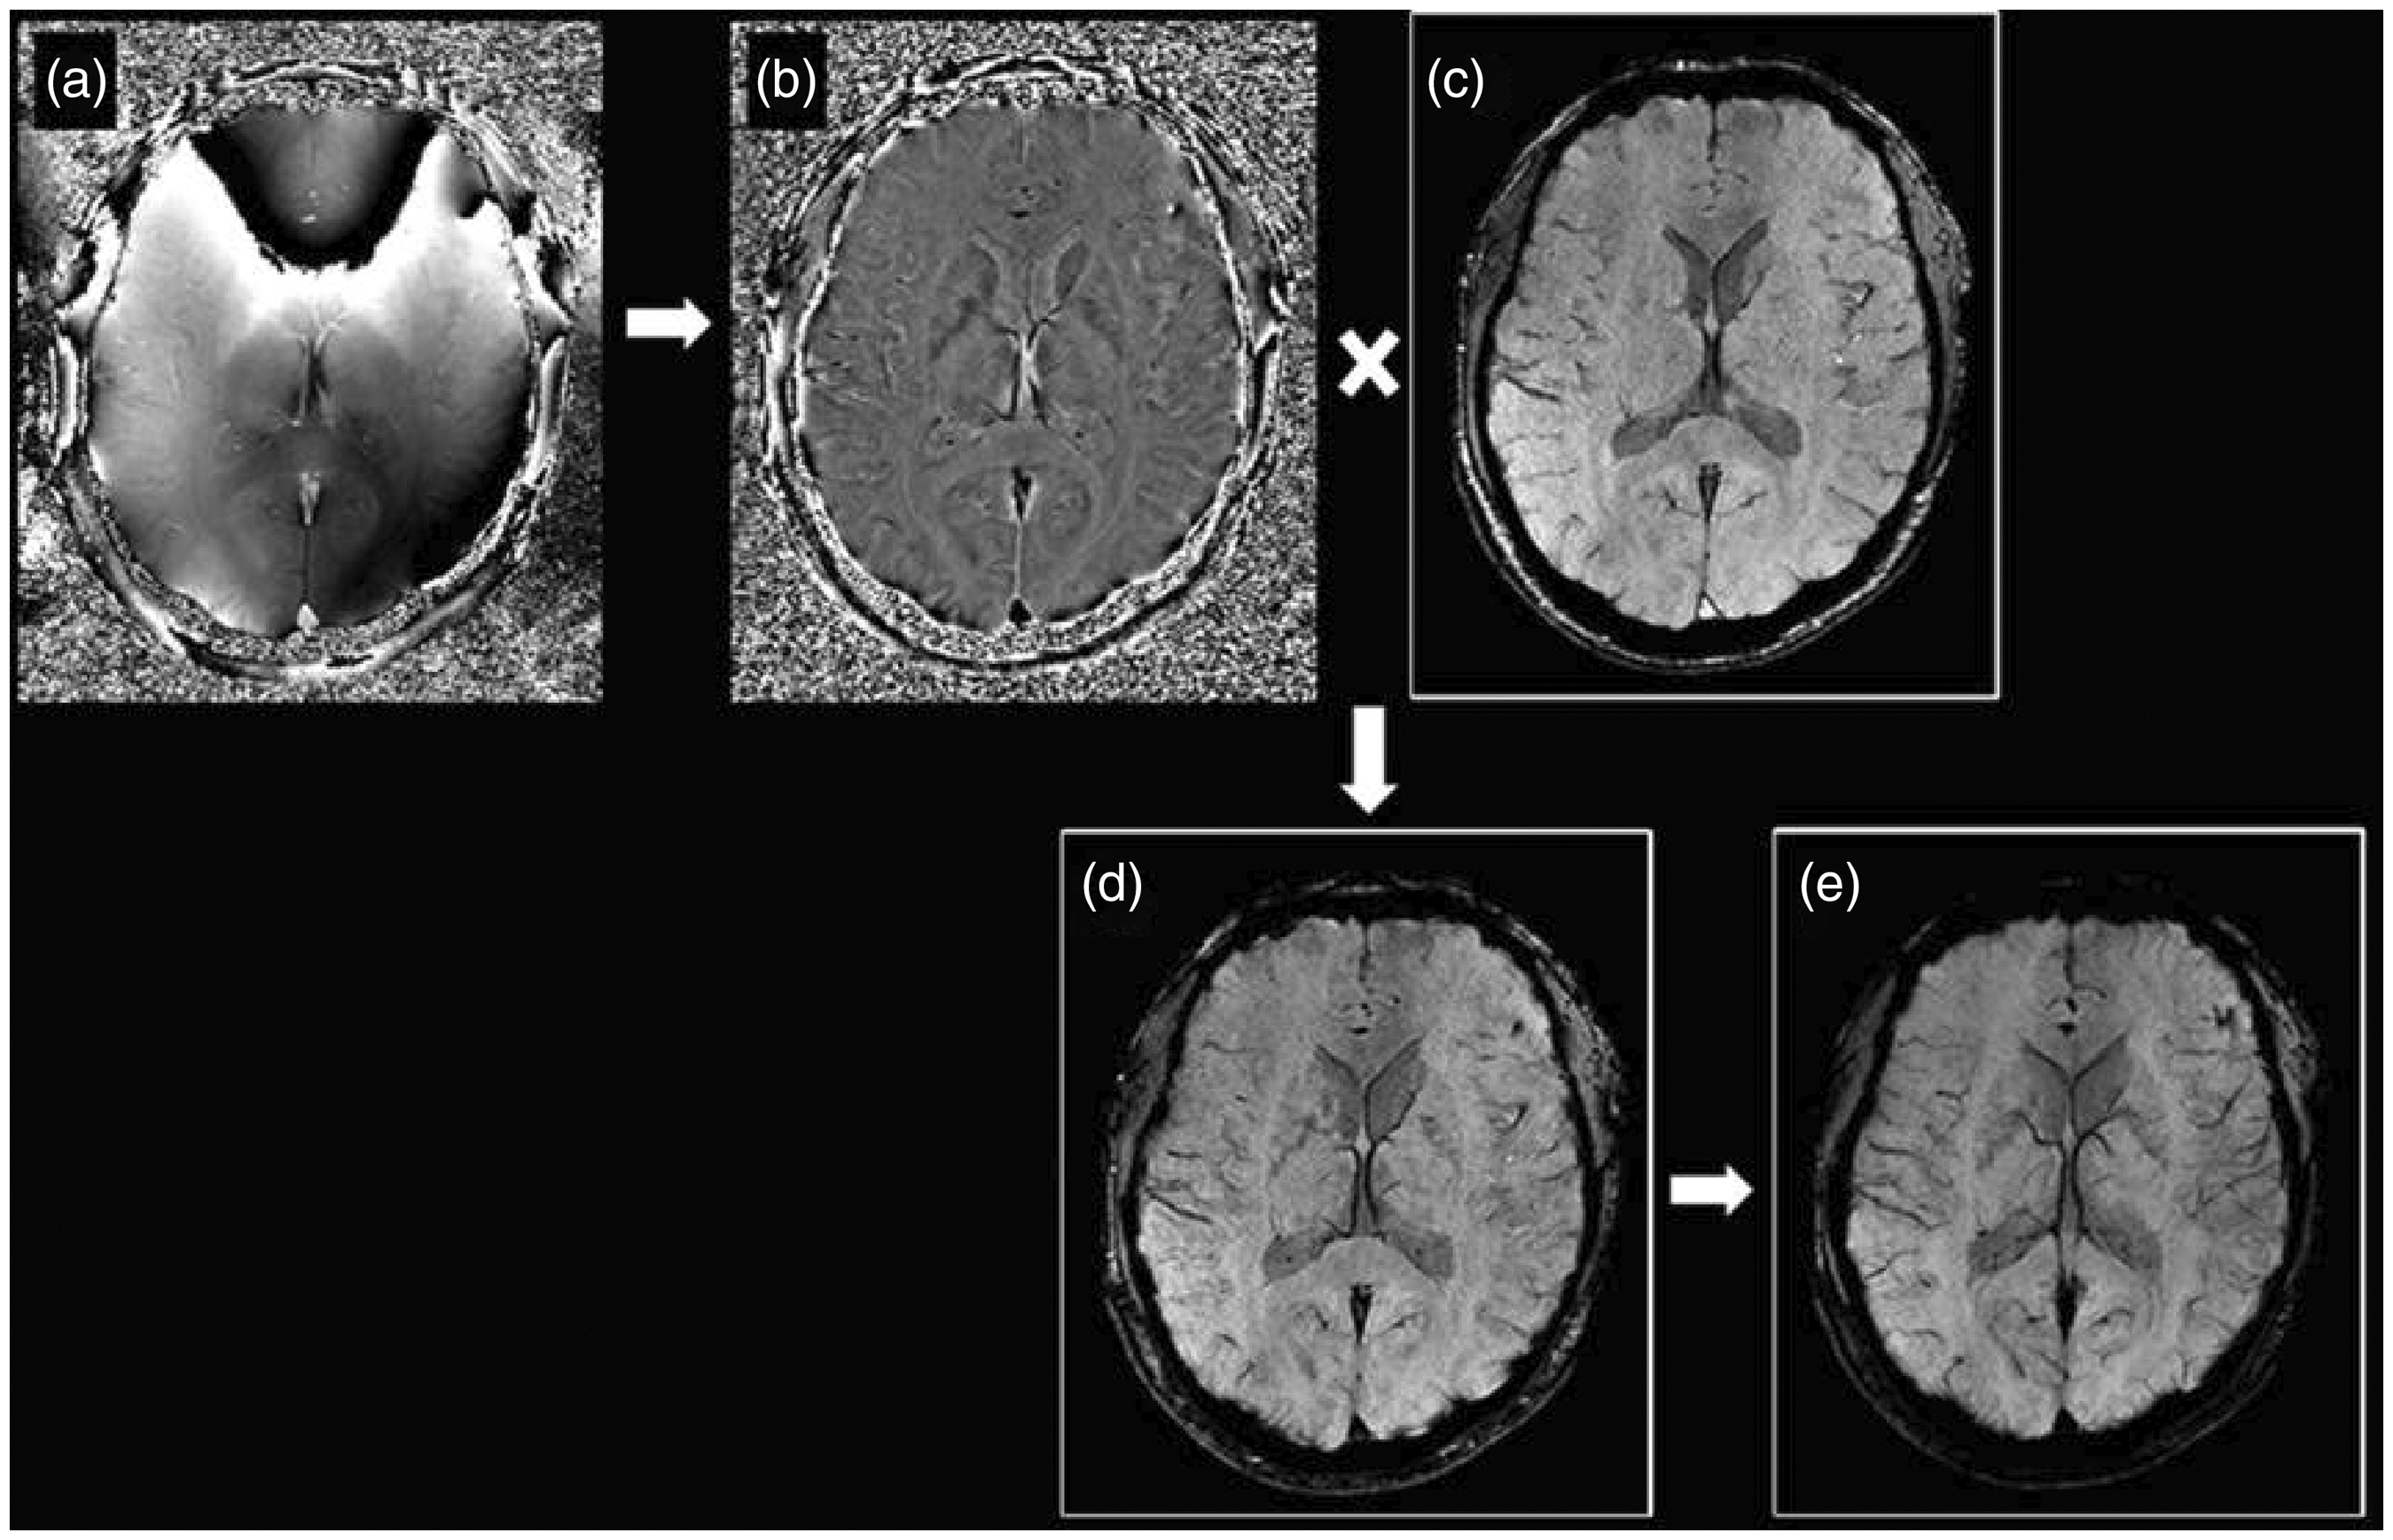
Susceptibility vessel sign
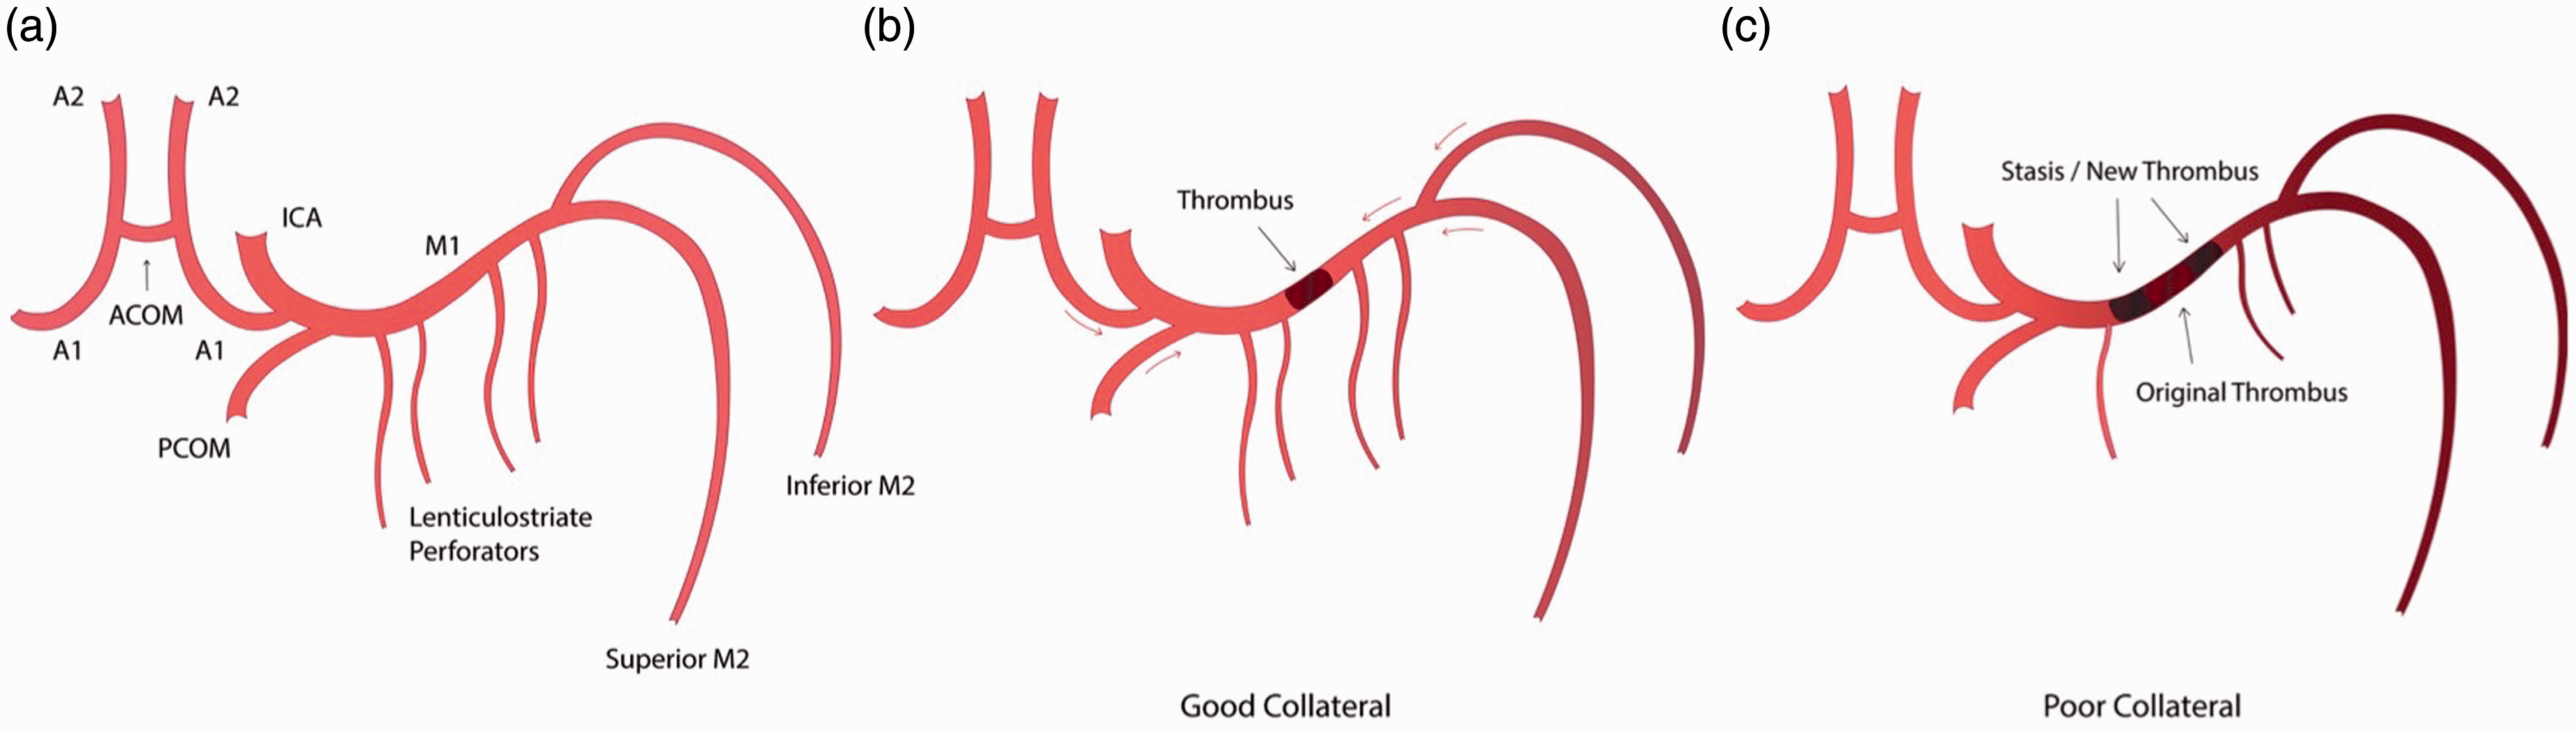
In the pioneer era of CT, both the hyperdense middle cerebral artery (MCA) and insular dot signs have been shown to depict the presence of thromboembolus; however, the reliability of these signs is dependent on the Hounsfield attenuation of the thromboembolus which is influenced by the fibrin content.20–23 Although both T2* gradient echo (GRE) and SWI sequences are suitable for detecting thromboembolus, SWI has far superior sensitivity and better contrast resolution for the detection of thromboembolus in both the anterior (Figure 4) and posterior (Figure 5) circulation.7,8,10 Magnetic susceptibility of a thromboembolus is related to the histopathological composition and the varying components of erythrocyte, platelet, fibrin, atheromatous gruel (cholesterol, cholesterol clefts, foam cells or fibrous caps).24–26 Erythrocyte-rich thromboembolus is formed by the activation of the coagulation cascade in areas of static blood flow such as the left atrium in atrial fibrillation. On the other hand, fibrin/platelet-rich thromboembolus and atheromatous gruel are likely to originate from vulnerable atherosclerotic plaques. Erythrocyte-rich thromboembolus contains higher levels of paramagnetic content including deoxyhemoglobin, methemoglobin and oxidized ferric iron (Fe3+). However, the actual observed thromboembolus may be further influenced by local factors such as stasis of blood flow proximal or distal to the thromboembolus or in the setting of poor collateral status there may even be new formation of thrombus (Figure 6).
27
The overall susceptibility effect from the original thromboembolus and local paramagnetic susceptibility effect is known as the susceptibility vessel sign. On SWI and GRE T2* sequences it is defined as the presence of SWI or GRE T2* hypointensity within the lumen of the intracranial artery in which the diameter of the thrombosed vessel exceeds the diameter of the contralateral normal vessel.8,10 The blooming effect caused by the thrombus is exaggerated on SWI and hence the size of thrombus is always greater than the actual lumen size.8,10 Furthermore, prospective imaging identification of thromboembolus subtypes can be beneficial as erythrocyte-rich thromboembolus is more sensitive to intravenous tissue plasminogen activator (IV-tPA) treatment and is associated with a higher success rate of endovascular recanalization.24–26,28 The hyperdense vessel sign on CT and blooming artifact on GRE T2* MRI sequence are both significantly associated with erythrocyte-rich thromboembolus, and future application of SWI and SWIM in the imaging of a thromboembolus may provide a method of accurate quantification of mean susceptibility value and provide a better clue to the histopathological subtypes.24–26,28
A 52-year-old woman with acute left MCA stroke. SWI image (a) and phase image (b) demonstrates a thrombus in the superior M2 division of the left MCA, which is a CT equivalent of a MCA ‘dot sign’. DWI (c) shows acute left MCA territory infarct. Time-of-flight MRA confirms abrupt vessel occlusion of the distal superior M2 division of the left MCA. MCA: middle cerebral artery; SWI: susceptibility weighted imaging; CT: computed tomography; DWI: diffusion-weighted imaging; MRA: magnetic resonance angiography. A 64-year-old man presented with left PCA stroke. SWI image (a) and phase image (b) show a thrombus (arrow) in the P2 segment of the left PCA. Corresponding time-of-flight MRA (c) confirms abrupt vessel occlusion of the P2 segment of the left PCA. DWI (d) shows acute left PCA territory infarct. PCA: posterior cerebral artery; SWI: susceptibility weighted imaging; MRA: magnetic resonance angiography; DWI: diffusion-weighted imaging. (a) Labeled anatomical illustration of the anterior circulation of the Circle of Willis. (b) and (c) Collateral circulation as a modifiable variable in determining the final length of thromboembolus. (b) A short ‘original’ MCA thromboembolus in a patient with good antegrade and retrograde collateral circulation (red arrows) preventing blood stasis. (c) Conversely, in a patient with poor collateral circulation there is blood stasis on either side of the ‘original' thromboembolus promoting new thrombus formation. MCA: middle cerebral artery.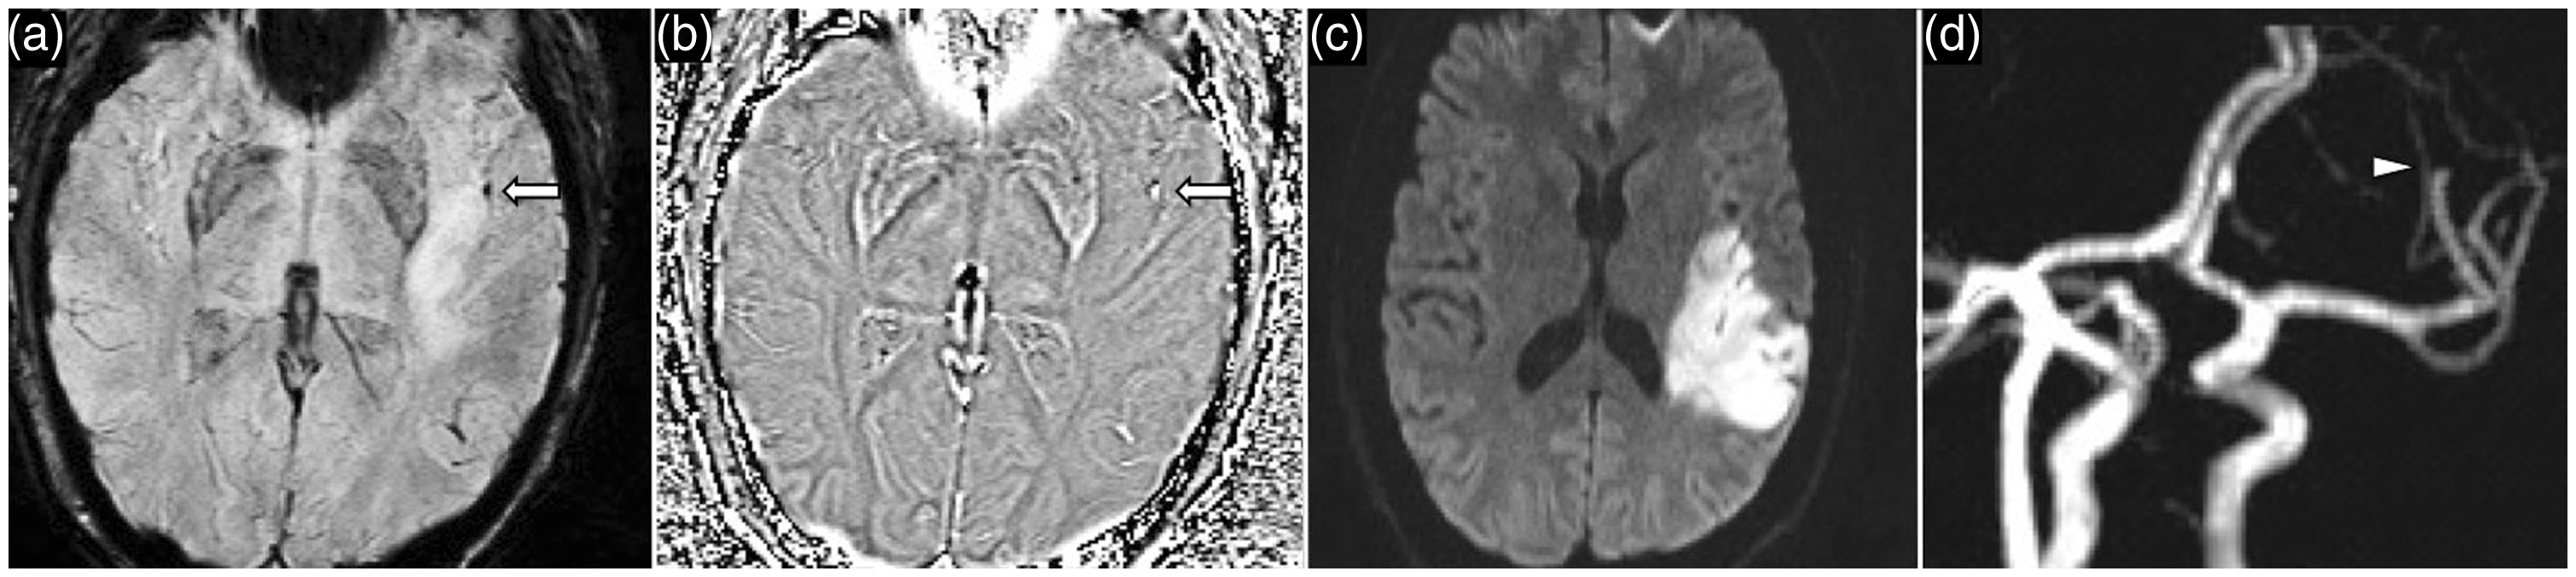

In acute ischemic stroke, the absence of or negative susceptibility vessel sign has been described on GRE MRI as having a high negative predictive value for the presence of intracranial atherosclerotic stenosis in patients with acute ischemic stroke from MCA steno-occlusive lesions.29,30 However, the negative susceptibility sign is not entirely applicable to the SWI sequence as susceptibility blooming from vessel wall calcification is a potential confounder especially in patients with calcified intracranial vessels. The presence of calcified atheroma plaques on SWI may result in aliasing artefact and making it difficult to differentiate between steno-occlusive lesions or thromboembolus. Reference to a CT head scan may be required for clarification. In the future, susceptibility mapping of the SWI phase data can be used to differentiate calcifications from thrombosis.
Thrombus morphology
The length of the thromboembolus in acute ischemic stroke is crucial to the success rate of reperfusion and clinical outcomes. CT angiogram studies have shown that the proximal location of the thromboembolus and length of a thrombus greater than 8–15 mm is a poor predictor of reperfusion with IV-tPA.31,32 Although both MRA and SWI have similar success rates at detecting the site of occlusion within the MCA, SWI is more effective at locating the distal end of the thromboembolus (Figure 7).
33
While thrombus length affects outcomes with tPA therapy, it does not significantly affect the success of SWI guided mechanical reperfusion strategies.
33
Recent evidence suggests that native vessel morphology impacts on the success rate of mechanical reperfusion strategy. Higher angulation between internal carotid artery (ICA) to M1 MCA and M1 to M2 MCA vessels have been shown to be associated with markedly lower rates of mechanical recanalization.
34
It is hypothesized that curved vessel walls may increase wall friction, and vessel curvature creates an in-folding effect at the proximal and distal vessel, which may impede the passage of the stent retrieval device.
34
SWI is advantageous over conventional angiography techniques in depicting native vessel morphology, as the presence of thomboembolus on SWI would naturally outline the vessel, which can provide approximate estimation of vessel angulation. However, dynamic CT angiography techniques such as CT perfusion (source images) and time-resolved CT angiogram can often generate good estimates of occlusion length of the thromboembolus by reviewing the late phase images where backfilling of the vessel distal to the occlusion by collateral vessels may be apparent.35,36 Assessment of the intracranial ICA segments on SWI is limited by susceptibility artifact from air–bone interface. On the other hand, SWI is well suited for evaluation of the intracranial vertebrobasilar circulation. Vertebrobasilar artery dissection is a frequent source of distal embolization and a common mechanism of cerebellar infarctions especially in young adults.
37
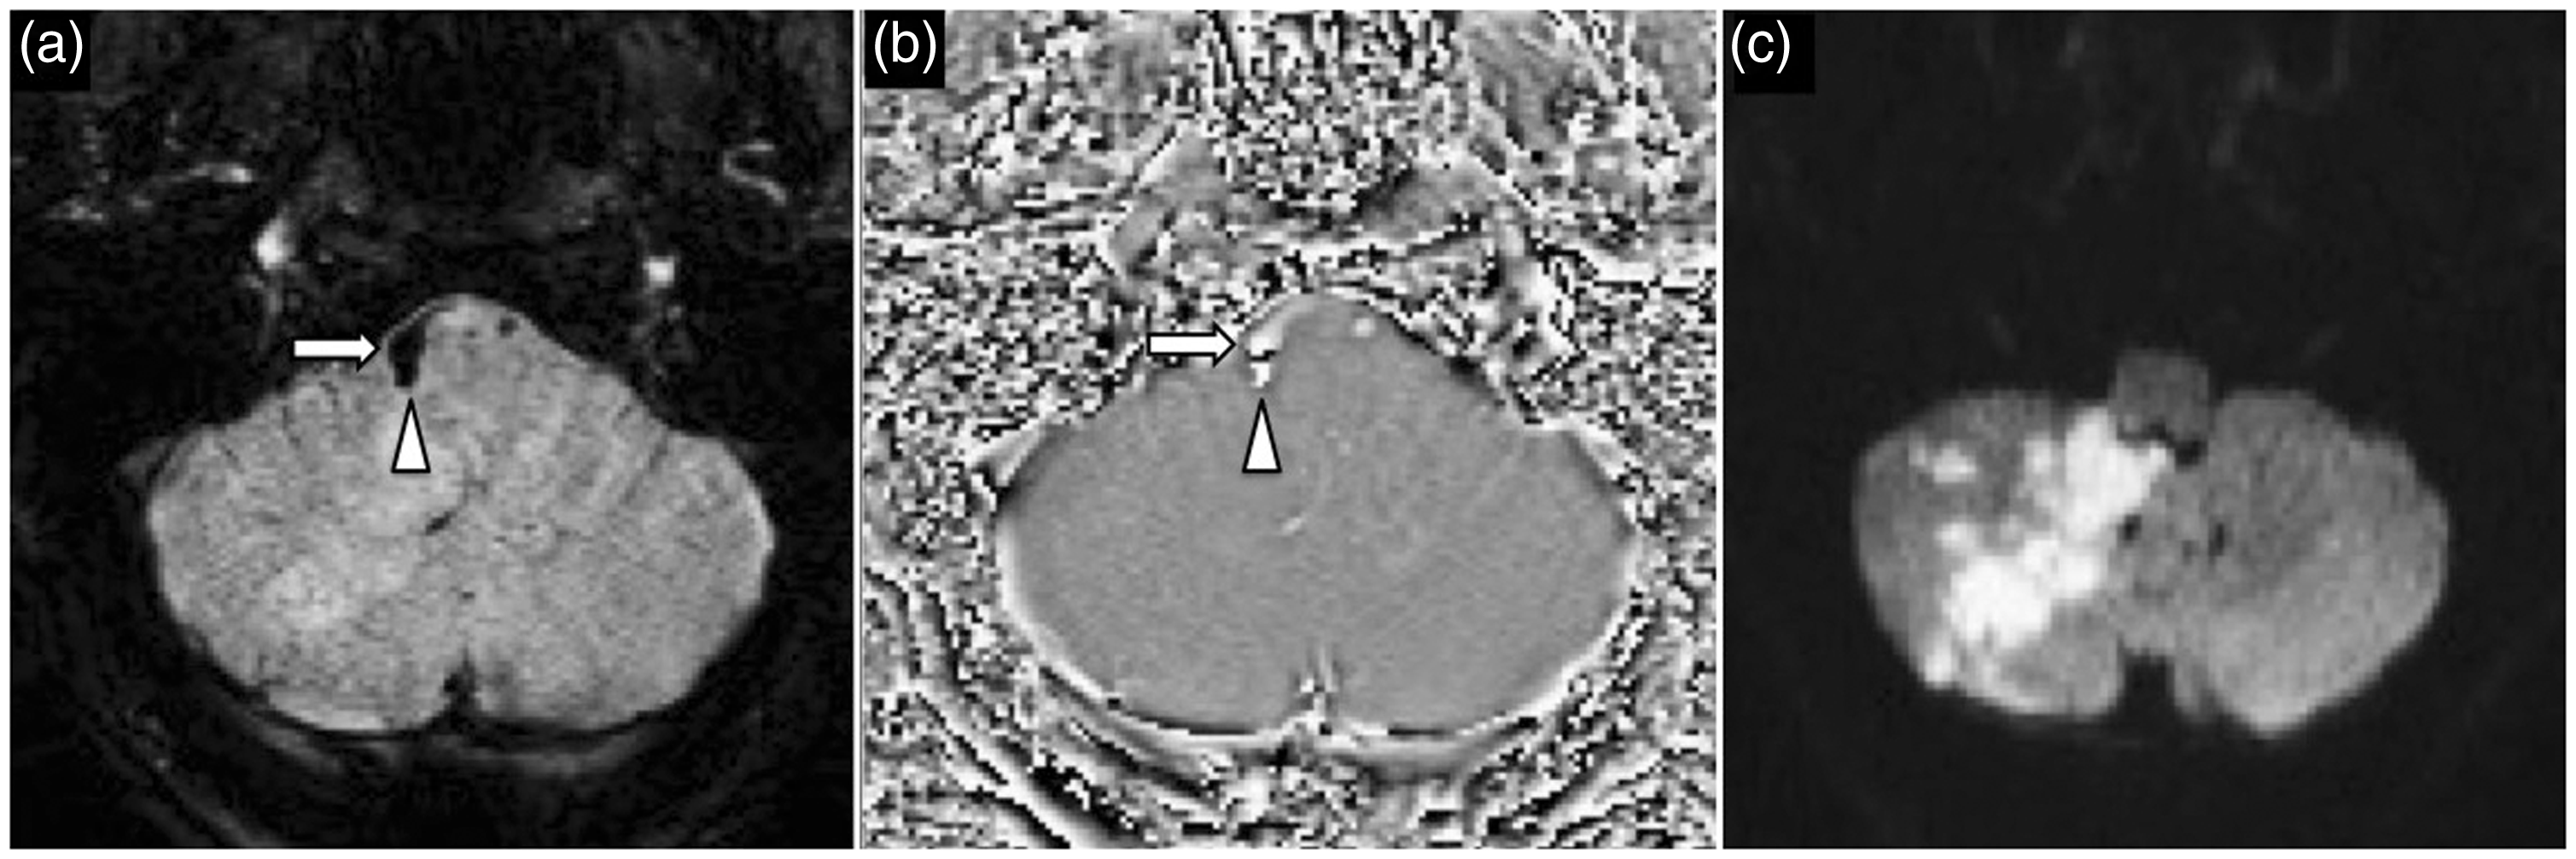
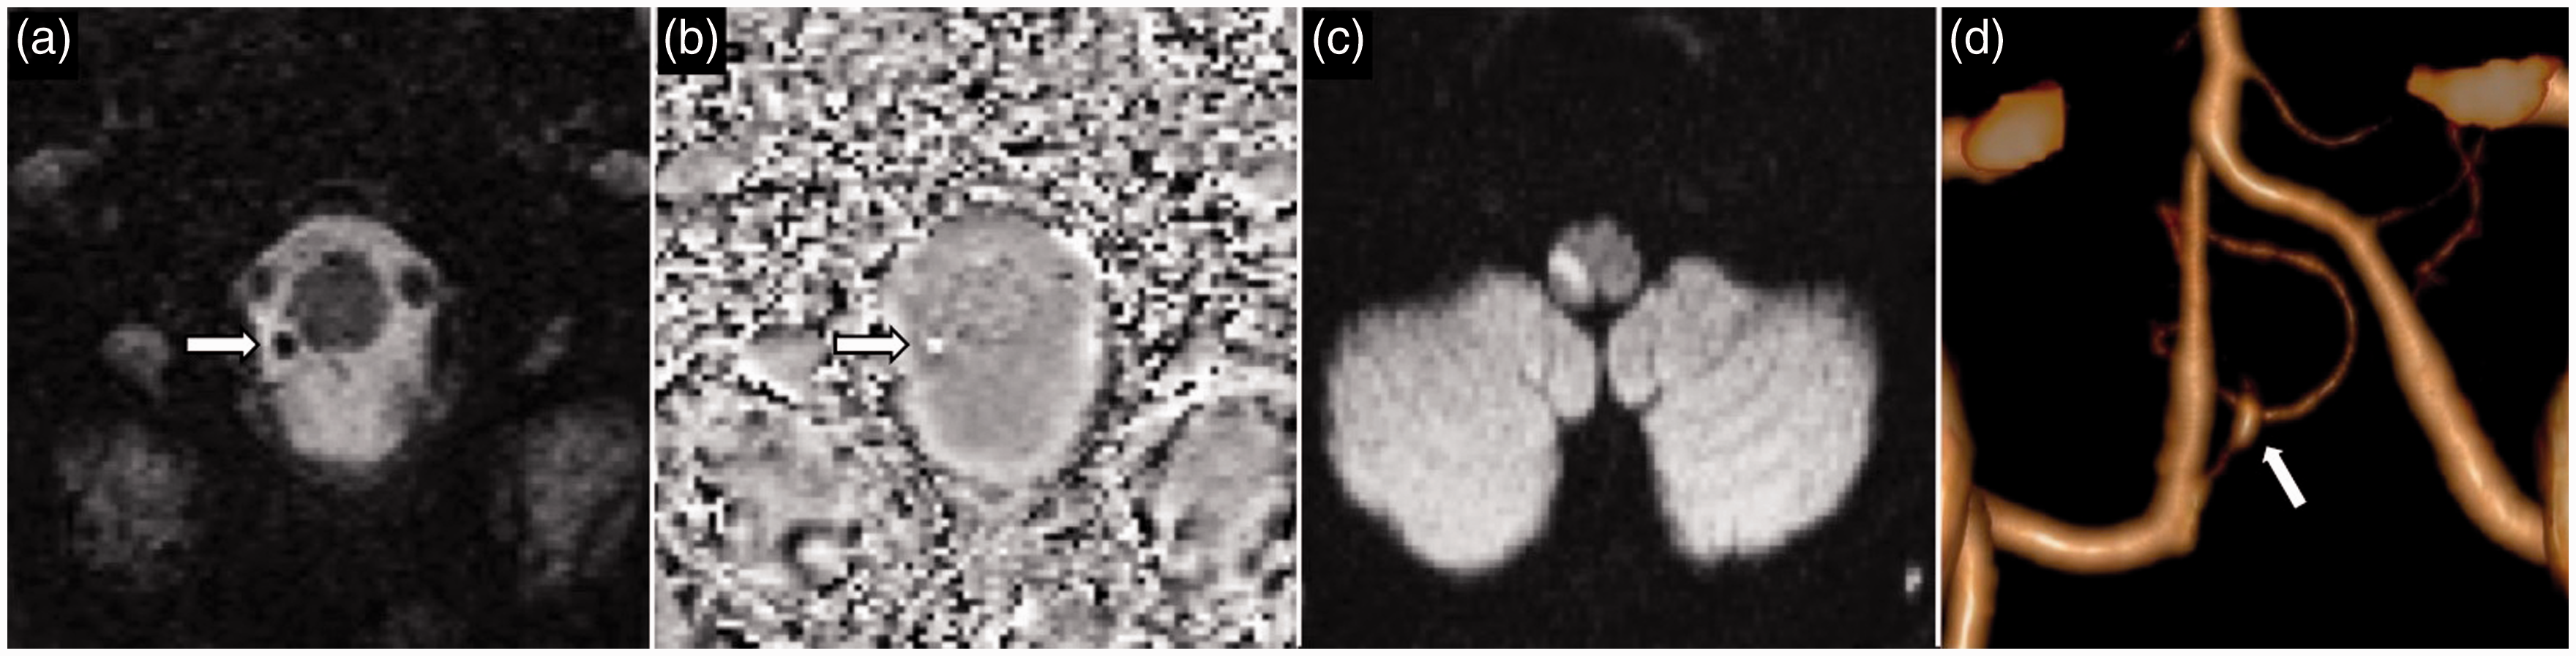
SWI is particularly sensitive for the depiction of intramural hematoma from the intracranial vertebral artery or the smaller calibre posterior inferior cerebellar artery (PICA) dissection (Figures 8 and 9).
38
Interpretation of the SWI phase image is critical, as both intramural hematoma and atheroma calcifications appear hypointense on SWI. Intramural hematoma is typically crescentic in morphology and shows positive phase shift due to the presence of hemoglobin degradation product (hyperintense on left-handed MRI system). On the other hand, atheroma calcifications are linear or concentric or eccentric (hypointense on left-handed MRI system). Similarly, SWIM can also assist in differentiating the phase shift between calcification and hemoglobin degradation products.
A 58-year-old man found collapsed at home. SWI images (a–c) and phase images (d–f) demonstrates thromboemboli occluding the A1, A2 and A3 (pericallosal) segments of the right anterior cerebral artery (ACA) (arrows) and A2 segment of the left ACA (arrowheads). Sagittal reformatted SWI image (g) clearly depicts the length of the A1 to A3 right ACA thromboembolus. Time-of-flight MRA shows abrupt cut-off of the right A1 ACA and left A2 ACA without appreciation of the distal propagation of the thromboembolus. DWI (i) shows acute bilateral ACA territory infarcts more extensive on the right. SWI: susceptibility weighted imaging; MRA: magnetic resonance angiography; DWI; diffusion-weighted imaging. A 52-year-old woman presented with headache and ataxia following recent chiropractic neck manipulation. SWI image (a) and phase image (b) demonstrate right vertebral artery intramural hematoma (arrow) with propagation into the proximal PICA (arrowhead) DWI (c) confirms acute right PICA territory infarct. SWI: susceptibility weighted imaging; PICA: posterior inferior cerebellar artery; DWI: diffusion-weighted imaging. A 43-year-old woman presented with right lateral medullary syndrome. SWI image (a) shows a focal hypointensity (arrow) in the proximal segment of the right PICA with positive phase shift on the phase image (b) suspicious for an intramural hematoma in the setting of PICA dissection. DWI (c) demonstrates acute infarct in the right lateral medulla. CT cerebral angiogram volume rendered image (d) confirms the presence of a dissecting aneurysm proximally in the right PICA (arrow). SWI: susceptibility weighted imaging; PICA: posterior inferior cerebellar artery; DWI: diffusion-weighted imaging; CT: computed tomography.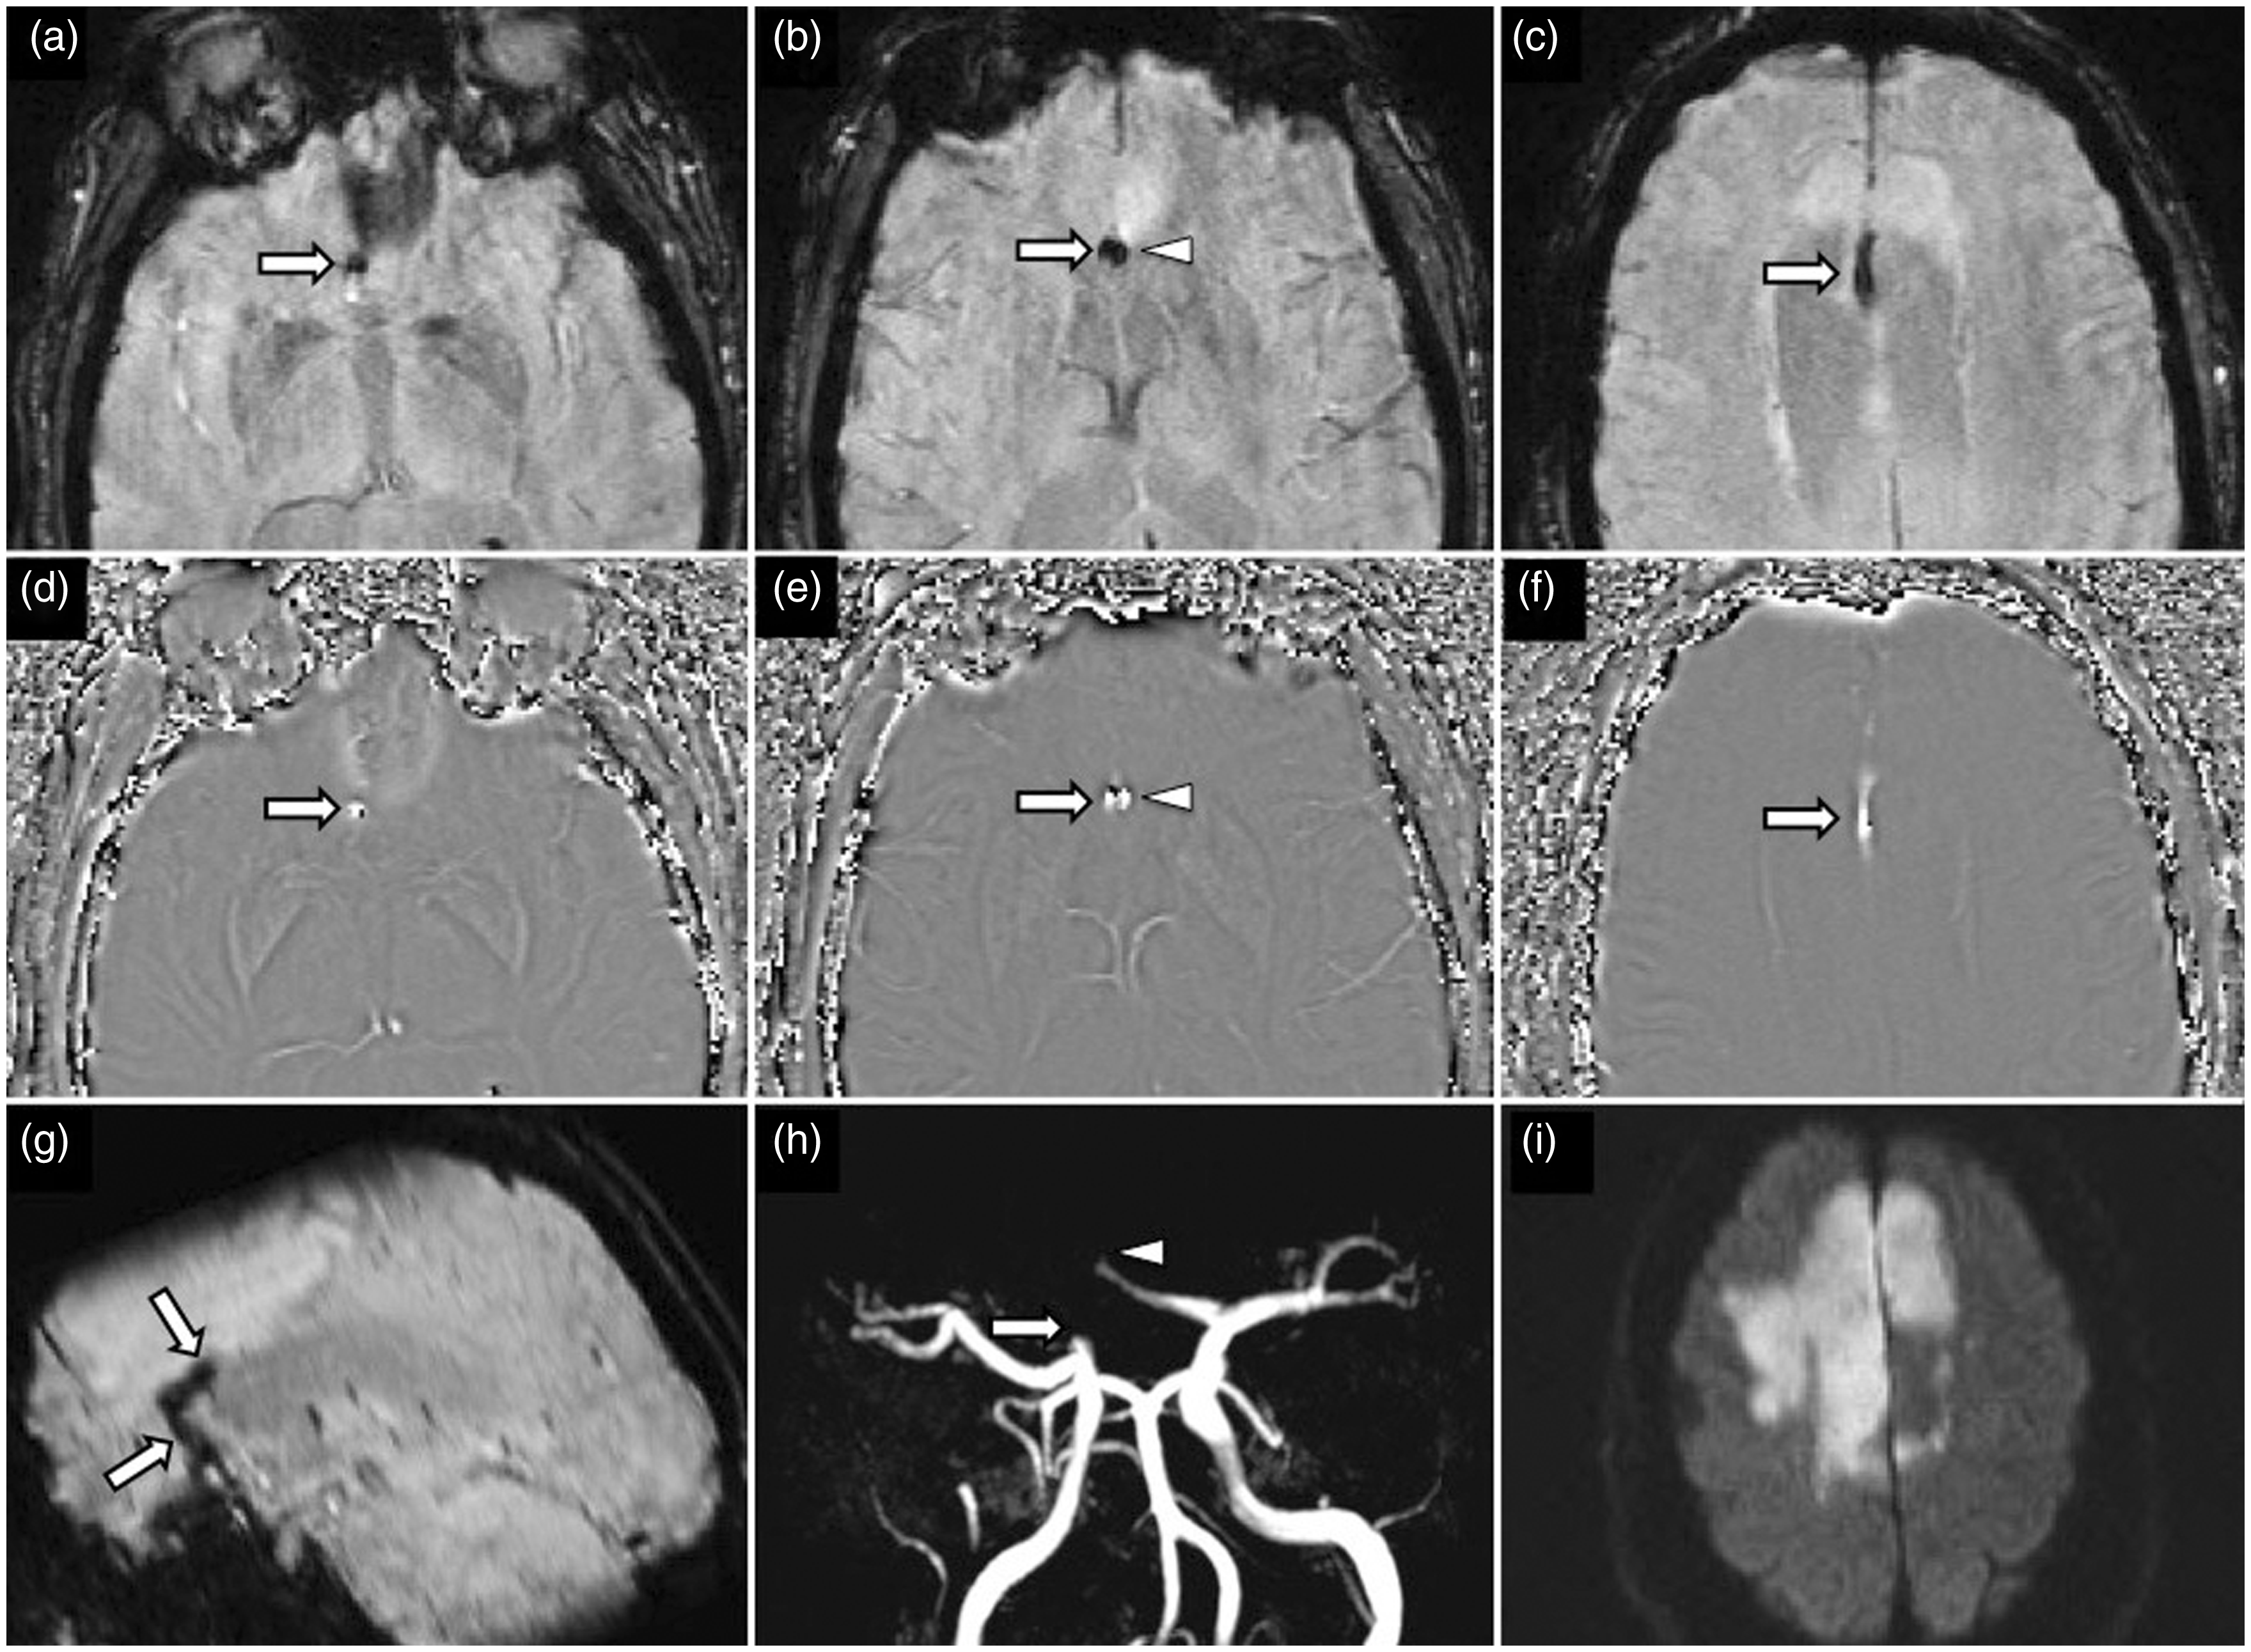
Fragmented thrombi
Fragmented thrombi may arise from either fragmentation of a primary thromboembolus, or less commonly the simultaneous presence of one or more thromboemboli. Although a high percentage of fragmented thrombi are found distal to a primary thromboembolus within the same vascular region, the true prevalence may be still underestimated, as conventional angiography requires contrast enhancement distal to the site of primary vessel occlusion, thus limiting the detection of fragmented thrombi in cases of complete vessel occlusion or poor collateral circulation. 39 Identification of fragmented thrombi is of paramount importance as it is a predictor of reduced collateral circulation, a larger volume of infarct, higher rates of clinical stroke severity and a higher degree of disability. 39 Fragmented thrombi also pose a greater challenge for mechanical thrombectomy due to the technical difficulty of retrieval of multiple thrombi fragments. SWI is sensitive in the identification of the presence of fragmented thrombi and their respective location providing critical information for neurointerventional planning. 39
Calcified thromboembolism
Calcified thromboemboli are more common than previously assumed and occur in nearly 3% of patients obtaining a head CT scan for stroke and most commonly occur in the MCA.40,41 Calcified thromboemboli can arise from various sources but most frequently arise from calcified aortic stenosis, carotid atherosclerotic plaque, mitral annular calcification and aortic arch atherosclerotic plaque.40–42 A majority of cases are now thought to occur spontaneously while a smaller percentage, 14%, occur after cardiothoracic or interventional procedures.40,41 Accurate diagnosis of calcified cerebral emboli is important as tPA is ineffective and almost half of all patients experience a recurrent ischemic event.43–45 The diagnosis of calcified emboli is straightforward on CT but may be easily overlooked on MRI. Both SWI phase images and SWIM can assist in differentiating the phase shift between calcified and non-calcified thromboembolus to influence a diagnosis (Figure 10).
15
A 65-year-old man presented with acute left MCA territory stroke. Non-contrast enhanced CT of the head (a) shows a calcified thromboembolus (arrow) in the M4 cortical branch of the left MCA. SWI image (b) depicts the calcified thromboembolus (arrow) as a hypointense focus, and on the phase image (c) the thromboembolus (arrow) shows negative phase shift and also appears hypointense. (Images acquired on a left-handed MRI system). MCA: middle cerebral artery; CT: computed tomography; SWI: susceptibility weighted imaging.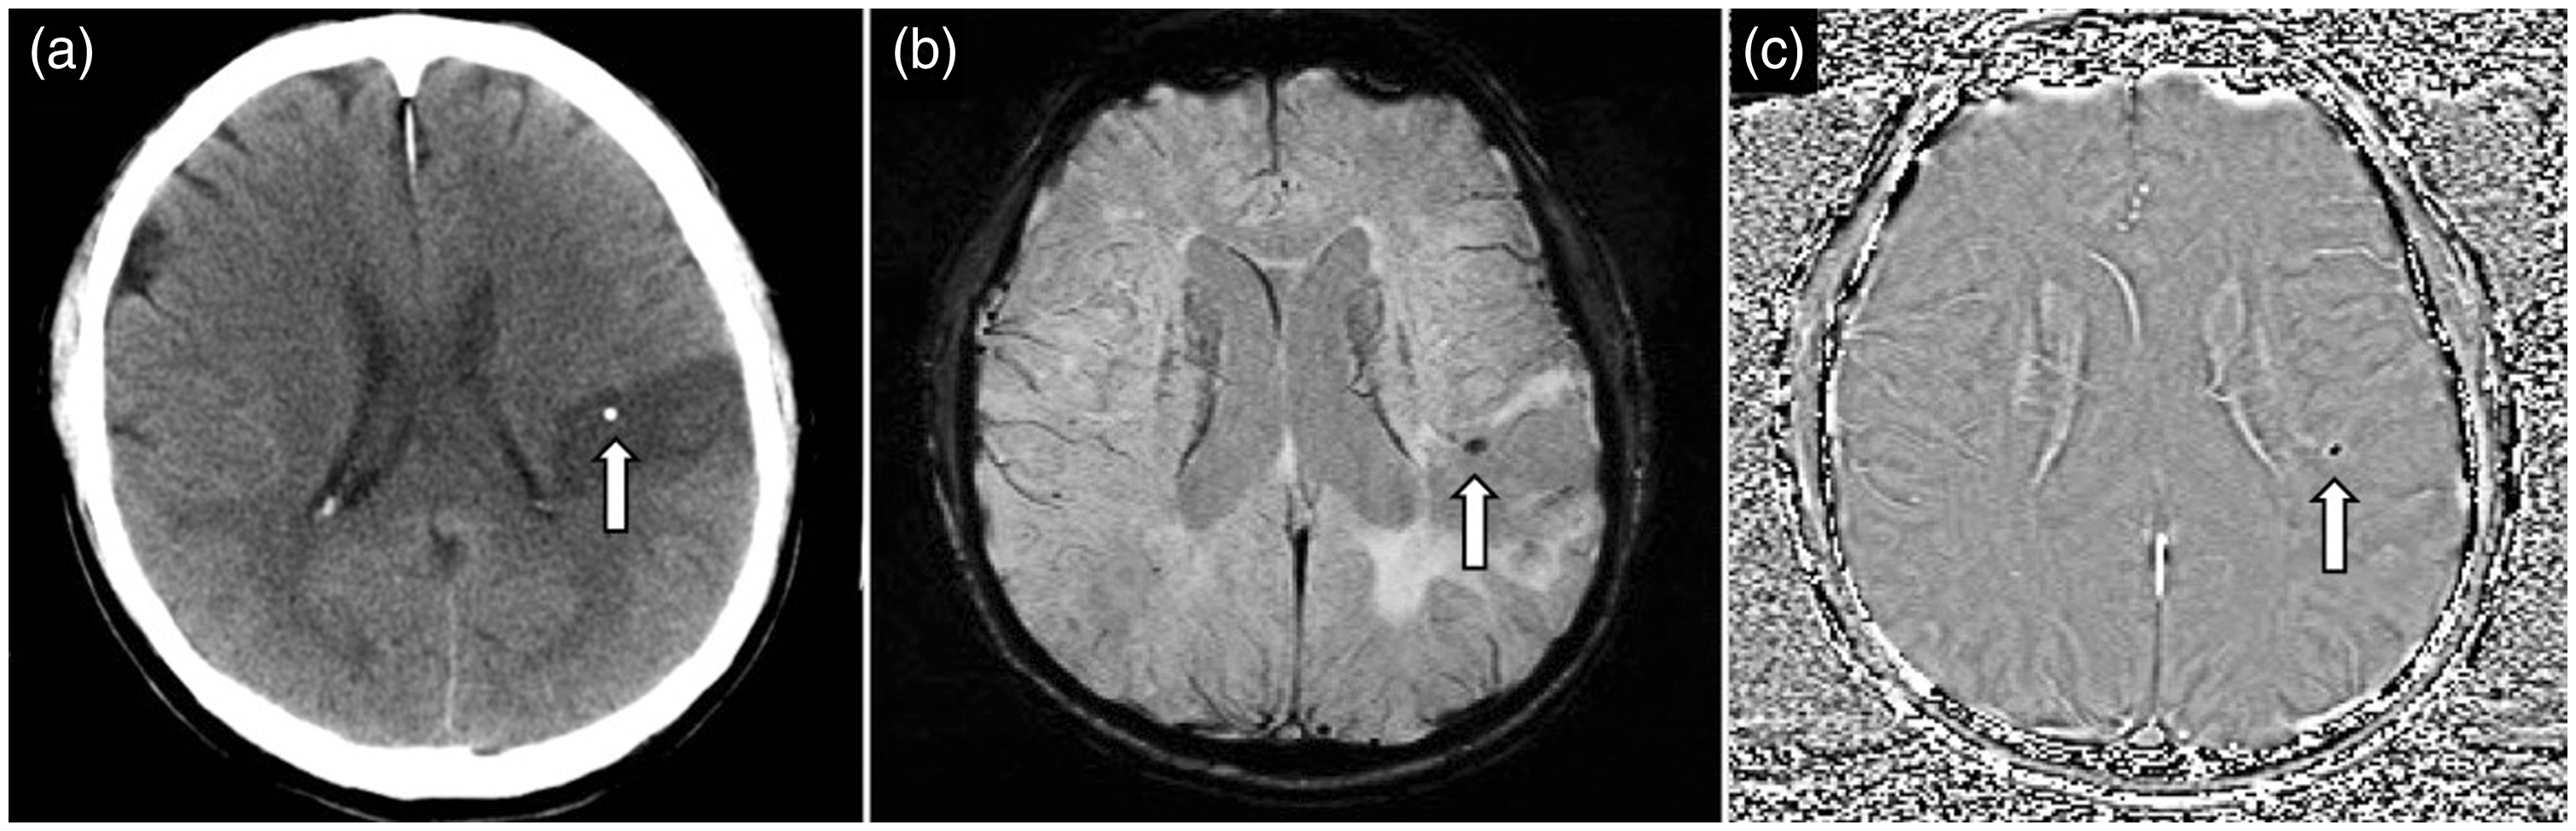
Recanalization
Although SWI is sensitive in the detection of thromboembolus in acute ischemic stroke, the alteration of signal intensity of the thromboembolus on follow-up studies does not provide diagnostic value.
46
Complete or partial resolution of the susceptibility vessel sign does not automatically infer vessel recanalization as changes in magnetic susceptibility of the thromboembolus may also be attributed to changes in fibrin content and the intrinsic hemoglobin degradation process.
46
A retracted thromboembolus with reduced content of deoxyhemoglobin may show a gradual reduction in magnetic susceptibility that can be erogenous and interpreted as recanalization despite persistent vessel occlusion. On the other hand, a persistent susceptibility vessel sign does not exclude the possibility of partial recanalization (Figure 11).
46
We recommend caution in interpretation of the susceptibility vessel sign on follow-up MRI studies, and vessel patency should be assessed on CT or MRA.
46
A 62-year-old woman with acute left MCA territory stroke. At presentation, SWI image (a) and phase image (b) shows two hypointense thromboemboli proximally at the inferior (arrowhead) and superior M2 division (arrow) of the left MCA. CT angiography MIP image (c) confirms partially occlusive thrombi at these locations. MRI brain performed 24 hours post-IV-tPA with SWI (d) and phase (e) images showing partial resolution of the susceptibility signal which is indeterminant for vessel recanalization. Contrast enhanced MRA MIP image (f) confirms successful recanalization without residual thromboembolus. MCA: middle cerebral artery; SWI: susceptibility weighted imaging; CT: computed tomography; MIP: maximum intensity projection; IV-tPA: intravenous tissue plasminogen activator; MRA: magnetic resonance angiography.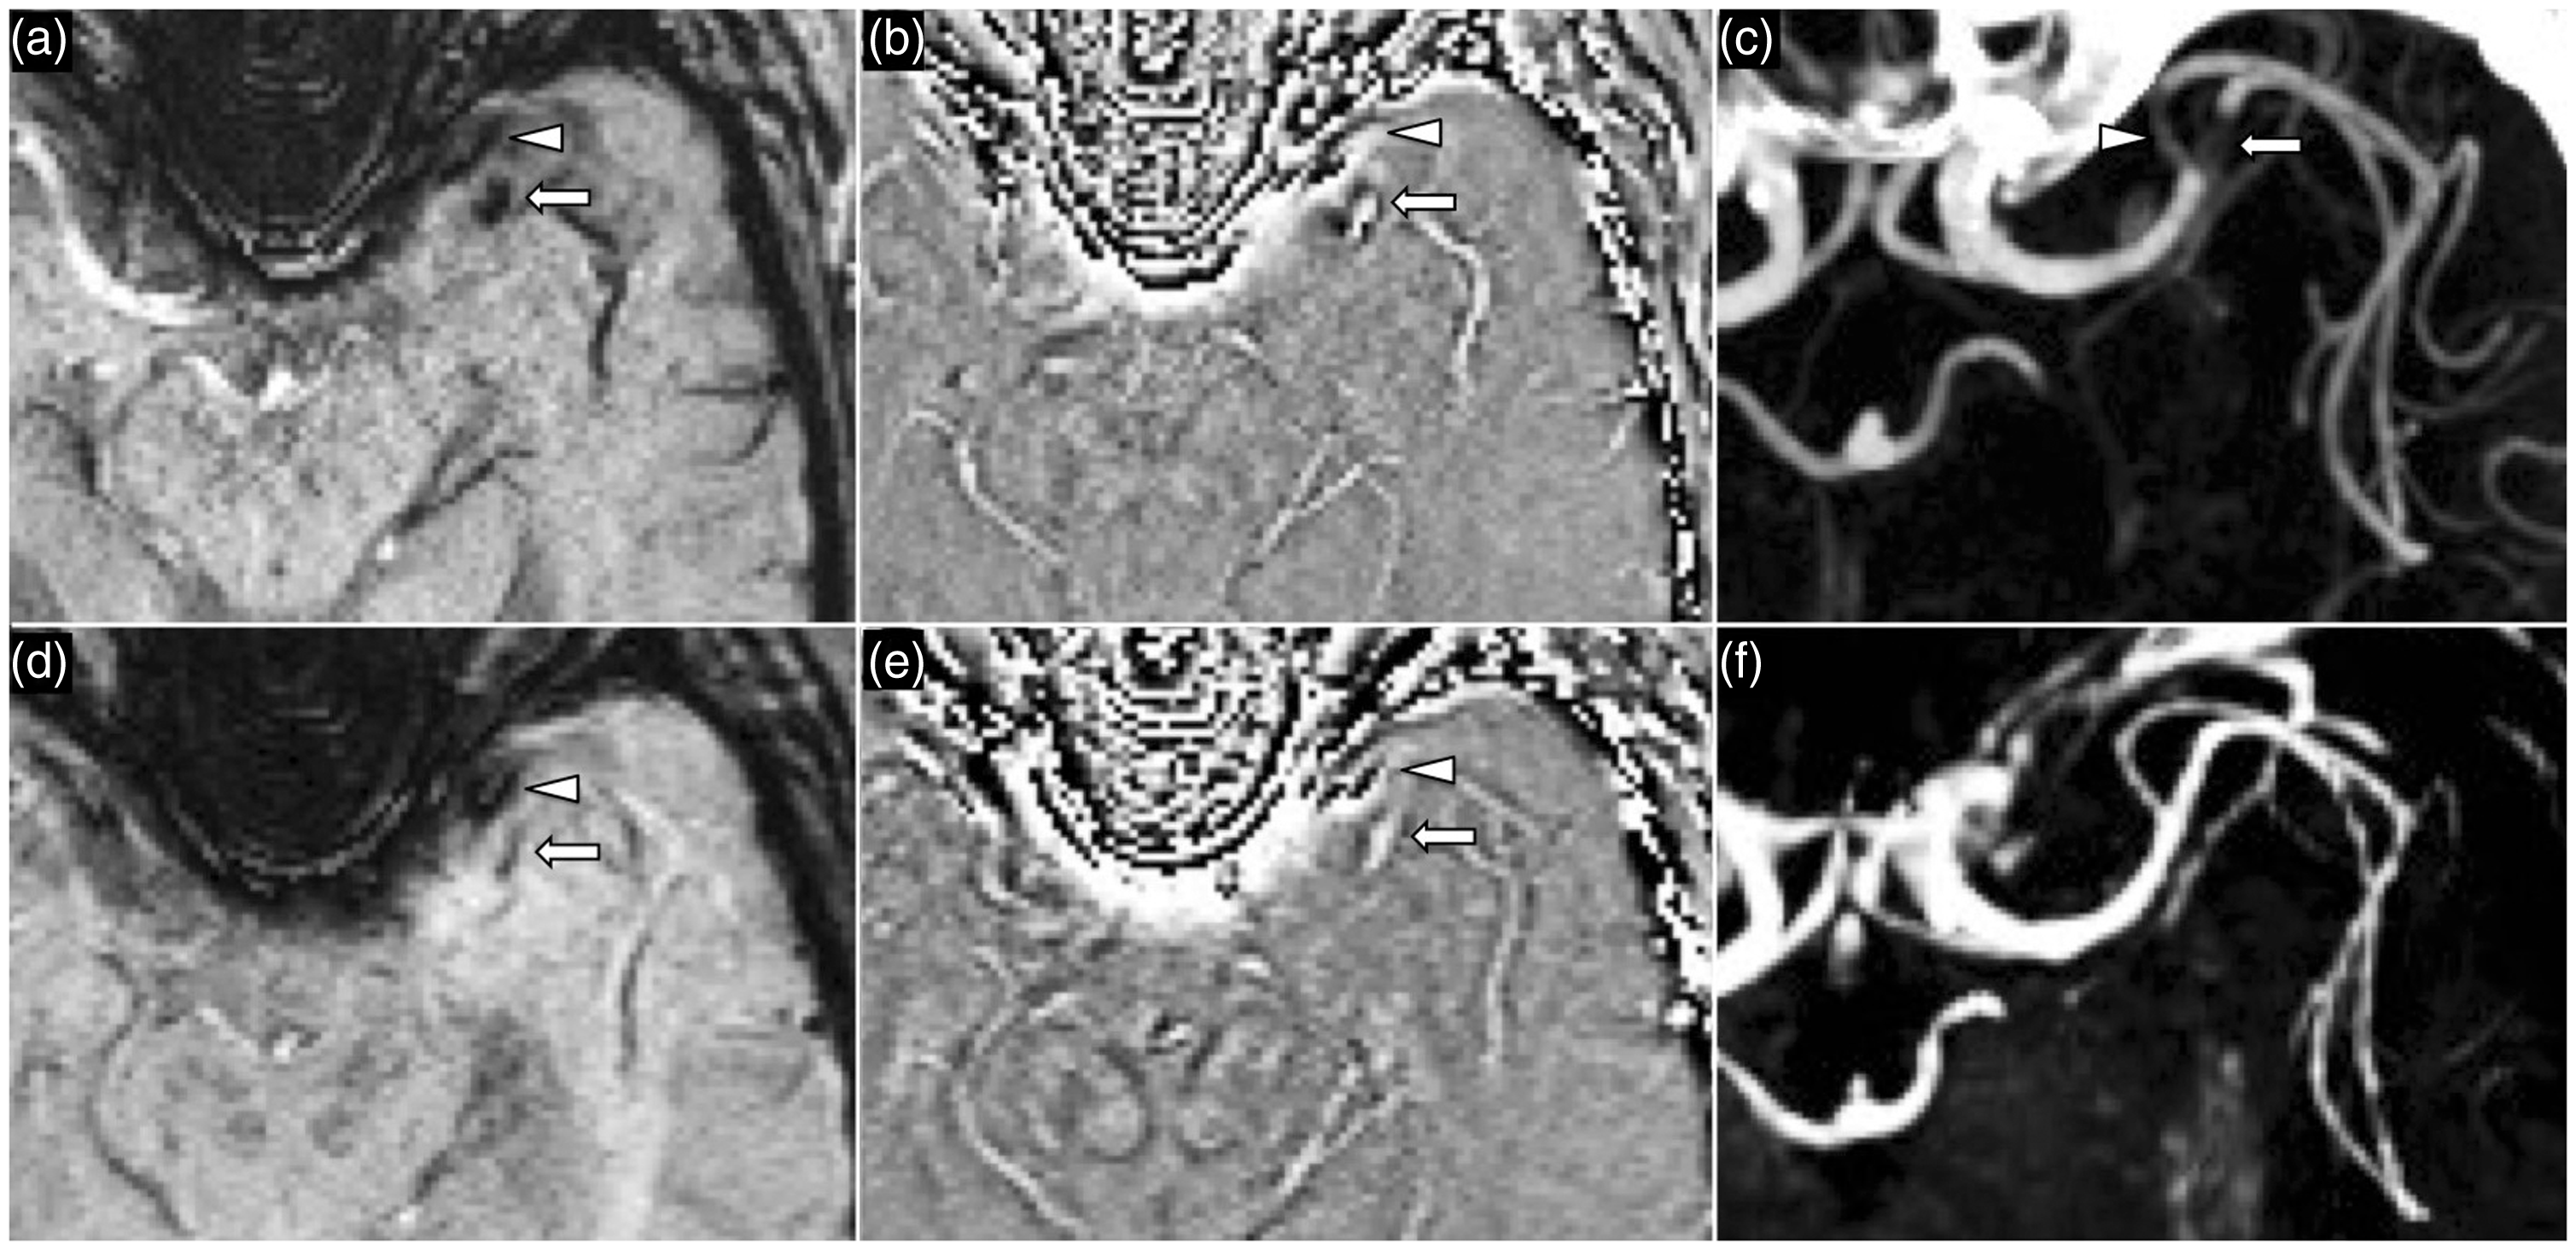
Tissue perfusion
In acute stroke, the ischemic territory demonstrates increased oxygen extraction fraction and manifests as asymmetric hypointensity of cortical veins (Figure 12).11,47 Asymmetric hypointense cortical veins have been hypothesized to represent the ischemic penumbra and correlate well with perfusion parameters of raised mean transit time and time to peak. This is further strengthened by observation that patients with greater mismatch between asymmetric cortical veins on SWI and a small diffusion-weighted imaging (DWI) positive area (SWI–DWI mismatch) are more likely to have a favourable outcome from reperfusion strategy or recanalization.
48
More recently, SWIM has enabled quantitative analysis of the level of deoxygenated haemoglobin associated with asymmetric hypointense cortical veins within the ischemic territory.
19
A 4–16% decrease in cortical venous oxygen saturation is seen in the ischemic territory with mean susceptibility of 254 parts per billion (ppb) as compared to the normal contralateral cerebral hemisphere with an average of 123 ppb.
19
The level of cortical vein oxygenation in the ischemic territory may be influenced by the presence of collateral circulation but further research is needed to determine relationship of venous oxygenation level on SWIM with existing magnetic resonance parameters such as diffusion or perfusion sequences.
A 56-year-old woman with acute left MCA territory stroke. SWI (a) and phase (b) images demonstrate a thromboembolus in the superior M2 division of the left MCA. SWI image (c) at the ganglionic level shows asymmetric hypointense cortical veins in the left MCA territory (arrowheads) consistent with increased level of deoxyhemoglobin. Fluid-attenuated inversion recovery (FLAIR) image (d) shows hyperintense cortical vessel sign reflecting presence of slow flow in the cortical collateral vessels. DWI (e) shows acute cortical infarct in the left inferior parietal lobule. MCA: middle cerebral artery; SWI: susceptibility weighted imaging; FLAIR: fluid-attenuated inversion recovery; DWI: diffusion-weighted imaging.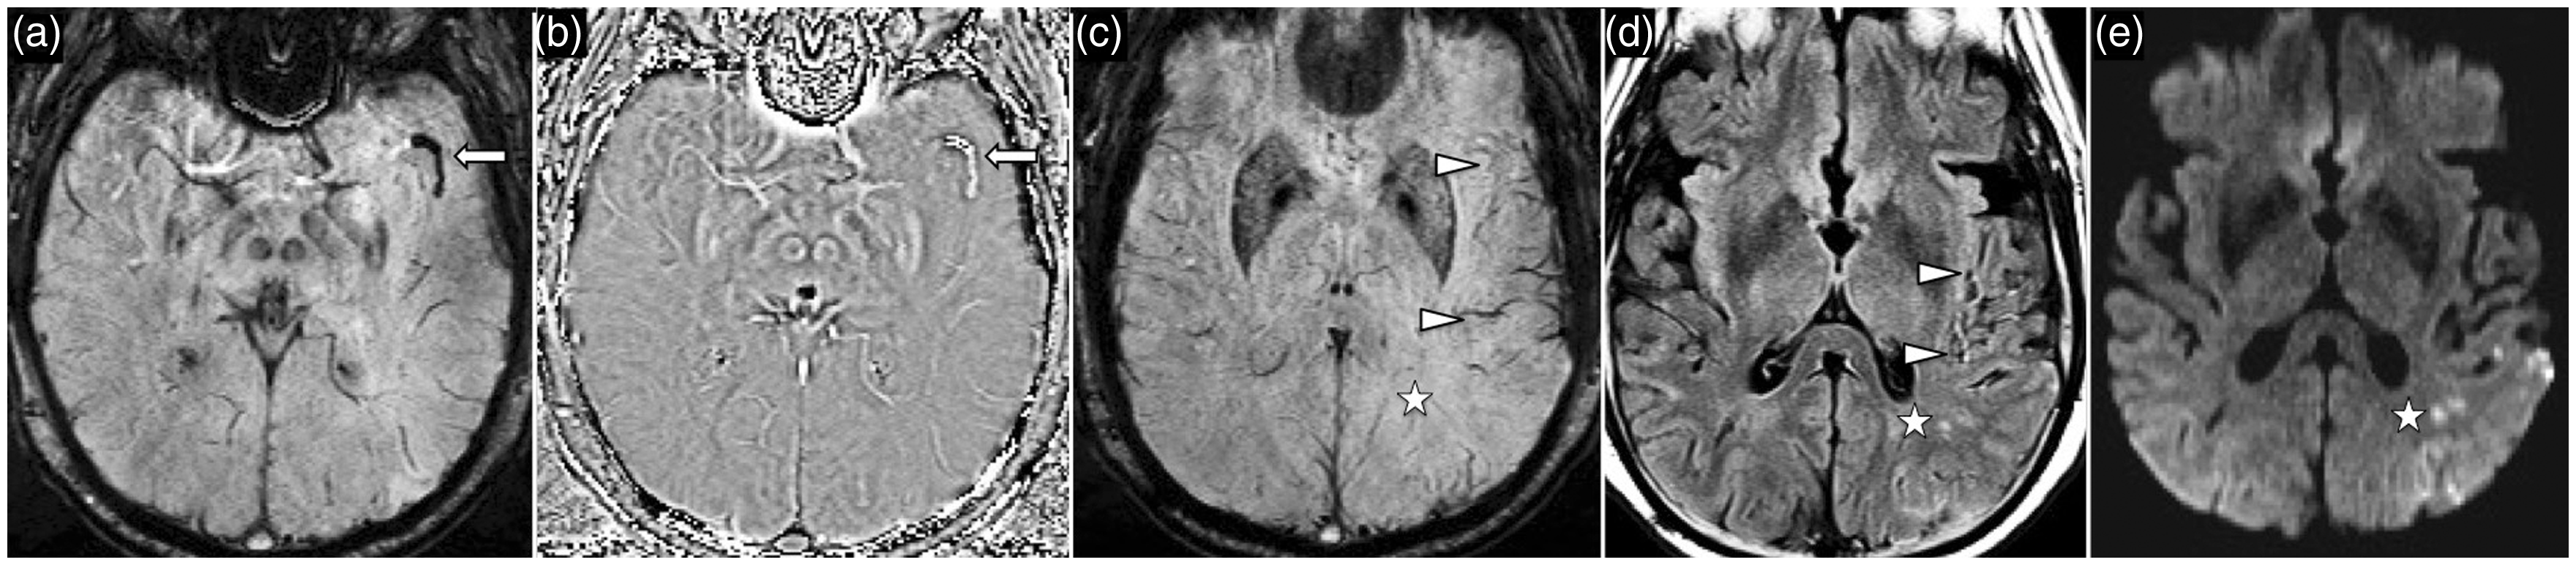
Hemorrhagic risks
The presence of cerebral microbleeds has been linked to increased rates of intracerebral hemorrhage following thrombolytic therapy, resulting in difficult clinical scenarios when quantifying pre-treatment risk (Figure 13).
49
SWI is sensitive in the detection of cerebral microbleeds and is hence thought to be useful as a predictive measure of hemorrhagic risk. The general consensus is that fewer than five cerebral microbleeds is safe; however, the hemorrhagic risk above this threshold has not been quantified.
12
Currently, there is greater emphasis on the underlying process driving the microbleeds such as hyaline arteriolosclerosis or amyloid deposition, which may be inferred by the location and distribution of the cerebral microbleeds. This raises the debate of the utility of screening MRI using either GRE T2* or SWI prior to thrombolytic treatment but there needs to be a stricter definition of what constitutes a ‘high microbleed burden’ and further research; if validated it could be widely implemented as a risk stratification tool.
A 70-year-old man with acute left MCA territory stroke. SWI image (a) shows existing hypertensive pattern of cerebral microbleeds in the right basal ganglia. DWI (b) shows acute infarct in the left anterior limb of the internal capsule. Non-contrast CT of the head (c) performed 48 hours after administration of IV-tPA shows a small extra-ischemic zone hematoma in the left thalamus. MCA: middle cerebral artery; SWI: susceptibility weighted imaging; DWI: diffusion-weighted imaging; CT: computed tomography; IV-tPA: intravenous tissue plasminogen activator.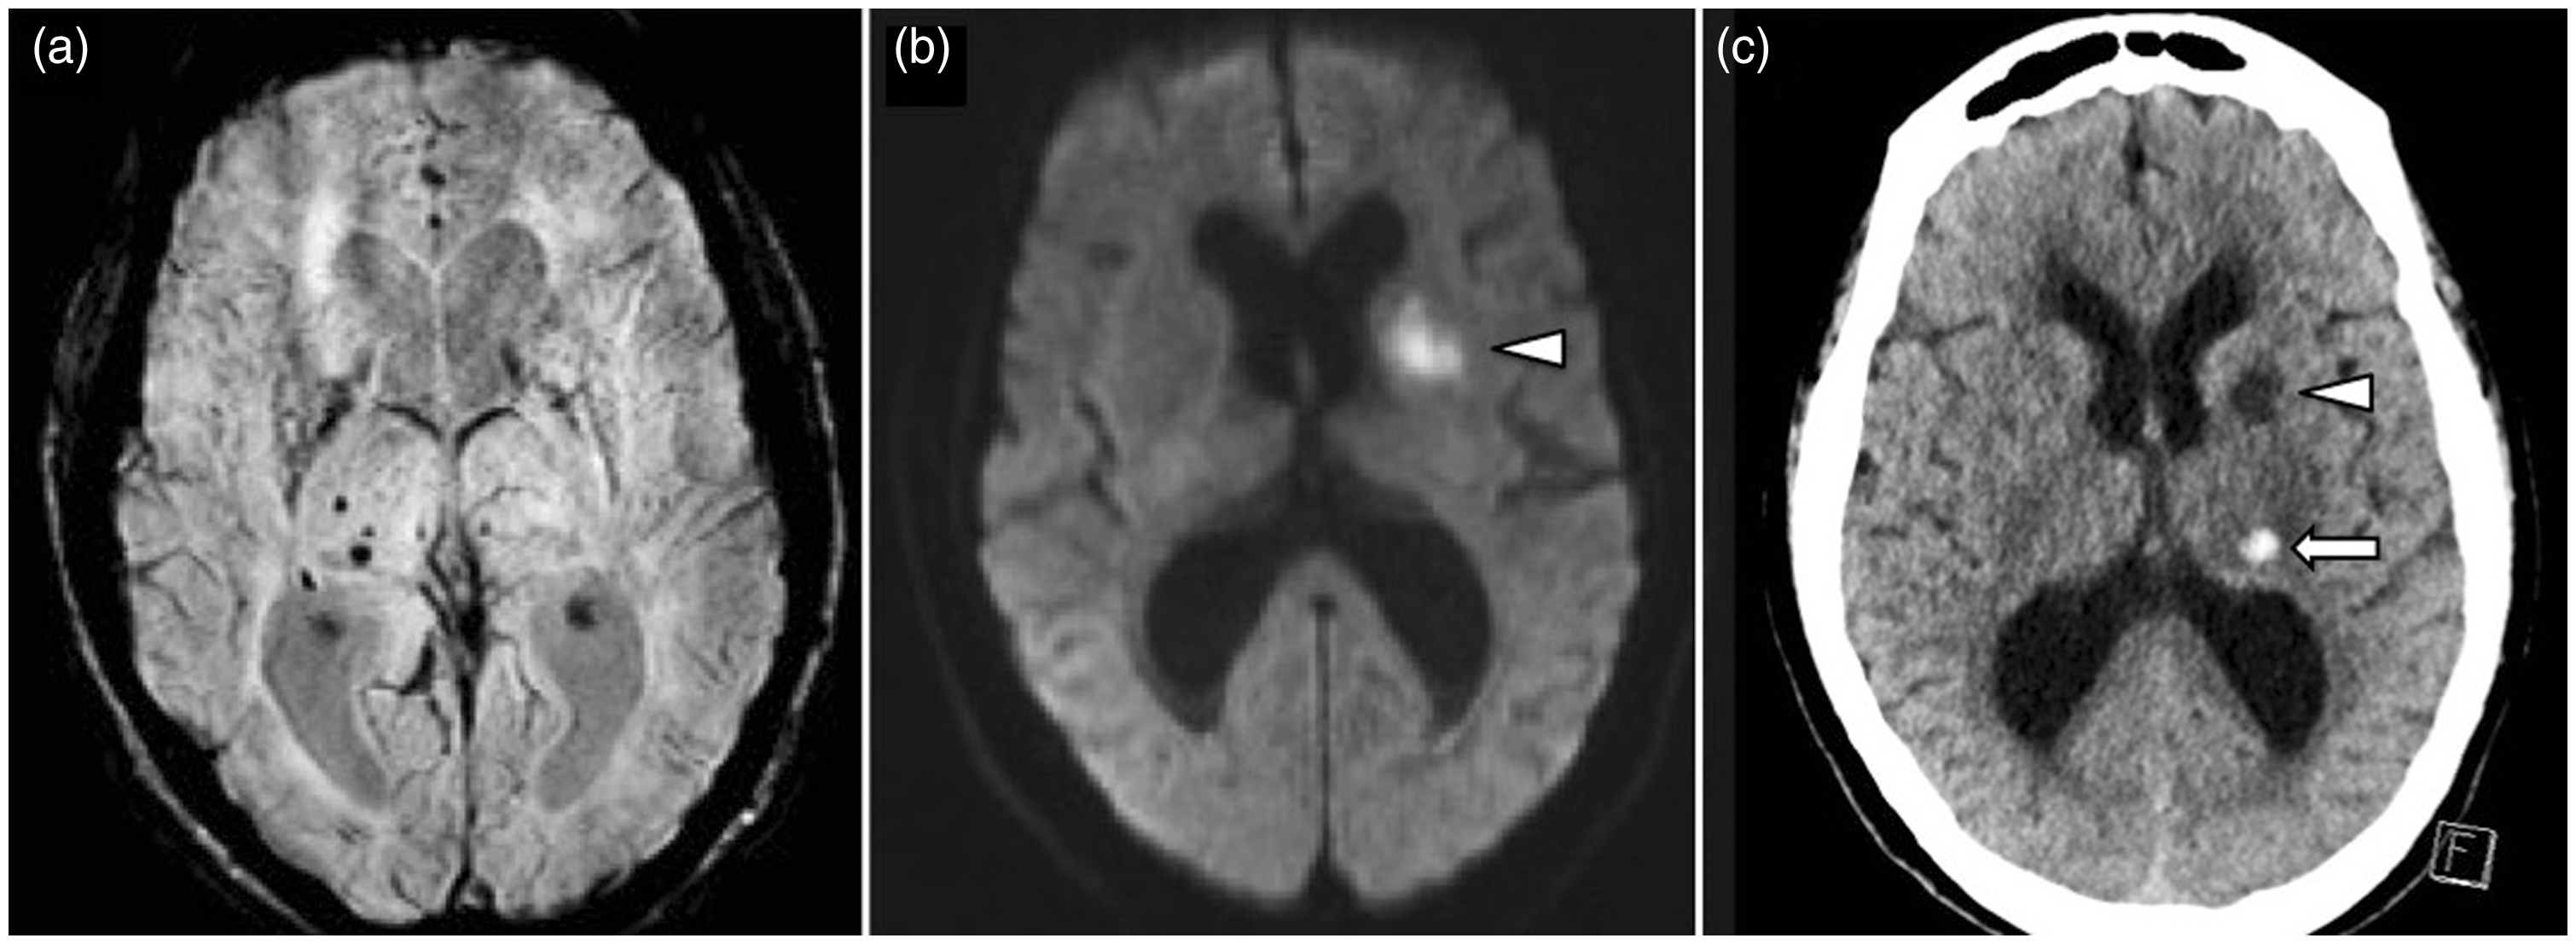
Hemorrhagic transformation
Early detection of hemorrhagic transformation after ischemic stroke is critical. Three patterns of parenchymal hemorrhages are recognized by the National Institute of Neurological Disorders and Stroke (NINDS) and the European Cooperative Acute Stroke (ECASS) studies. 50 These include hemorrhagic infarcts (HI), parenchymal hematomas (PH), and extra-ischemic hematomas. 50 HI represents petechial hemorrhages which can be subdivided into HI1 for petechial hemorrhages alone, or HI2 for confluent petechial hemorrhages. 50 PH is defined as parenchymal hematoma which can be subdivided into PH1 for hematoma representing less than 30% of the infarct zone with mild space-occupying effect, or PH2 for hematoma representing greater than 30% of the infarct zone with significant mass effect. SWI has greater sensitivity over T2* GRE for the detection of microhemorrhages and allows identification of HI1 and H12 patterns; however, clinical studies have demonstrated that HI1, HI2 and PH1 are associated with a lower risk of early neurological deterioration, morbidity and mortality. In contrast, PH2 is shown to be associated with greater morbidity and mortality and is the hemorrhagic pattern that can significantly affect the clinical outcome.
Conclusion
SWI is an invaluable part of the multimodality imaging of acute ischemic stroke, providing physiological information not only about the thromboembolus but also the neuroparenchyma at risk. Review of the recent literature outlined in this article consolidates our understanding and assists in the interpretation of SWI in acute stroke imaging.
Footnotes
Acknowledgments
The authors would like to thank Associate Professor Sandeep Bhuta for his insight and encouragement in the early stages of this project.
Funding
This research received no specific grant from any funding agency in the public, commercial, or not-for-profit sectors.
Conflict of interest
The authors declared no potential conflicts of interest with respect to the research, authorship, and/or publication of this article.