
Abstract
Purpose
The purpose of this study was to investigate the influence of blade width and magnetic field strength on apparent diffusion coefficient values of periodically rotated overlapping parallel lines with enhanced reconstruction (PROPELLER) diffusion-weighted imaging in the head and neck at 1.5 and 3.0 T magnetic resonance imaging.
Methods
Fifteen healthy volunteers (eight men and seven women; mean age 36.4 ± 10.1 years) underwent PROPELLER diffusion-weighted imaging using four blade widths at 3.0 T and three blade widths at 1.5 T. For the multigroup comparison of apparent diffusion coefficient values, we performed analysis of variance and Tukey–Kramer tests. The apparent diffusion coefficient values in each organ were compared among the different blade widths and magnetic field strengths by a t test. Inter and intra-observer agreements regarding apparent diffusion coefficient value measurements were evaluated using the intraclass correlation coefficient.
Results
No significant differences were observed in apparent diffusion coefficient values of the cerebellum in each blade width at both field strengths. The apparent diffusion coefficient values of the right parotid glands were significantly lower for blade width 32 than for blade width 16 at 3.0 T (1.16 × 10⁻³ mm2/s vs. 1.01 × 10⁻³ mm2/s; P < 0.05). The apparent diffusion coefficient values of bilateral parotid glands were significantly higher at 1.5 T than at 3.0 T. Intraclass correlation coefficients were almost perfect to substantial in the cerebellum, whereas they showed moderate agreement in the parotid glands.
Conclusion
The largest blade width 32 at 3.0 T and high magnetic field strength lowered the apparent diffusion coefficient values of parotid glands of PROPELLER diffusion-weighted imaging. The apparent diffusion coefficient values in the parotid glands of PROPELLER diffusion-weighted imaging may be affected for blade width and magnetic field strength.
Introduction
Diffusion-weighted imaging (DWI) is a useful clinical tool for assessing acute cerebral infarction, characterisation of tumorous lesions, and prediction or monitoring treatment response of chemotherapy for malignant tumours. The apparent diffusion coefficient (ADC) reflects the molecular diffusion of water and it is used to differentiate between benign and malignant tumours.1–3 Single-shot echo-planar imaging is the most widely used sequence for DWI.4,5 Its advantage is short acquisition time because long acquisition time induced low signal and blurring due to T2* decay. 6 However, it has a high sensitivity to inhomogeneities of B0, which degrades the image quality and also affects ADC measurements. Furthermore, it was reported that ADC values may vary with the magnetic field strength and vendor. 7
Periodically rotated overlapping parallel lines with enhanced reconstruction (PROPELLER) DWI is one of the fast spin-echo DWI sequences, which acquires data in a series by rotating blades in the centre of the k-space. The fast spin-echo sequence is used for PROPELLER DWI based on the robustness to the B0 related susceptibility artifact. In PROPELLER magnetic resonance imaging (MRI), the blades are rotated by a small angle at which time a second set of data are acquired, thus the centre of the k-space that contains the highest signal intensity and affects image contrast is oversampled. Each blade collects several phase encoded lines, and the number of lines is called the blade width. 8 Increased number of blade width causes shortening of imaging time, whereas it causes signal decay in the later phase within one blade due to the repeated phase encoding pulses. ADC measurement has been reported to be affected by the signal-to-noise ratio (SNR) and strength of the magnetic field. 9 In common clinical practice, 8–32 blade lines are acquired in a single shot.3,4,10–12 In PROPELLER MRI, the centre of the k-space is oversampled and consequently contains the highest signal intensity and affects image contrast. Therefore, accumulated phase errors between blades following the phase correction are less weighted in the image reconstruction process. 8
Thus, susceptibility artifacts could be decreased with PROPELLER DWI. Over the past few years, PROPELLER DWI has been reported to reduce artifacts associated with magnetic field inhomogeneities and image distortion in various organs including the head and neck.4,12 Knowledge of the influence of blade width and magnetic field strength on ADC values on PROPELLER DWI might be useful when a follow-up study or multicentre study is performed using this sequence. We hypothesised that the number of blade widths might affect the ADC measurement in association with the strength of the static magnetic field, and it should be optimised in each magnetic resonance scanner, especially with respect to the static magnetic field. However, little is known about whether the blade width and magnetic field strength affect the ADC values derived from PROPELLER DWI in the human body.
The purpose of this study was to determine whether the blade width and magnetic field strength affect the ADC values of PROPELLER DWI in the head and neck.
Methods and materials
Subjects
Our institutional review board approved this prospective study, and written informed consent was obtained from all volunteers. We recruited subjects who were never smokers, not addicted to alcohol, and did not have a current illness in the head or neck area. We excluded individuals who had metallic artificial dentition or dental bridges to avoid susceptibility artifacts. Finally, 15 healthy volunteers (eight men and seven women; age range 24–60 years; mean age 36.4 ± 10.1 years) were enrolled in this study. All volunteers were instructed to avoid consuming alcohol for at least 8 hours before the MRI examinations to avoid alcohol-associated modification in their salivary flow and saliva function. 13 The MRI examinations were performed at least 4 hours after lunch, with fasting until the end of the MRI examination.
Magnetic resonance imaging
All examinations were performed in each subject by a 1.5 T MRI scanner (Signa HDx; GE Healthcare, Milwaukee, WI, USA) with an 8-channel neurovascular head and neck phased array coil, and a 3.0 T MRI scanner (Discovery 750w; GE Healthcare, Milwaukee, WI, USA) system with a 16-channel geometry embracing method head and neck phased array coil. All volunteers underwent MRI examinations at both 1.5 T and 3.0 T MR scanners on the same day. In all MRI examinations, three-plane orthogonal images of the head and neck were first acquired for anatomical localisation using gradient-echo magnetic resonance images. Thereafter, we obtained axial PROPELLER DWI with the following parameters: repetition time 7000 ms; echo time 78.7 ms; field of view 250 × 250 mm2; matrix size 128 × 128; slice thickness 5 mm; and slice gap 1 mm. Sensitising diffusion gradients were applied in three directions (x, y and z) with b-values of 0 and 1000 s/mm2 in PROPELLER DWI. PROPELLER DWI was also performed with three types of blade width (16, 20 and 24) at 1.5 T and four types of blade width (16, 20, 24 and 32) at 3.0 T in combination with fat saturation. We could not select the blade width of 32 due to the limitation of PROPELLER DWI in the 1.5 T MRI scanner. The imaging range was from the base of the skull to the submandibular glands.
Image analysis
The cerebellum and parotid glands were chosen to subject to comparison, because they are susceptible to magnetic susceptibility artifacts, and these sites are often examined in clinical practice. In the head and neck region, we could set a relatively large range of interest (ROI) with size of 50 mm2 in these sites. Other sites such as the submandibular gland, thyroid gland, pharynx and larynx were not suitable for analysis with a sufficient size of ROI, because we could not set a sufficient size of ROI, and a small size of ROI might lead to an inaccurate measurement susceptible to inhomogeneous magnetic field.
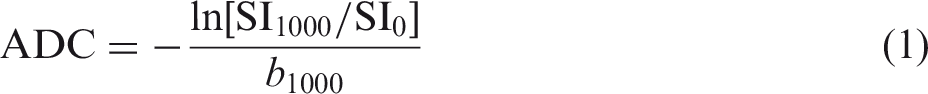
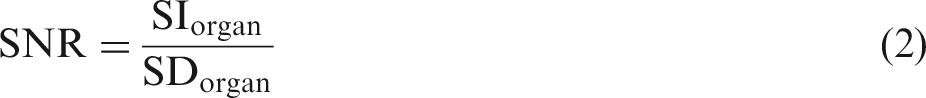
Two radiologists (YN and GM, with 14 and 34 years of experience in head and neck MRI, respectively) independently set the ROI in the cerebellar hemisphere, avoiding the grey matter, and in the bilateral parotid glands, avoiding the salivary ducts and blood vessels. The observers set the ROI on each image using copy and paste from the co-localised image across the different blade widths. The ADC value and SNR were defined by the following equations:
Statistical analysis
Statistical analyses were performed using JMP 11 (SAS Institute Inc., Cary, NC, USA). For the comparison among three or four different blade widths in each organ, the normality of the ADC data were first analysed using a Shapiro–Wilk test. If it showed a normal distribution, multiple comparisons among all groups of ADC values for each organ were performed using analysis of variance (ANOVA). If the test showed a non-normal distribution, we applied a Kruskal–Wallis test for multiple comparisons. When either of these tests showed a significant difference for multiple comparisons, we applied the Tukey–Kramer or Wilcoxon rank sum test for comparisons of the ADC values specific to each group.
The ADC values in each organ were compared among the different magnetic field strengths by using a t test. Variations in ADC values for each group were evaluated using a coefficient of variation (CV). The SNRs were determined using a t test for the differences between field strengths.
Inter-observer and intra-observer reliabilities of ADC value measurements of the bilateral cerebellar hemisphere and bilateral parotid glands at both field strengths were analysed using the intraclass correlation coefficient (ICC). ICC is a measure of the inter-observer reliability of measurements of variables in some groups that contain measurements by different observers. ICC values were graded as follows: less than 0.2 = slight, between 0.21 and 0.4 = fair, between 0.41 and 0.6 = moderate, between 0.61 and 0.8 = substantial, between 0.81 and 1.0 = almost perfect.
P < 0.05 was considered statistically significant for all statistical analyses.
Results
Quantitative analysis of ADC values
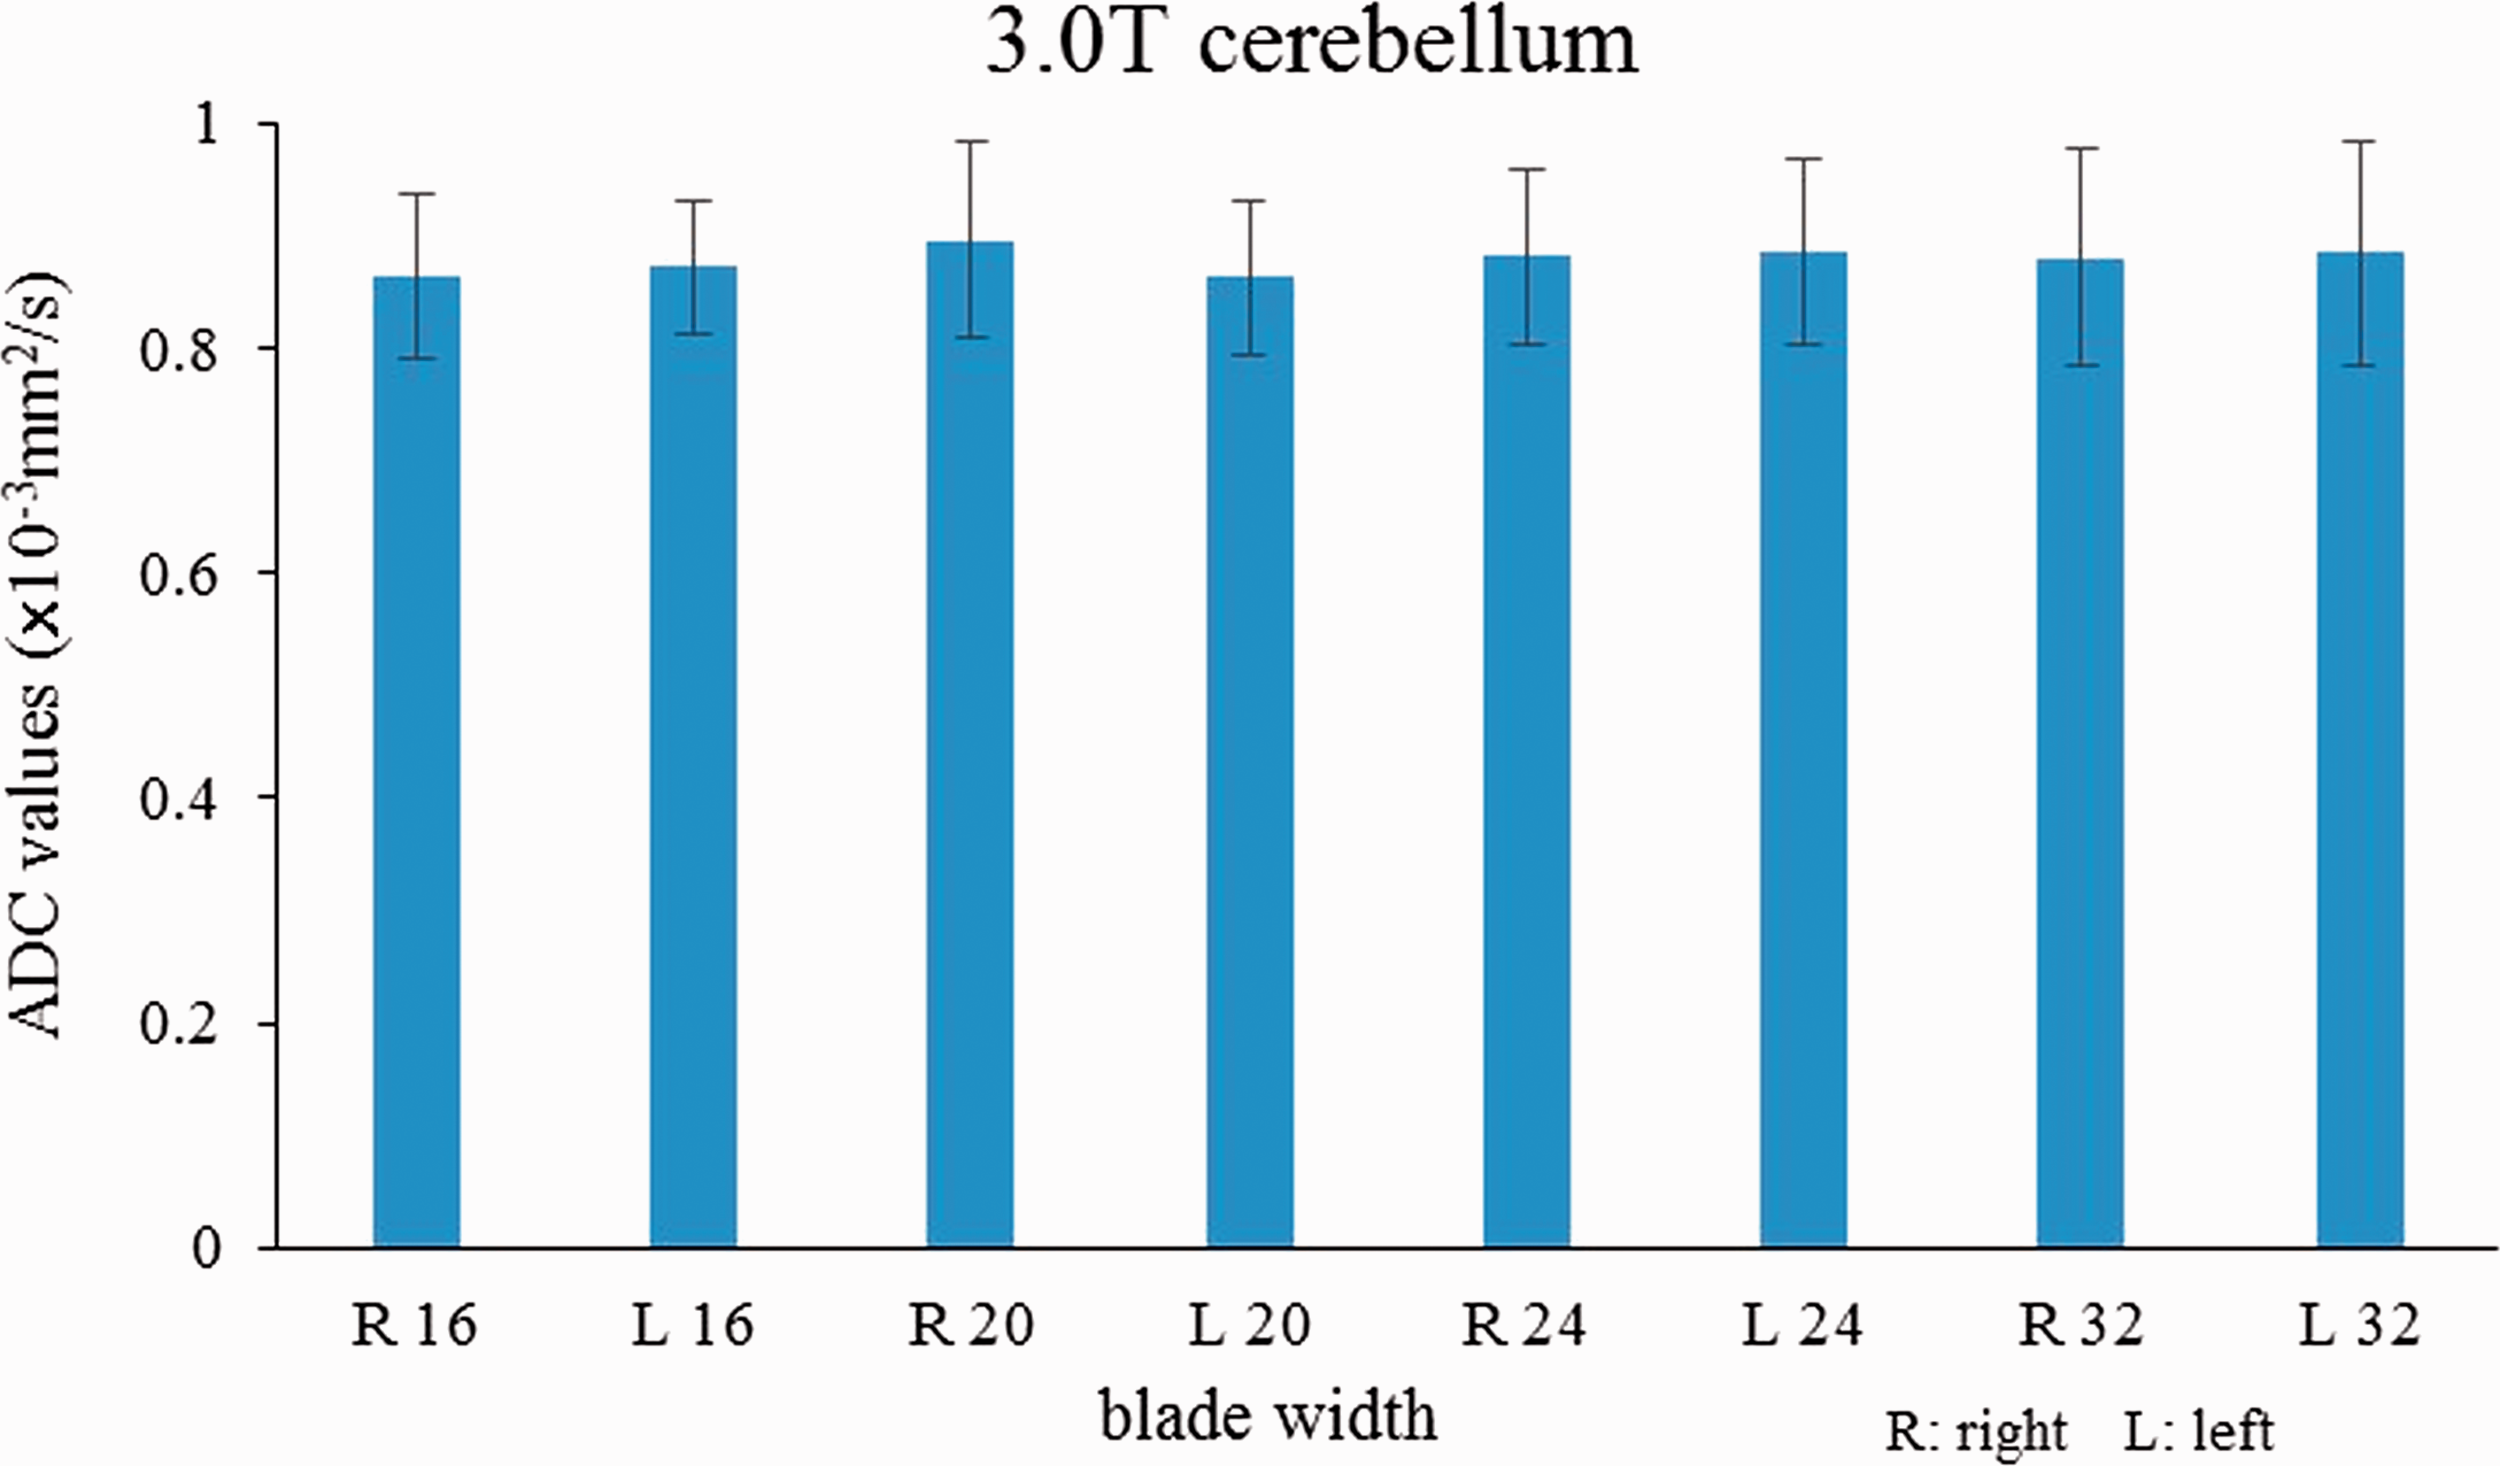
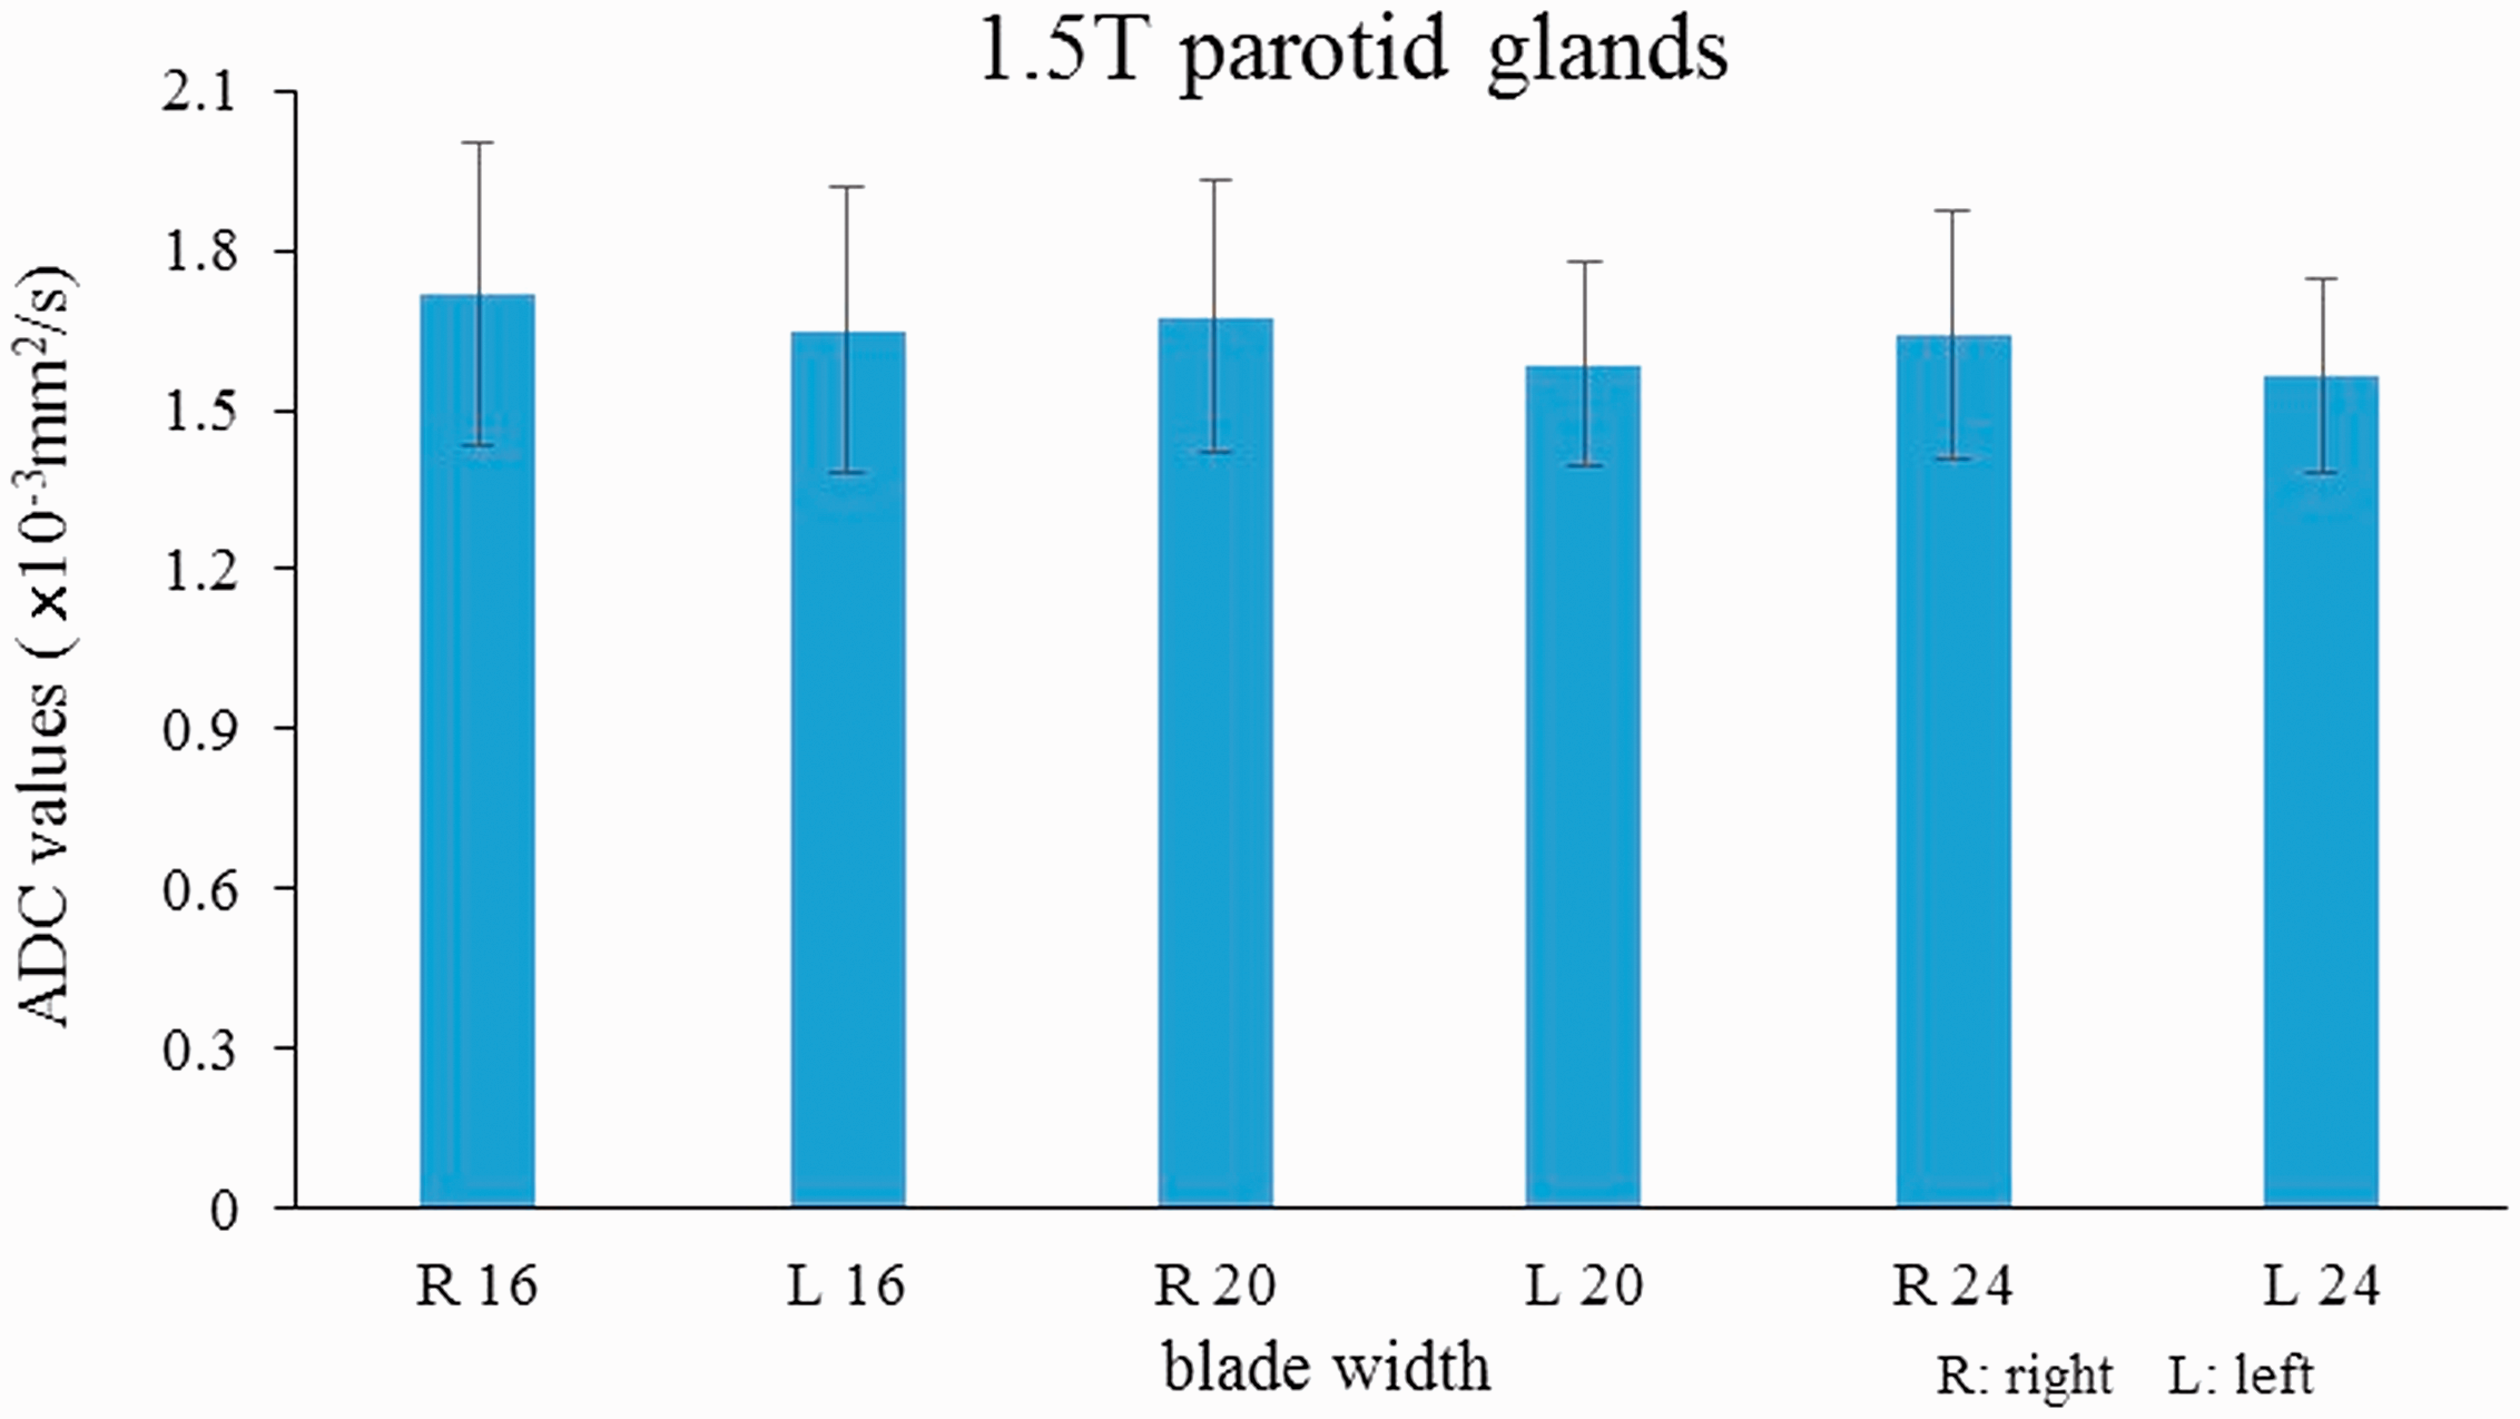
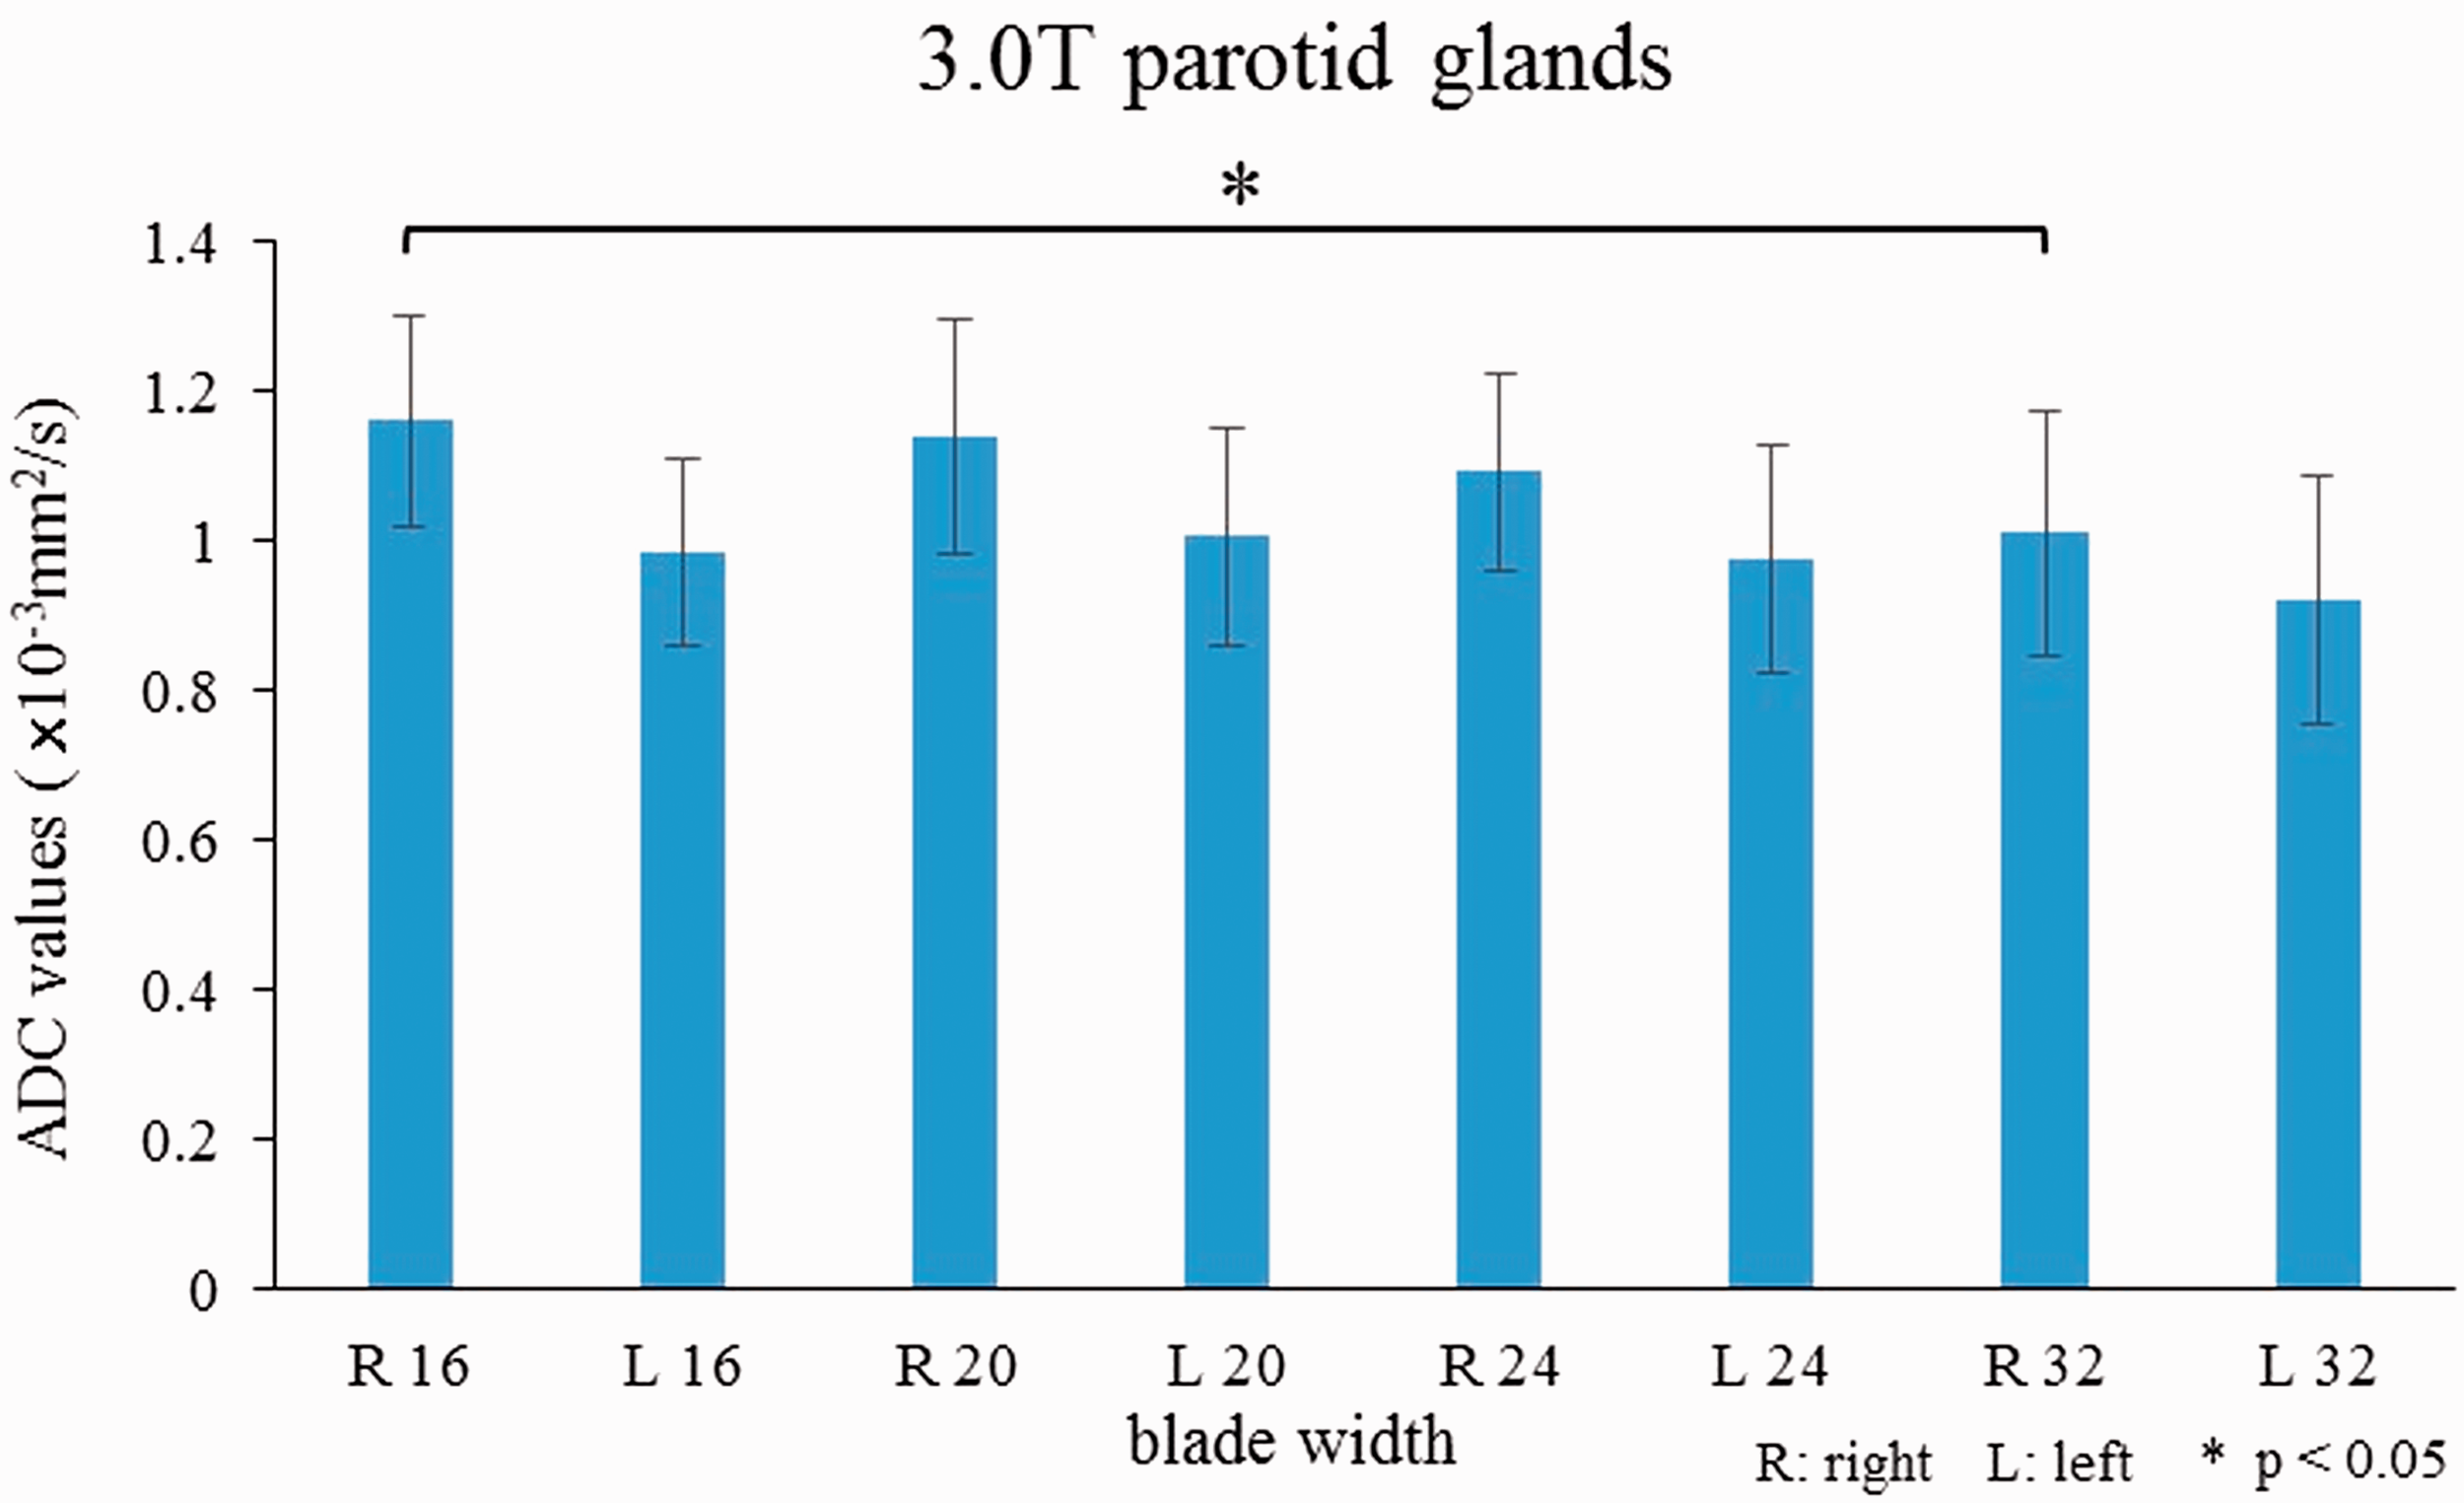
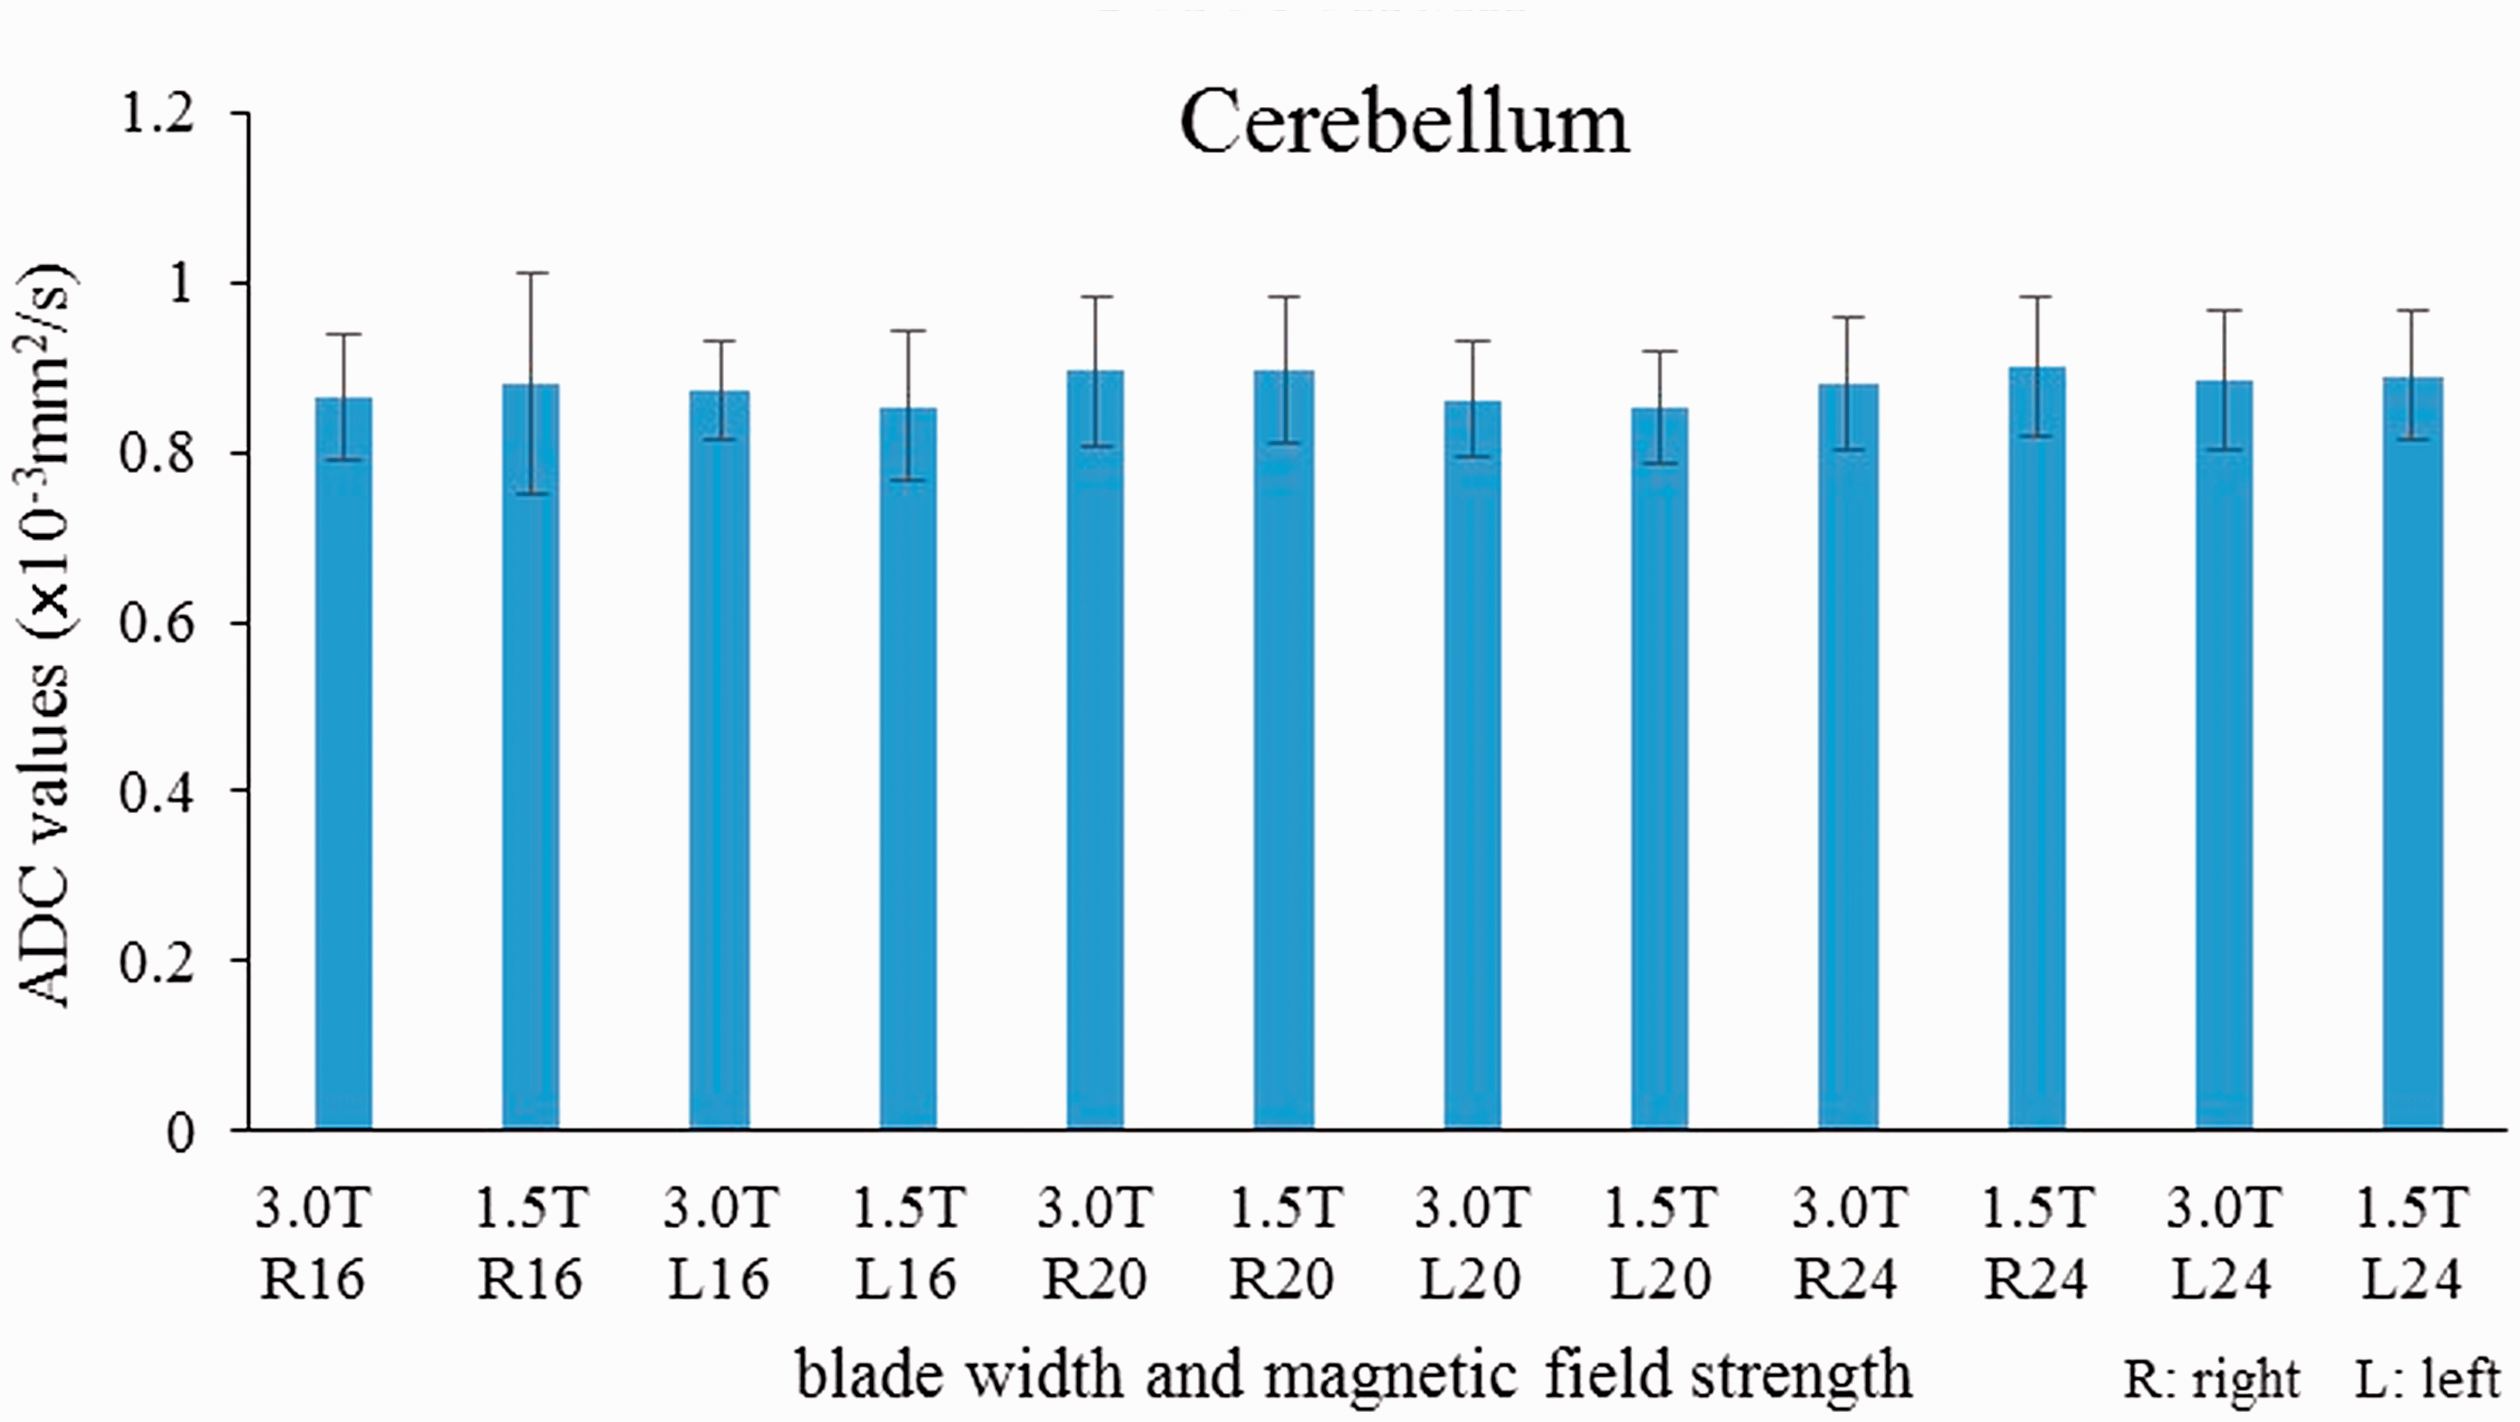
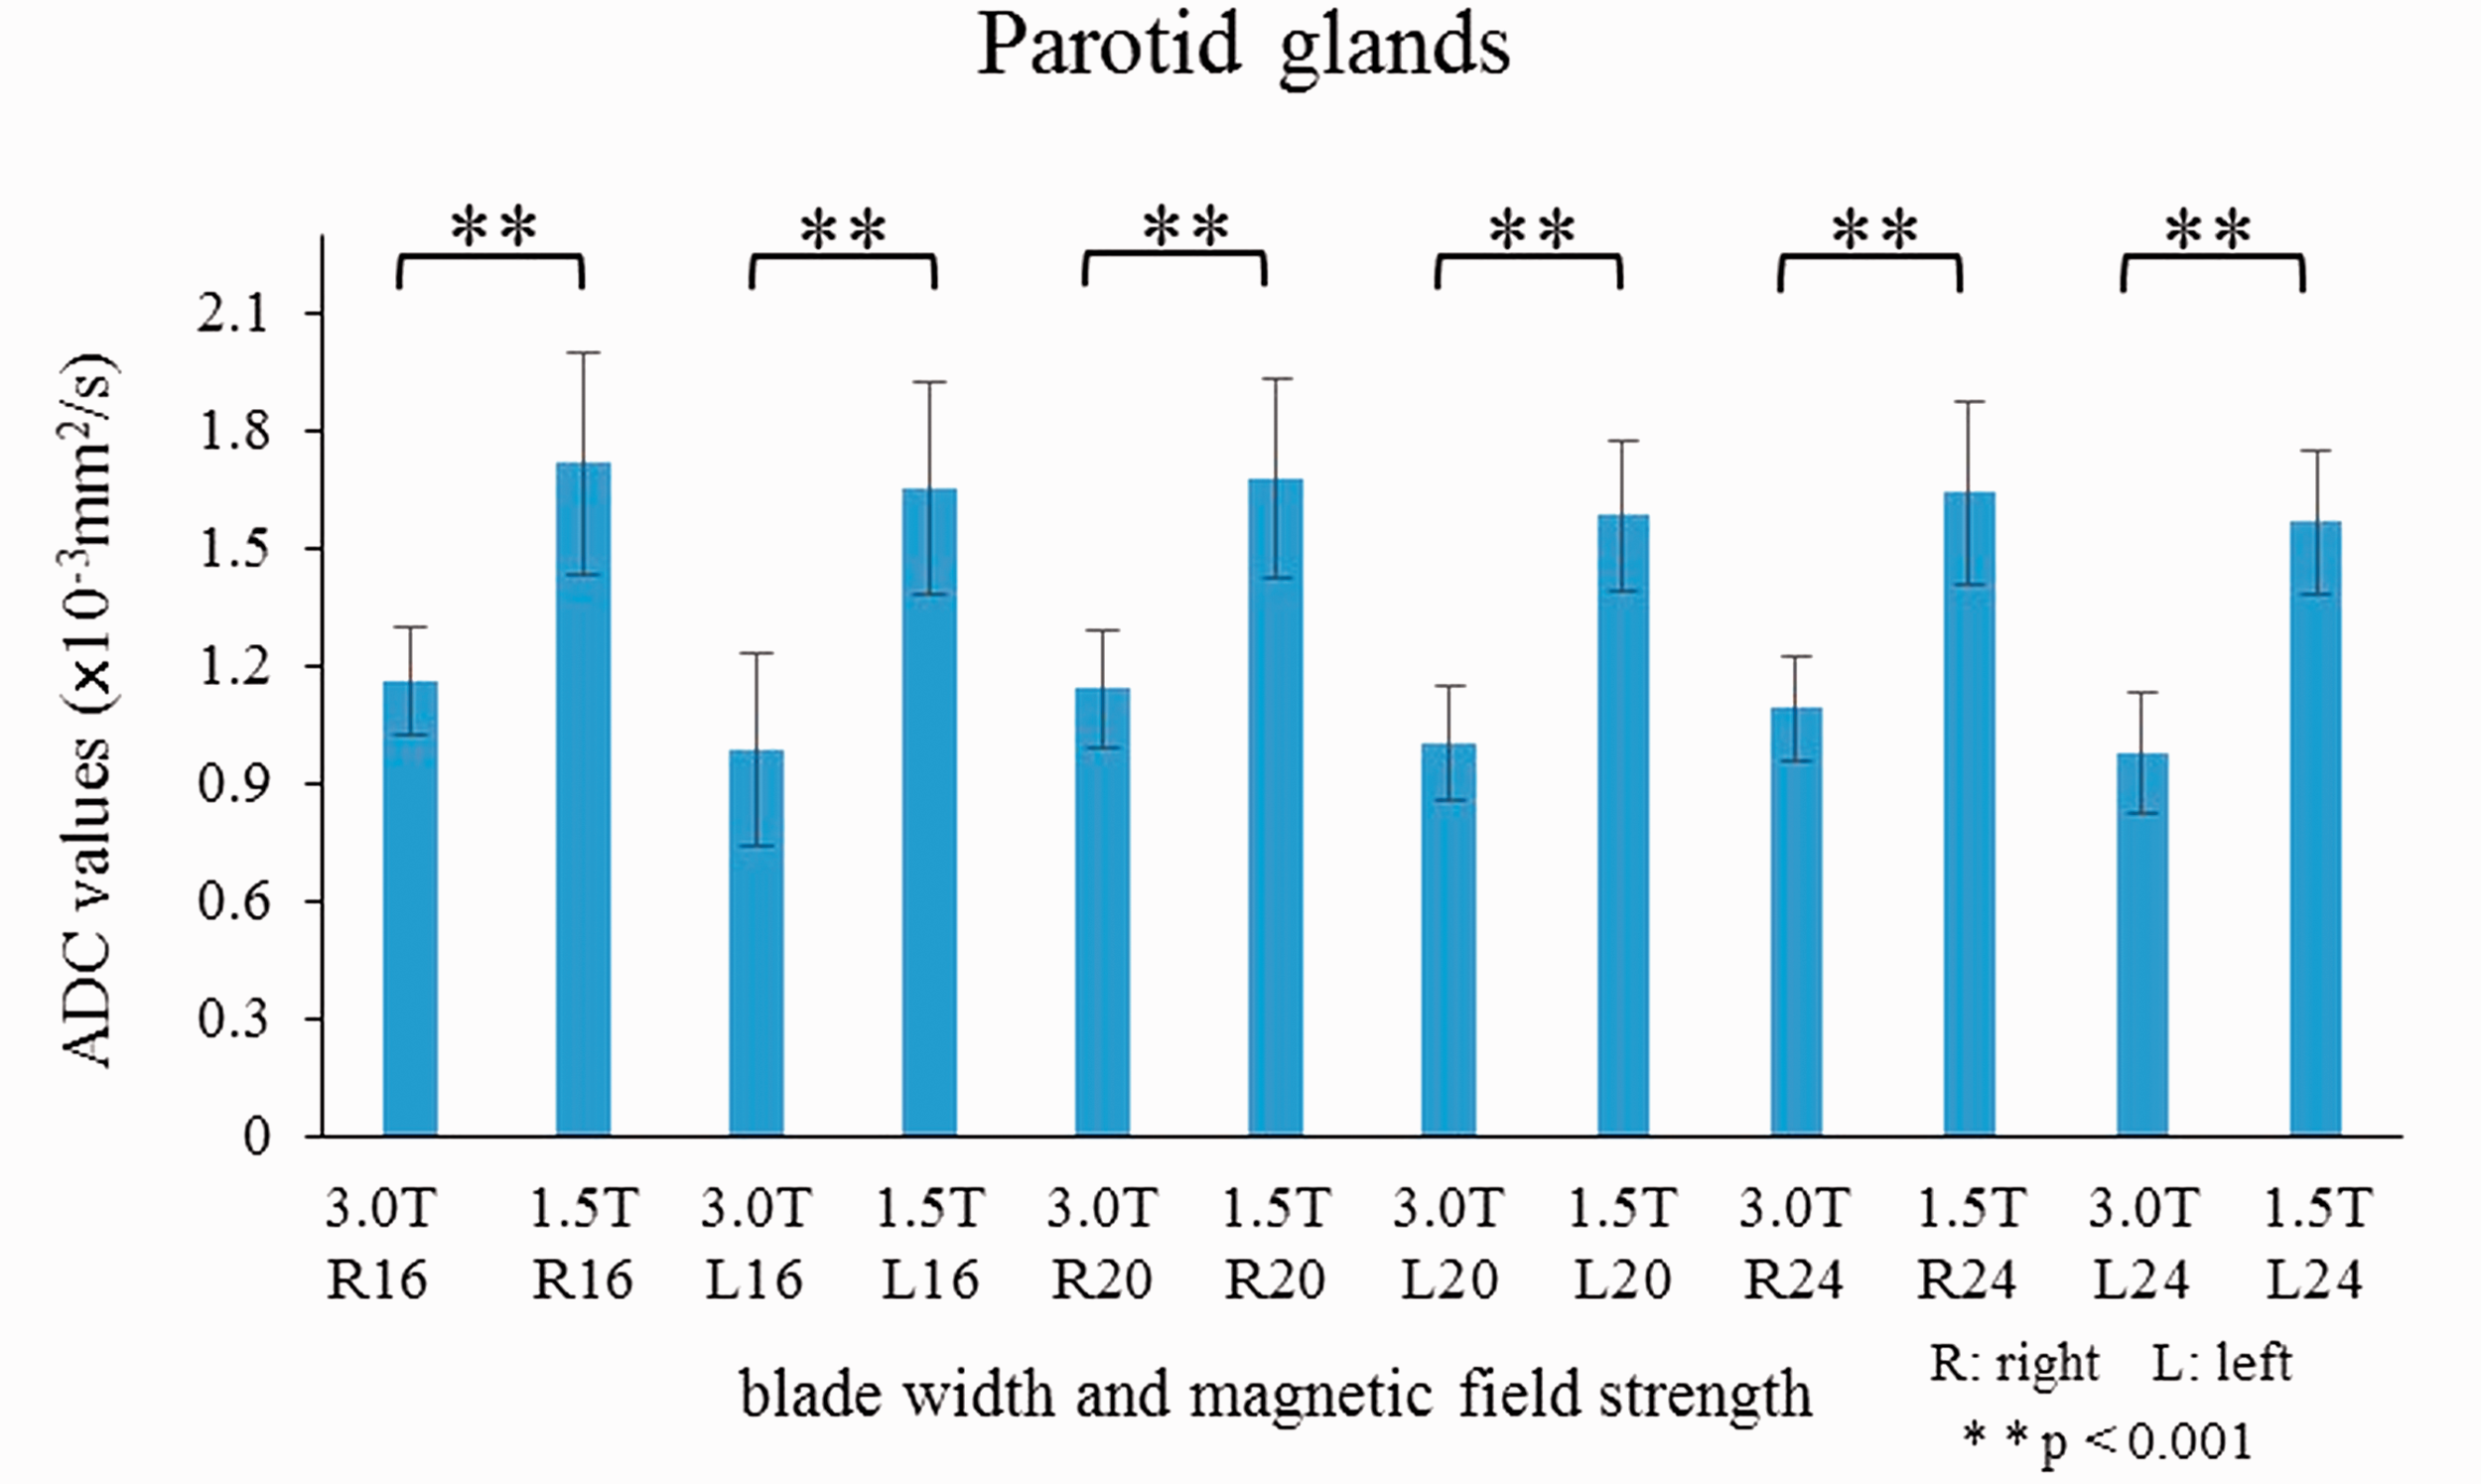
No significant differences were observed in the ADC values of the cerebellum among three or four blade widths at both 1.5 T and 3.0 T (Figures 1 and 2). The ADC values of bilateral parotid glands showed no significant difference among each blade width at 1.5 T (Figure 3). In contrast, the ADC values of the parotid glands were significantly lower for blade width 32 than for blade width 16 at 3.0 T (1.16 × 10⁻³ mm2/s vs. 1.01 × 10⁻³ mm2/s, P < 0.05; Figure 4). For three blade widths (16, 20 and 24), the ADC values from the bilateral cerebellum showed no significant difference between 1.5 T and 3.0 T (Figure 5), whereas the ADC values from the parotid glands at 1.5 T were significantly higher than those at 3.0 T (right parotid glands 1.09–1.16 × 10⁻³ mm2/s vs. 1.64–1.72 × 10⁻³ mm2/s, P < 0.001; left parotid glands 0.98–1.00 × 10⁻³ mm2/s vs. 1.56–1.65 × 10⁻³ mm2/s, P < 0.001; Figure 6).
Mean apparent diffusion coefficient (ADC) values for each blade width of the cerebellum in the 1.5 T magnetic resonance imaging (MRI) unit. There were no significant differences in the ADC values of the cerebellum among the three blade widths in the 1.5 T MRI unit. Mean apparent diffusion coefficient (ADC) values for each blade width of the cerebellum in the 3.0 T magnetic resonance imaging (MRI) unit. There were no significant differences in the ADC values of the cerebellum among the four blade widths in the 3.0 T MRI unit. Mean apparent diffusion coefficient (ADC) values for each blade width of the parotid glands in the 1.5 T magnetic resonance imaging (MRI) unit. There were no significant differences in the ADC values of the bilateral parotid glands among the three blade widths in the 1.5 T MRI unit. Mean apparent diffusion coefficient (ADC) values for each blade width of the parotid glands in the 3.0 T magnetic resonance imaging (MRI) unit. There were significant differences in the ADC values of the bilateral parotid glands for the three blade widths (16, 20 and 24) in the 3.0 T MRI unit (P < 0.05). Furthermore, the ADC values of right parotid glands were significantly lower for blade width 32 than for blade width 16 in 3.0 T MRI unit (P < 0.05). Mean apparent diffusion coefficient (ADC) values for each blade width of the cerebellum at both field strengths. There were no significant differences in the ADC values of the cerebellum between the 1.5 T magnetic resonance imaging (MRI) unit and the 3.0 T MRI unit. Mean apparent diffusion coefficient (ADC) values for each blade width of the parotid glands at both field strengths. There were significant differences in the ADC values of the parotid glands for the three blade widths (16, 20 and 24) between the 1.5 T magnetic resonance imaging (MRI) unit and the 3.0 T MRI unit (P < 0.001).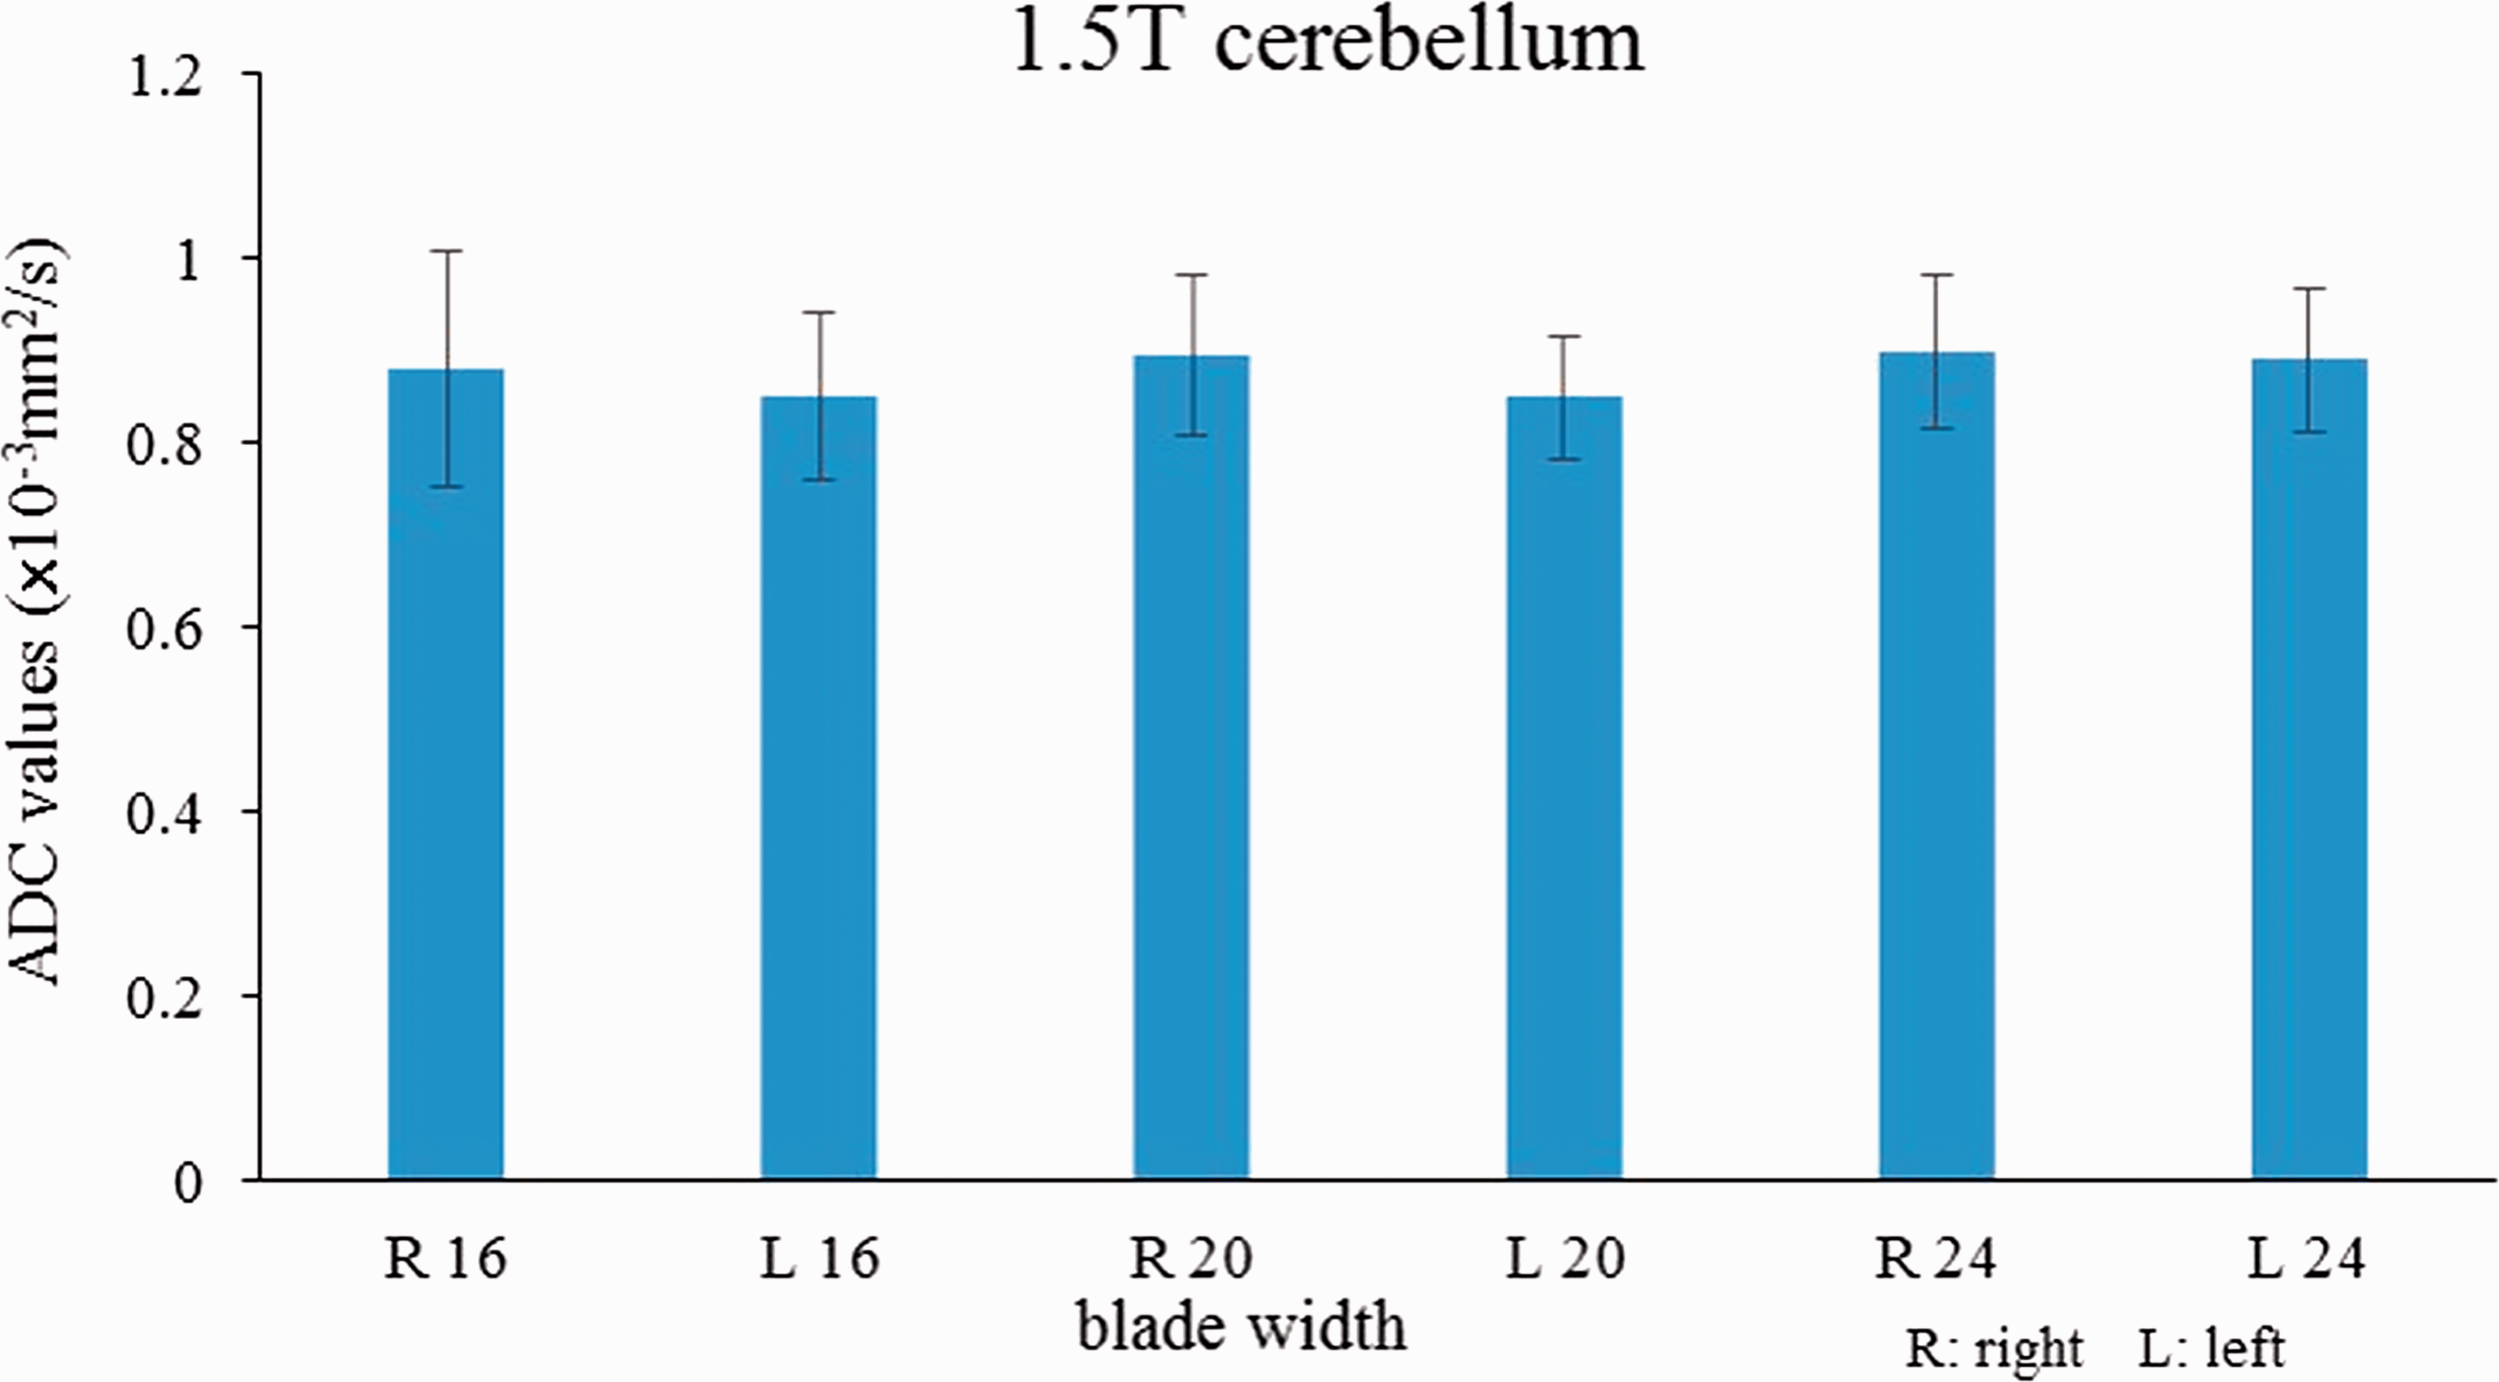
Quantitative analysis of SNR and CV
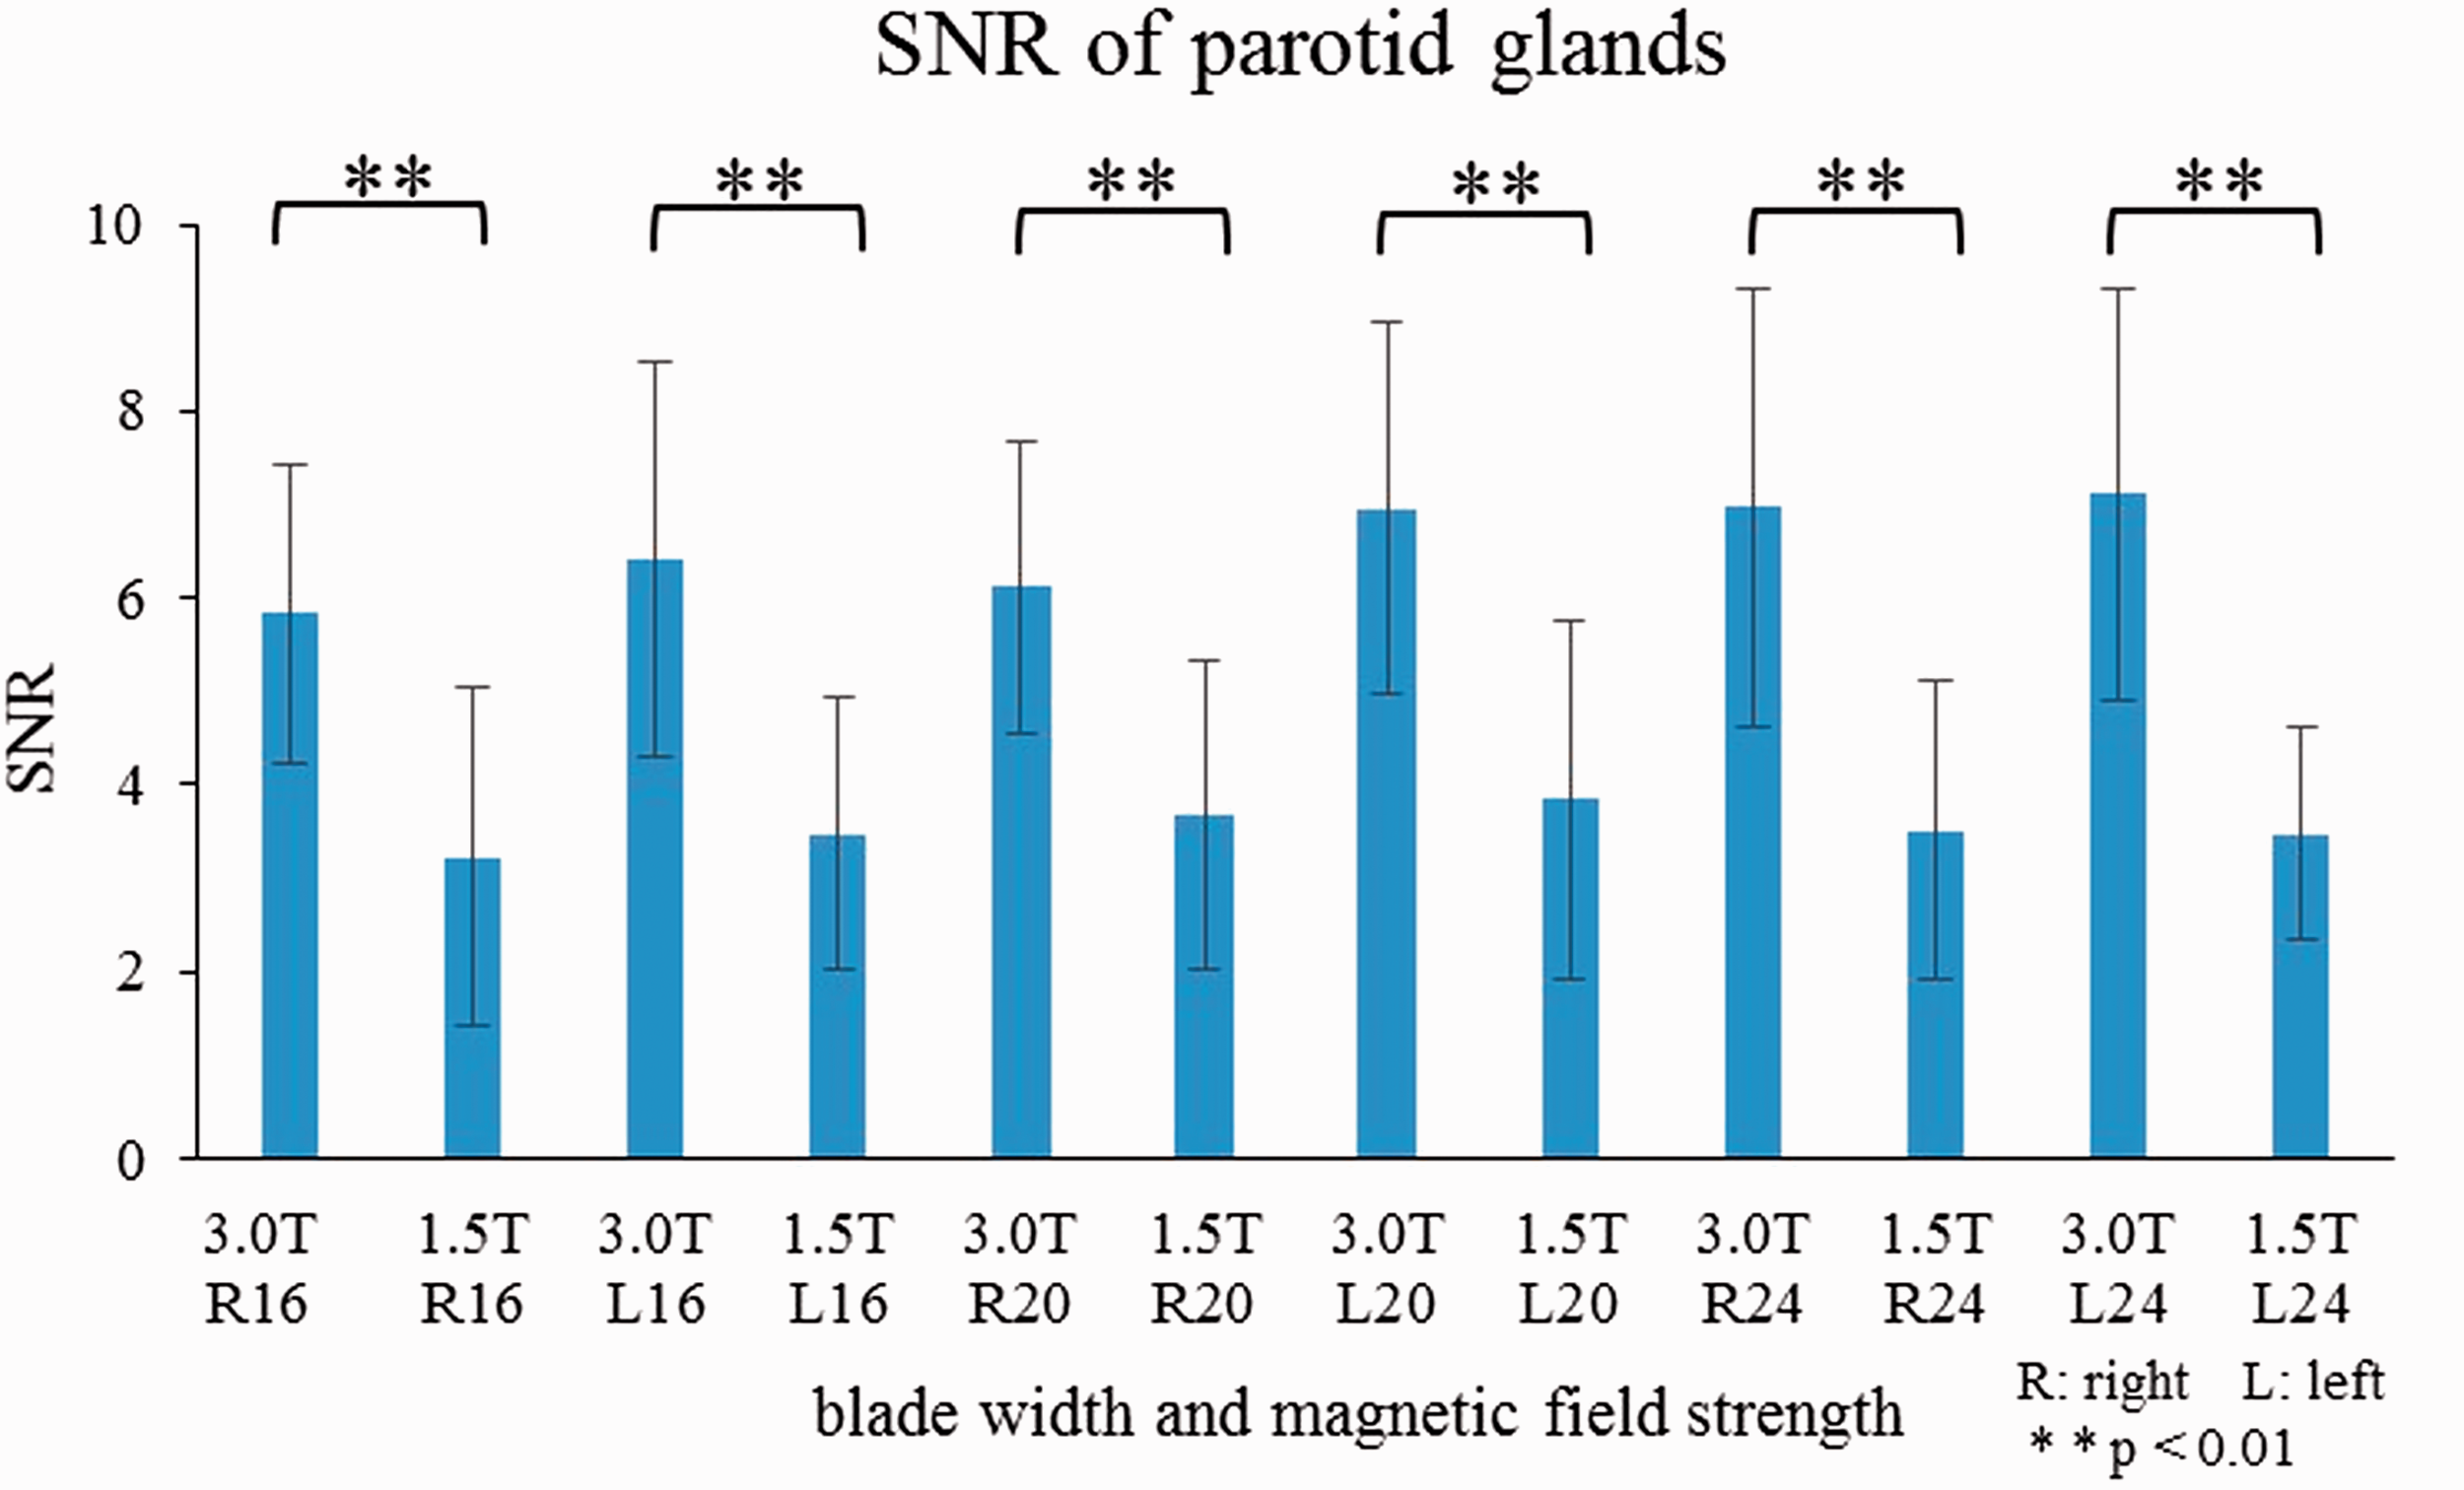
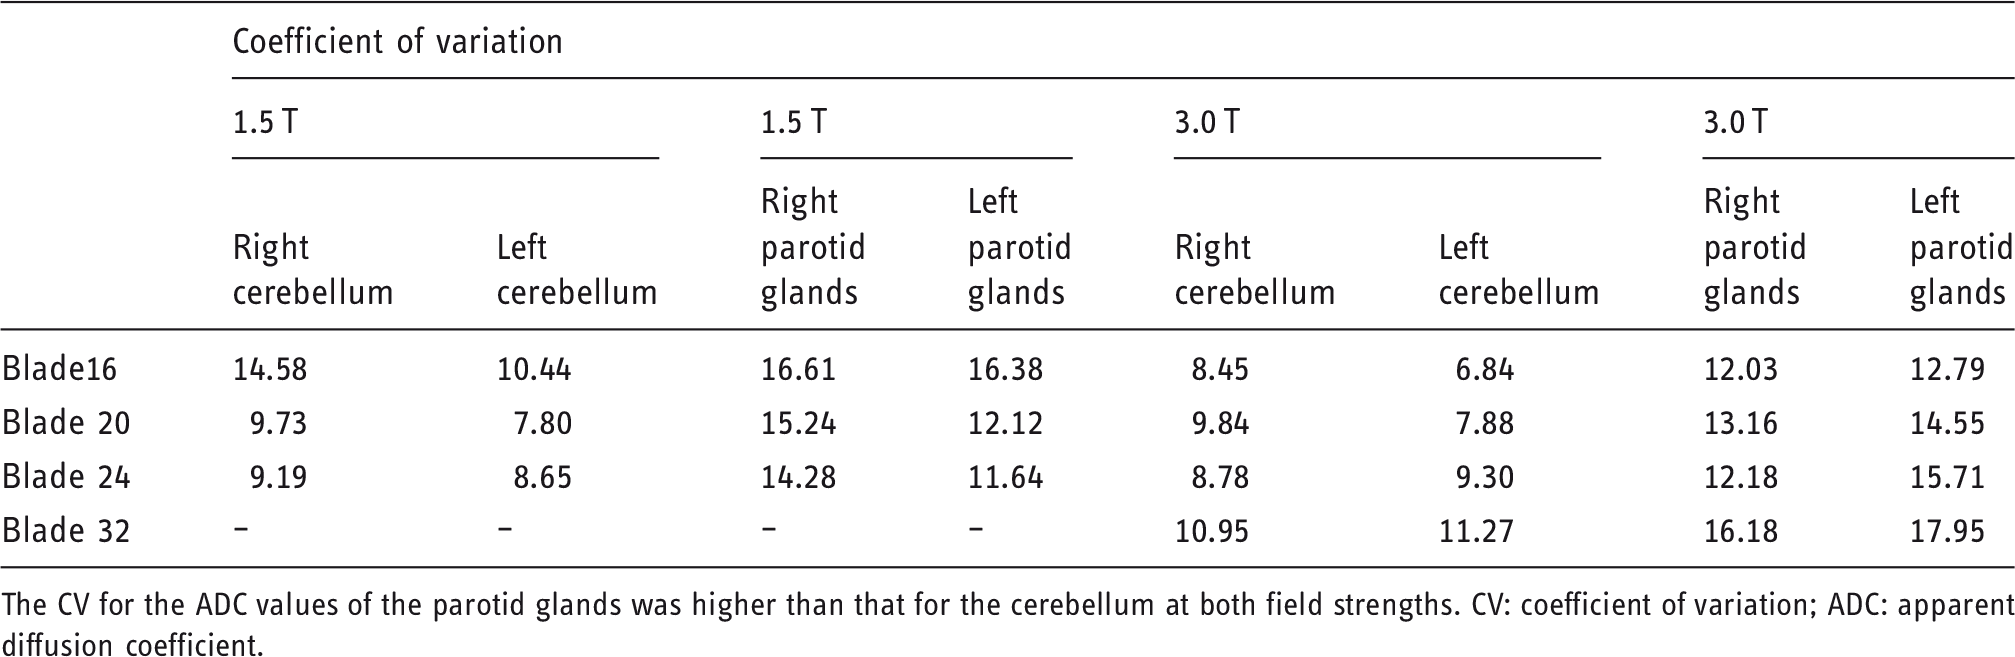
The SNRs of each anatomical region are shown in Figures 7 and 8. The SNR of the cerebellum in the 3.0 T MRI unit were significantly higher than those in the 1.5 T MRI unit, except for the SNR derived from the left cerebellum for blade width 16 (Figure 7). However, the SNRs of the bilateral parotid glands in the 3.0 T MRI unit were significantly higher than those in the 1.5 T MRI unit for the three blade widths (16, 20 and 24) (right parotid glands 5.83 ± 1.6 to 6.96 ± 2.35 vs. 3.27 ± 1.81 to 3.67 ± 2.35, P < 0.01; left parotid glands 6.41 ± 2.12 to 7.12 ± 2.22 vs. 3.47 ± 1.46 to 3.84 ± 1.93, P < 0.01; Figure 8). The CV for the ADC values of the parotid glands was higher than that for the cerebellum in both field strength MRI units (6.84–14.58 vs. 11.64–17.95; Table 1).
Mean signal-to-noise ratio (SNR) for each blade width of the cerebellum at both field strengths. The SNRs were significantly higher at 3.0 T than 1.5 T, but the SNR derived from the left cerebellum showed no significant difference for blade width 16. Mean signal-to-noise ratio (SNR) for each blade width of the parotid glands at both field strengths. The SNRs were significantly higher at 3.0 T than at 1.5 T (P < 0.01). The CV for the ADC values of the bilateral cerebellum and parotid glands at both field strengths. The CV for the ADC values of the parotid glands was higher than that for the cerebellum at both field strengths. CV: coefficient of variation; ADC: apparent diffusion coefficient.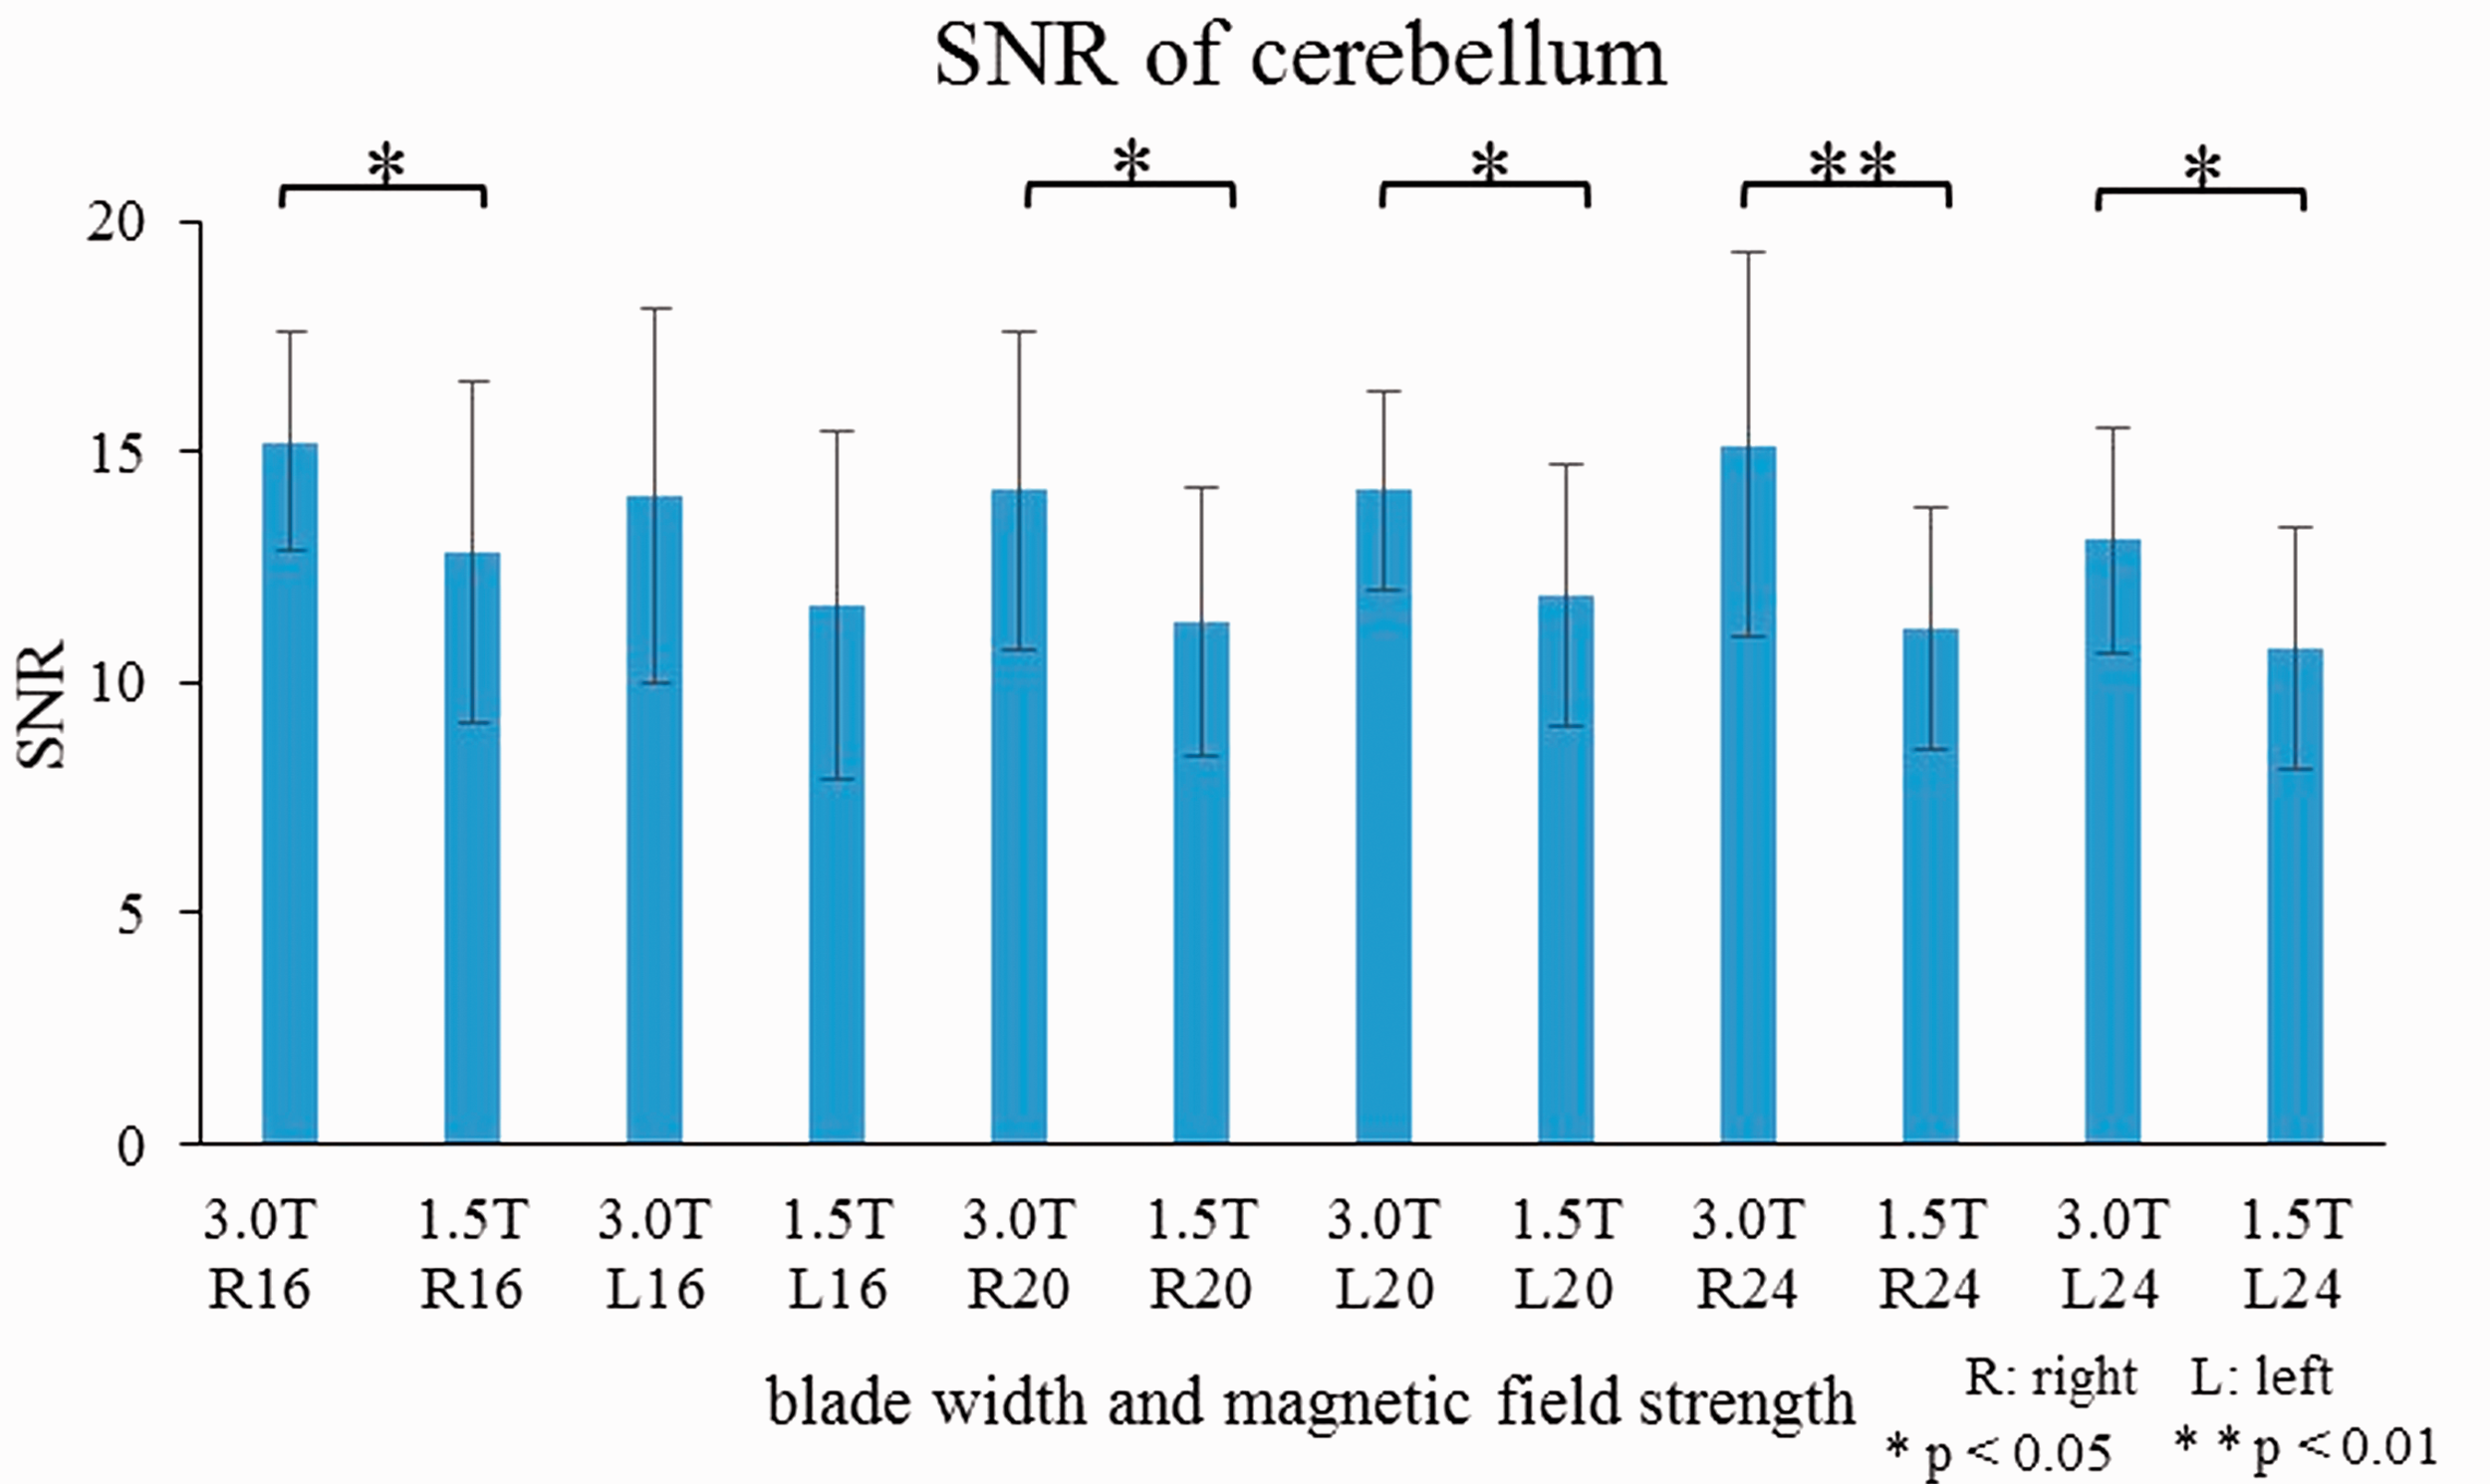
Inter and intra-observer agreement
Inter-observer reliability of bilateral ADC measurements of the cerebellum and parotid glands at both field strengths.
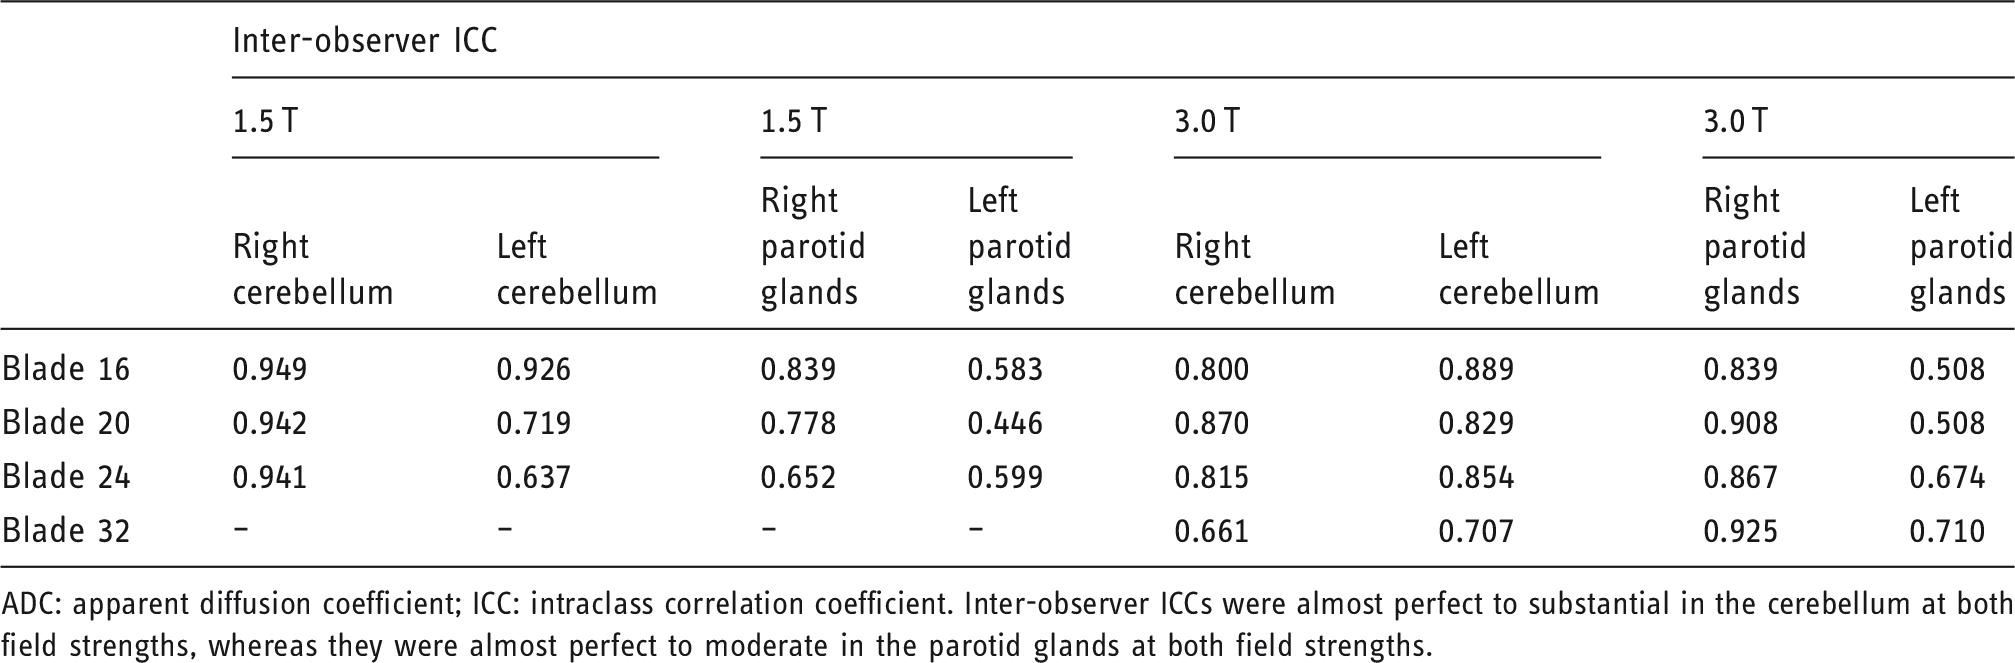
ADC: apparent diffusion coefficient; ICC: intraclass correlation coefficient.
Inter-observer ICCs were almost perfect to substantial in the cerebellum at both field strengths, whereas they were almost perfect to moderate in the parotid glands at both field strengths.
Intra-observer reliability of bilateral ADC measurements of the cerebellum and parotid glands at both field strengths.
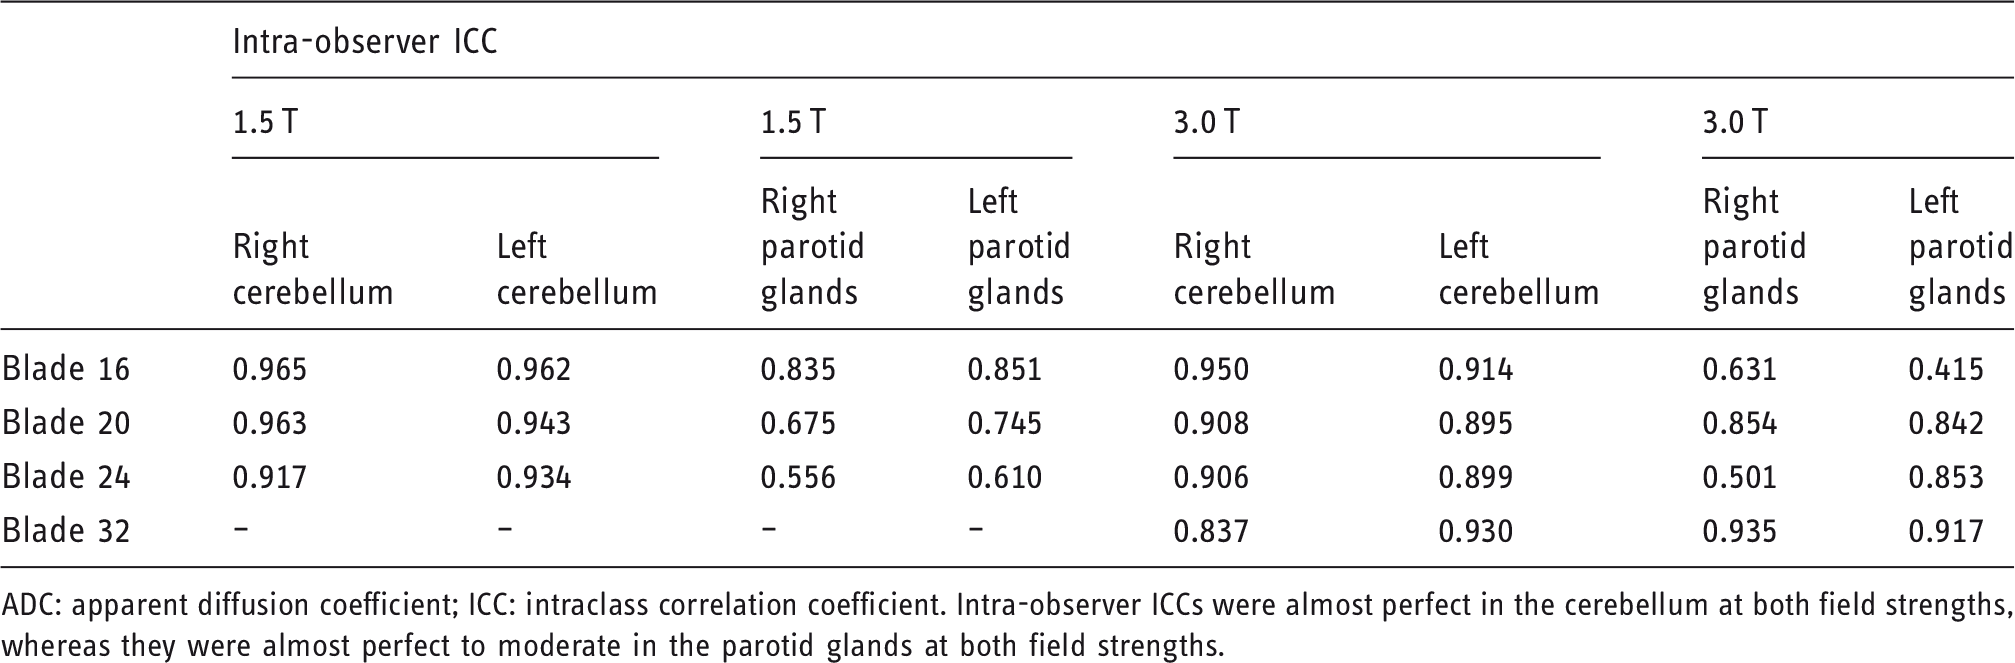
ADC: apparent diffusion coefficient; ICC: intraclass correlation coefficient.
Intra-observer ICCs were almost perfect in the cerebellum at both field strengths, whereas they were almost perfect to moderate in the parotid glands at both field strengths.
Discussion
Several studies have reported that PROPELLER DWI provides less distorted images.17–19 Therefore, PROPELLER DWI might be able to measure ADC values more accurately. However, it has not been shown if the magnetic field strength affects the ADC values derived from PROPELLER DWI. In addition, little is known about whether the blade width affects the ADC values in PROPELLER DWI. The variability of ADC values depending on the blade width might lead to misdiagnosis or inappropriate management of patients in clinical practice. Therefore, it is important to understand how blade width influences the ADC value. This is the first study to investigate the relationship between blade width and magnetic field strength and the ADC values on PROPELLER DWI.
Our results indicated that both blade width and magnetic field strength affected the ADC values of the parotid glands derived from PROPELLER DWI. Moreover, the ADC values varied depending on the anatomical site. Pipe et al. described that blade width can be regarded as the echo train length; therefore the number of blade bundles decrease as the blade width increases under the fixed matrix size. 8 Therefore, we speculate that the number of motion-probing diffusion gradients (MPGs) decreased because of the increase in the blade width. Thus, decreased MPGs may lead to a decrease in phase dispersion especially in the region sensitive to susceptibility artifacts such as the parotid gland. It causes a subsequent increased signal intensity at a DWI of b = 1000 s/mm2. As a result, the ADC values decreased for PROPELLER DWI with a high blade width. Consequently, the ADC values of the parotid glands might have been affected by the blade width more than those of the cerebellum.
Our results also showed that the ADC values of the parotid glands were significantly different between the 1.5 T and 3 T MRI scanners, whereas those of the cerebellum showed no significant difference. These results suggest that the ADC values vary depending on the field strength, whereas variation in ADC values seems to depend on anatomical site. A previous study reported that the ADC values were significantly different depending on the field strength and vendor, 6 although another study reported that the ADC values showed no significant difference among different field strengths and vendors. 20
DWI in head and neck at 3 T will improve the image quality and enables acquisition using high b values, which could remove the influence of perfusion on ADC values. These advantages might allow the characterisation of various tumours.21,22 Our study also revealed that the SNRs were higher from the 3.0 T MRI scanner than from the 1.5 T MRI scanner, consistent with a previous study. 7
Another study reported that the reproducibility of ADC value measurements was poor in the head and neck region. 23 Our study revealed that CVs for the ADC values in the parotid glands were higher than those in the cerebellum at both field strengths. The ADC values from the cerebellum seemed to be relatively stable compared with those from the parotid glands. These results may be because of the variation in saliva production and the fat content of the parotid glands in healthy volunteers.25,26
DWI can differentiate lymphoma from squamous cell carcinomas in the head and neck and can predict therapeutic effect after chemo-radiotherapy. They are both clinically important information. 27 Recent advanced studies of DWI provided diffusion tensor imaging (DTI), diffusion kurtosis imaging (DKI) and intravoxel incoherent motion (IVIM). These techniques have a short acquisition time and non-invasive procedure, therefore they can be combined with routine MRI examination. These advanced DWIs enable accurate staging of malignant tumours and characterisation of salivary gland tumours. 28
This study has several limitations. First, the perfusion effect could not be completely eliminated in ADC value measurement in our study. However, another study reported that the perfusion effect of the parotid glands might be cancelled out when the ADC values are derived from DWI with high b values, equal to or larger than 1000 s/mm2. 14 Second, complete fat suppression could not be achieved by the chemical selective method used in this study. Incomplete fat suppression might cause the higher ADC values in the parotid glands and consequently higher CVs. 26 Third, this study examined only a small number of healthy volunteers who did not have lesions with diffusion restriction. The present findings might not be applicable for patients with lesions. Therefore, our results must be investigated by a large number of patients with various diseases in a further study.
In conclusion, the largest blade width 32 at 3.0 T and high magnetic field strength lowered the ADC values of parotid glands of PROPELLER DWI.
Footnotes
Funding
This research received no specific grant from any funding agency in the public, commercial, or not-for-profit sectors.
Conflict of interest
The authors declared no potential conflicts of interest with respect to the research, authorship, and/or publication of this article.