
Abstract
Objective
The aim of this study was to differentiate suprasellar germinomas from chiasmatic/hypothalamic gliomas (CHGs) using apparent diffusion coefficient (ADC) values and magnetic resonance imaging (MRI) characteristics.
Materials and methods
A cross-sectional study was conducted on 11 patients with suprasellar germinomas and 11 patients with CHGs who underwent pretreatment MRI. The ADC values (minimum and average ADC values) of the tumors were measured and the MRI characteristics were evaluated.
Results
The average and minimum ADC values of suprasellar germinomas were significantly lower than those of CHGs (p = 0.016 and 0.004 respectively). The selection of 941.15 × 10⁻⁶ mm2/s as a cutoff value of the minimum ADC value was used to differentiate suprasellar germinomas and CHGs; the best results were obtained with area under the curve of 0.889, sensitivity of 87.5%, specificity of 77.8% and accuracy of 82.4%. MRI characteristics suggested the diagnosis of suprasellar germinomas were T2W hypointensity and involvement of pituitary gland and/or stalk. MRI characteristics suggested the diagnosis of CHGs was higher degree of contrast enhancement and presence of macrocysts.
Conclusion
ADC values have a role in differentiating suprasellar germinomas and CHGs, especially when imaging findings on conventional MRI are inconclusive. Furthermore, some MRI features are in favor of differentiation between these tumor entities including tumor location, cyst pattern, T2W hypointensity, degree of contrast enhancement, stalk and pituitary gland involvement.
Introduction
Among the various histologic types of suprasellar tumors occurring during childhood and young adulthood, chiasmatic/hypothalamic glioma (CHG) and suprasellar germ cell tumors (GCTs) are the most frequent tumors that have overlapping imaging findings.1,2 The prognosis and treatment of these tumors are different.1,3,4 Therefore, preoperative diagnosis facilitates appropriate treatment planning.
Intracranial GCTs account for approximately 3% of primary pediatric brain tumors.5,6 The suprasellar region is the second most common region for GCTs following the pineal region.5,7 GCTs can be divided into germinomas and non-germinomatous germ cell tumors (NGGCTs).5,8 Histopathologic appearance of the classic germinoma shows high cellularity with densely packed tumor cells interspersed by fibrous tissue with lymphocytes. 9 Germinomas are radiosensitive and carry a favorable prognosis. More than 90% of germinomas were effectively treated with radiation.3,5,10,11
The CHGs account for 2–5% of childhood brain tumors. 12 Most of the CHGs are low-grade or pilocytic astrocytomas, showing low cellularity.2,4,13 Tumors may grow slowly and occasionally regress spontaneously. 14 Treatment option includes observation, surgical resection, chemotherapy or radiation that was determined by the severity of symptoms, tumor size, NF1 status and age.15,16
Diffusion-weighted imaging (DWI) assesses microscopic water diffusion within the tissue, and apparent diffusion coefficient (ADC) maps represent average diffusion for each voxel. Diffusion of water molecules decreases in densely packed cerebral tissue with high cellularity, small extracellular space and high nuclear-to-cytoplasmic ratio. Accordingly, the ADC values in brain tumors are inversely correlated to cellularity and the nuclear-to-cytoplasmic ratio. The role of DWI and ADC for differentiation of various types of brain tumors has been evaluated.9,17
Diffusion tensor imaging (DTI) assesses diffusion of water in brain tissue within three main directions, with the most common metrics are mean diffusivity and fractional anisotropy. The mean diffusivity reveals the rate of water molecules’ diffusional motion, which has an inverse relationship with the cellularity. The fractional anisotropy expresses the orientation of the tissue microstructure and is related to the structural orientation of different tissues. Some studies have reported that DTI metrics can be used to differentiate low-grade glioma from high-grade glioma, 18 glioblastomas from solitary brain metastases 19 and residual/recurrent gliomas from postradiation necrosis. 20
To our best knowledge, there has been no study on ADC values in differentiating between suprasellar germinomas and CHGs. Therefore, the objective of this study was to differentiate these tumors based on ADC values and magnetic resonance imaging (MRI) characteristics. We have proposed to compare ADC values and MRI characteristics between suprasellar germinomas and CHGs, and to determine sensitivity, specificity, accuracy, positive predictive value (PPV), and negative predictive value (NPV) of using ADC value cutoff point for diagnosis of suprasellar germinomas.
Materials and methods
Patient population
This cross-sectional study was conducted in the department of diagnostic and therapeutic radiology of Ramathibodi Hospital. The study was approved by the institutional ethics committee board. Informed consent was not obtained. The study included 22 patients with histopathological diagnosis of suprasellar germinomas (11 patients) or CHG (11 patients) who underwent pretreatment MRI examination between January 2005 and December 2016. MRI characteristics were evaluated. For ADC measurement, we excluded five patients from the study because four patients had performed MRI from another institute and one patient had too small a lesion. Finally, 17 patients (nine germinomas and eight CHGs) were included for ADC measurement.
Imaging techniques
MRI was performed on 1.5-T (Signa; GE Medical Systems, Milwaukee, Wisconsin, USA) and 3-T scanners (Philips Intera, Philips Medical Systems, Best, Netherlands). On the 3-T scanner, the following sequences were acquired: axial FLAIR FS+Gd (TR/TE, 4800/326); axial TSE T2-weighted image (WI; TR/TE, 4158/86; flip angle, 90°); axial SWI (TR/TE, 31/10 ms; section thickness, 2.0 mm; flip angle, 17°); axial TSE T1-weighted image (TR/TE, 662/10; flip angle, 70°) with and without Gd-DTPA; thin slice sagittal and coronal SE T2W FS, SE T1W FS with and without Gd-DTPA at the sellar region. DWI was performed using a single-shot echoplanar imaging pulse sequence (TR/TE, 3000/90 ms). Diffusion-sensitizing gradients were applied sequentially along the three orthogonal planes, and images were obtained at b values of 0 and 1000 m/s.
On the 1.5-T scanner, the following sequences were acquired: axial FLAIR FS + Gd (TR/TE, 9000/127); axial TSE T2-weighted image (WI; TR/TE, 2500/88; flip angle, 90°); axial SWI (TR/TE, 78/47 ms; section thickness, 1.5 mm; flip angle, 15°); axial TSE T1-weighted image (TR/TE, 400/14; flip angle, 90°) with and without Gd-DTPA; thin slice sagittal and coronal SE T2W FS, SE T1W FS with and without Gd-DTPA at the sellar region. DWI was performed using a single-shot echoplanar imaging pulse sequence (TR/TE, 8000/90 ms). Diffusion-sensitizing gradients were applied sequentially along the three orthogonal planes, and images were obtained at b values of 0 and 1,000 m/s. ADC maps were generated for all patients using our vendors’ standard software.
ADC value measurement
The ADC value measurements were performed at the PACS workstation two times, with a two-month interval between sessions, by a second-year neuroradiology fellowship colleague. The observer was blinded to the tumor histology and the previous measurement.
For each patient, the enhancing solid component of the tumor was identified on post-gadolinium T1W images and matching ADC maps. Three non-overlapped regions of interest (ROIs) of 20–100 mm2 were manually positioned in the enhancing solid portion. The first and the second ROIs were placed over the lowest and the highest intensity within the solid portion identified on the ADC map, respectively. The last ROI was placed over the moderate intensity within the solid portion identified on the ADC map. All of the ROIs were placed on different sections or the same section avoiding overlapping ROI (Figure 1). The ADC values were automatically calculated on the PACS workstation, and three lesion ROIs were averaged and used as average tumor ADC value. The minimum ADC value for each patient was also collected.
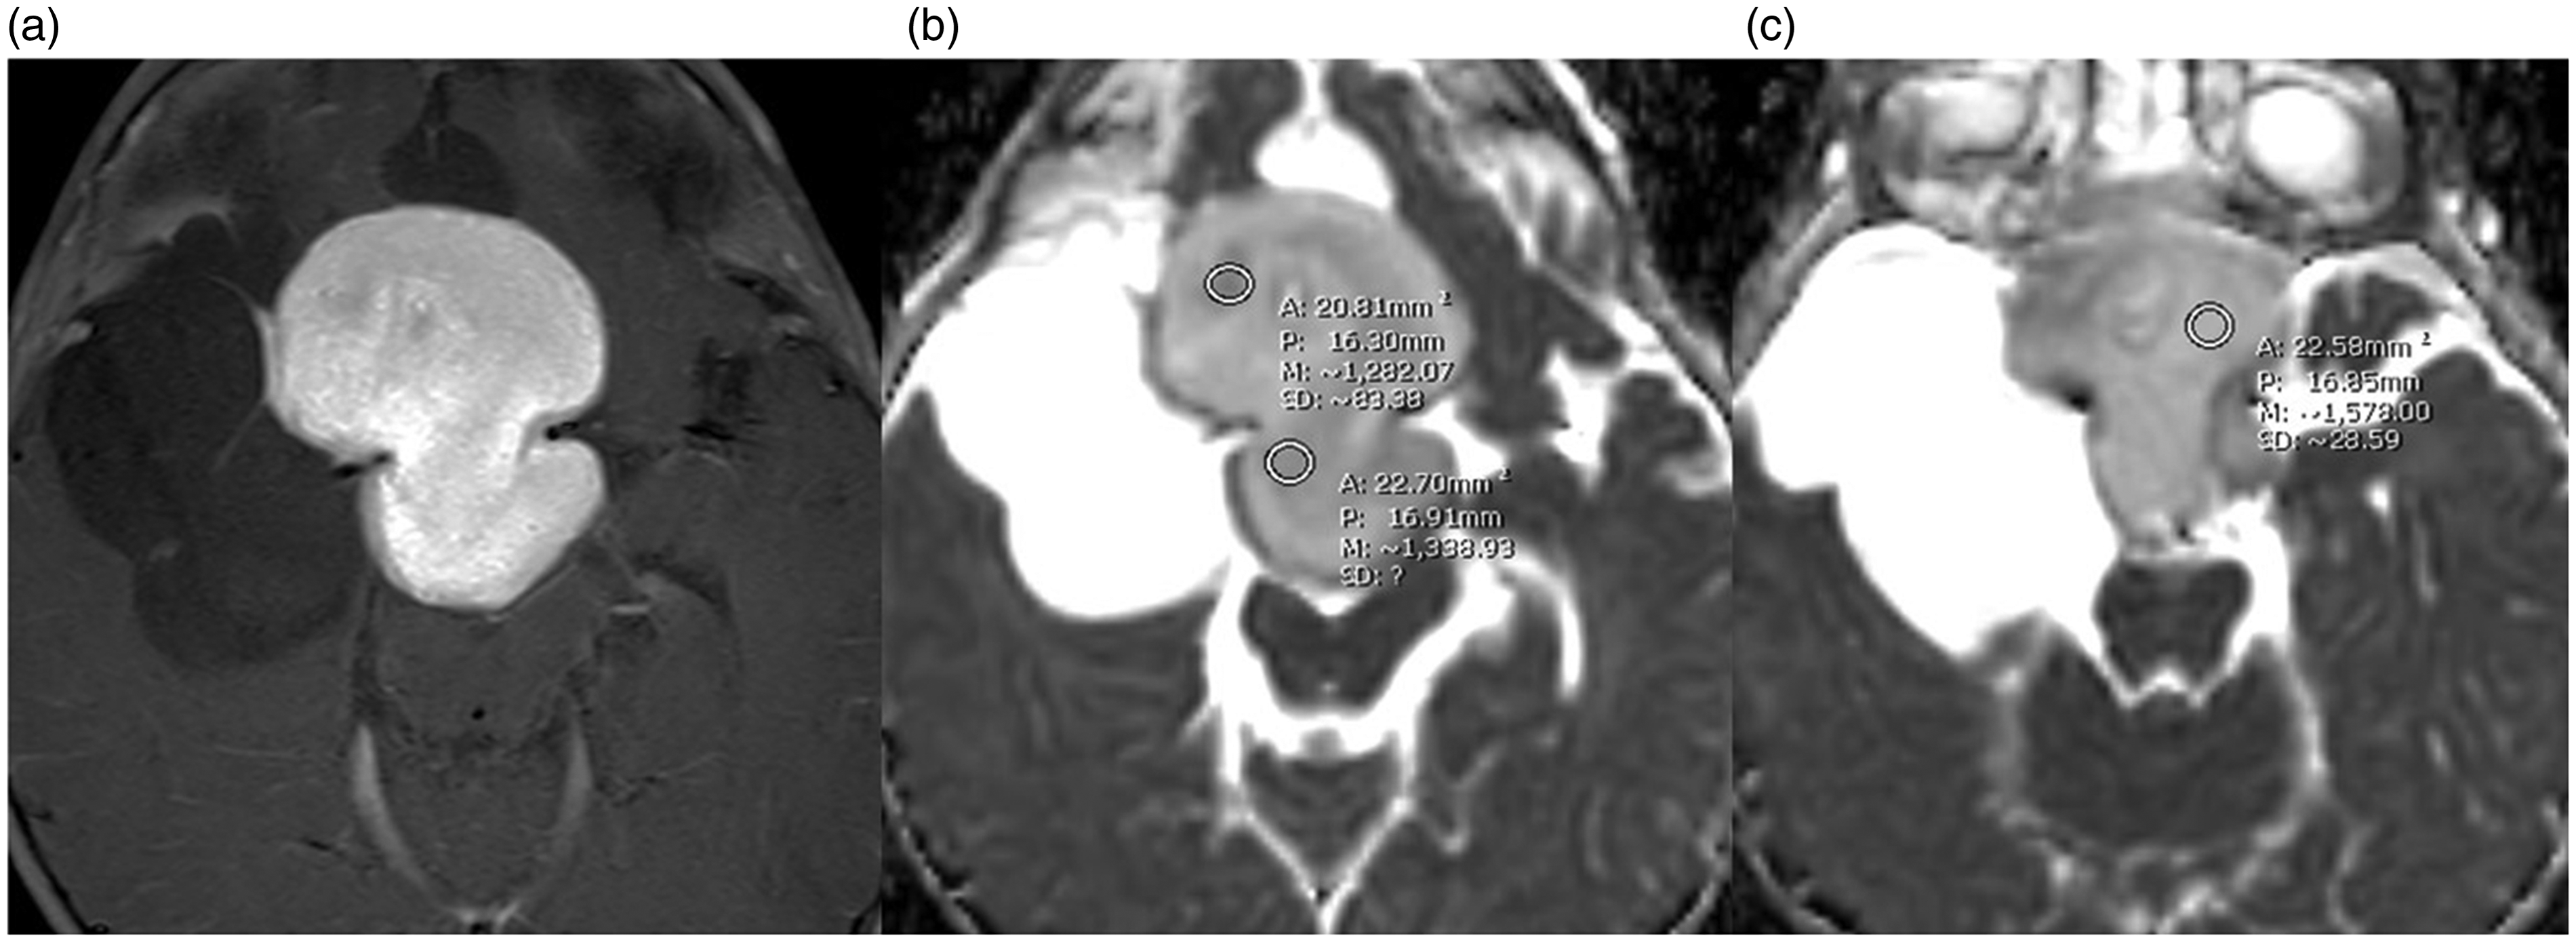
Measurement of the apparent diffusion coefficient (ADC) values by identifying enhancing solid portion on axial post-gadolinium T1W image (a) and drawing three regions of interest on an ADC map images (b) and (c).
For the control, three ROIs were placed in the normal-appearing cerebellum and bilateral centrum semiovale (three-region-of-interest method; Figure 2). Then, they were averaged and used as the control ADC value. Finally, the normalized ADC value was calculated as the ratio of the tumor ADC value to the control ADC value.9,21
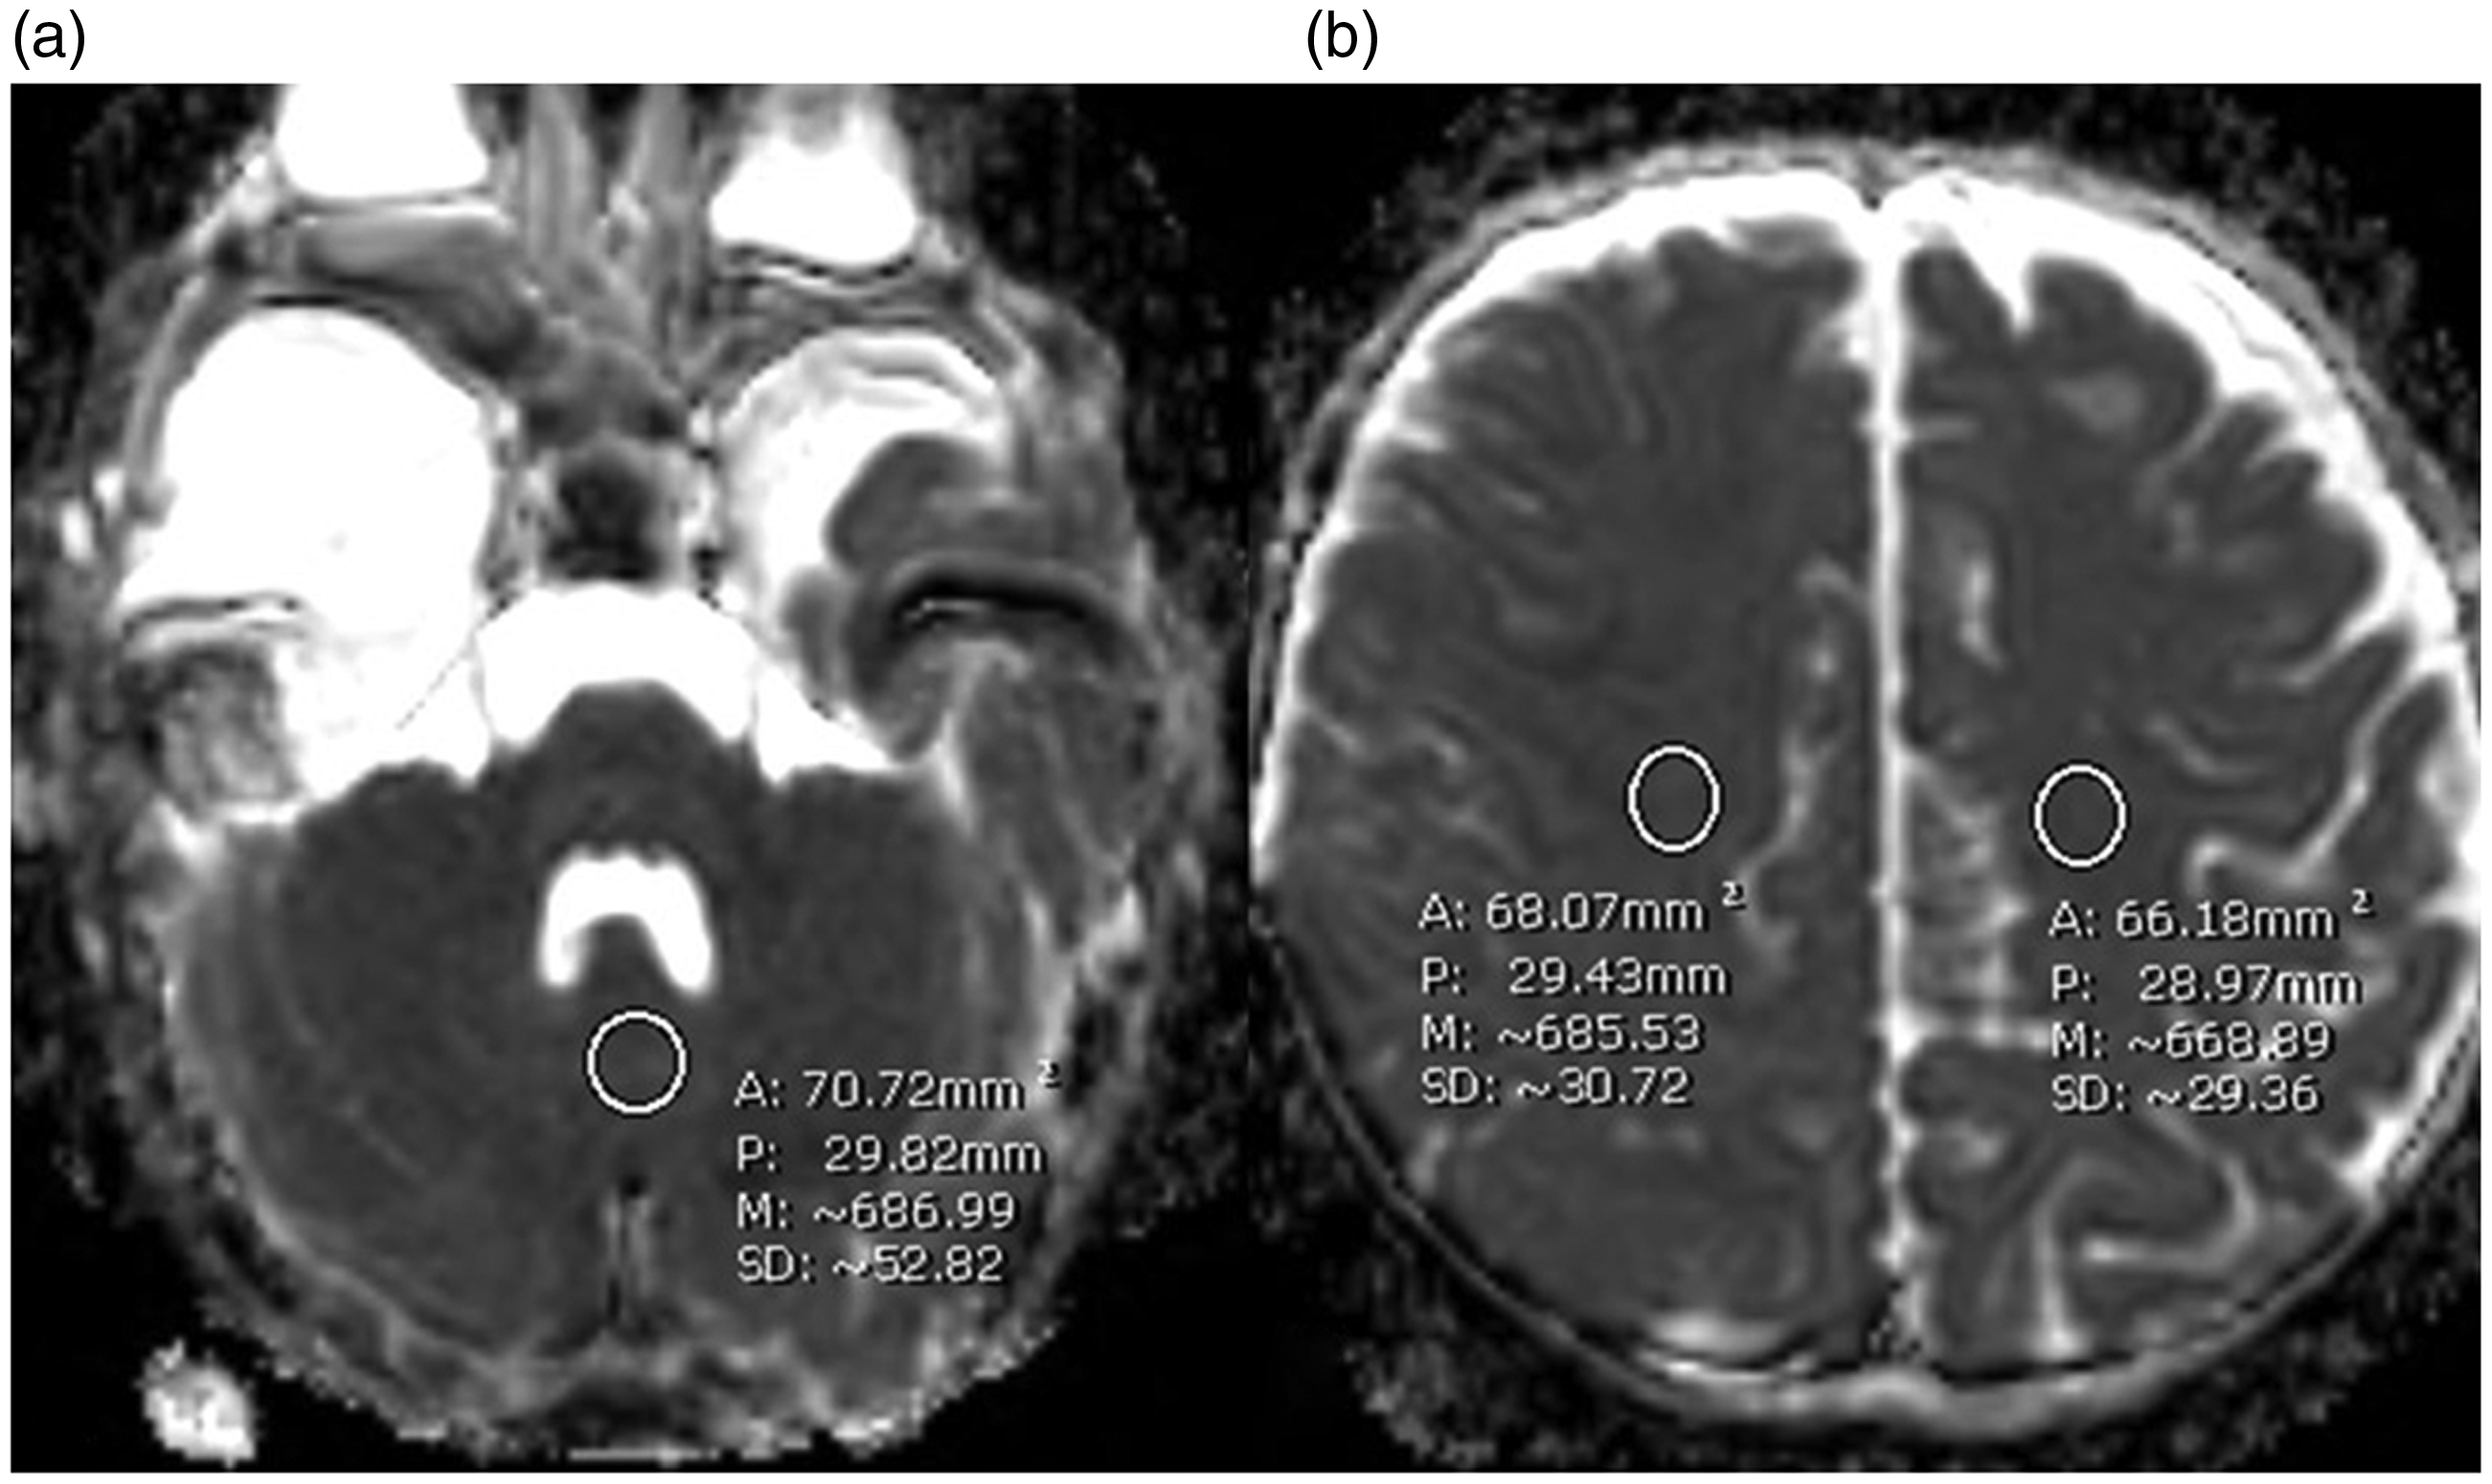
Measurement of the control apparent diffusion coefficient (ADC) value by drawing three regions of interest (ROIs) on an ADC map images at the normal-appearing cerebellum (a) and bilateral centrum semiovale (b). The three ROIs were averaged to be the control ADC value.
MRI characteristics analysis
The MRI findings were independently reviewed at the PACS workstation by two neuroradiologists, one with six and one with five years of experience in brain MRI. Both radiologists were blinded to patient information and final diagnosis. The MRI findings included border, shape and location of the tumor, percent of solid component, cyst pattern, presence of susceptibility foci, T1W hyperintensity, T2W hypointensity, degree and pattern of enhancement of the solid portion, pituitary stalk thickening, pituitary gland involvement, pineal synchronous lesion, cerebrospinal fluid (CSF) seeding and optic pathway involvement. Any discrepancy in the interpretation was resolved by consensus. The degree of contrast enhancement is shown in Figure 3.
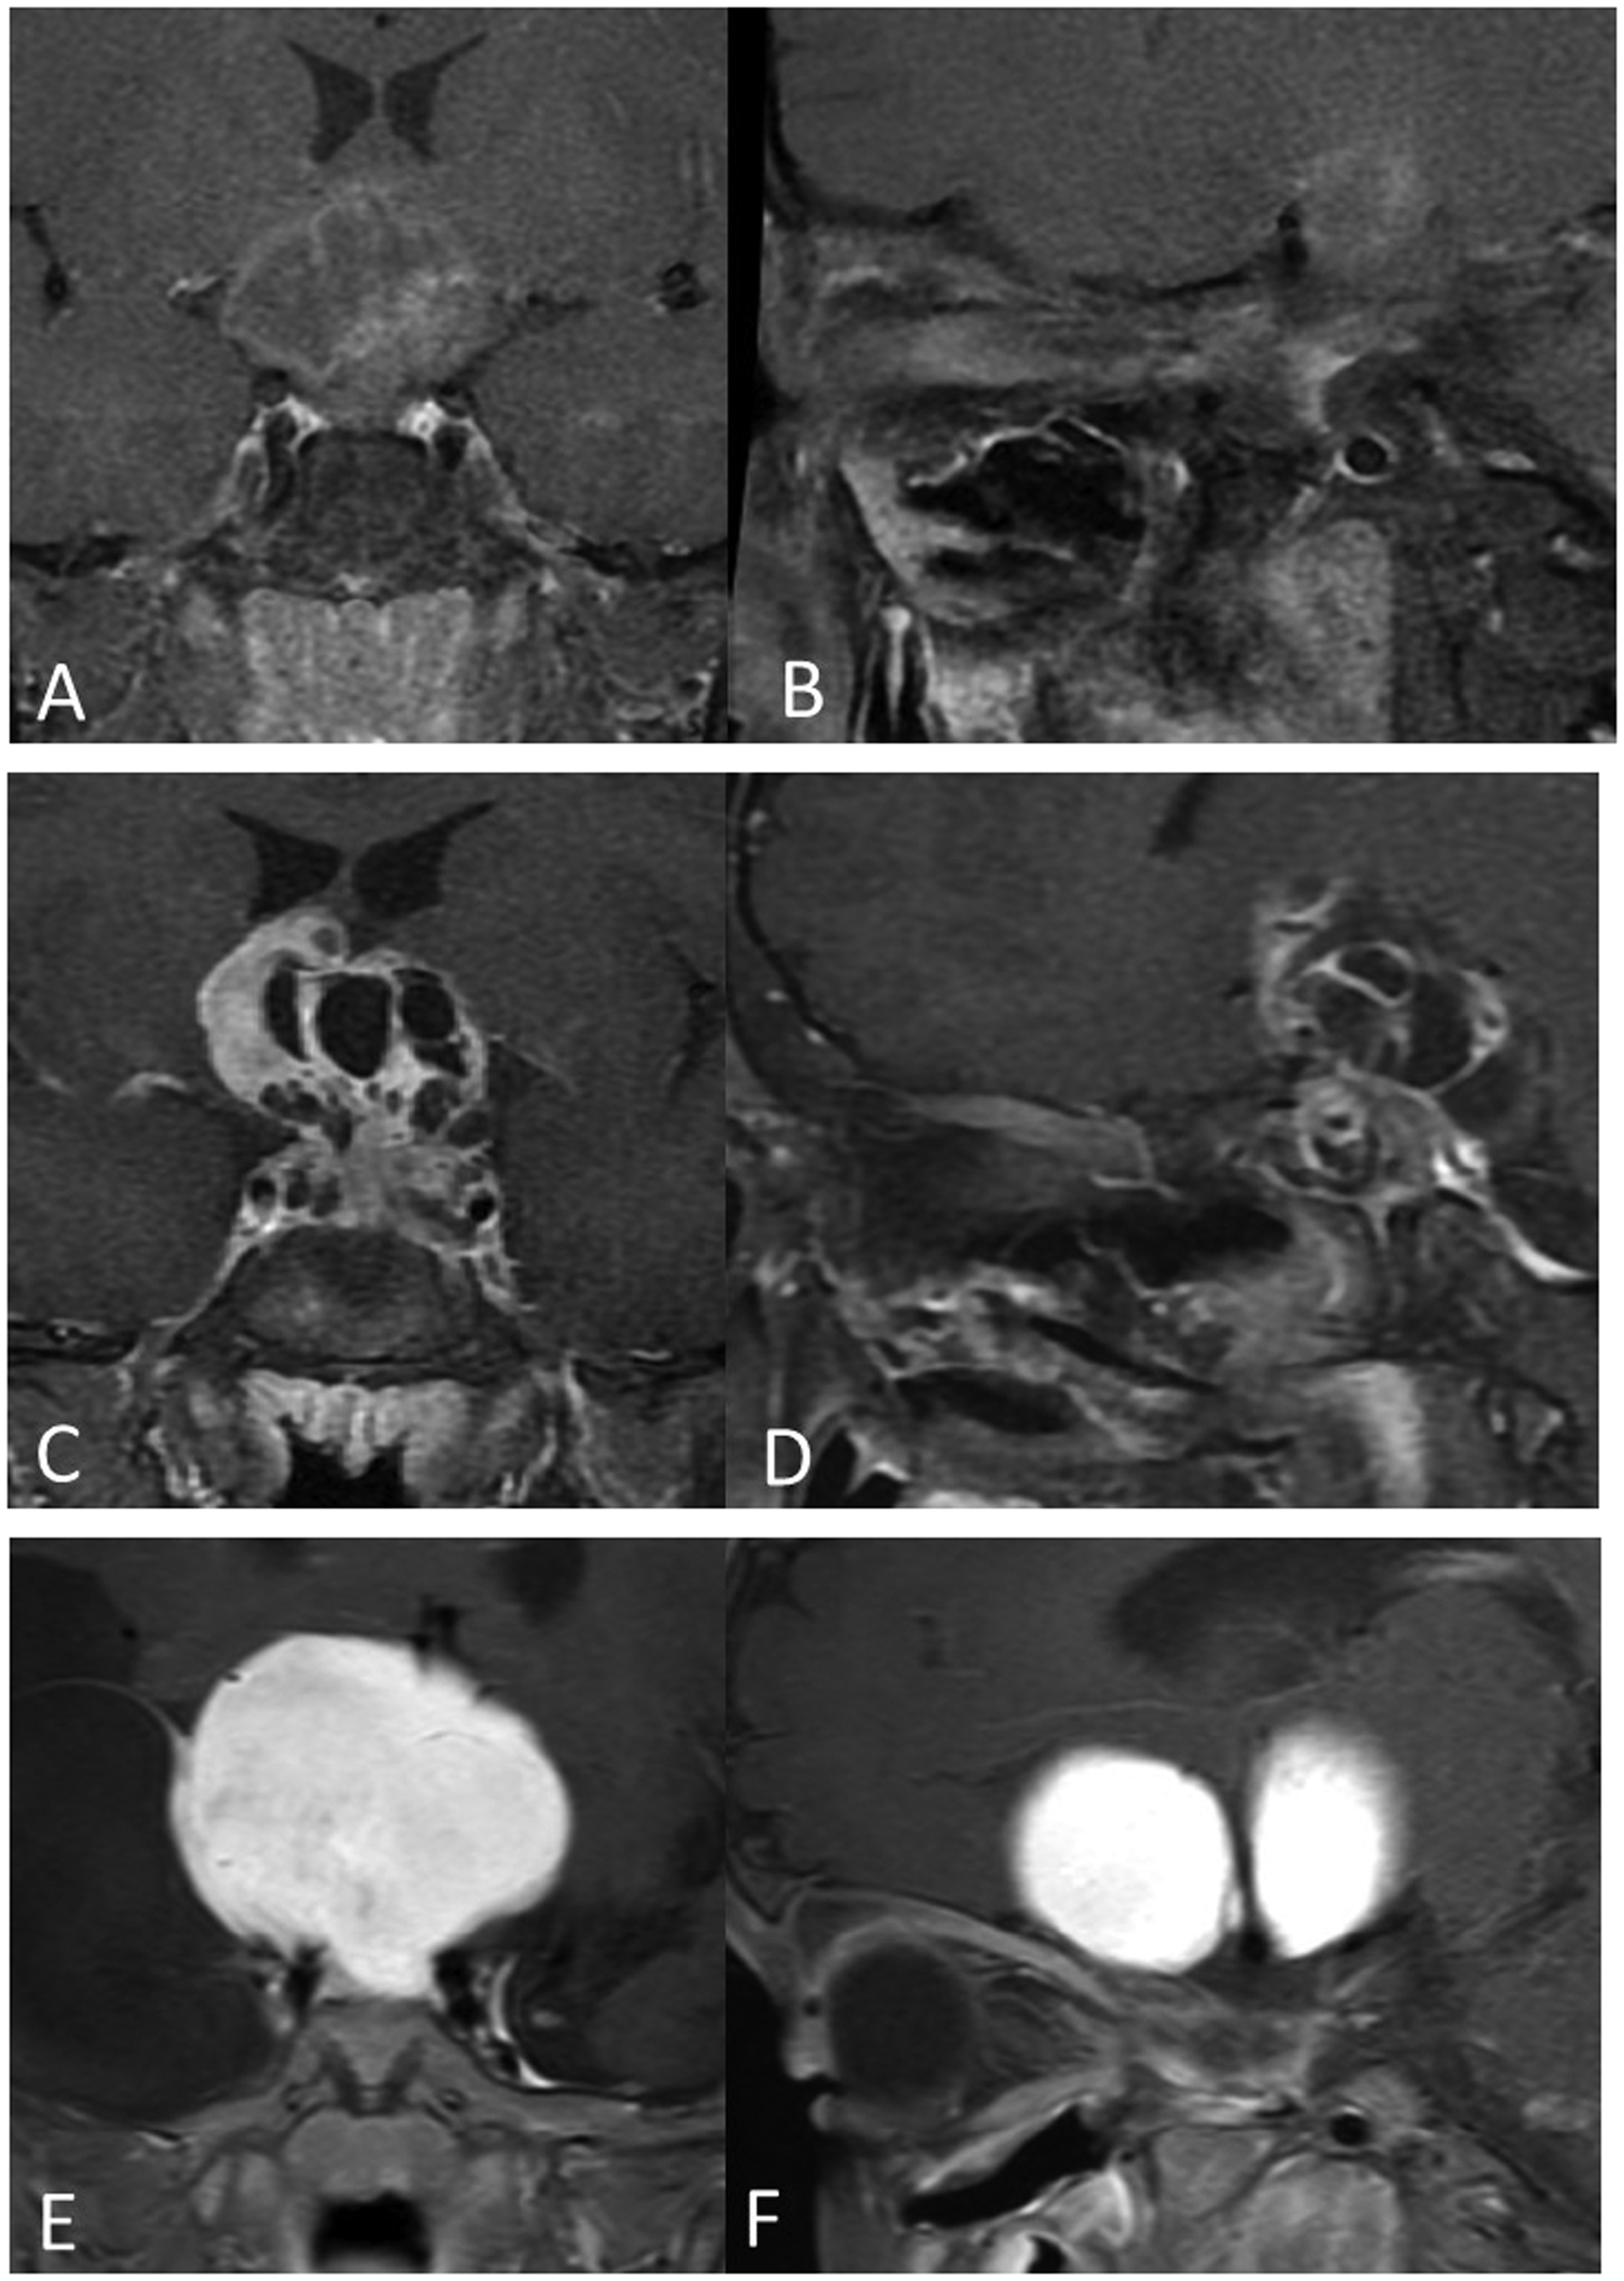
Coronal and sagittal post-gadolinium T1W FS images demonstrate degree of contrast enhancement in grade 1; enhancement less than extraocular muscle (EOM) (a) and (b), grade 2; enhancement more than EOM but less than cavernous sinus (c) and (d), and grade 3; enhancement equal to or greater than cavernous sinus (e) and (f).
Statistical analysis
Statistical analyses were performed with IBM SPSS software version 24 (IBM Corp.). The intraobserver reliability of ADC value measurement from the two sessions and interobserver agreement in evaluation of MRI characteristics were analyzed by using intraclass correlation coefficient (ICC).
Comparisons of continuous variables among the groups were performed by using independent t-test. Fisher’s exact test was used to test categorical variables. A p value of less than 0.05 was considered a statistically significant difference.
We used a receiver operating characteristic (ROC) curve to determine a cutoff value of the average ADC value, minimum ADC value, normalized average ADC ratio and normalized minimum ADC ratio for differentiating between suprasellar germinomas and CHGs. Sensitivity, specificity, PPV, NPV and accuracy were also calculated.
Results
Of the 22 patients included in the study, there were 10 males and 12 females. Age at diagnosis ranged from two to 43 years (mean age 15 ± 10.29 years). Histopathological examination demonstrated 11 low-grade gliomas (50%), and 11 germinomas (50%).
ADC values
Intraobserver agreement for ADC measurements was excellent, with an ICC value of 0.95–0.97. According to the high ICC value, we can use ADC data from any session. For analysis in this study, we used ADC values from the first session.
Table 1 shows average ADC value, minimum ADC value, normalized average ADC ratio and normalized minimum ADC ratio of the suprasellar germinomas and CHGs.
Mean and SD of average apparent diffusion coefficient (ADC) value, minimum ADC value, normalized average ADC ratio, and normalized minimum ADC ratio of suprasellar germinomas and chiasmatic/hypothalamic gliomas (CHGs).
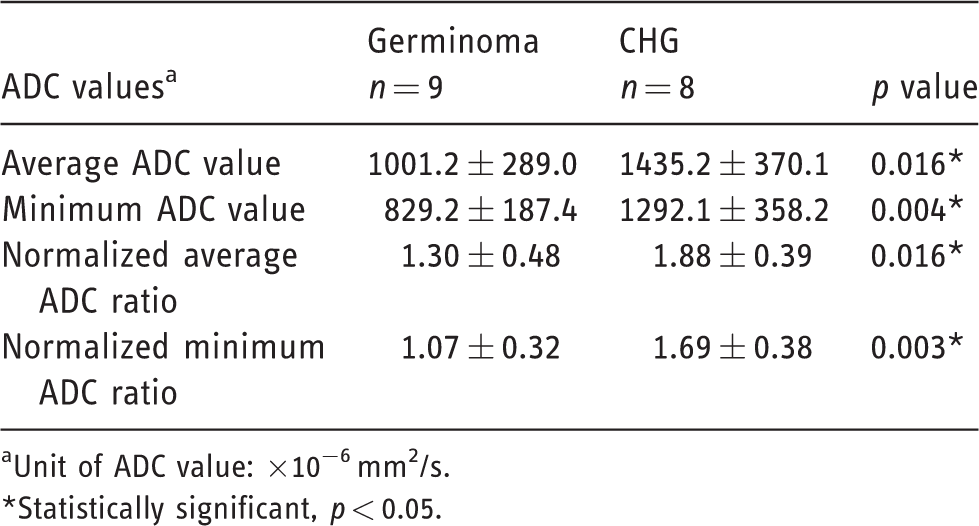
aUnit of ADC value: ×10−6 mm2/s.*Statistically significant, p < 0.05.
The average ADC values (×10–6 mm2/s) of germinomas and CHGs were 1001.2 ± 289.0 and 1435.2 ± 370.1 respectively, with p = 0.016. The minimum ADC values (×10−6 mm2/s) of germinomas and CHGs were 829.2 ± 187.4 and 1292.1 ± 358.2 respectively, with p = 0.004. The normalized average ADC ratios of germinomas and CHGs were 1.30 ± 0.48 and 1.88 ± 0.39 respectively, with p = 0.016. The normalized minimum ADC ratios of germinomas and CHGs were 1.07 ± 0.32 and 1.69 ± 0.38, respectively, with p = 0.003. Figure 4 shows boxplots of average ADC value, minimum ADC value, normalized average ADC ratio and normalized minimum ADC ratio compared between germinomas and CHGs.
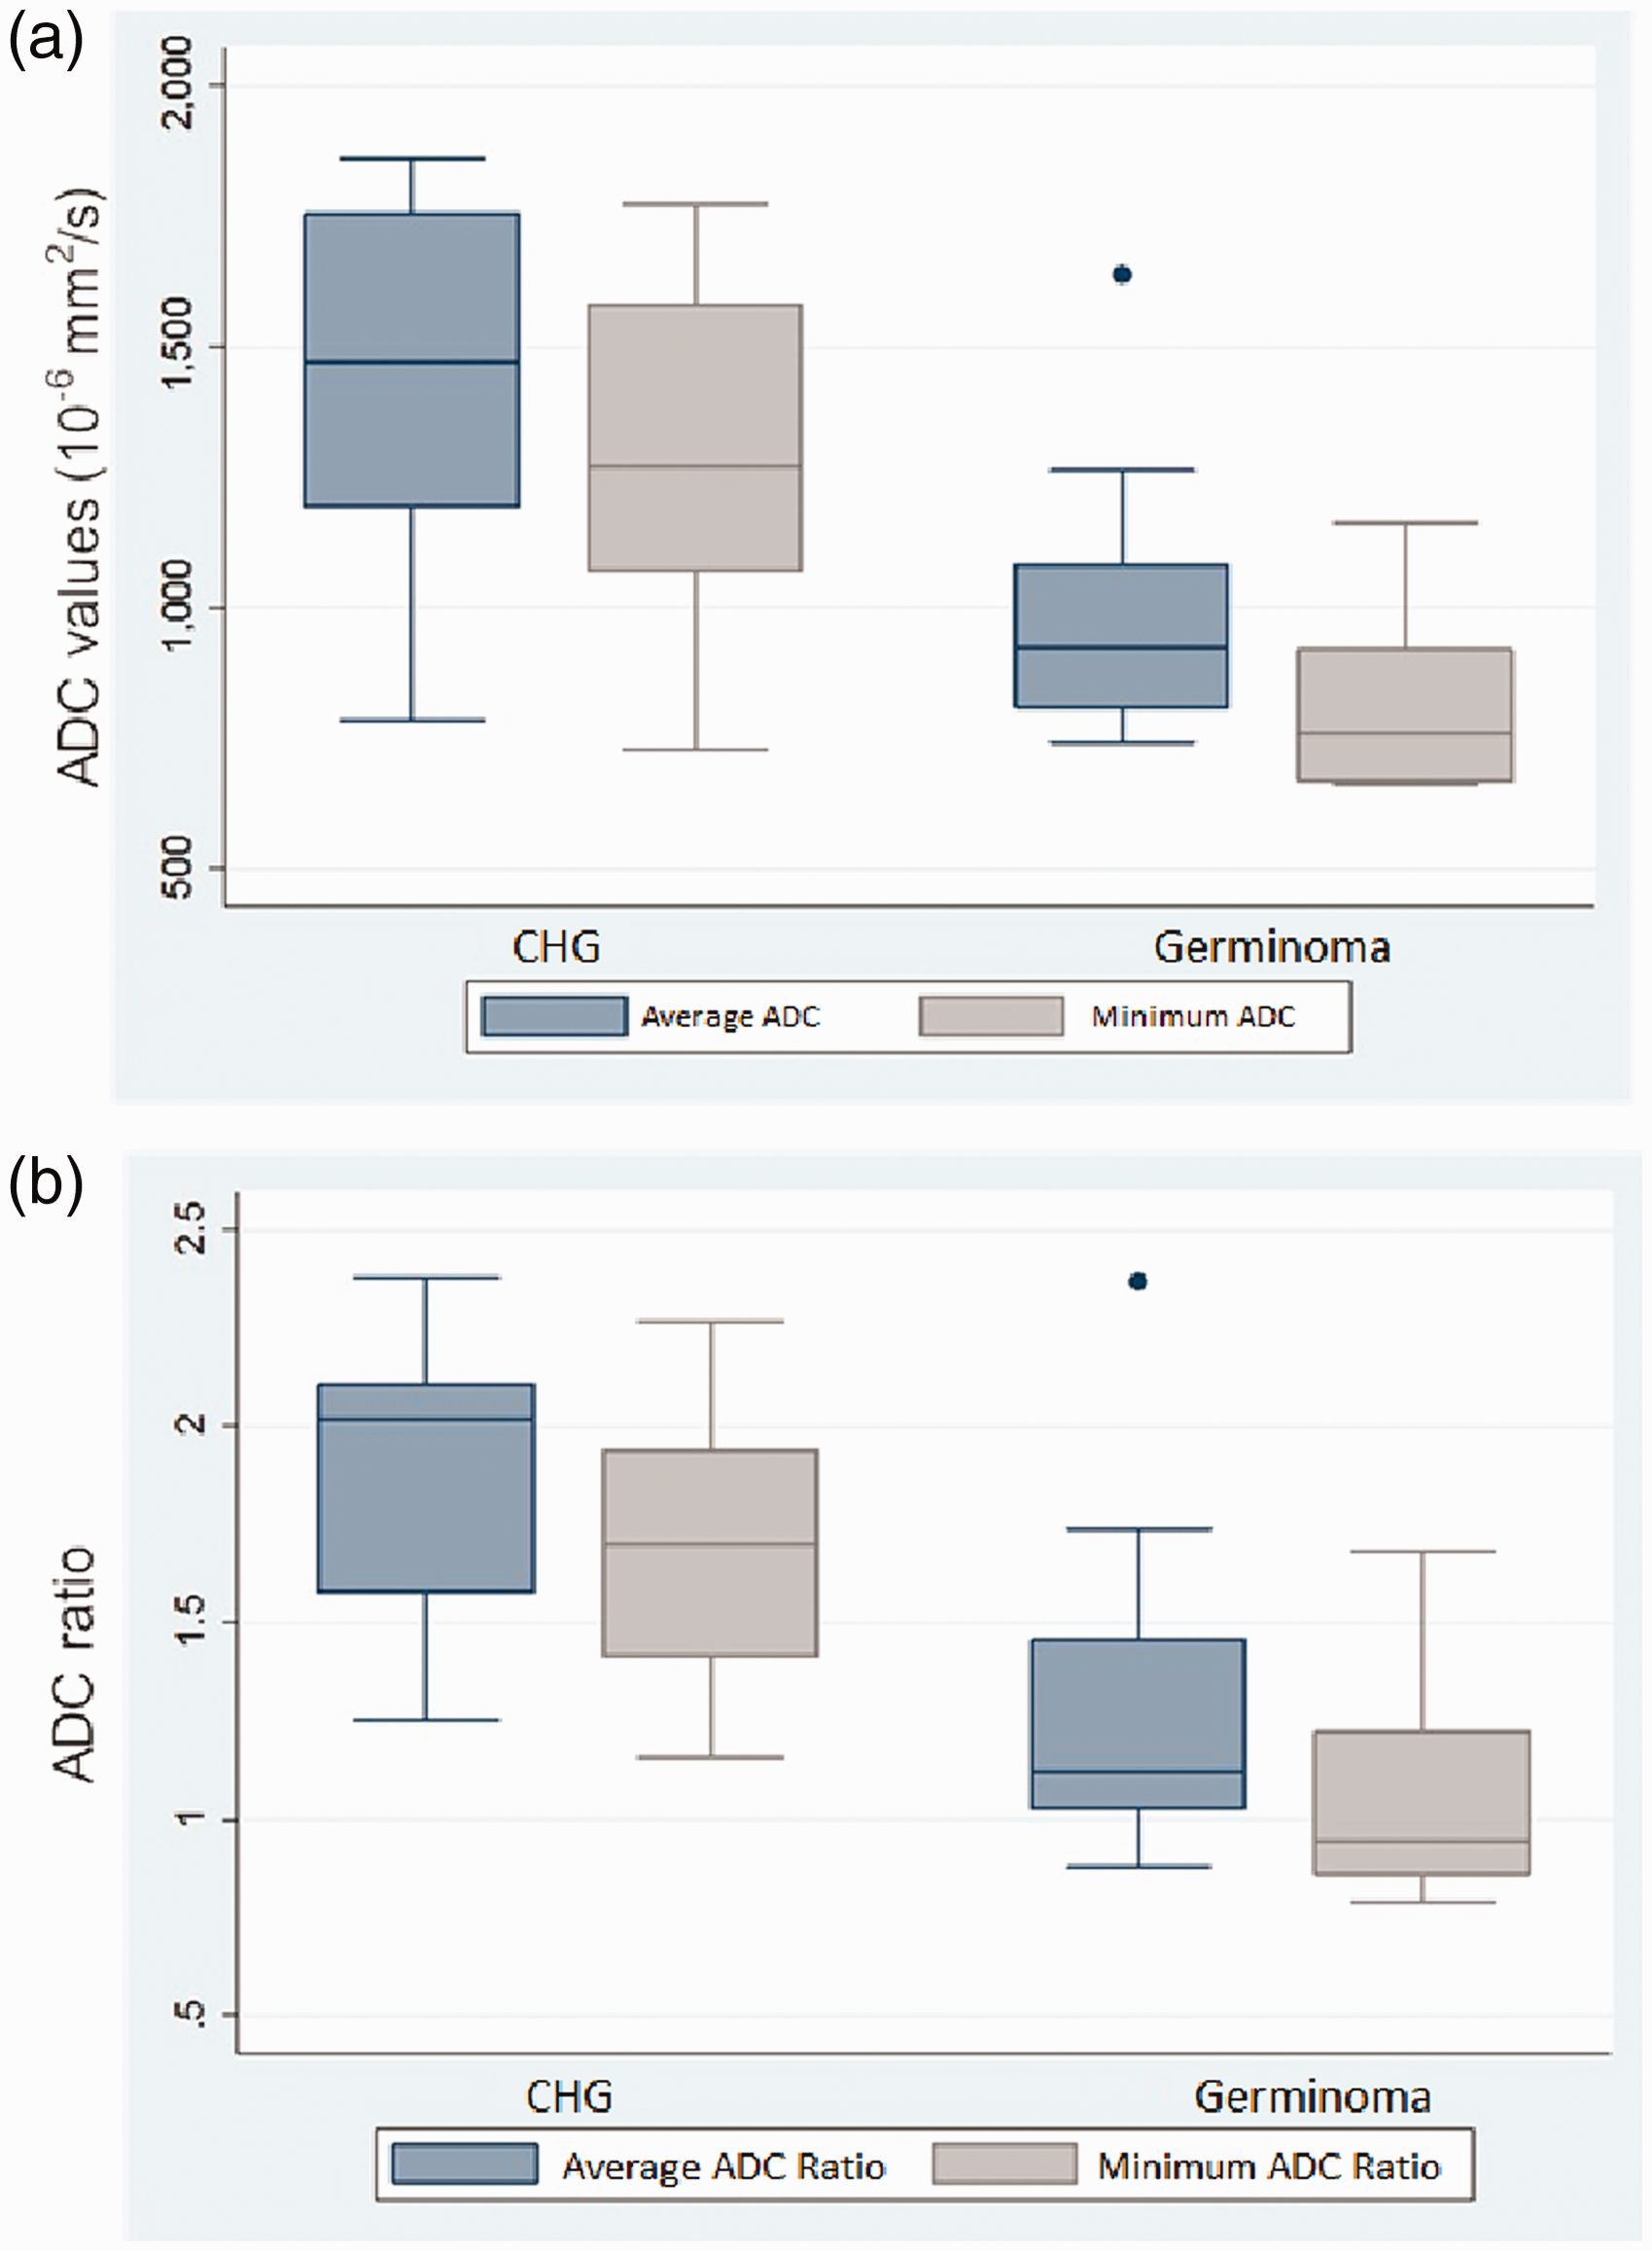
Boxplots of average and minimum apparent diffusion coefficient (ADC) values (a) and normalized average and minimum ADC ratios (b) comparing between chiasmatic/hypothalamic glioma (CHG) and germinoma.
ROC curve was done to find out the ADC cutoff value differentiating suprasellar germinomas from CHGs (Figure 5). The cutoff values of average ADC value and minimum ADC value (×10−6 mm2/s) were 1093.83 and 941.15, respectively, with a sensitivity of 87.5%, a specificity of 77.8%, a PPV of 77.8%, a NPV of 87.5% and an accuracy of 82.4%. The cutoff values of normalized average ADC ratio and normalized minimum ADC ratio were 1.21 and 1.11, respectively, with a sensitivity of 100%, a specificity of 66.7%, a PPV of 72.7%, a NPV of 100% and an accuracy of 82.4%. The area under the curve of the cutoff values of average ADC value, minimum ADC value, normalized average ADC ratio and normalized minimum ADC ratio used to differentiate suprasellar germinomas from CHG were 0.819, 0.889, 0.847 and 0.889, respectively.
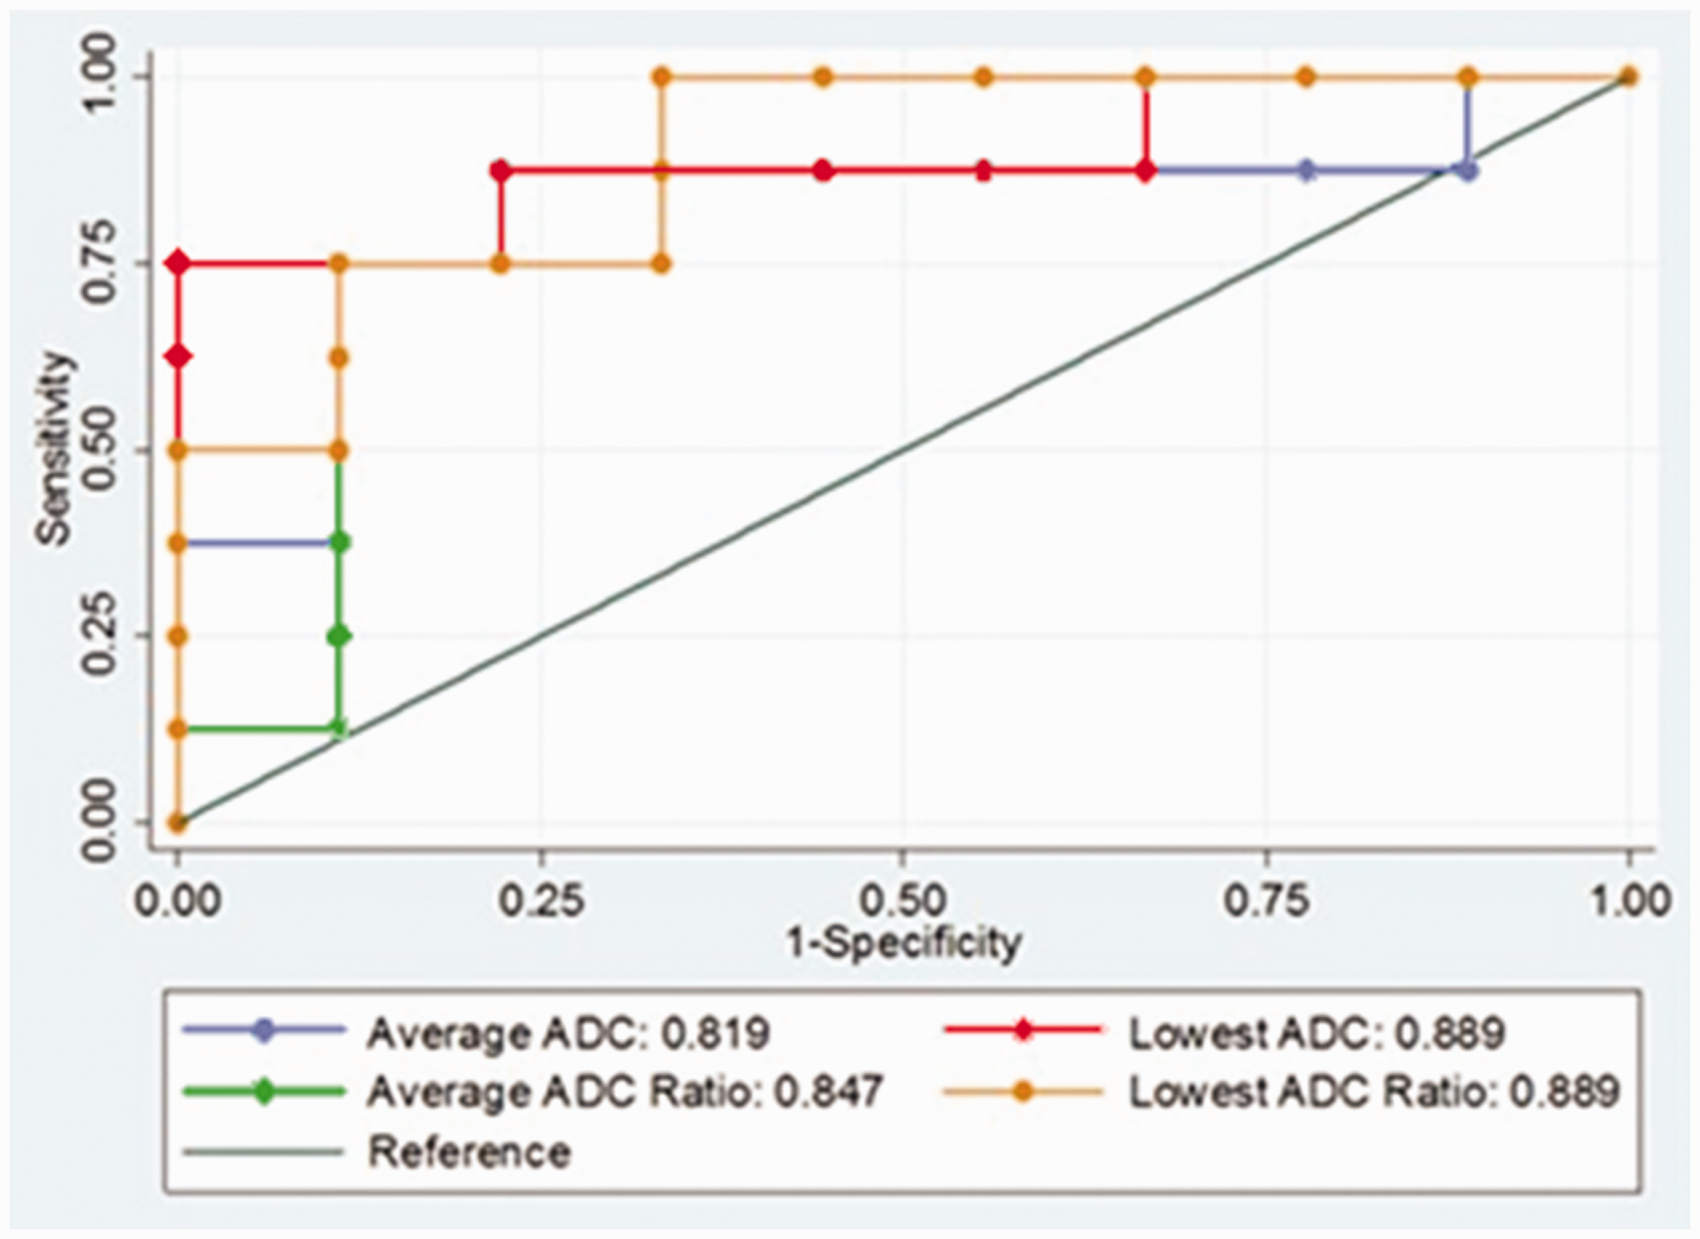
Receiver operating characteristic curve of the cutoff values of average apparent diffusion coefficient (ADC) value, minimum ADC value, normalized average ADC ratio, and normalized minimum ADC ratio used for differentiation of suprasellar germinomas from chiasmatic/hypothalamic glioma.
MRI characteristics
Interobserver agreement for imaging features was moderate to excellent agreement, with ICC values of 0.47–1.0.
Table 2 shows MRI characteristics of suprasellar germinomas and CHGs. The significant differences of MRI characteristics between both tumors were tumor location, cyst pattern of the tumor, T2W hypointensity and degree of contrast enhancement, as well as stalk and pituitary gland involvement.
Magnetic resonance imaging characteristics of suprasellar germinomas and chiasmatic/hypothalamic gliomas (CHGs).
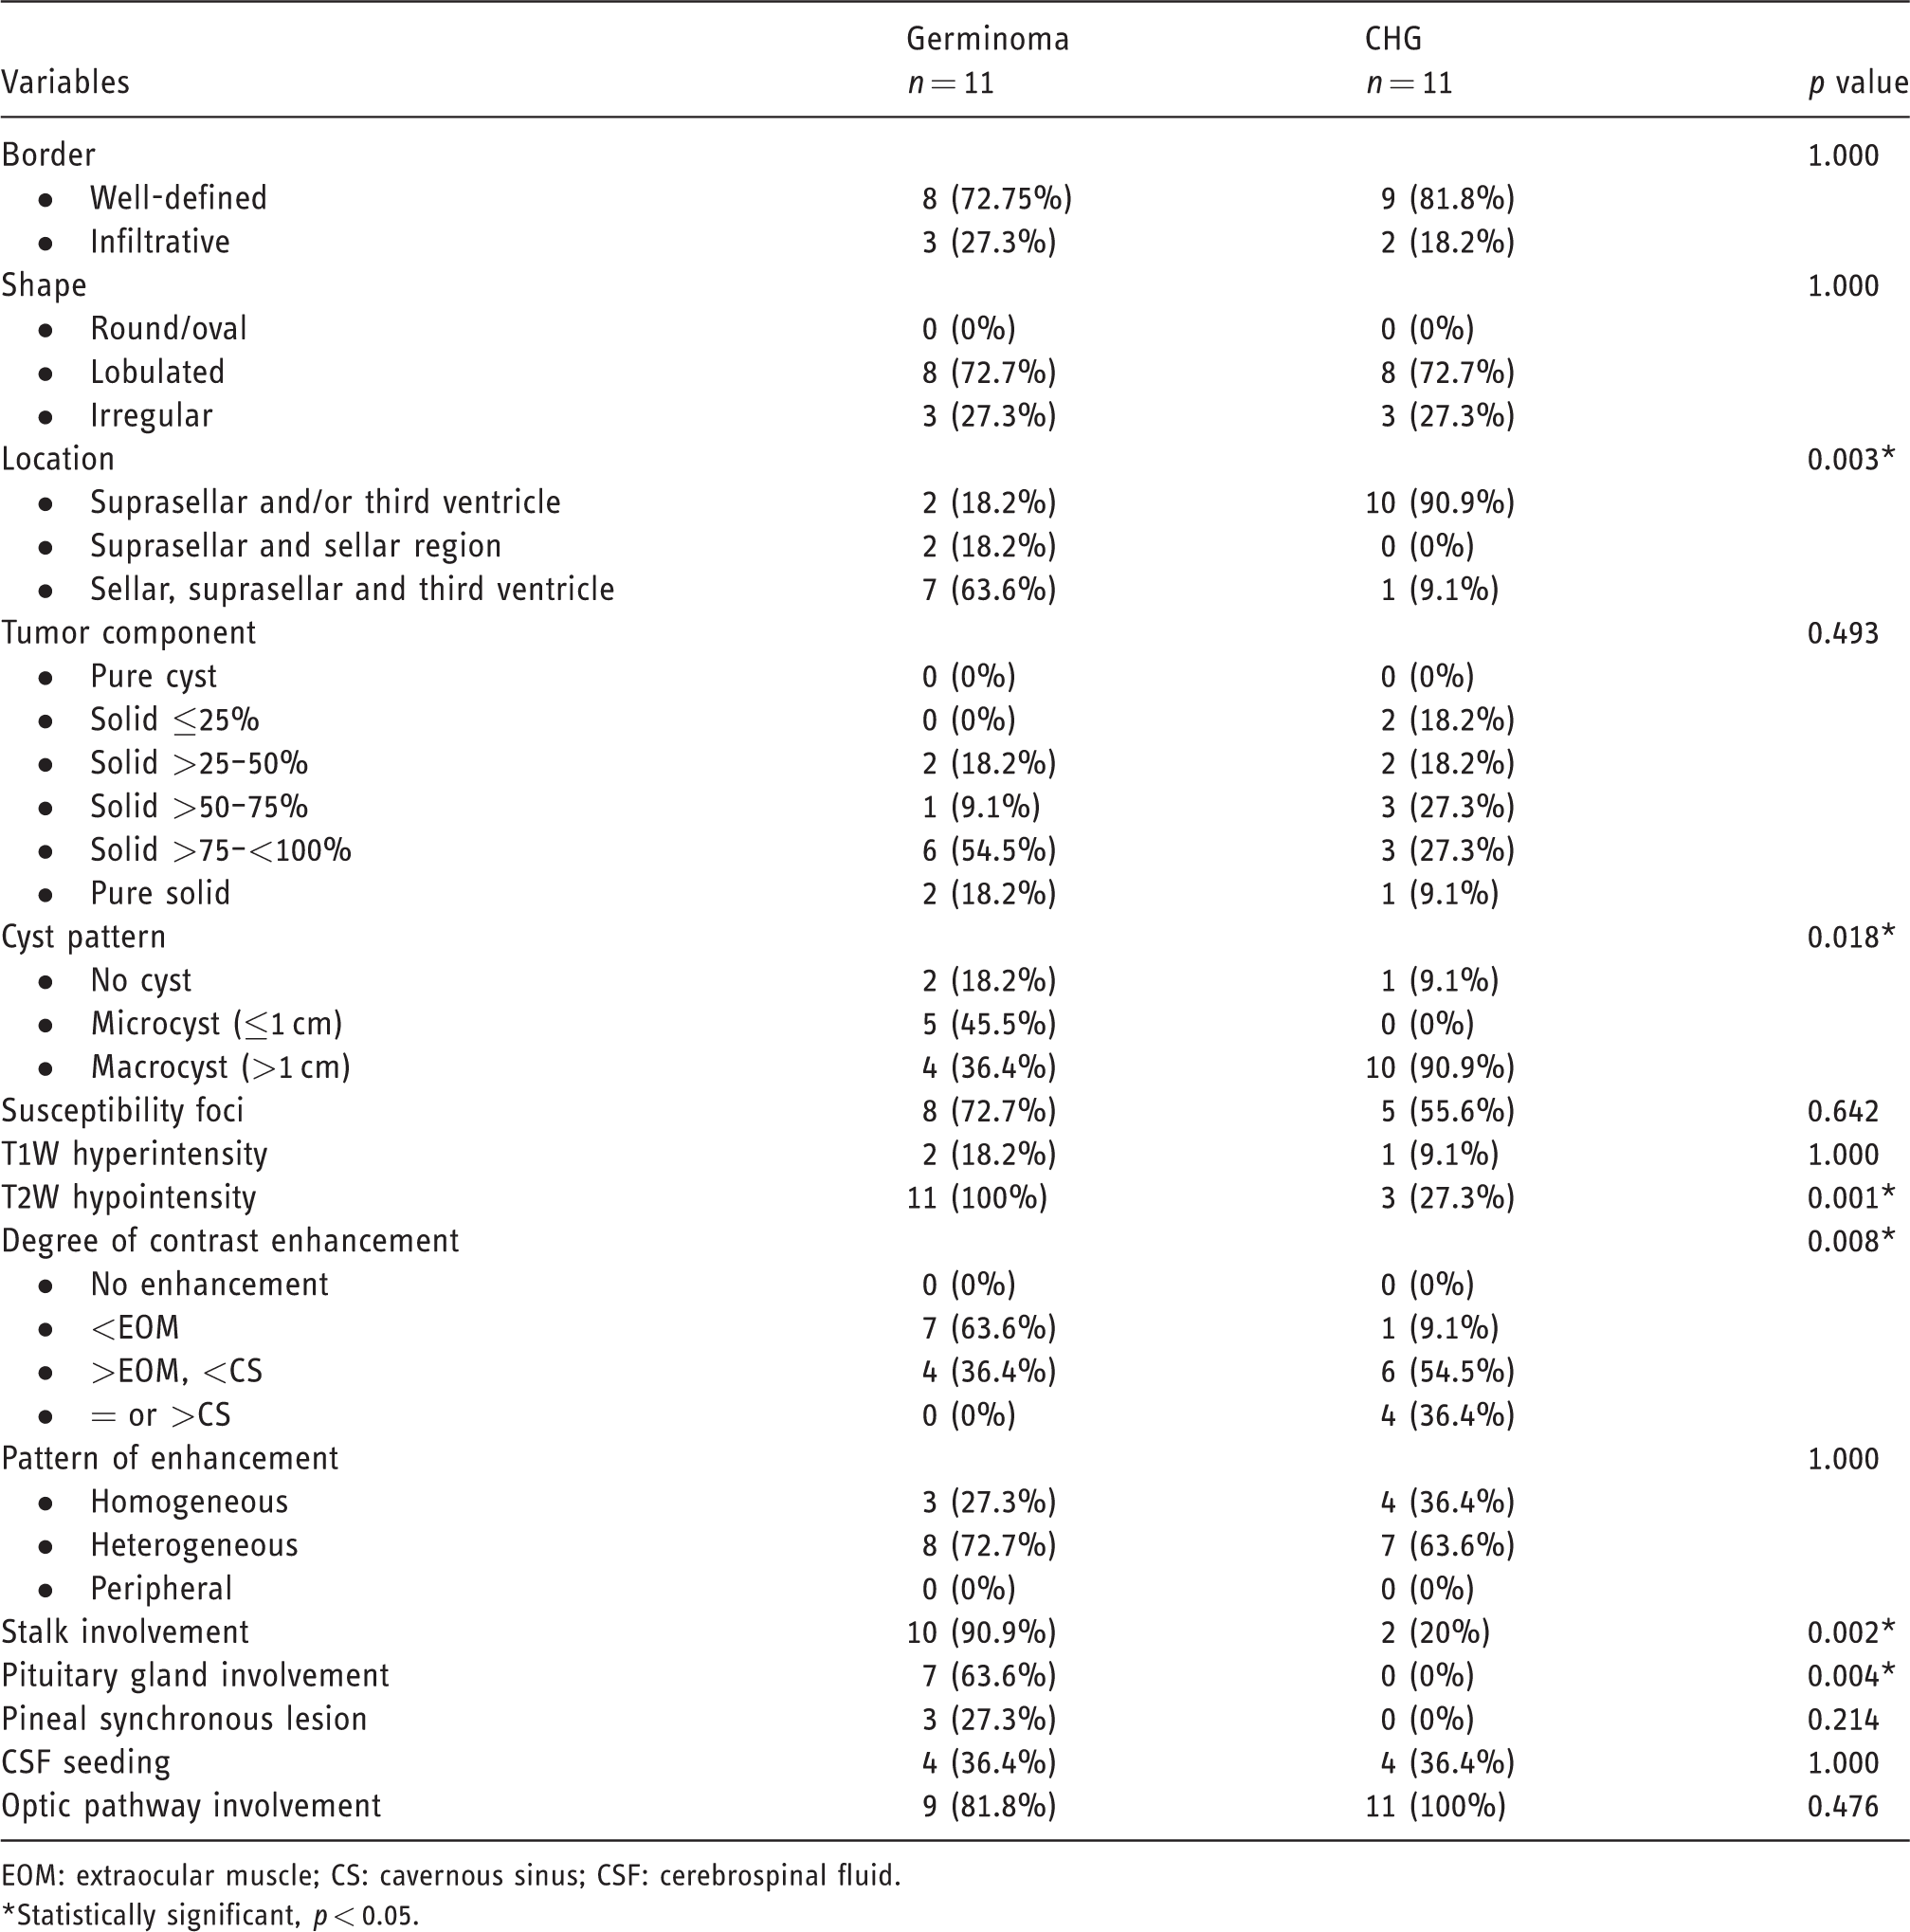
EOM: extraocular muscle; CS: cavernous sinus; CSF: cerebrospinal fluid.*Statistically significant, p < 0.05.
CHGs were commonly located at the suprasellar region and/or the third ventricle (90%), whereas suprasellar germinomas generally involved the sellar, suprasellar region and the third ventricle (60%), with p = 0.003.
The most common cyst pattern of CHG was macrocyst (90%), which was significantly different compared with the suprasellar germinomas (40%), with p = 0.018.
T2W hypointensity of the solid portion was present in all suprasellar germinomas (100%), which was significantly different compared with the CHGs (27.3%), with p < 0.001.
CHGs showed a higher degree of contrast enhancement than those of suprasellar germinomas, with p = 0.008. About 90% of CHGs enhanced more than the extraocular muscle (EOM) or equal to the cavernous sinus, whereas all suprasellar germinomas (100%) enhanced less than the cavernous sinus.
Suprasellar germinomas more commonly involved the pituitary stalk (90%) and pituitary gland (60%), while CHGs showed less pituitary stalk involvement (20%) and no pituitary gland involvement, with p = 0.002 and p = 0.004, respectively.
The MRI characteristics that showed no statistically significant difference between both tumors were border, shape, percent of solid component, susceptibility foci, presence of T1W hyperintensity, pattern of enhancement, pineal synchronous lesion, CSF seeding and optic pathway involvement. Examples of suprasellar germinoma and CHG are shown in Figures 6 and 7.
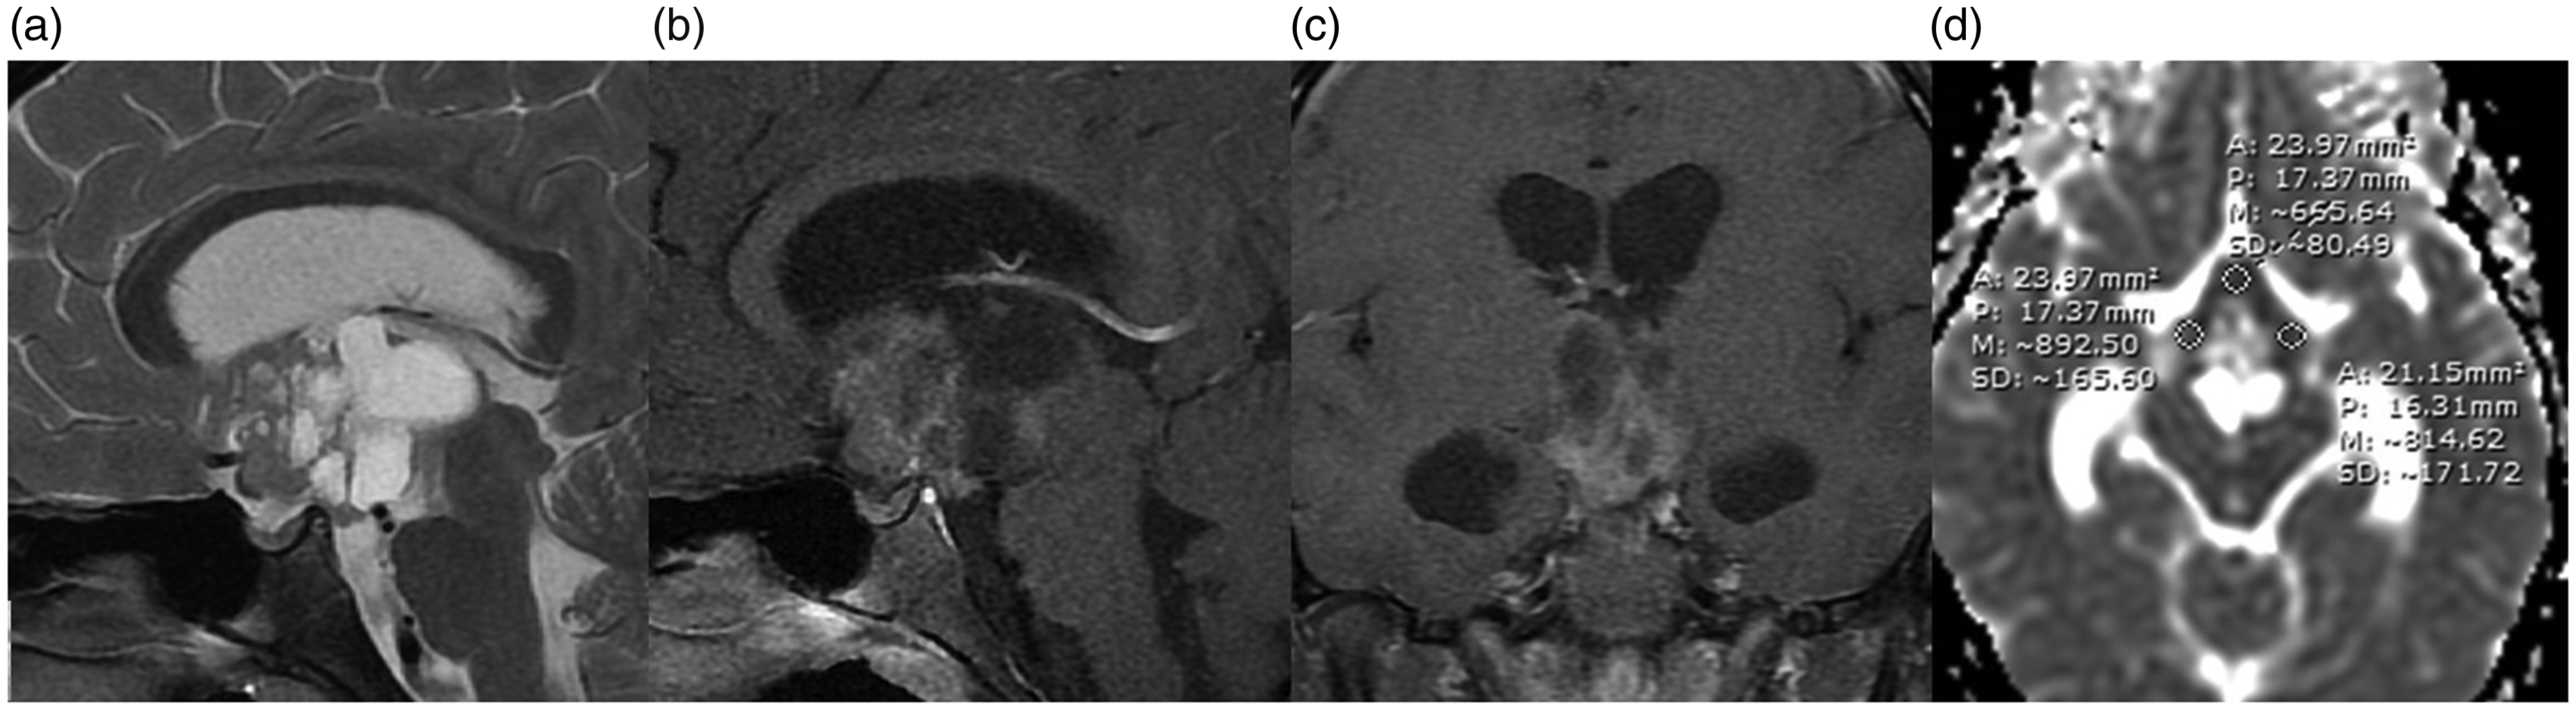
Magnetic resonance imaging of a 10-year-old boy with germinoma. Sagittal T2W FS (a) shows T2W hypointensity of the solid portion and presence of macrocysts. Sagittal and coronal post-gadolinium T1W FS images (b) and (c) show mild enhancement of the solid portion. The tumor involves the suprasellar region and third ventricle. The average and minimum apparent diffusion coefficient (ADC) values were 790.9× 10⁻⁶ mm2/s and 665.6x × 10−6 mm2/s respectively on ADC maps (d).
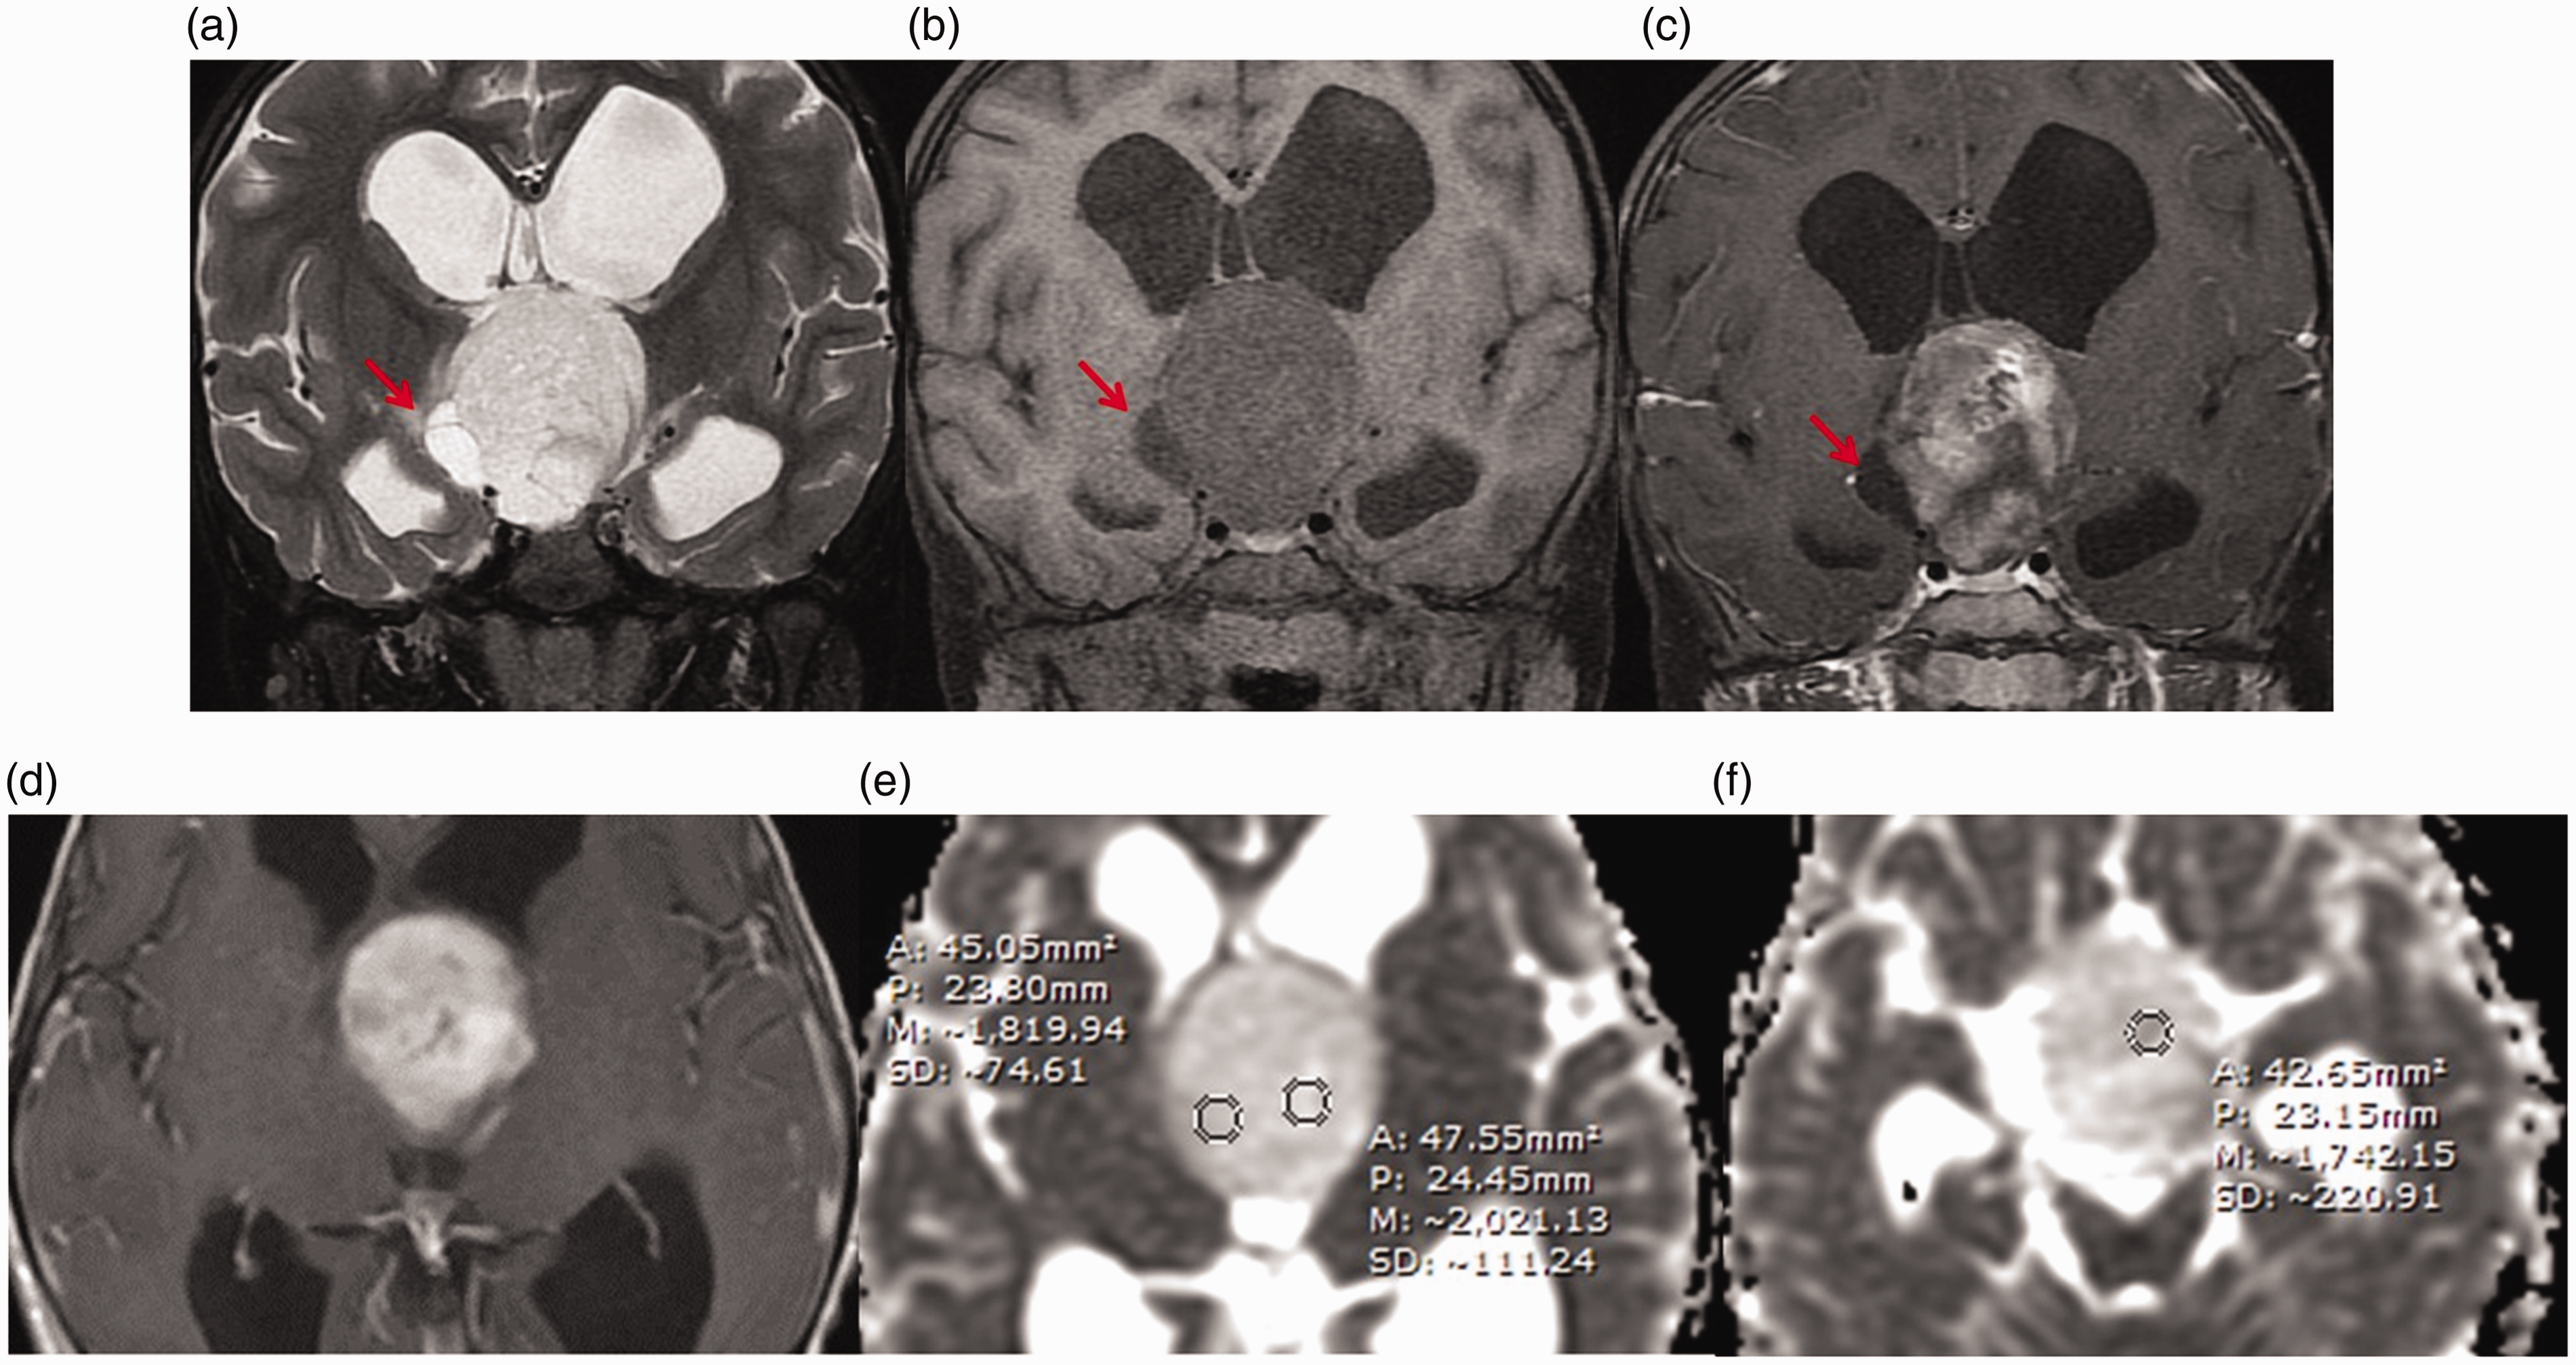
Magnetic resonance imaging of a five-year-old girl with chiasmatic/hypothalamic glioma (CHG) (pilocytic astrocytoma). Coronal T2W FS image (a) shows T2W hyperintensity of the solid portion and presence of a macrocyst (arrows). Coronal pre- and post-gadolinium T1W FS images (b) and (c) and axial SE T1W post-gadolinium image (d) show moderate enhancement of the solid portion. The tumor involves the suprasellar region and third ventricle. The average and minimum average apparent diffusion coefficient (ADC) values were 1861.1 × 10−6 mm2/s and 1742.2 × 10−6 mm2/s respectively on ADC maps (e) and (f).
Discussion
DWI is the MRI sequence that assesses microscopic water diffusion within the tissue. ADC maps represent average diffusion for each voxel. DWI allows us to evaluate the tumor cellularity because cellular and subcellular elements significantly impede the mobility of water molecules. Thus the densely cellular regions exhibit low ADC value. The role of DWI and ADC for differentiation of various types of brain tumors such as lymphoma, pineoblastoma, medulloblastoma, high-grade gliomas and germinoma has been reported.9,17
In this study, there is a significant difference in ADC values of suprasellar germinomas and CHGs, in which suprasellar germinoma had lower average ADC value, minimum ADC value, normalized average ADC ratio and normalized minimum ADC ratio than those of CHG. The difference in the ADC values is based on the difference in cellularity and histopathologic features of the tumors. The germinoma has high cellularity with densely packed tumor cells interspersed by fibrous tissue with lymphocytes,4,9,22,23 whereas CHG has low cellularity related to histologic type of low-grade or pilocytic astrocytomas.2,4,13,24–26 In practice, we recommend to use a cutoff value of minimum ADC value of 941.15 × 10⁻⁶ mm2/s in differentiation between suprasellar germinomas and CHGs because of the simple measurement without complicated calculation and relatively high sensitivity, specificity and accuracy that this gives.
Ogiwara et al. 9 studied ADC values of four germinomas compared with six NGGCTs. The ADC values of germinomas were significantly lower than those of NGGCTs (p = 0.01). Kinoshita et al. 23 reported that the ADC values of craniopharyngiomas were significantly higher than the ADC values of suprasellar GCTs (p=0.00172). De Fatima Vasco Aragao et al. 27 reported that the ADC values of pilocytic astrocytomas were significantly higher than those of high-grade gliomas (p = 0.01). The findings from these studies have supported that the ADC value can be used to differentiate tumors based on tumor cellularity. However, there has been no previous report in the literature studying the role of DWI to differentiate between suprasellar germinomas and CHG. To our knowledge, this is the first study that compared suprasellar germinomas with CHG by using ADC values.
Suprasellar GCTs and CHGs may be indistinguishable with standard imaging techniques. In this study, the MRI characteristics that could help differentiate suprasellar germinomas from CHGs were location, cyst pattern, T2W hypointensity, degree of contrast enhancement, pituitary stalk involvement and pituitary gland involvement. MRI characteristics suggested that the diagnosis of suprasellar germinomas was T2W hypointensity and involvement of pituitary gland and/or stalk. MRI characteristics suggested that the diagnosis of CHG was higher degree of contrast enhancement and presence of macrocysts.
Regarding the MRI characteristics, previous studies1,2,4,13,22,25,26 reported that suprasellar germinomas typically appeared as hypointense to isointense T2W mass that involved the infundibular stalk and floor of the third ventricle. Tumors infiltrating the intrasellar space were also common. The T2W hypointensity presumably reflects the high cell density with a diminished free water content of these tumors. CHGs are frequently complicated by the involvement of hypothalamus and third ventricle which usually does not involve the pituitary gland. They almost always show a hyperintense signal on T2W and FLAIR sequences. CHGs may be differentiated from GCTs by the usual hyperintense signal on T2W images compared with the hypointense signal of GCTs.25,26 Larger tumors are typically heterogeneous with cystic and solid components.1,2,4 Our study showed the similar MRI characteristics.
Previous studies24,28–30 reported that CHG showed moderate-to-marked contrast enhancement due to the histopathological appearance of vascular endothelial proliferation, which is similar to our result. Besides, we generated our internal reference for grading degree of contrast enhancement by comparison with the adjacent anatomical structures including the EOM and cavernous sinus, which minimizes bias in interpretation and could be used in practical application.
Most CHGs are pilocytic or low-grade astrocytomas, which commonly appear as either micro- or macrocysts. Previous studies24,29,30 reported that macrocysts were rarely found in pilocytic astrocytoma along an optic pathway or around the third ventricle, which is different from our result.
Because of the small number of patients with the pineal synchronous lesion, there was no statistically significant difference between suprasellar germinomas and CHGs. All patients with pineal synchronous lesion had suprasellar germinomas, which was in accord with the results in previous reports.4–7,10 Pineal synchronous lesion is a pathognomonic finding of GCTs, which is found in approximately 5–13% of patients when diagnosed.
Our result showed no significant difference in border and shape of the tumor, percent of the solid component, pattern of enhancement, presence of T1W hyperintensity, susceptibility foci, CSF seeding and optic pathway involvement between suprasellar germinomas and CHGs. This corresponds with the literature suggesting that the larger sellar/suprasellar GCTs often had non-specific imaging appearance and usually could not be distinguished from other tumors, especially CHG.4,31
Based upon the results discussed above, the ADC value and MRI characteristics can be used as a non-invasive tool to differentiate suprasellar germinoma from CHG. This should improve the efficiency of the clinical diagnosis. For future researches, the combination of multiparametric imaging of DWI (ADC value) and magnetic resonance perfusion is recommended.
This study had several limitations. First, the number of patients was rather small. Further studies may require a larger number of patients. The studies should also evaluate the applicability in suprasellar GCTs including NGCCTs. Second, there could be variation of ADC value measurement, especially for some heterogeneous tumors. However, we tried to minimize such variation by accurate placing of the ROIs only in the enhancing solid portion and calculating the average ADC value in each case. Third, sellar and parasellar lesions tend to get image disturbance on DWI sequences due to susceptibility artifacts, causing limitation in ADC value measurement. Further studies with PROPELLER non-EPI DWI technique are recommended for better evaluation.
Conclusion
Our results suggested that ADC values could help differentiate between suprasellar germinoma and CHG preoperatively, with a cutoff value of the minimum ADC value of 941.15 × 10⁻⁶ mm2/s. Furthermore, some MRI features favor differentiation between these tumor entities, including tumor location, cyst pattern, presence of T2W hypointensity, degree of contrast enhancement, and stalk and pituitary gland involvement.