
Abstract
Purpose
The purpose of this study was to differentiate glioblastoma multiforme from primary central nervous system lymphoma using the customised first and second-order histogram features derived from apparent diffusion coefficients.
Results
Based on the tumour regions of interest, apparent diffusion coefficient mean, maximum, median, uniformity and entropy were higher in the glioblastoma multiforme group than the primary central nervous system lymphoma group (P ≤ 0.001). The most sensitive first and second-order histogram feature to differentiate glioblastoma multiforme from primary central nervous system lymphoma was the maximum of 2.026 or less (95% confidence interval (CI) 75.1–99.9%), and the most specific first and second-order histogram feature was smoothness of 1.28 or greater (84.0% CI 70.9–92.8%). Based on the oedema regions of interest, most of the first and second-order histogram features were higher in the glioblastoma multiforme group compared to the primary central nervous system lymphoma group (P ≤ 0.015). The most sensitive first and second-order histogram feature to differentiate glioblastoma multiforme from primary central nervous system lymphoma was the 25th percentile of 0.675 or less (100% CI 83.2–100%) and the most specific first and second-order histogram feature was the median of 1.28 or less (85.9% CI 66.3–95.8%).
Conclusions
Texture analysis using first and second-order histogram features derived from apparent diffusion coefficient maps may be helpful in differentiating glioblastoma multiforme from primary central nervous system lymphoma.
Keywords
Introduction
Glioblastoma multiforme (GBM) and primary central nervous system lymphoma (PCNSL) are two known brain malignancies, with GBM being more prevalent. 1 Brain magnetic resonance imaging (MRI) is a helpful tool to identify the characteristic tumour findings and to assess the burden of the malignant tumours, although these findings are usually non-specific and a tissue biopsy is almost always required to make the diagnosis.2–4 Surgery with or without adjunct radiotherapy or chemotherapy is the principal component of the standard care of GBMs,2,5 while chemotherapy and radiotherapy are the main treatment for PCNSLs. 3 Both GBM and PCNSL are hypercellular tumours and have overlapping imaging features on brain MRI which make it difficult, if not impossible in some cases, to separate them apart. 6 Therefore, new imaging features are warranted to help discriminate GBMs from PCNSLs which may direct treatment and surgical approaches.
The apparent diffusion coefficient (ADC) values of diffusion-weighted imaging (DWI) have been reported to be helpful in discriminating GBM from PCNSL,7–9 although some studies did not find it useful in such a differentiation.4,10 These conflicting results may have arisen from different techniques used to delineate the region of interest (ROI) on the ADC maps; for example, Toh et al. 9 selected the ROIs in the centre of the solid enhancing areas of PCNSLs, whereas Yamashita et al. 11 and Doskaliyev et al. 12 selected several ROIs within the tumorous region. Furthermore, GBMs are characterised with extensive intratumoral heterogeneity, and calculation of the mean ADC values within the ROIs could average out the differences in spatial distribution of ADC values. All these factors make the imaging differentiation of GBMs from PCNSLs on MRI very challenging.
One of the unique characteristics of the GBMs is that they harbour infiltrating cells around the tumour bulk which is less common in PCNSLs, 3 and therefore the GBMs are expected to be more heterogeneous compared to PCNSLs. Conventional MRI may not be able to distinguish this difference; while this may be possible using advanced quantitative methods of the ADC maps in selected ROIs using histogram analysis.13,14 This advance histogram analysis can provide more information about the heterogeneity of the tumour. This technique was previously used by our group to distinguish functional from non-functional pituitary adenomas. 15 The purpose of this study was to differentiate GBMs from PCNSLs using the first and second-order histogram (FSOH) features derived from ADC maps of two selected ROIs, including the tumorous region and peritumoral oedema. Our study is technically unique because most of the previous studies have investigated limited FSOH features,8,9,16 and only in tumorous8,9 or peritumoral oedema regions.17,18
Materials and methods
Subjects
This research was approved by the ethics committee of Shahid Beheshti University of Medical Sciences. Patients were enrolled in this prospective study after signing an informed consent form. All patients (18–75 years old) with possible imaging findings of GBM or PCNSL on brain MRI signed the consent form for possible recruitment in the study, and those who were proved to have GBM or PCNSL on post-procedural biopsy were included in the study. Patients with biopsy diagnosis other than GBM and PCNSL were excluded from the study. A total of 82 patients (57 with GBM and 25 with PCNSL) were included in this study in 3 years between 2015 and 2018 (Figure 1). All patients with biopsy-confirmed GBM or PCNSL underwent treatment.
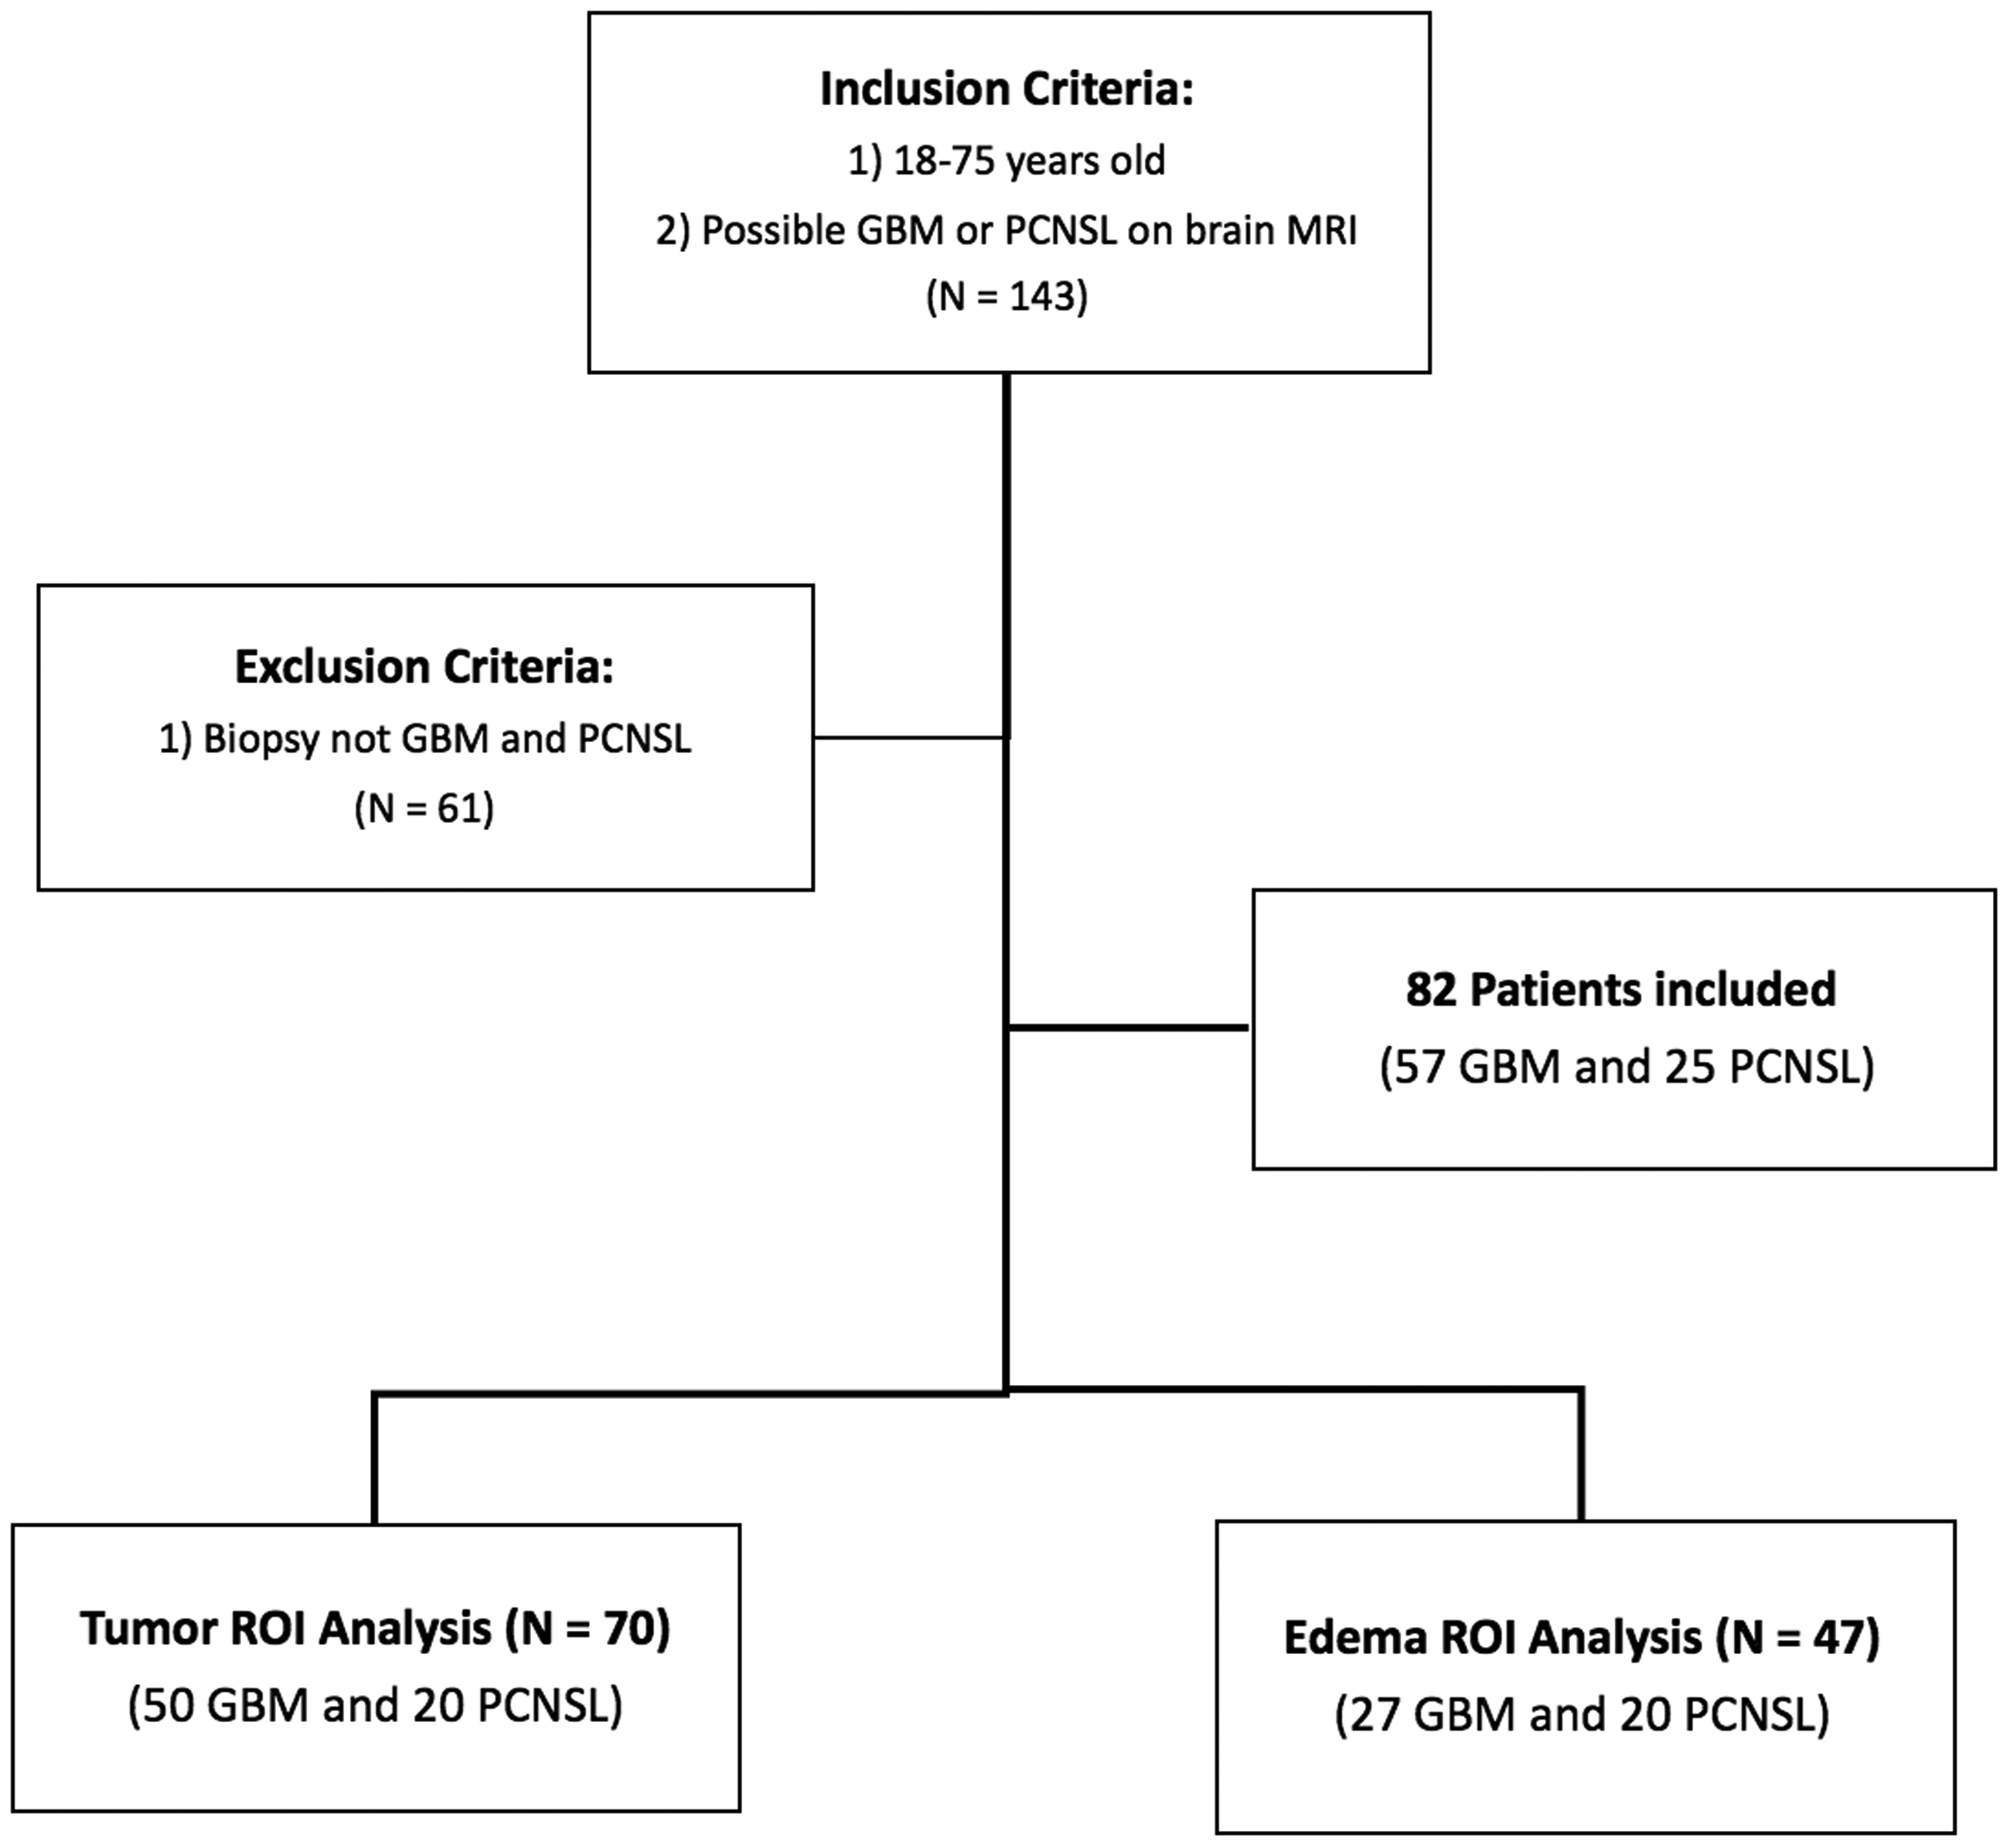
Flowchart of study subject recruitment.
Image acquisition
MRI was performed on a 1.5 Tesla scanner (Siemens, Avanto, Rel 16.0). The MRI protocol for tumour included pre and post-contrast axial and coronal spin-echo T1-weighted images (repetition time (TR)/echo time (TE) = 400/12 ms); axial and sagittal spin-echo T2-weighted images (TR/TE = 3600/97 ms); axial fluid-attenuated inversion recovery (FLAIR) images (TR/TE = 7000/117 ms, inversion time = 2500 ms). Axial DWI was performed using a spin-echo (TR/TE = 7000/117 ms) with b-values of 0, 500 and 1000 s/mm2 in axial directions. ADC maps between b-values of 0 and 1000 were generated on the scanner console. The post-contrast images were performed after the infusion of 0.1 mmol/kg (maximum of 20 cc). For all the sequences the field of view was 210 mm2, the number of excitations was two and the slice thickness was 5 mm. The image matrix was 320 × 320 for all sequences, except for the DWI sequence, which was 192 × 192.
MRI analysis
Two types of ROIs were manually delineated on anatomical images by an attending neuroradiologist and double checked by a second attending neuroradiologist: (a) tumour region, representing borders of the enhanced regions on post-contrast T1-weighted images in comparison with pre-contrast T1-weighted images; and (b) peritumoral oedema on FLAIR images (referred to as ‘oedema’ in this paper). The tumour ROIs did not include definite cystic, necrotic, or haemorrhagic areas. The necrosis was defined as a non-enhancing region with cerebrospinal fluid (CSF) signal intensity on FLAIR images. The ROIs were selected using ImageJ software (http://rsb.info.nih.gov/ij/) on the whole image volume encompassing the pathogenic areas (Figure 2).
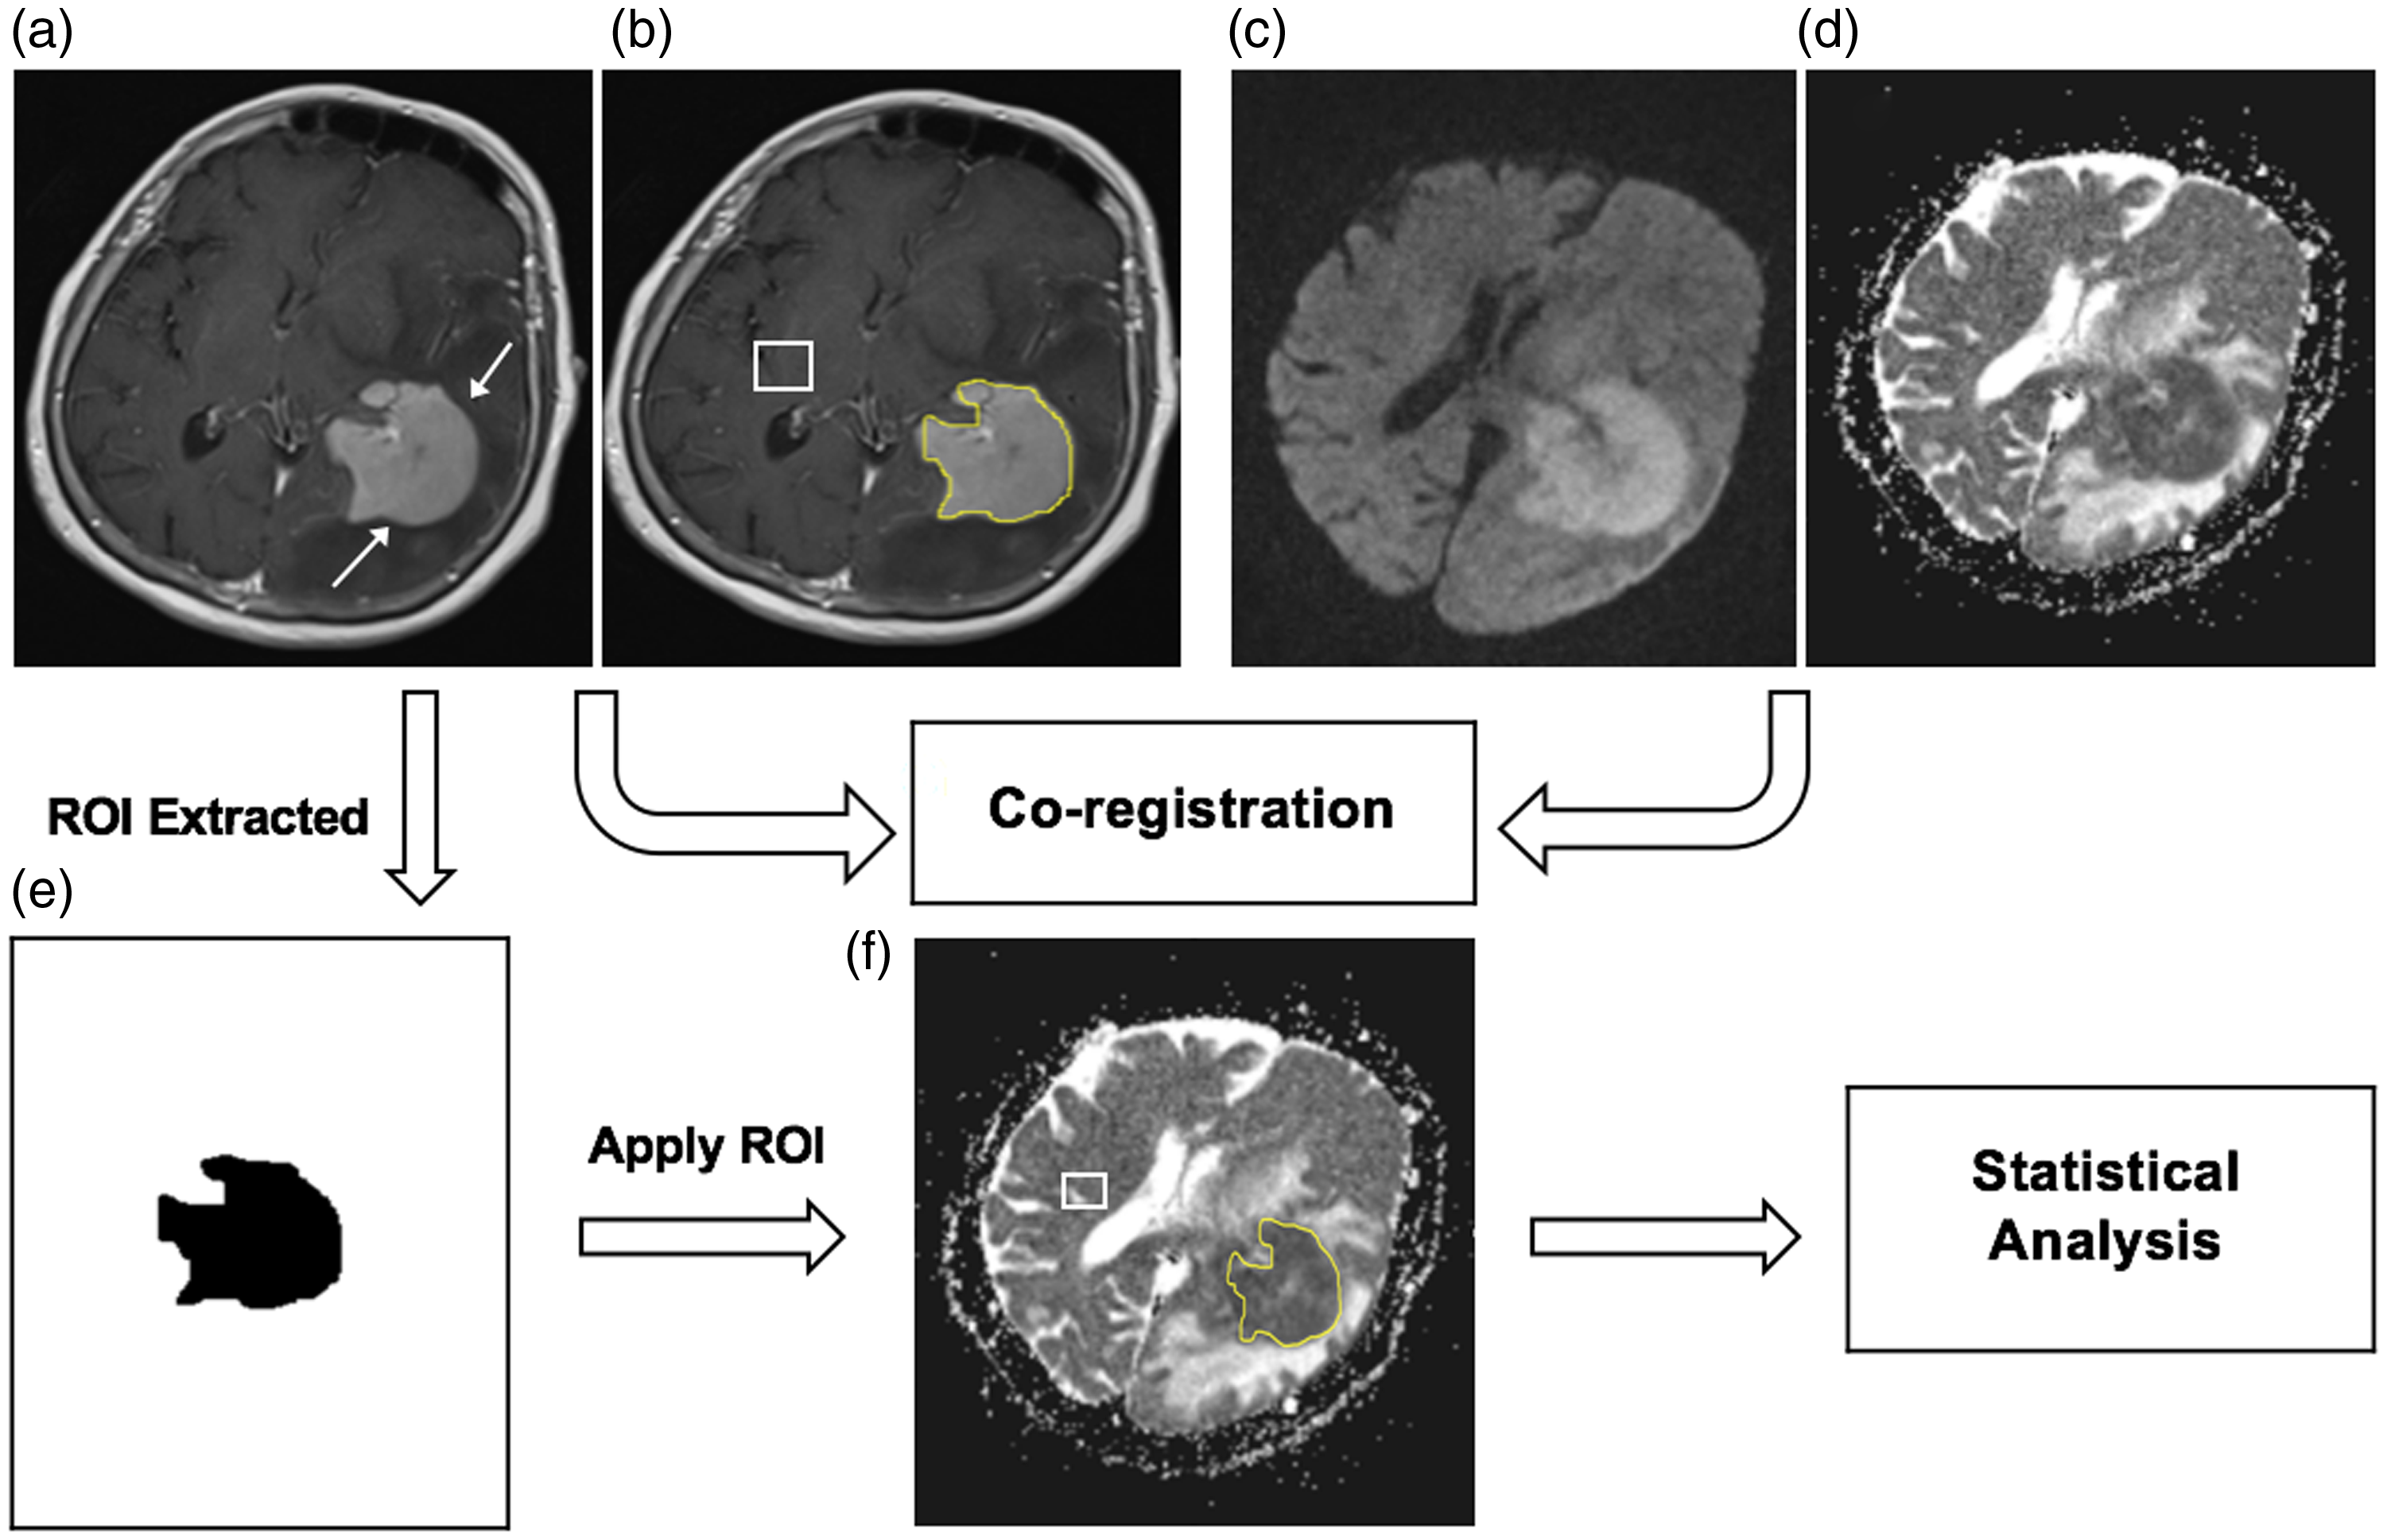
Example of ROI selection and co-registration. The axial T1 post-contrast MRI image shows a biopsy-confirmed lymphoma involving the left basal ganglia (arrows, a) with corresponding DWI sequence (c) and ADC map (d). Images were used to delineate (b) and extract the ROIs (e) for the tumour, which were then co-registered with the ADC map (f). White boxes (b) and (f) show the control normal-appearing contralateral parenchyma. Similar methods were used to select and co-register peritumoral ROIs in FLAIR images (instead of T1 post-contrast).
As described in detail in our previous study, 15 ADC maps were co-registered with their corresponding post-contrast axial T1-weighted and FLAIR images using a rigid-body intra-subject registration approach with the normalised mutual information similarity measure and trilinear transformation method (FMRIB’s linear image registration tool (FLIRT), FSL Library, https://fsl.fmrib.ox.ac.uk/fsl/fslwiki). The FSOH features were then calculated from the distribution of ADC values within each of the ROIs. Control ADC values were calculated from normal-appearing contralateral white matter by mirroring the pathogenic ROIs. Then, FSOH analysis was applied and selected several statistical features including ADC mean, maximum, minimum, median, normalised apparent diffusion coefficient mean (NADC), standard deviation (SD), smoothness, third moment, uniformity, entropy, kurtosis, the 25th, the 75th and the 95th percentiles of the histogram were extracted. NADC was described as the ratio of mean ADC of the selected ROI (tumour or oedema) to that of the normal-appearing white matter. SD shows the contrast of ROI and smoothness represents how gray level changes in each selected ROI. Examples of ADC map histograms for GBM and PCNSL in the peritumoral oedema has been shown in Figure 3.
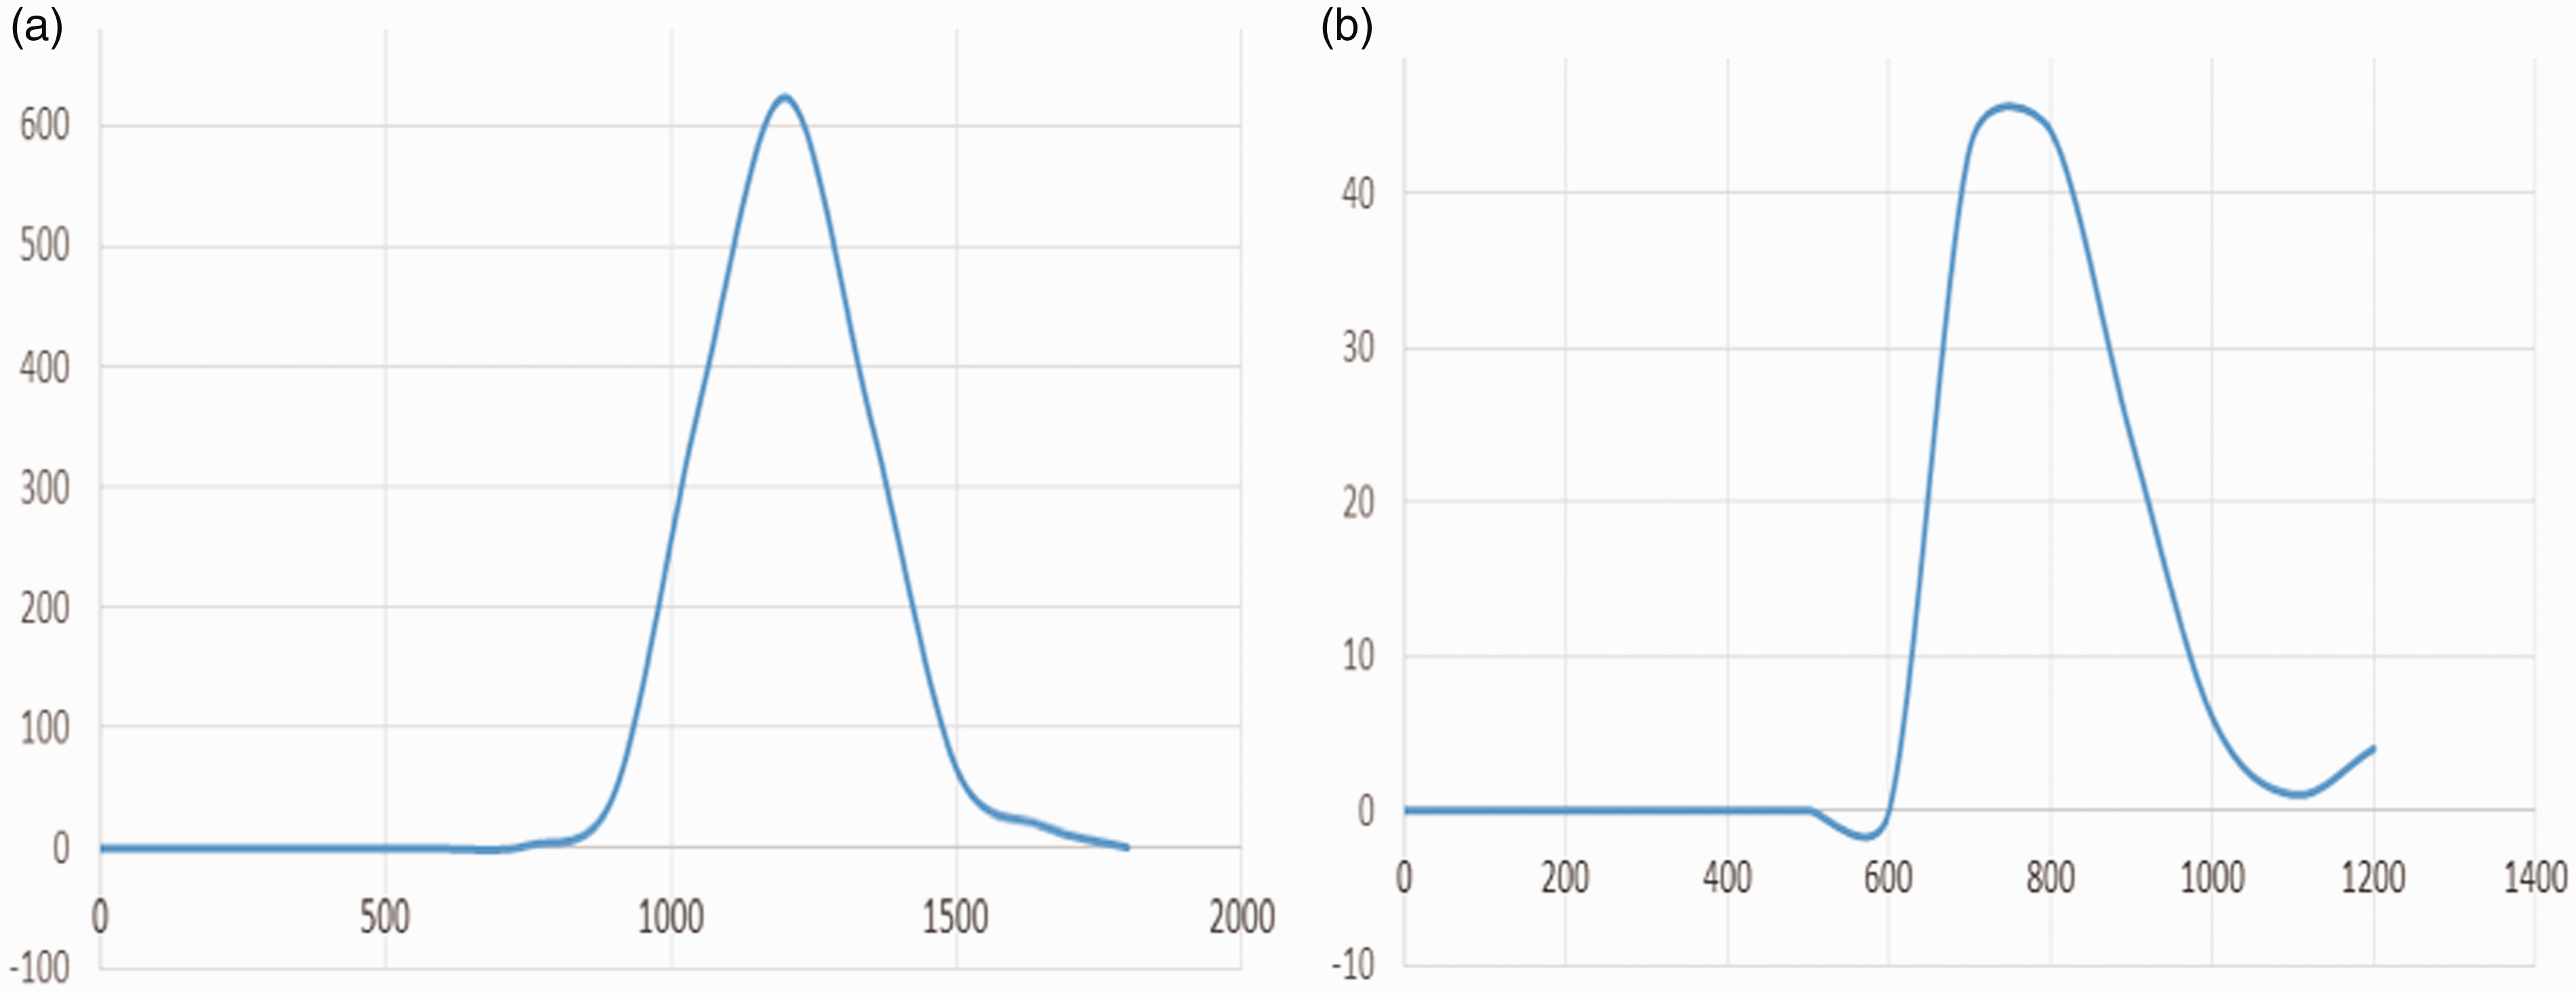
Examples of ADC map histograms on which the X axis shows brightness intensity and the Y axis is representative of the frequency of each brightness intensity. Histogram (a) depicts the distribution of brightness intensity of GBM peritumoral oedema and histogram (b) shows one related to lymphoma peritumoral oedema. The difference between two histograms is obvious that may help to differentiate these two entities.
In some of the patients it was not possible to measure the ROIs accurately for the tumour or oedema secondary to the different appearance of the tumour or scant amount of enhancing tumour secondary to massive necrosis or cystic changes. Evaluation of the ROI for tumour was possible in 70 patients (50 GBM and 20 PCNSL) and the ROI for oedema was possible in 47 patients (27 GBM and 20 PCNSL).
Statistical analysis
Statistical analysis was performed using MedCalc Statistical Software version 15.8 (MedCalc Software bvba, Ostend, Belgium; https://www.medcalc.org; 2015). Each variable was reported as mean ± SD or median and was compared between GBM and PCNSL groups using the independent t-test or Mann–Whitney U-test, respectively. The receiver operating characteristic (ROC) curve was created for each FSOH feature that was significantly different between GBM and PCNSL groups and the area under the curve (AUC) was calculated. A cut-off point was calculated for each FSOH feature based on the AUC and the respective sensitivity and specificity and their 95% confidence intervals (CIs) were calculated. A P value less than 0.05 was considered for all statistical analyses.
Results
A total of 82 patients (52 men, 30 women) with a mean age of 55 ± 1.4 years were initially included in the study. The mean age in the GBM (54 ± 3.2 years) and PCNSL (57 ± 4.6 years) groups was similar (P > 0.05) and male gender (GBM: 29 men, PCNSL: 23 men) was not significantly different between the two groups (P > 0.05). Evaluation of ROIs for the tumour and oedema was possible in 70 (mean age: 56 ± 1.5 years; 47 male, 23 female) and 47 (mean age 56 ± 1.4 years; 32 male, 15 female) patients, respectively.
FSOH features based on the tumour ROIs
The FSOH feature values in GBM and PCNSL groups based on the tumour ROIs have been summarised in Table 1. ADC mean, maximum, median, uniformity and entropy were higher in the GBM group than the PCNSL group (P ≤ 0.001). The FSOH feature smoothness was lower in the GBM group compared to the PCNSL group (P = 0.004). There was no significant difference in NADC, SD, third moment, kurtosis and percentiles between the two study groups (P > 0.2).
Comparison of FSOH features values between GBM and PCNSL groups based on the tumour ROIs.
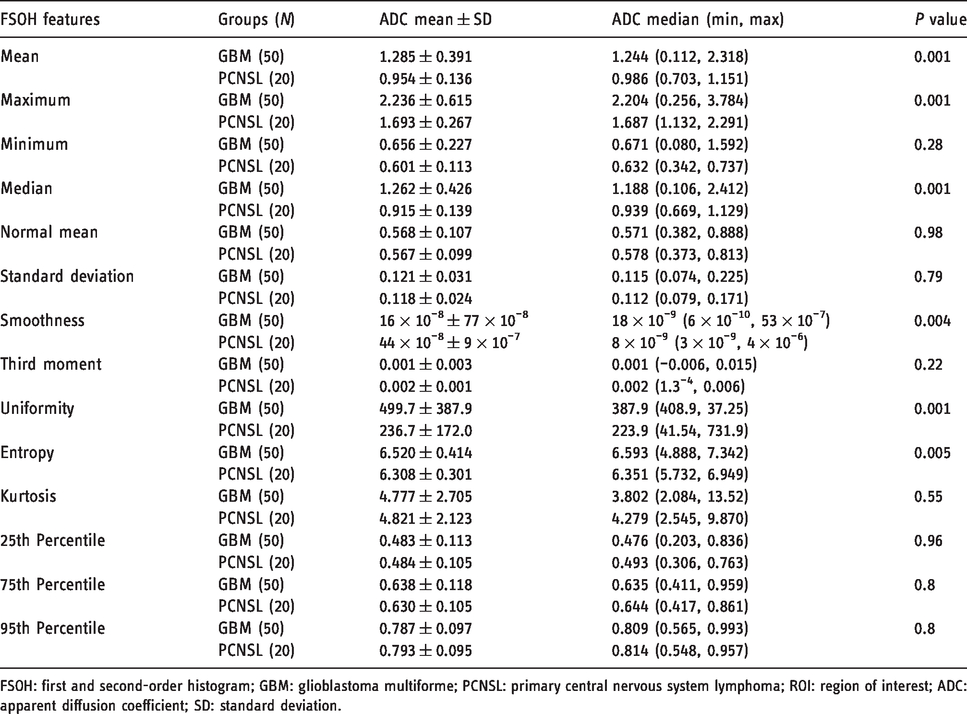
FSOH: first and second-order histogram; GBM: glioblastoma multiforme; PCNSL: primary central nervous system lymphoma; ROI: region of interest; ADC: apparent diffusion coefficient; SD: standard deviation.
Table 2 summarises the cut-off value, sensitivity and specificity based on the tumour ROIs to differentiate GBM from PCNSL. The most sensitive FSOH features to differentiate GBM from PCNSL were the maximum of 2.026 or less (95% CI 75.1–99.9%), followed by mean of 1.105 or less (90% CI 68.3–98.8%) and median of 1.035 or less (85% CI 62.1–96.8%) and uniformity of 331.603 or less (85% CI 62.1–96.8%). The most specific FSOH for GBM was smoothness of 1.28 or greater (84% CI 70.9–92.8%), followed by median of 1.035 or less (76% CI 61.8–86.9%), mean of 1.105 or less (72% CI 57.5–83.8%) (Figure 4).
The AUC of the ROC analysis, the cut-off value, sensitivity and specificity based on the tumour ROIs to differentiate GBM from PCNSL.
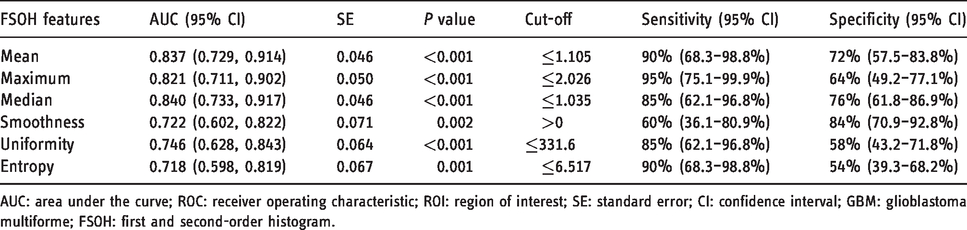
AUC: area under the curve; ROC: receiver operating characteristic; ROI: region of interest; SE: standard error; CI: confidence interval; GBM: glioblastoma multiforme; FSOH: first and second-order histogram.
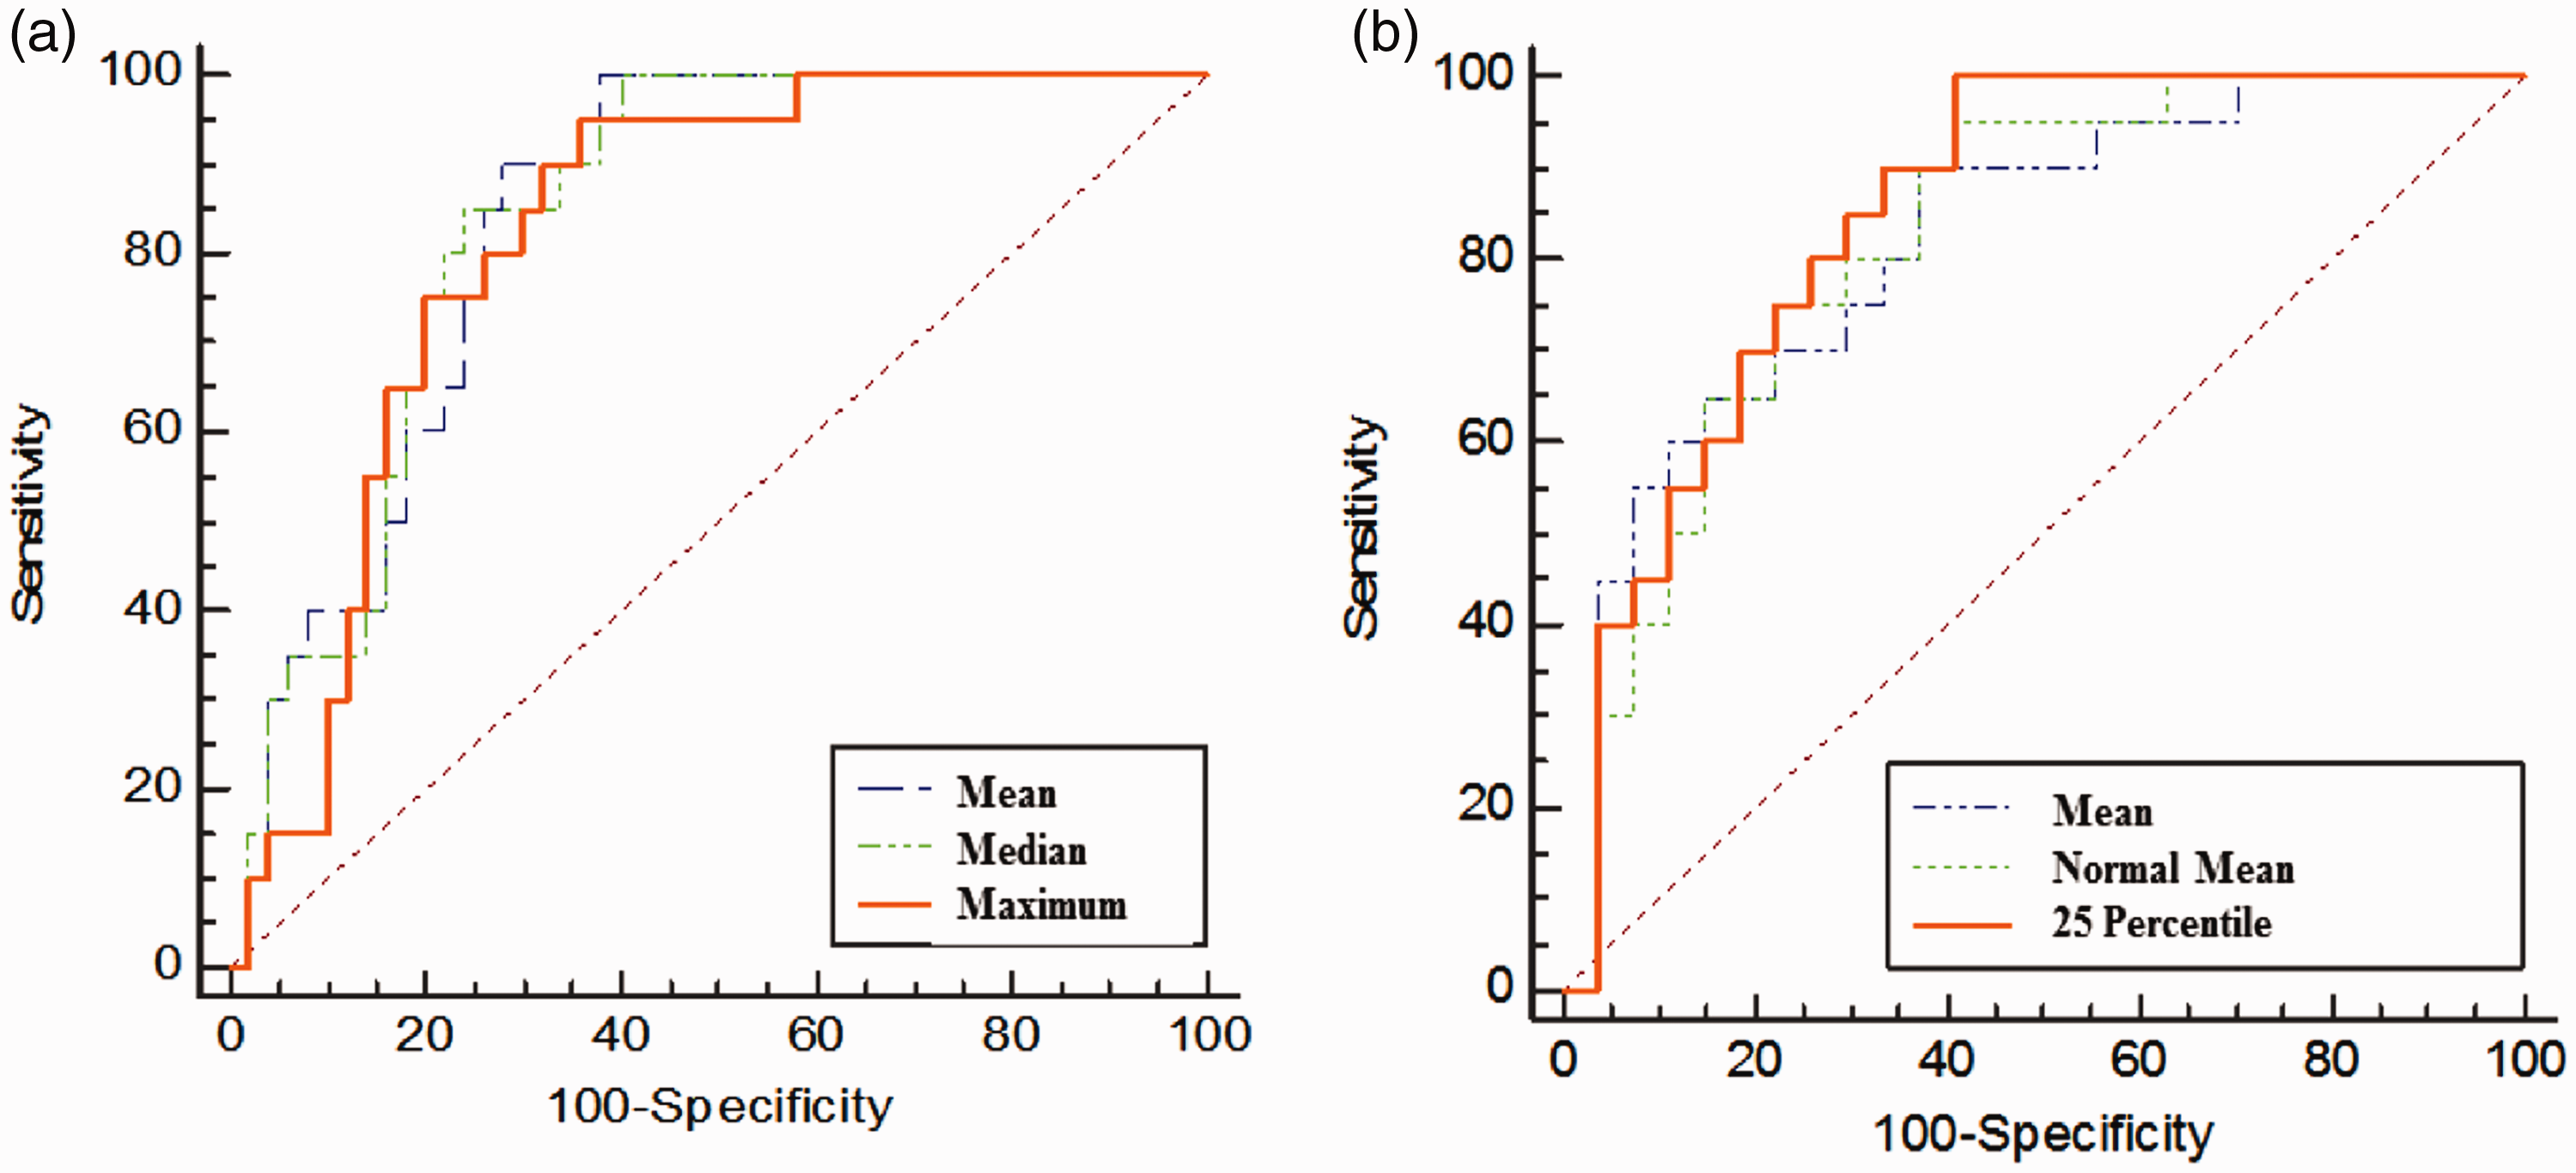
Examples of the ROC curves of selected FSOH-extracted variables based on the ROIs for tumour (a) and peritumoral oedema (b). ROC: receiver operating characteristic; FSOH: first and second-order histogram; ROIs: regions of interest.
FSOH features based on the oedema ROIs
The FSOH feature values in GBM and PCNSL groups based on the oedema ROI have been summarised in Table 3. Most of the FSOH features including mean, minimum, median, normal mean, the percentiles (the 25th, the 75th and the 95th) were higher in the GBM group compared to the PCNSL group (P ≤ 0.015). A few FSOH features such as SD, third moment and entropy were smaller in the GBM group than the PCNSL group (P ≤ 0.005). There was no statistically significant difference in maximum, smoothness, uniformity and kurtosis between the two groups (P > 0.5).
Comparison of FSOH features values between GBM and PCNSL groups based on the oedema ROI.
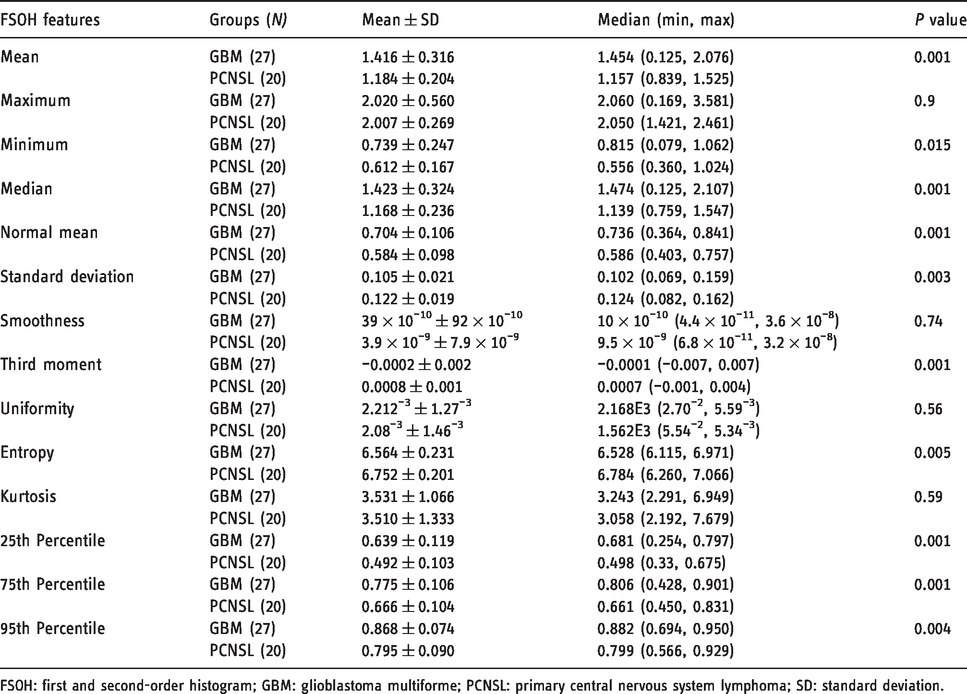
FSOH: first and second-order histogram; GBM: glioblastoma multiforme; PCNSL: primary central nervous system lymphoma; SD: standard deviation.
The cut-off value, sensitivity and specificity based on the oedema ROIs to differentiate GBM from PCNSL have been summarised in Table 4. The most sensitive FSOH features to differentiate GBM from PCNSL were the 25th percentile of 0.675 or less (100% CI 83.2–100%), followed by NADC of 0.726 or less (95% CI 75.1–99.9%) and mean of 1.44 or less (90% CI 68.3–98.8%). The most specific FSOH for GBM were median of 1.28 or less (85.9% CI 66.3–95.8%), followed by the 95th percentile of 0.809 or less (85.19% CI 66.3–95.8%) and the 75th percentile of 0.708 or less (81.5% CI 61.9–93.7%) (Figure 4).
The AUC of the ROC analysis, the cut-off value, sensitivity and specificity based on the oedema ROIs to differentiate GBM from PCNSL.
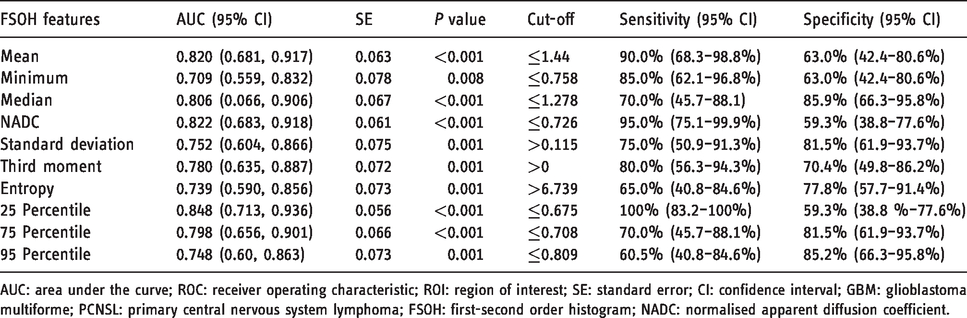
AUC: area under the curve; ROC: receiver operating characteristic; ROI: region of interest; SE: standard error; CI: confidence interval; GBM: glioblastoma multiforme; PCNSL: primary central nervous system lymphoma; FSOH: first-second order histogram; NADC: normalised apparent diffusion coefficient.
Discussion
Texture analysis is an evolving, non-invasive technique to assess tissue characteristics in a selected ROI, which may provide quantitative information about the morphology and pathological characteristics of the investigated tissue.13,19,20 MRI texture analysis has been shown to be helpful in the differential diagnosis of different types of malignancies, 21 as well as cognitive disease and brain tumours,7,12,14,22–25 There has been growing attention to MRI texture analysis of brain tumours, 20 particularly advanced quantitative analysis of the ADCs using FSOH features.14,15,25 These advanced features have been used to differentiate types of brain tumours, based on their grading,14,26 location, 16 progression, 27 functional status of the brain tumours, 15 or even overall survival.28,29
Our study demonstrated that some of the FSOH features of ADC measured in the tumour ROIs, including mean, maximum, smoothness, uniformity and entropy, were significantly different between the GBM and PCNSL. Similar to our findings, Toh et al. found that ADC values were higher in GBMs than PCNSLs, 9 although they only reported mean values of ADC whereas we studied and reported more comprehensive ADC statistics with their cut-off values. The difference in ADC statistics between GBM and PCNSL have been assumed to be related to the tumour cellularity. 12 A recent study used texture analysis with different combinations of MRI images on post-contrast T1-weighted images and T2-weighted images and found a sensitivity of 94% to differentiate low-grade gliomas from high-grade gliomas. 30 In our study, the maximum ADC of 2.026 or less in tumour ROI had a sensitivity of 95% to differentiate GBM from PCNSL and the ADC mean of 0.943 or less in the tumour region had a specificity of 91.2%. The sensitivity and specificity in our study were comparable to previous studies,9,12,14 although there is deference in the cut-off values among the studies, which is likely to be due to the differences in MRI machine, software used, ROI selection technique and image analysis tools.
Our results suggested that the FSOH features measured in the oedema ROIs may be valuable to differentiate GBMs from PCNSLs with high sensitivity and specificity. The importance of oedema analysis in the diagnosis of malignant brain tumours was suggested initially about 15 years ago. 31 More recently, the radiomic features of the peritumoral T2 hyperintensity using texture analysis in patients with pretreatment GBM suggested incremental prognostic value of peritumoral radiomics as a MRI biomarker in pretreatment glioblastoma. 32 Although the lower ADC values in the tumour region of PCNSL compared to GBM have previously been reported,8,9,33 there are only a few studies comparing the ADC values in the peritumoral region of PCNSL and GBM. Lu et al. recommended that peritumoral MRI metrics may enable us to distinguish metastatic brain tumours from gliomas. 17 In contrast, Server et al. did not find the ADC values or ratios in the oedema region useful in differentiating gliomas, lymphomas, metastases and high grade meningiomas. 18 Server et al. 18 studied different brain tumours and used different techniques, which may account for the different results from our study. There is an inverse relationship between the ADC values and tumour cellularity in gliomas and lymphomas, 33 and the lower ADC values in the peritumoral region in PCNSL compared to GBM probably suggest greater non-enhancing tumour and less heterogeneity in the peritumoral region of PCNSL than GBM, which may initially seem counterintuitive. In contrast to our findings, Ko et al. reported lower ADC values in the peritumoral region of GBM compared to PCNSL, which was thought to be due to lesser water diffusivity secondary to more infiltrating tumour cells. 34 In their study, the authors only reported mean ADC values and only in selected ROIs of the peritumoral region, while in our study the ROIs were delineated on the whole image volume encompassing the pathogenic areas, and comparison was made for several FSOH features. These may contribute to the different findings between the two studies. Positron emission tomography with 18F-fluoromisonidazole (18F-FMISO) is used to image hypoxic areas of high grade gliomas which are resistant to radiotherapy and chemotherapy. Texture analysis using histogram analysis of the 18F-FMISO uptake distributions has been utilised for prediction of the prognosis of patients with postsurgical brain cancers. 35
One of the limitations of this study is that the neuroradiologists were able to delineate oedema ROIs in only 47 out of 82 patients (57%). Although evaluation of FSOH features measured in the oedema ROIs showed more promising significant findings compared to the tumour ROIs, the feasibility of ROI delineation may limit its clinical application. This can be improved by novel technologies and more powerful image analysis tools and can be further investigated in future studies. The FSOH feature in this study may be investigated in the other relevant entities including brain abscess and metastasis. The tumour ROIs in this study did not include definite cystic, necrotic, or haemorrhagic areas. Tumours with greater areas of necrosis may be more heterogeneous and qualitative or quantitative analysis of the necrotic area may be a useful feature for distinguishing between GBM and PCNSL, which can be further evaluated in future studies.
Conclusions
In summary, FOSH features derived from ADC maps may be helpful in differentiating brain GBM from PCNSL. This technique may have the potential to be incorporated into artificial intelligence interfaces and may be beneficial in clinical decisions and treatment planning for neurosurgical interventions of brain tumours.
Footnotes
Conflict of interest
The authors declared no potential conflicts of interest with respect to the research, authorship, and/or publication of this article.
Funding
The authors received no financial support for the research, authorship, and/or publication of this article.