
Abstract
Purpose
Obesity has become a major health problem and is associated with endocrine disorders and a disturbed hypothalamic-pituitary axis. The purpose of this study was to correlate pituitary gland volume determined by routine magnetic resonance imaging with patient characteristics, in particular body mass index and obesity.
Material and methods
A total of 144 ‘healthy’ patients with normal findings in cerebral magnetic resonance imaging were retrospectively included. Pituitary gland volume was measured in postcontrast three-dimensional T1-weighted sequences. A polygonal three-dimensional region of interest covering the whole pituitary gland was assessed manually. Physical characteristics (gender, age, body height and body mass index) were correlated with pituitary gland volume. Multiple subgroup and regression analyses were performed.
Results
Pituitary gland volumes were significantly larger in females than in males (p<0.001) and young individuals (<35 years) versus middle-aged patients (35–47 years) (p=0.042). Obese patients (body mass index ≥30) had significantly larger pituitary gland volumes than overweight (25<body mass index<30; p=0.011) and normal-weight (body mass index <25; p=0.005) patients. In males, pituitary gland volumes of body mass index subgroups showed significant differences (p=0.038). Obese males had larger pituitary gland volumes than overweight patients (p=0.066) and significantly larger volumes than normal-weight (p=0.023) patients. Obese females also had larger pituitary gland volumes but without statistical significance (p>0.05). Regression analysis showed that increased pituitary gland volume is associated with higher body mass index independent from gender, age and body height.
Conclusion
Pituitary gland volume is increased in obese individuals and a high body mass index can be seen as an independent predictor of increased pituitary gland volume. Therefore, gland enlargement might be an imaging indicator of dysfunction in the hypothalamus-pituitary axis. Besides gender and age, body mass index should be considered by radiologists when diagnosing abnormal changes in pituitary gland volume.
Introduction
The increasing number of obese individuals has become a major health problem. Obesity is associated with atherosclerosis, insulin resistance and an increased risk of various cancers. Obese persons have a lower life expectancy. 1 Endocrine disorders can lead to obesity, while obesity in turn can affect the hypothalamic-pituitary reproductive axis. 2
Magnetic resonance imaging (MRI) is the gold standard for imaging the pituitary gland. 3 Rapid advances in MRI technology have improved its diagnostic accuracy in a growing number of oncological, neurological and endocrine pathologies over the last two decades.3,4 The size and shape of the pituitary gland are known to be associated with a variety of pathologies or disorders including endocrinopathies, idiopathic intracranial hypertension, schizophrenia, poor growth in children and many others.4–10
It is now well established that pituitary gland volume (PGV) changes during puberty, pregnancy, lactation and ageing. The upper surface of the gland is typically flat or slightly concave. In teenagers, convex upper margins can be observed (in girls more frequently than in boys). Earlier MRI studies conducted to obtain reference values of normal PGV focused on diameter measurement and morphological features in relation to age and gender. Recent studies used pituitary gland volumetric analysis to evaluate changes in a diversity of conditions including depression, schizophrenia, drug addiction, polycystic ovary syndrome, hormone deficiencies and even seasonal physiological variations.5,11–13
With high-resolution three-dimensional MRI the shape and size can be analysed volumetrically with greater precision than ever before. Although, for some pathologies, MRI of the pituitary gland including assessment of its size and shape is part of routine clinical workup, no reference standards exist so far. Rather, the diagnosis of pituitary abnormalities tends to be subjective and depends on the radiologist or neuroradiologist interpreting the images.
The purpose of this study was to perform state-of-the-art MRI volumetric analysis and to correlate PGV with body mass index (BMI) focusing on obesity.
Material and methods
Patients
We retrospectively identified all patients who underwent cerebral MRI at one centre referred by our neurology department between 2016–2018. Only patients with normal MRI findings (established by a neuroradiologist with 10+ years of experience) and no diagnosis of a disease associated with affliction of the endocrine axis were included.14,15 According to these criteria, we could include a total of 144 patients. The most common indication for the MRI examination was headache. Patients younger than 18 years and older than 75 years were excluded. Other exclusion criteria were equivocal findings suggesting pituitary gland pathology and poor image quality. Patient characteristics (age, gender, body height, body weight and BMI) were retrieved from the department’s Radiological Information System (RIS) and electronic patient records. Our institutional review board approved this retrospective study and waived informed consent because of the retrospective study design.
Ethics approval
This retrospective study involving human participants was in accordance with the ethical standards of the institutional and national research committee and with the 1964 Helsinki Declaration and its later amendments or comparable ethical standards. The Human Investigation Committee of our institution approved this study (registration number: EA1/231/19).
Imaging
All patients included in our retrospective analysis were imaged with a full cerebral contrast-enhanced MRI protocol on a 1.5T MRI scanner (MAGNETOM Aera, Siemens Healthcare, Erlangen, Germany). Gadobutrol (Gadovist, Bayer, Berlin, Germany) was used as contrast agent and manually injected at a dose of 0.1 ml/kg body weight via the antecubital vein. The pulse sequence used in our retrospective analysis was acquired 3 min after contrast injection. The MRI protocol used in the study patients comprised a postcontrast three-dimensional (3D) T1-weighted (T1-w) gradient-echo (GRE) sequence (magnetization-prepared 180-degree radiofrequency pulses and rapid gradient-echo, MPRAGE, Siemens, Germany; repetition time (TR): 2200 ms, echo time (TE): 2.7 ms, flip angle 8.0°, matrix 256x256, 1.0 mm3 isotropic voxels and slice thickness of 1.0 mm).
Volumetry
Pituitary gland volumetry was performed in the postcontrast 3D T1-w MPRAGE sequence using Visage 7 (Visage Imaging, San Diego, USA). Volumetry of the whole pituitary gland (anterior and posterior lobe) was performed manually using the Visage 3D polygonal region of interest (ROI) tool and is based on the planimetry method. 16 The borders of the pituitary gland were defined by the sphenoid sinus inferiorly, the diaphragma sellae superiorly, in the sagittal plane at the sella turcica and traced in all sagittal slices (Figure 1). Measurements were obtained blindly from patient characteristics.

Set of magnetic resonance (MR) images illustrating three-dimensional (3D) volumetric analysis of the pituitary gland. F, A, and L: Orientation cubes.
Statistics
Statistical analysis was performed using SPSS Statistics (IBM, Version 25). The Kolmogorov-Smirnov test showed non-normal distribution of the data, so that nonparametric testing could be performed. Bivariate correlation analysis (nominal data) was performed using Spearman rank correlation (two-tailed). The Mann-Whitney U-test and Kruskal-Wallis test were used to compare two and multiple independent samples. Linear regression was used to test for independency of the variables. Receiver-operating characteristic (ROC) analysis was performed and Youden’s index was calculated (Sensitivity+Specificity–1). For all analyses, p values <0.05 were considered to indicate statistically significant differences. In tables, significant results were scripted in bold.
Results
Patient characteristics are summarised in Table 1. Correlation analysis showed significant correlations between PGV and gender (p < 0.001, coefficient 0.487), and between PGV and body height (p < 0.001, coefficient −0.346). There was a statistical trend in the correlation between PGV and BMI (p = 0.053, coefficient: 0.162) and no significant correlation was found between PGV and age (p = 0.233, coefficient: –0.100). For further analysis, the variables were classified based on age (a: 18–34 years, b: 35–47 years, c: >47 years) and body height (a: ≤1.69 m, b: 1.70–1.80 m, c: >1.80 m). Cutpoints were chosen to generate comparable group sizes. BMI was classified using the classification system of the World Health Organization (WHO). 17 Patients with a BMI<25 were considered ‘normal weight’, those with a BMI between 25–30 were classified as ‘overweight’ and patients with a BMI≥30 were classified as ‘obese’.
Patient characteristics.
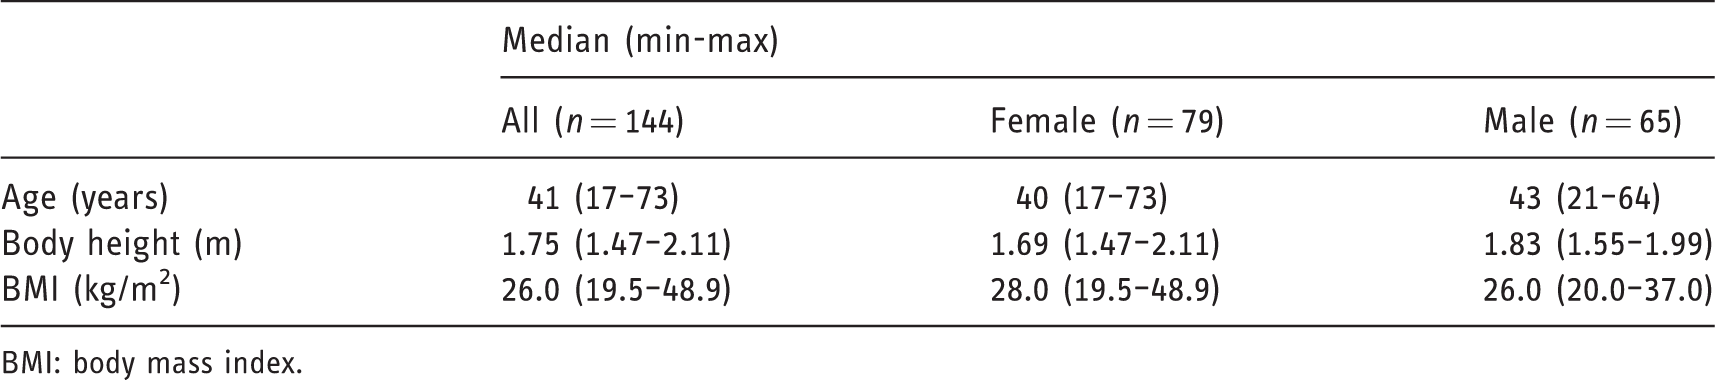
BMI: body mass index.
Females had significantly larger PGVs than males (p < 0.001, 0.46 vs 0.31 cm3) (Figure 2(a)). Overall, there were no significant differences in PGV between the three age groups. However, young patients (<35 years) had significantly larger PGVs than middle-aged patients (35–47 years) (p = 0.039, 0.42 vs 0.34 cm3) (Figure 2(b)). The body height groups showed significant differences in the total population (p < 0.001). Tall patients (>1.80 m) had significantly smaller PGVs than patients between 1.70–1.80 m and also than patients smaller ≤1.69 m body height (p = 0.011 and p < 0.001, 0.30 vs 0.43 vs 0.46 cm3) (Figure 2(c)). Regarding BMI, we identified significant differences between the three groups (p = 0.008). Obese patients with a BMI ≥30 had significantly larger PGVs than overweight (25<BMI<30) and normal weight (BMI<25) patients (p = 0.011 and p = 0.005, 0.49 vs 0.33 and 0.37 cm3) (Table 2 and Figure 2(d)).
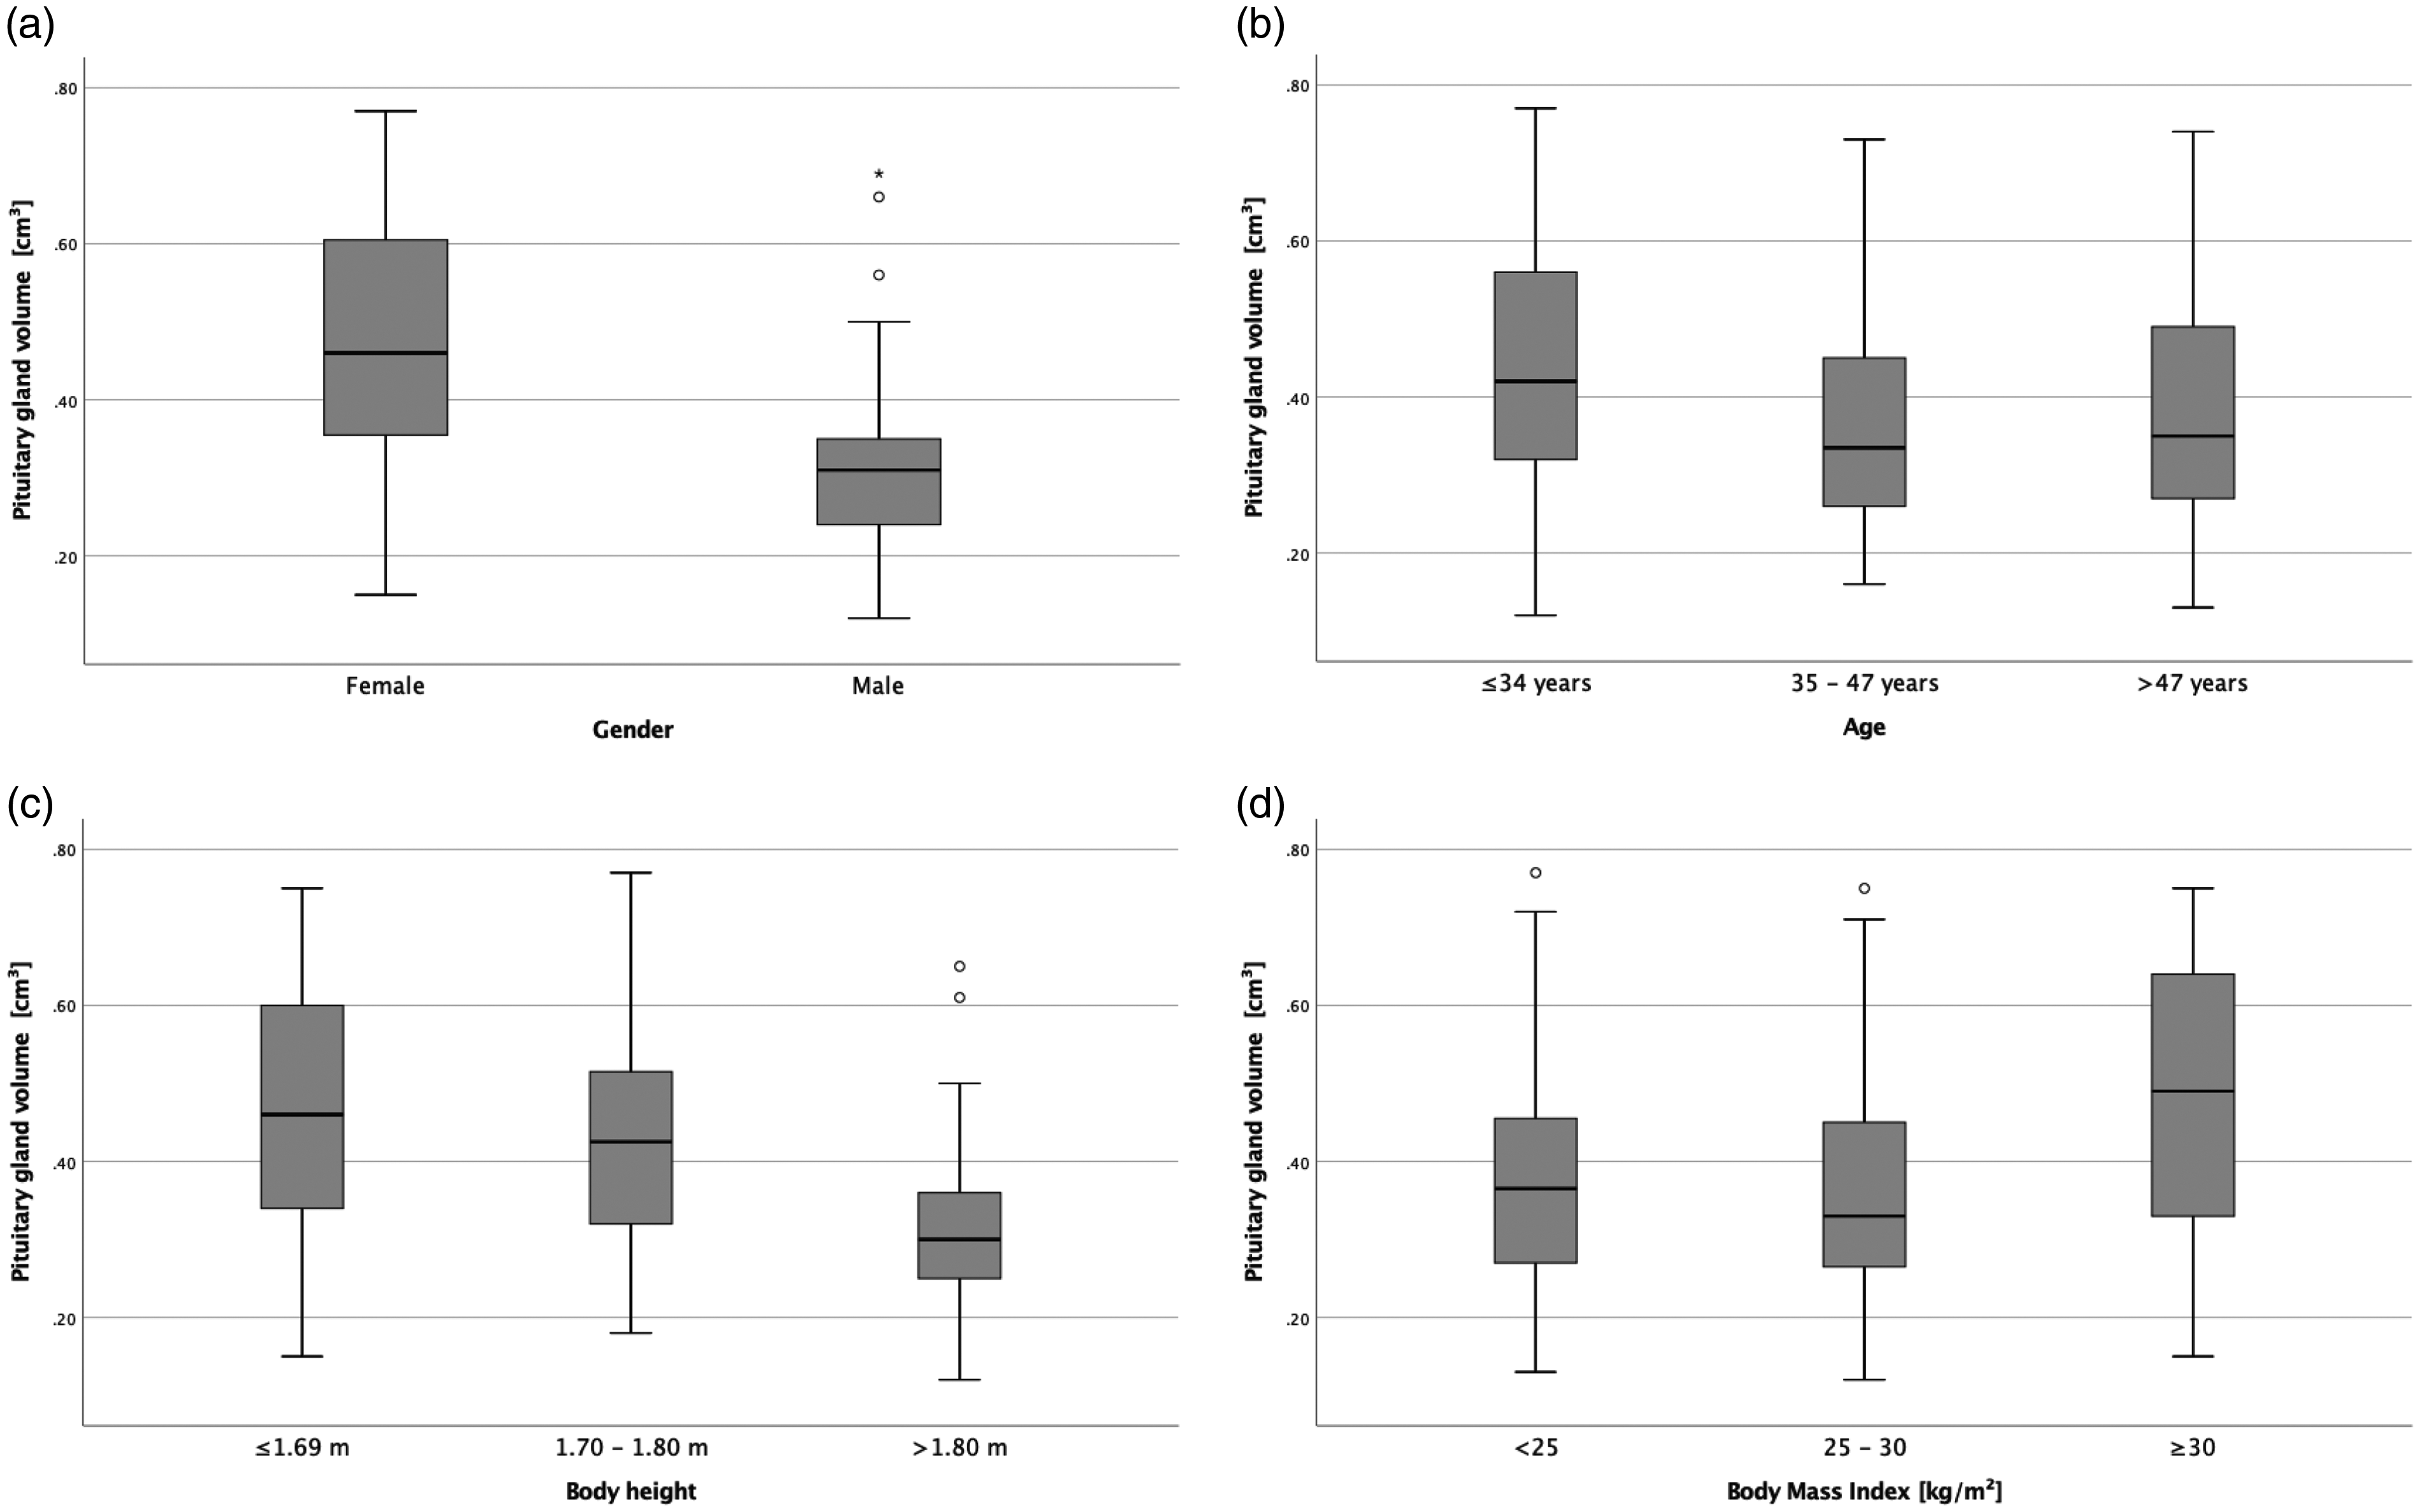
Boxplots of pituitary gland volumes in relation to gender (a), age (b), body height (c), and body mass index (d).
Pituitary gland volume (PGV) differences in all study subjects in relation to gender, age, body height and body mass index (BMI).
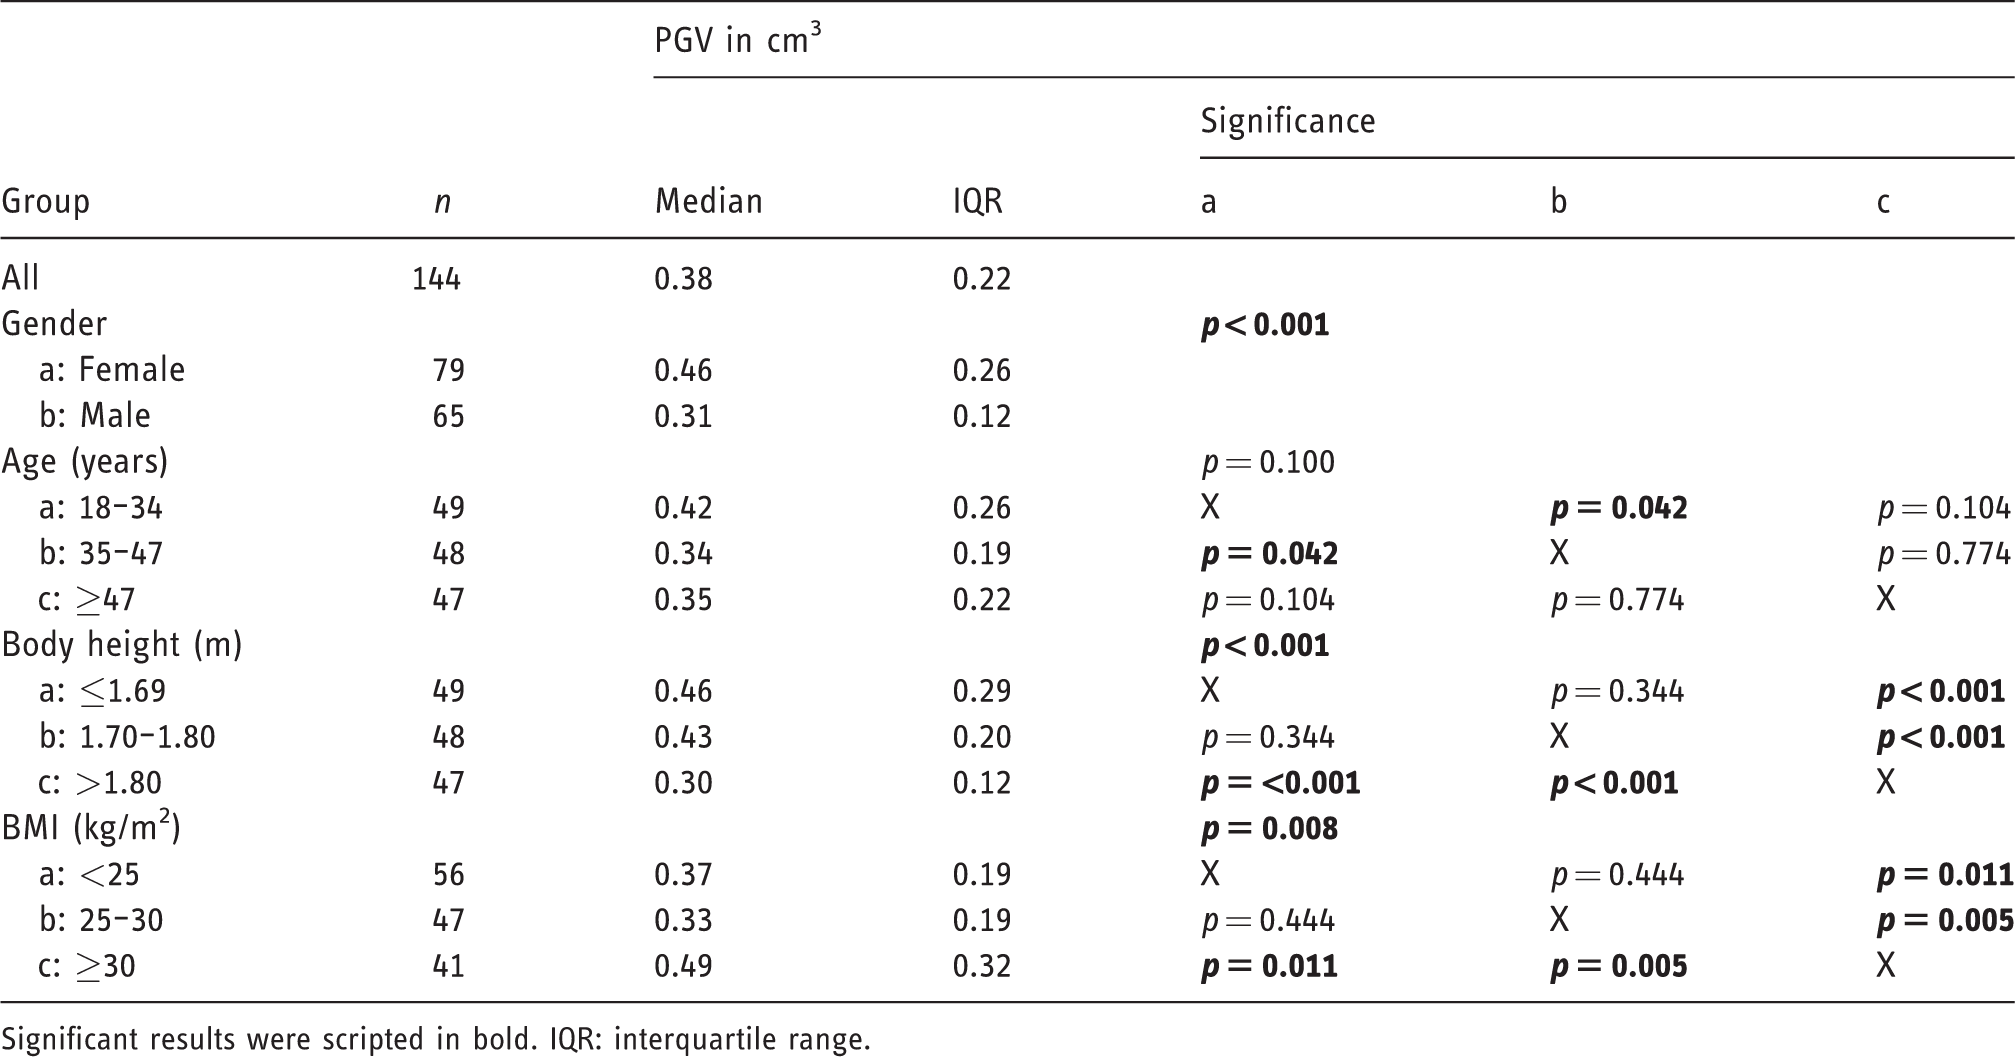
Significant results were scripted in bold. IQR: interquartile range.
Next, the population was divided into females and males for further analysis. Age and body height groups were adjusted to the female (age: a: 18–32 years, b: 33–47 years, c: ≥48 years; body height: a: ≤1.65 m, b: 1.66–1.72 m, c: >1.72 m) and male (age: a: 18–37 years, b: 38–48 years, c: ≥49 years; body height: a: ≤1.80 m, b: 1.81–1.86 m, c: >1.86 m) subgroups to create comparable group sizes. There were no significant differences between the age groups in females (p > 0.05). There was a statistical trend in the different body height groups (p = 0.051), and female patients with heights of 1.66–1.72 m had significantly larger PGVs than patients >1.72 m (p = 0.012, 0.49 vs 0.43 cm3). In the female population, there were no statistically significant differences between the BMI groups (p > 0.05). However, in females PGV was larger in obese patients than in overweight and normal-weight patients. The overweight patient group also had larger PGVs than the normal-weight group (0.49 vs 0.46 vs 0.44 cm3) (Table 3).
Pituitary gland volume (PGV) differences in females in relation to age, body height and body mass index (BMI).
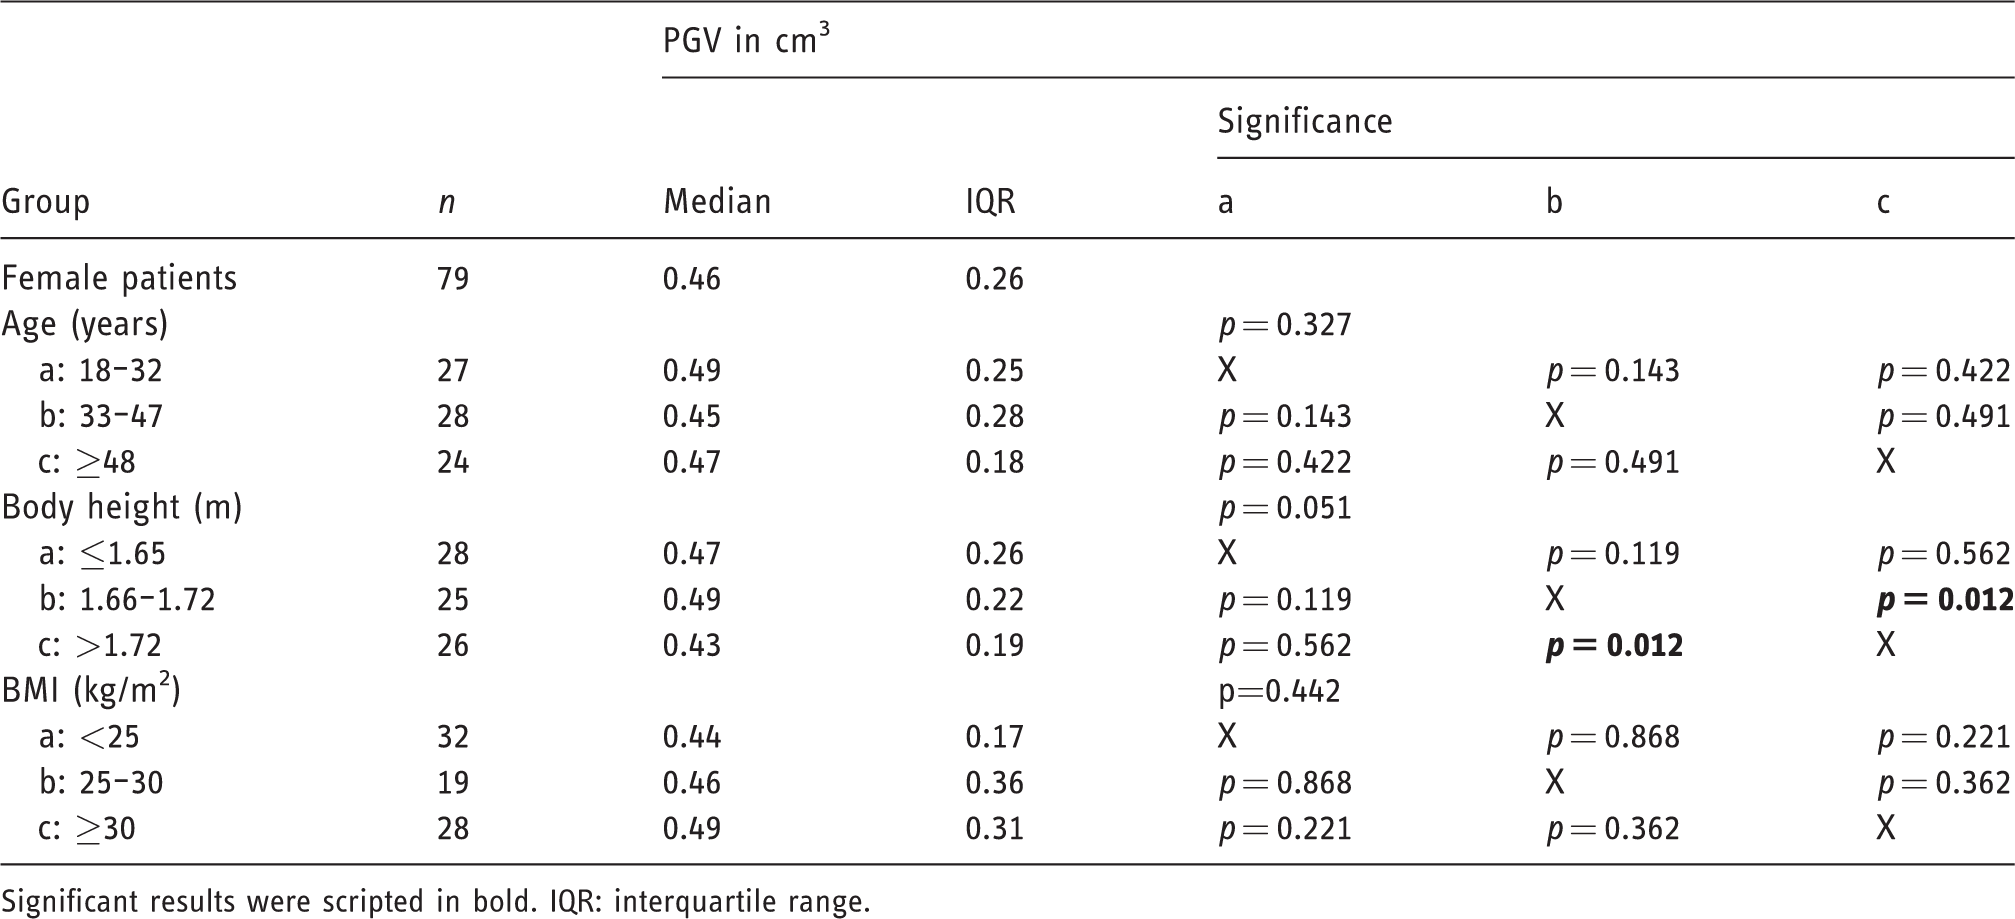
Significant results were scripted in bold. IQR: interquartile range.
In the male study population, there were no significant differences in PGV between the different age and body height groups (p > 0.05). PGV differed significantly between the BMI groups (p = 0.038). Obese male patients had larger PGVs than overweight patients (p = 0.066) and significantly larger PGVs than normal-weight (p = 0.023) patients (0.41 vs 0.32 and 0.27 cm3) (Table 4 and Figure 3).
Pituitary gland volume (PGV) differences in males in relation to age, body height and body mass index (BMI).
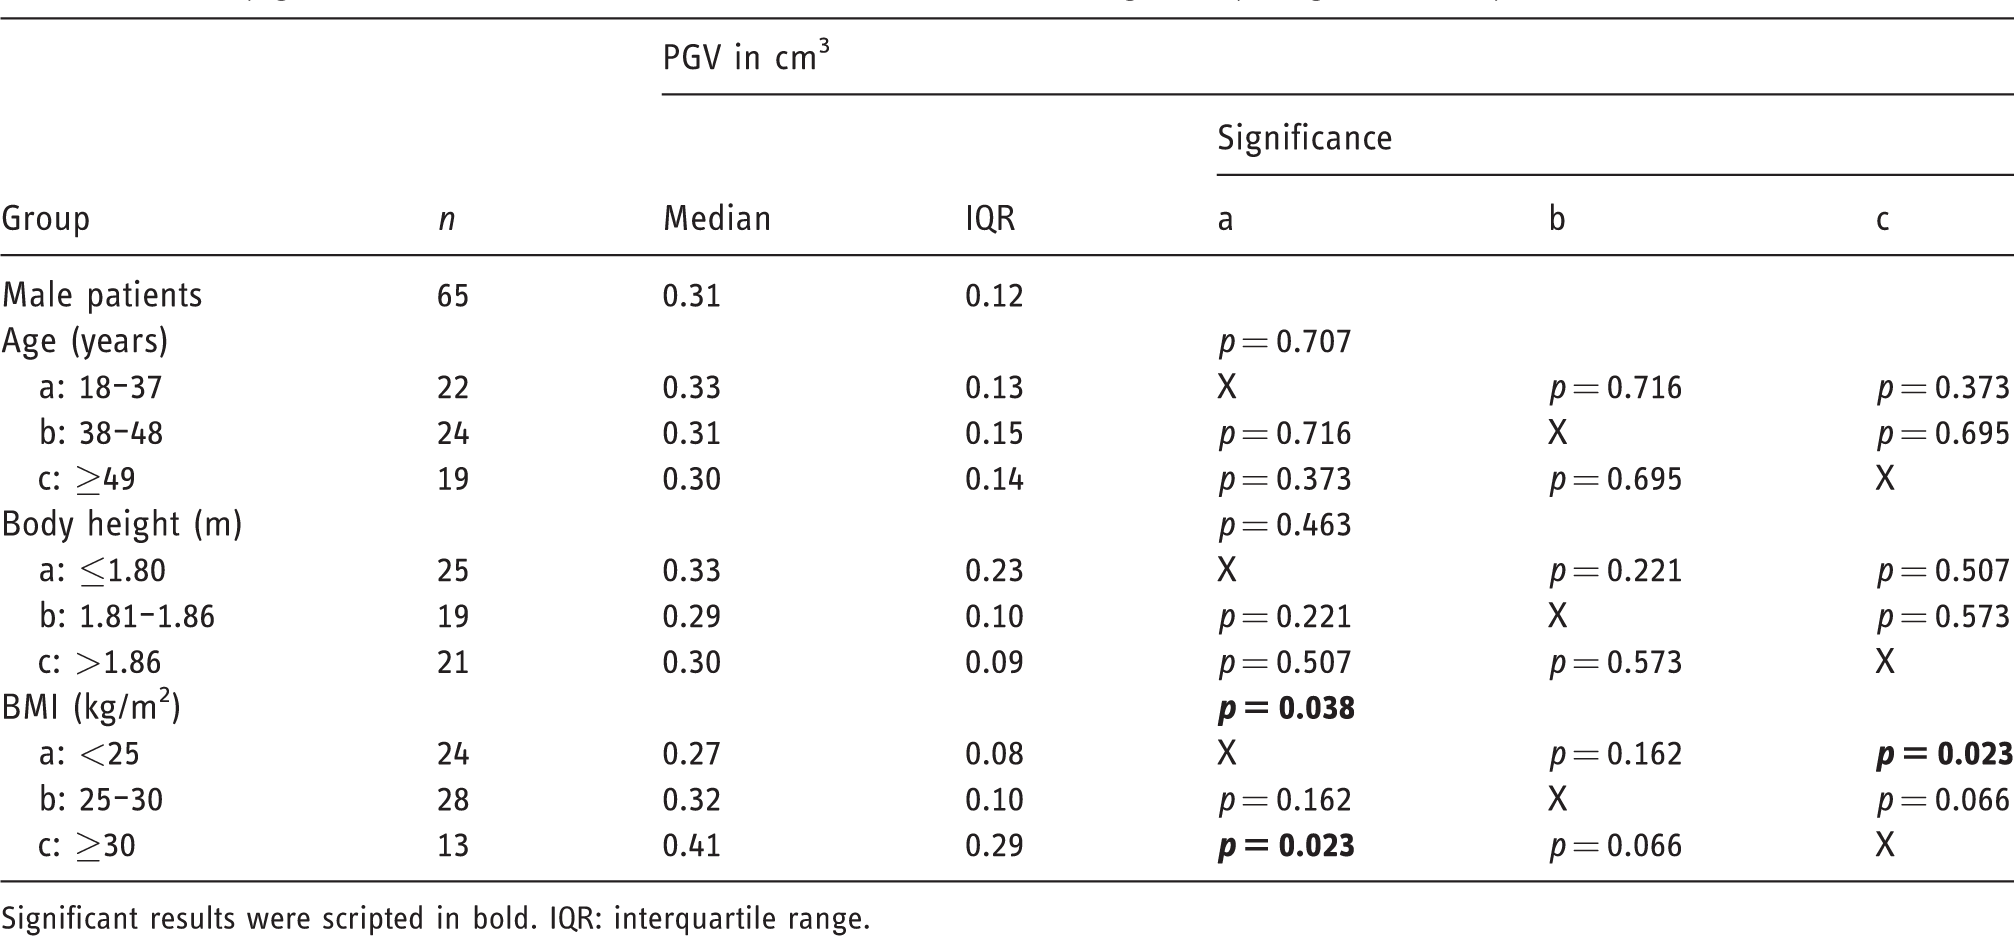
Significant results were scripted in bold. IQR: interquartile range.

Boxplots of pituitary gland volume (PGV) differences related to age, body height and body mass index (BMI) in females ((a), (c), (e)) and males ((b), (d), (f)).
Subsequently, we performed a subgroup analysis regarding obese patients. To this end, the obese patients were divided into males and females, and the two groups were then divided by median body height and age, resulting in four groups per gender (cutoff values: females: height ≥169 cm, age ≥41 years; males: height ≥183 cm, age ≥43 years). In females, PGV was larger in obese patients in both age groups (0.52 and 0.49 vs 0.43 and 0.47 cm3) as well as in both body height groups (0.49 and 0.52 vs 0.46 and 0.43 cm3) but without statistical significance (p>0.05) (Table 5). In males, PGVs were also larger in obese patients in both age and body height groups. Older (≥43 years) non-obese (BMI <30) male patients had significantly smaller PGVs than younger (<43 years) obese (BMI >30) patients (p = 0.038, 0.30 vs 0.37 cm3). PGV was significantly larger in smaller (<1.83 m) obese (BMI >30) patients than in taller (≥1.83 m) non-obese (BMI<30) male patients (p = 0.042, 0.42 vs 0.29 cm3) (Figure 4 and Table 6).
Subgroup analysis – pituitary gland volume (PGV) differences in obese and non-obese females in relation to age and body height groups (divided by the median).
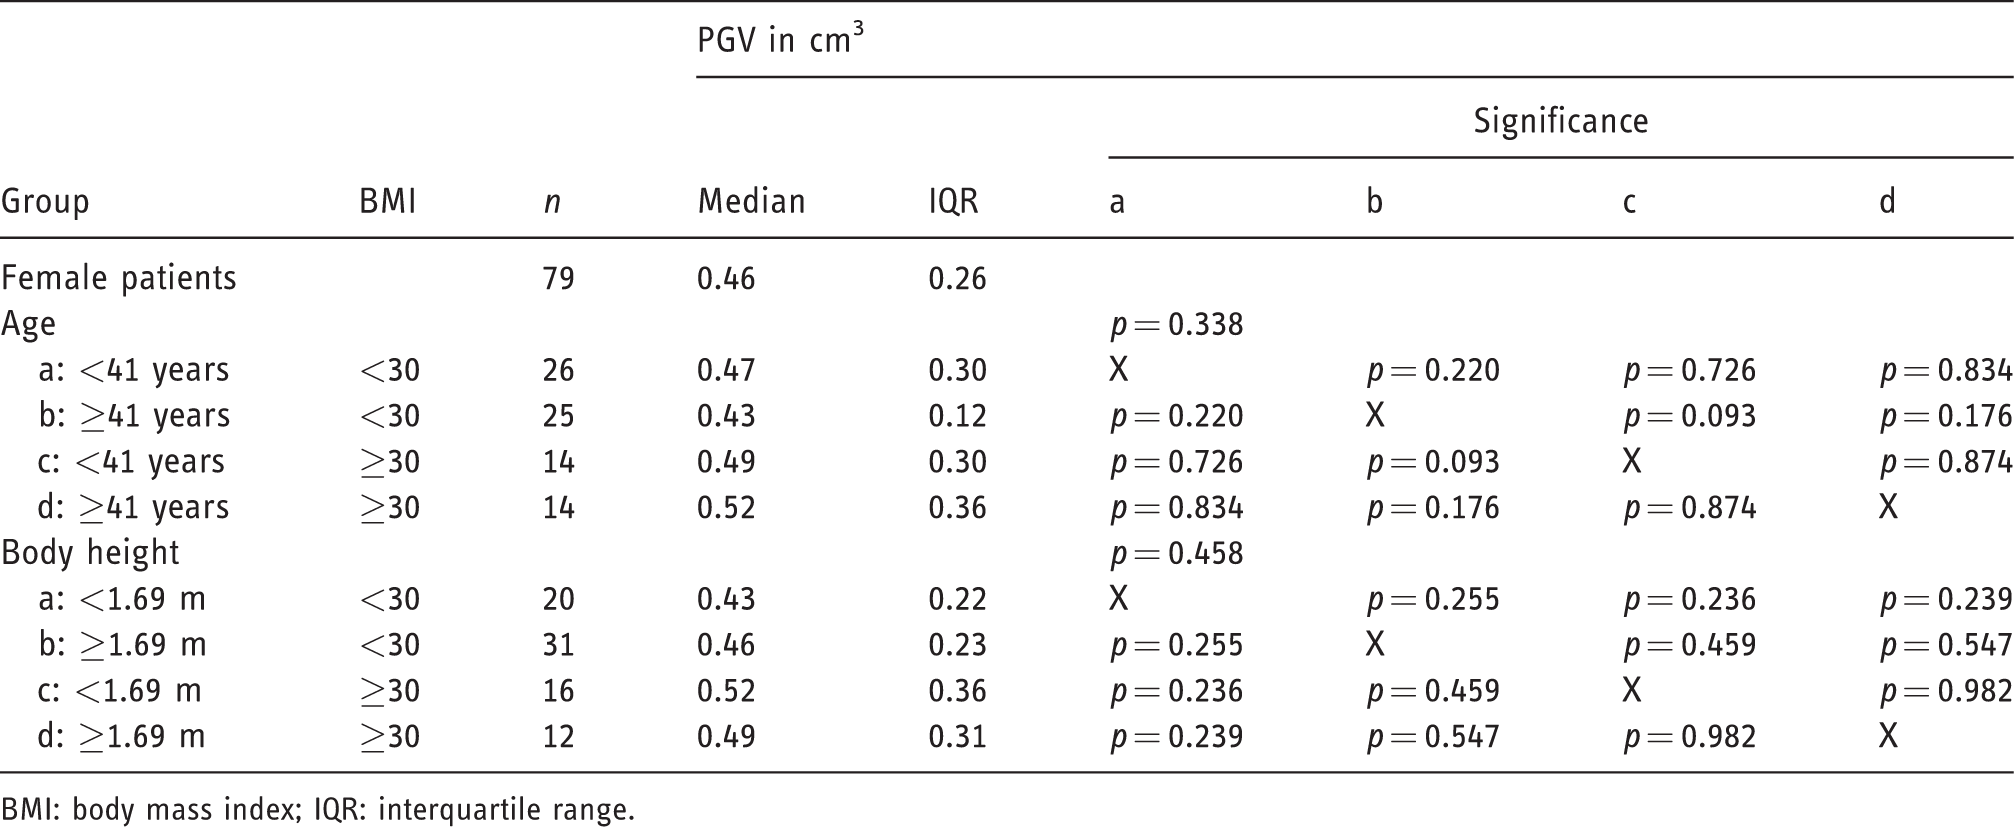
BMI: body mass index; IQR: interquartile range.
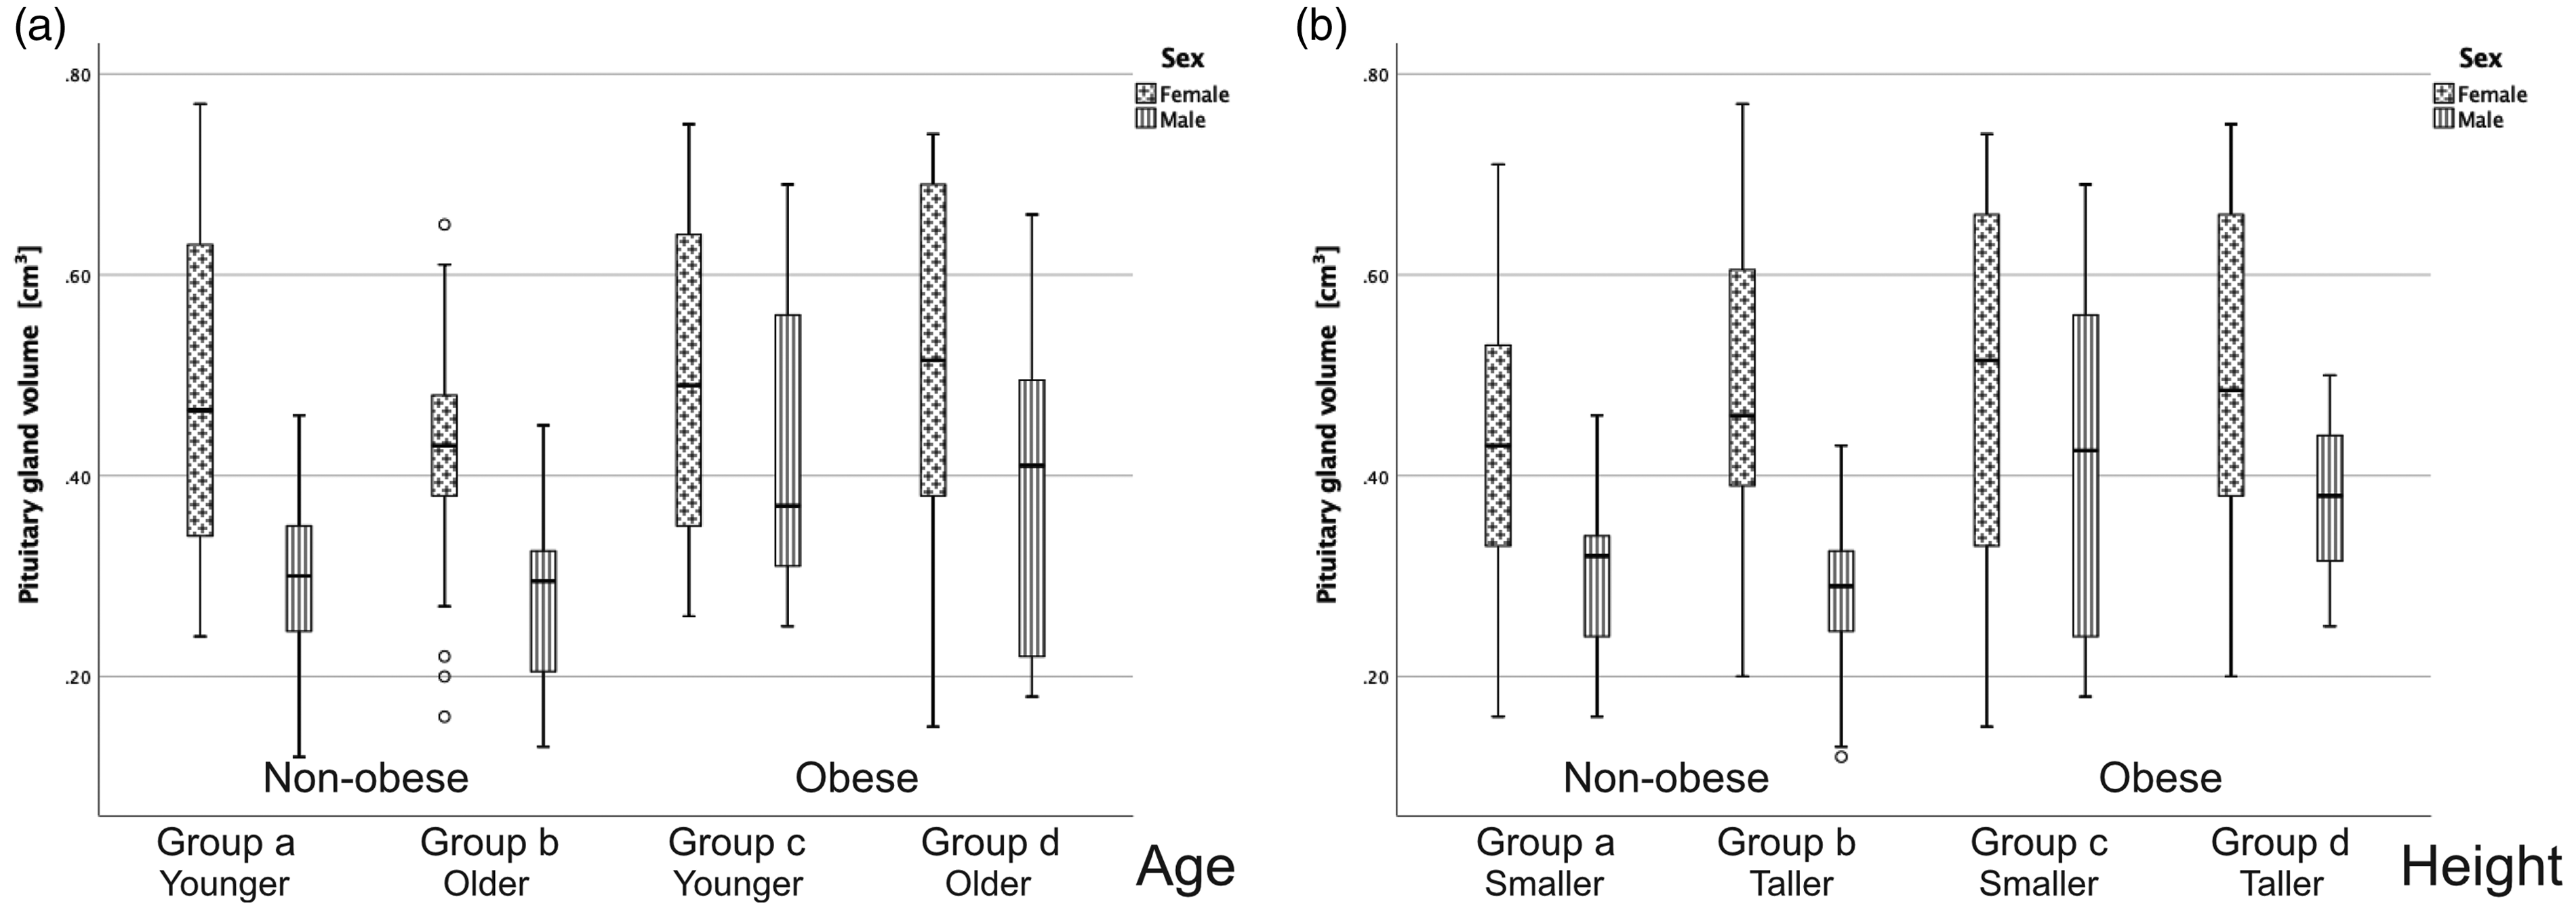
Boxplots of pituitary gland volume (PGV) differences in the subgroup analysis of obese and non-obese individuals in relation to age (a) and body height (b).
Subgroup analysis – pituitary gland volume (PGV) differences in obese and non-obese males in relation to age and body height groups (divided by the median).
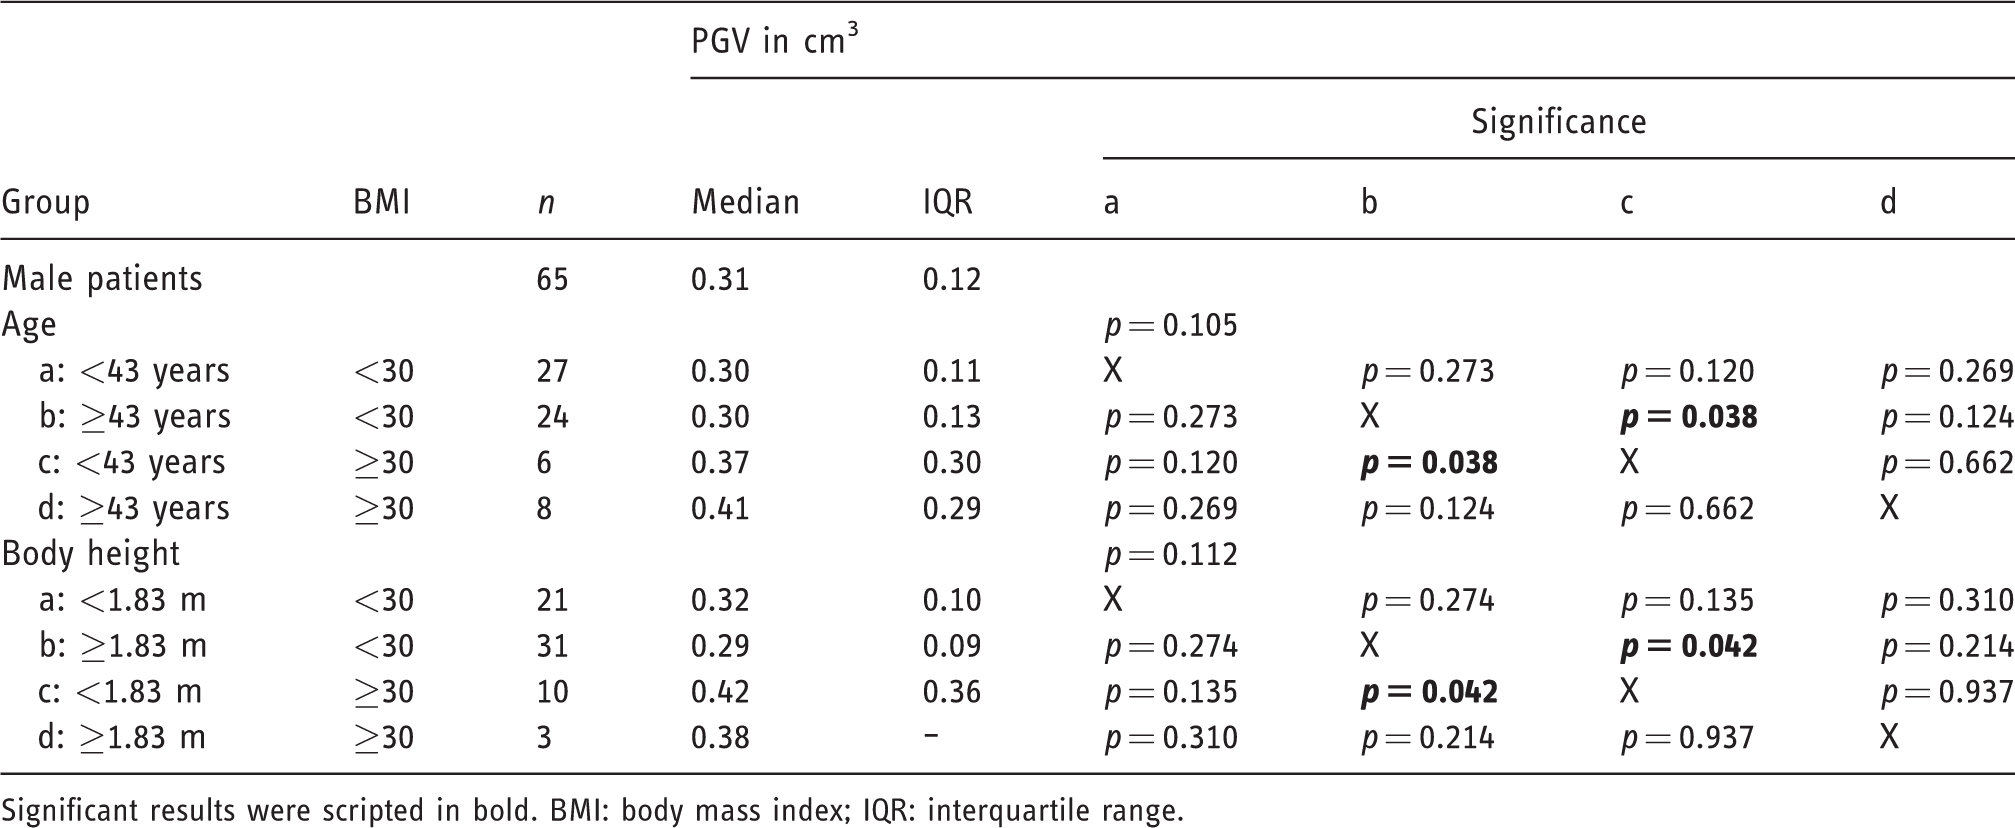
Significant results were scripted in bold. BMI: body mass index; IQR: interquartile range.
ROC analysis of PGV and obesity (BMI≥30) of the total study population showed an area under the curve (AUC) of 0.663 (p = 0.02). A PGV of 0.48 ml yielded the largest Youden’s index (Figure 5) and resulted in a specificity of 82% and sensitivity of 56%.
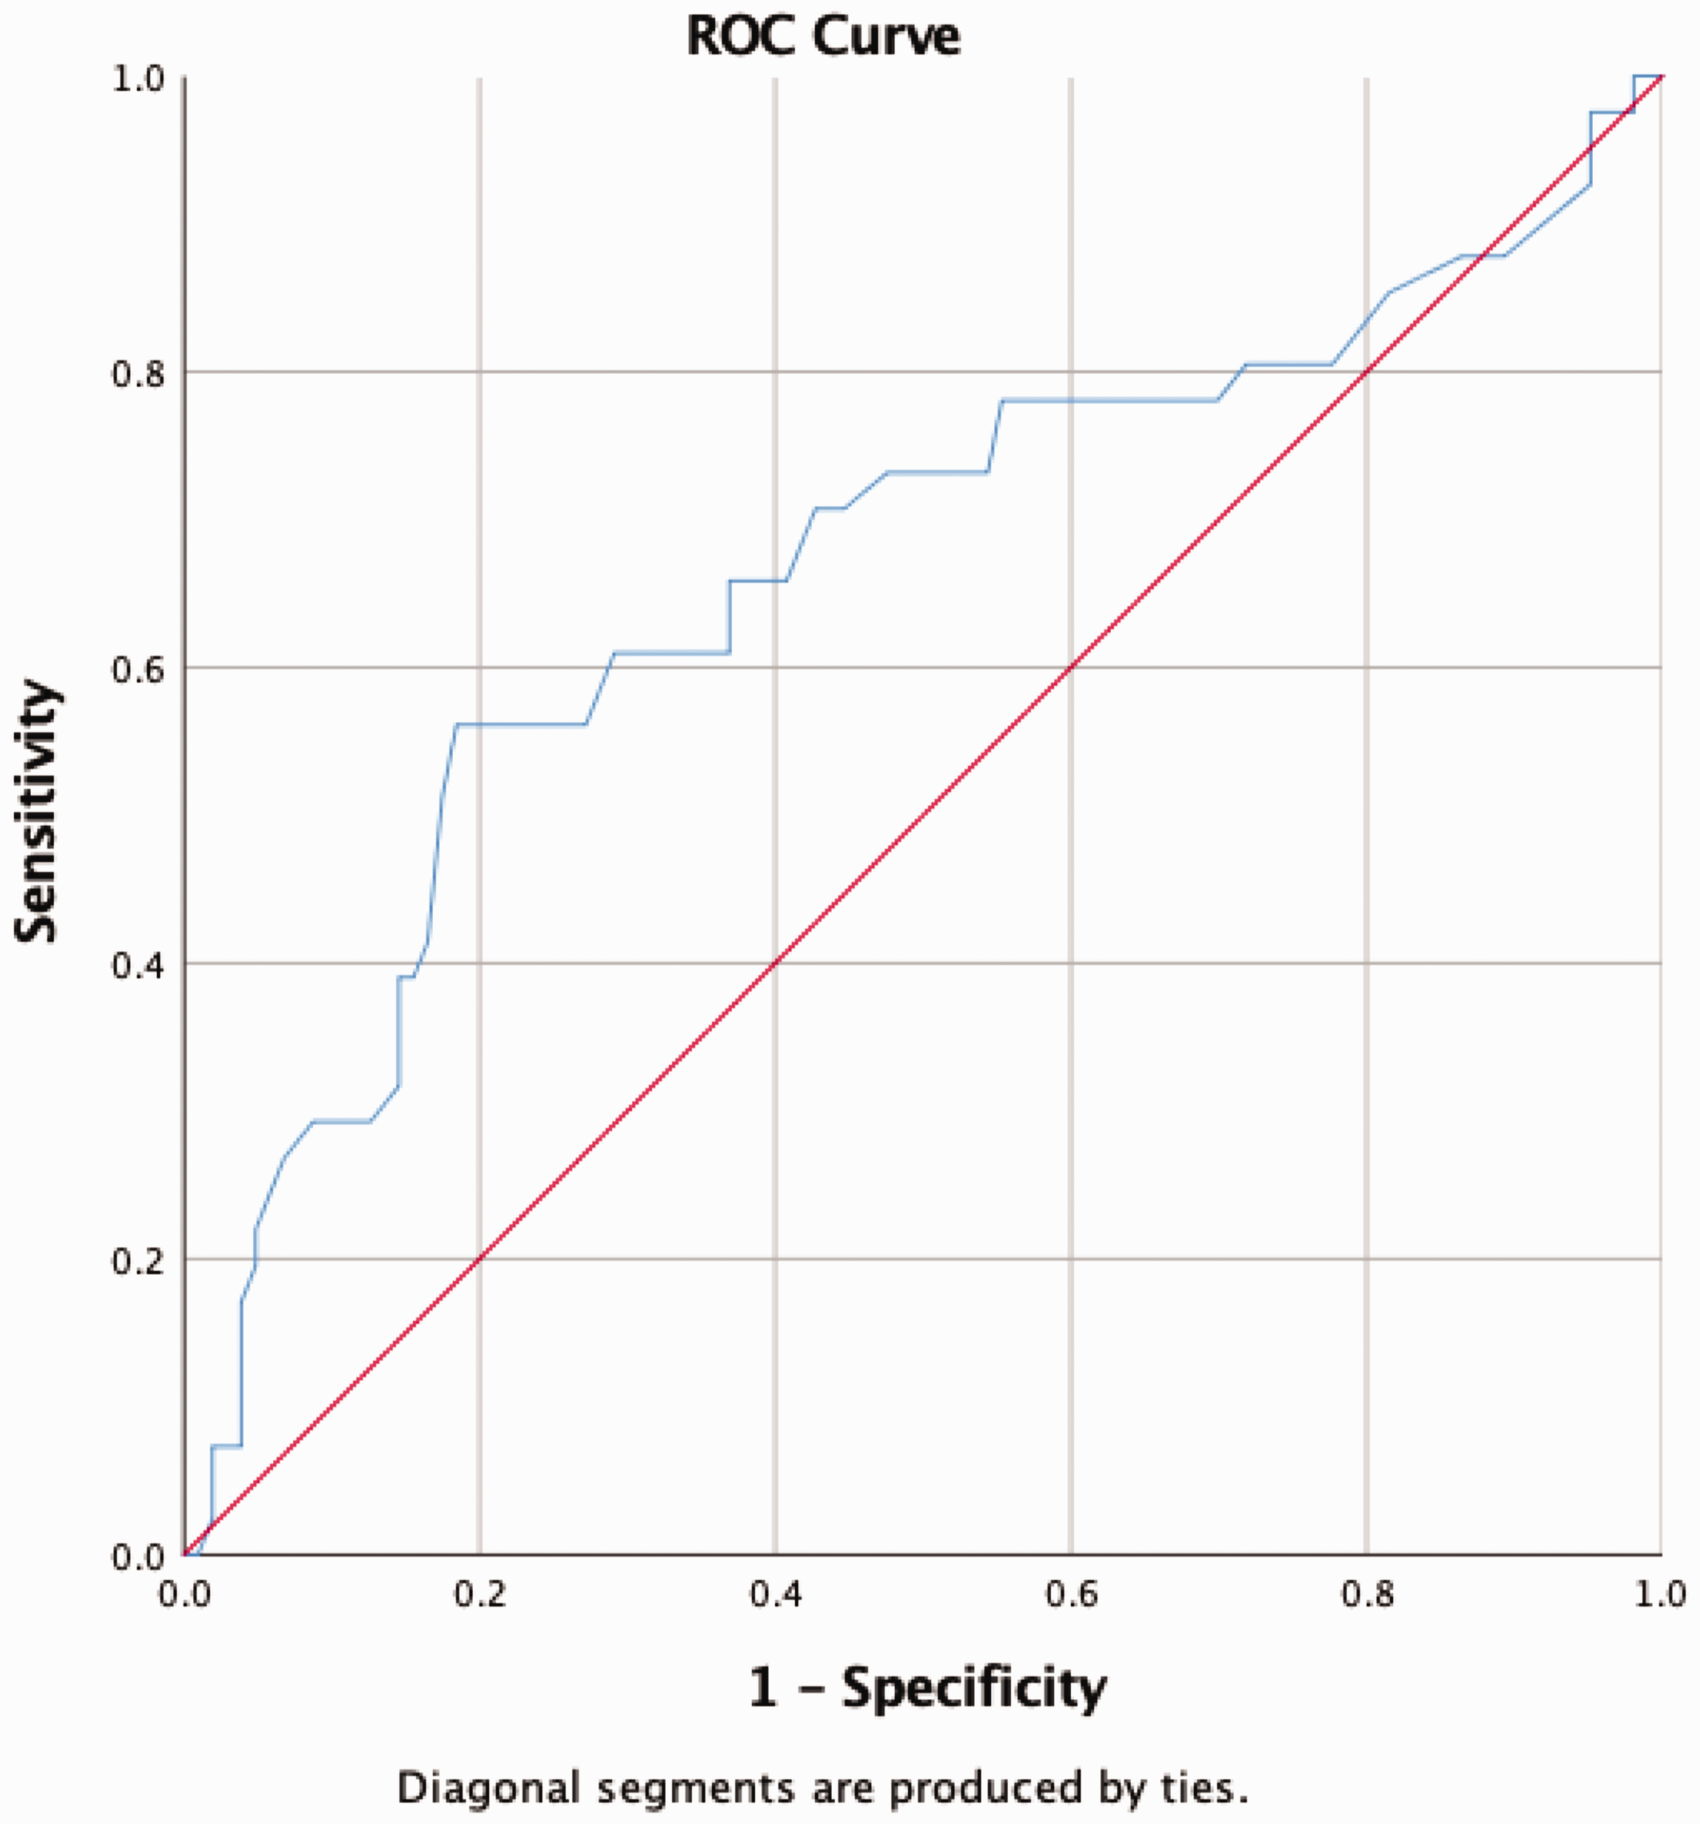
Receiver-operating characteristic (ROC) analysis of pituitary gland volume (PGV) and obesity (body mass index (BMI)≥30), area under the curve (AUC) of 0.663 (p=0.02). A PGV of 0.48 ml yielded the largest Youden’s index and resulted in a specificity of 82% and sensitivity of 56%.
Linear regression analysis showed significant results of PGV in association with gender (p < 0.001, standardised coefficient: 0.434) and BMI (p = 0.026, standardised coefficient: 0.170). There were no significant results regarding body height or age in regression analysis (p>0.05) (Table 7).
Linear regression analysis of the variables to pituitary gland volume
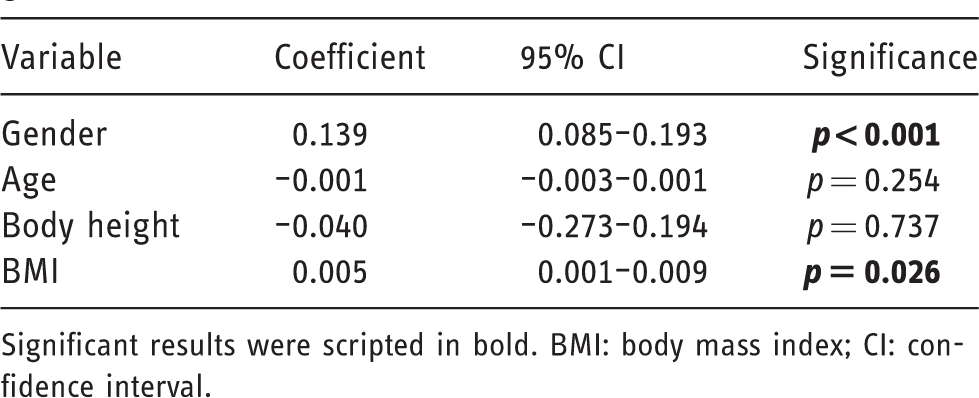
Significant results were scripted in bold. BMI: body mass index; CI: confidence interval.
Discussion
Obesity is a widespread health risk worth investigating further and the prevalence is about 24% in Germany. Our study population showed a prevalence of obesity of 28.5% which is comparable to the local situation. 18 Our study shows that obese patients have significantly larger pituitary glands than normal or overweight subjects. This observation is corroborated by trends in our subgroup analysis although statistically significant differences were not observed because of small subgroup sizes. We have also shown a significant correlation between PGV and body height, but this was not confirmed in the regression analysis. This shows that PGV does not depend on height, but on gender, which has a significant influence on both PGV and height. Thus, it can be concluded that body height in contrast to weight, which are both reflected in the BMI, has no significant influence on PGV. With our study, we showed that an increased PGV is associated with a higher BMI independent of age, body height or gender.
In clinical routine, it is important to be aware of physiological variations in pituitary morphology, especially when MRI is performed for tumour detection. If pituitary neoplasm is suspected, a targeted MRI examination (small field of view T1-w and T2-w sequences as well as dynamic contrast-enhanced coronal images) should be performed to detect and differentiate neoplastic changes. 3 Routine MRI protocols without dedicated pulse sequences are limited in detecting and characterising pituitary abnormalities. Our results offer guidance in identifying pathological volume changes and can thus improve the detection of pituitary incidentalomas in routine MRI. Patients with an incidentaloma require close surveillance and should be tested for pituitary hyper-/hypofunction. 19
Earlier imaging studies investigating pituitary gland volume have focused on age and gender. The pituitary gland undergoes considerable changes in a person’s lifetime and is affected by age and gender. 20 Pituitary height is greatest in young adults and perimenopausal women. 21 Our study confirms that pituitary glands are larger in females. In the female population of our study, younger women had significantly larger PGVs than middle-aged women. In the male population, we found a decreasing pituitary size in the older age groups. These observations are consistent with existing data but did not reach statistical significance in our study because of the small subgroup sizes and the relatively young overall cohort.
Pituitary enlargement is also seen on images obtained in individuals with pituitary hyperplasia. In these cases, MRI demonstrates diffuse and symmetrical pituitary enlargement. Pituitary hyperplasia is classically due to end organ insufficiency such as primary hypothyroidism or hypogonadism. Other causes include iatrogenic hyperplasia due to oestrogen excess or adverse effects of antipsychotic intake, or assisted reproductive technologies. 21 Our findings suggest that, besides age and gender, BMI should be considered in the imaging assessment of pituitary hyperplasia and in the differentiation from large pituitary glands in the upper normal range.
The hypothalamic-pituitary-adrenal axis is related to obesity in a complex way. In a recent study, Rucker and Ikuta showed an association of BMI with pituitary gland connectivity to important brain regions in functional MRI. 22 Functional MRI is only used in the setting of clinical trials, while our study deliberately addressed pituitary morphology as seen on routine clinical MR images. The findings of our study support the known relationship of pituitary gland function and obesity.
Cushing’s syndrome is a rare secondary cause of obesity. Subclinical Cushing’s such as biochemical hypercortisolism in the absence of manifest Cushing’s syndrome can present with clinical features of severe obesity. It has been postulated that in obesity, the entire hypothalamic-pituitary-adrenal axis is activated. 23 Enlargement of the pituitary gland in obese individuals as shown in our study could be a morphological correlate indicating dysfunction in the hypothalamic-pituitary-adrenal axis. 2
An association of obesity also exists with thyroid dysfunction. Mechanisms include changes in leptin levels, effects of hyperinsulinaemia, and changes in thyroid gland structure and function. Dysregulation in the feedback loop leads to higher thyroid stimulating hormone (TSH) levels, as found in obesity. 24 Hyperinsulinaemia in insulin resistance causes elevated TSH levels by lowering de-iodinase in the pituitary gland. 25 Leptin, another regulator of thyroid function, is stored in adipose tissue. It regulates thyrothropin-releasing hormone and subsequent TSH release. 26 There is also evidence in the prevalence of subclinical hypothyroidism in obese patients.24,25 Pituitary gland enlargement in obese patients, as shown in our study, could therefore be an indicator of subclinical hypothyroidism.
The main limitations of our study are the retrospective study design, the relatively small cohort and the general inaccuracy in the measurement of small structures such as the pituitary gland. Despite the careful selection of patients, undetected endocrinological diseases in the collective cannot be completely excluded due to the retrospective nature of the study. Aware of the measurement inaccuracy, the study was not designed to provide quantitative cutoff values, but rather to compare the individual BMI groups in our cohort. The comparability within the study was ensured by the strict application of the measurement method in the whole cohort. However, our promising results have to be tested and confirmed on larger cohorts to generate real cutoff values.
In conclusion, PGV is increased in obese individuals and high BMI is an independent predictor of PGV increase. Pituitary gland enlargement could be seen as an imaging indicator of subclinical endocrinopathy or dysfunction in the hypothalamus-pituitary axis. Radiologists interpreting changes in PGV should consider not only gender and age but also BMI in order to arrive at a correct diagnosis.
Footnotes
Acknowledgements
All authors contributed to the study conception and design. Material preparation, data collection and analysis were performed by Anas Jadan, Uli Fehrenbach and Edzard Wiener. The first draft of the manuscript was written by Uli Fehrenbach and all authors commented on previous versions of the manuscript. All authors read and approved the final manuscript.
Conflict of interest
The authors declare that they have no conflicts of interest that are directly or indirectly related to this research project.
Funding
The authors received no financial support for the research, authorship, and/or publication of this article.