
Abstract
The clinical value of perfusion imaging in arterial ischemic stroke is well established, but its interpretation in cerebral venous sinus thrombosis (CVST) remains less clearly defined. We present a case series of five patients with acute CVST who demonstrated perfusion abnormalities on initial CT perfusion (CTP) or MR perfusion (MRP). The observed findings demonstrated a spectrum of venous hemodynamic patterns. Several patients showed delayed transit metrics, including increased MTT or Tmax, with preserved or increased CBV, suggesting venous congestion or vasogenic edema rather than arterial-type ischemic penumbra. In contrast, one patient demonstrated delayed transit with decreased CBV and CBF, suggesting more advanced venous infarction or tissue-level perfusion failure. One additional patient demonstrated hyperperfusion in a non-territorial distribution, most compatible with ictal or peri-ictal hyperemia rather than a primary venous congestion pattern. Four patients had favorable neurological recovery, whereas one patient had a poor short-term outcome likely driven primarily by large baseline hemorrhage. These cases highlight that perfusion abnormalities in CVST should be interpreted differently from arterial stroke and may be most useful when stratified into venous congestion, venous infarction, and seizure-related hyperperfusion patterns.
Introduction
Cerebral venous sinus thrombosis (CVST) is an uncommon but potentially life-threatening cerebrovascular pathology, accounting for approximately 0.5%–3% of all strokes in adults. 1 The clinical presentation of CVST is extremely variable, including headache, seizures, focal neurologic deficits, and altered consciousness; this heterogeneous clinical presentation can make clinical diagnosis very challenging. 1 While CT and MR venography are the gold standards for identifying the thrombus, understanding the downstream effect on brain parenchyma is crucial for prognostication. 2
Perfusion imaging, via either CT-perfusion (CTP) or MR-perfusion (MRP), is well established for evaluating tissue viability in arterial ischemic stroke, as it provides valuable information regarding infarct core and salvageable penumbra.3–6 Its role in CVST, however, is less understood. Venous outflow obstruction from CVST increases local venous pressure and can impair cerebral perfusion, leading to reversible edema or irreversible venous infarction and hemorrhage.7,8 Thus, perfusion imaging may complement conventional imaging by helping characterize the downstream hemodynamic consequences of venous outflow obstruction, including venous congestion, edema, infarction, and hemorrhage.
Here, we present five patients with acute CVST evaluated with CTP or MRP, illustrating distinct perfusion patterns related to venous congestion, venous infarction, and seizure-related hyperperfusion. We emphasize a practical interpretive framework for distinguishing delayed transit with preserved or increased CBV, suggestive of venous congestion, from delayed transit with decreased CBV and CBF, suggestive of more advanced venous infarction or tissue-level perfusion failure.
Materials and methods
This retrospective case series included five patients with acute CVST who underwent CTP or MRP imaging as part of their clinical evaluation at our institution. Cases were identified through review of institutional imaging records. Clinical presentation, relevant medical history, venous thrombosis location, conventional imaging findings, perfusion findings, treatment, and short-term clinical outcomes were abstracted from the electronic medical record.
CVST was confirmed using CT venography, MR venography, contrast-enhanced MRI, and/or susceptibility-weighted imaging, as clinically available.1,2 Perfusion imaging was reviewed qualitatively in conjunction with conventional CT/MRI and venographic imaging. CTP and MRP maps were assessed for abnormalities in transit-time metrics, including mean transit time (MTT) and time-to-maximum (Tmax), and blood volume/flow metrics, including cerebral blood volume (CBV) and cerebral blood flow (CBF).
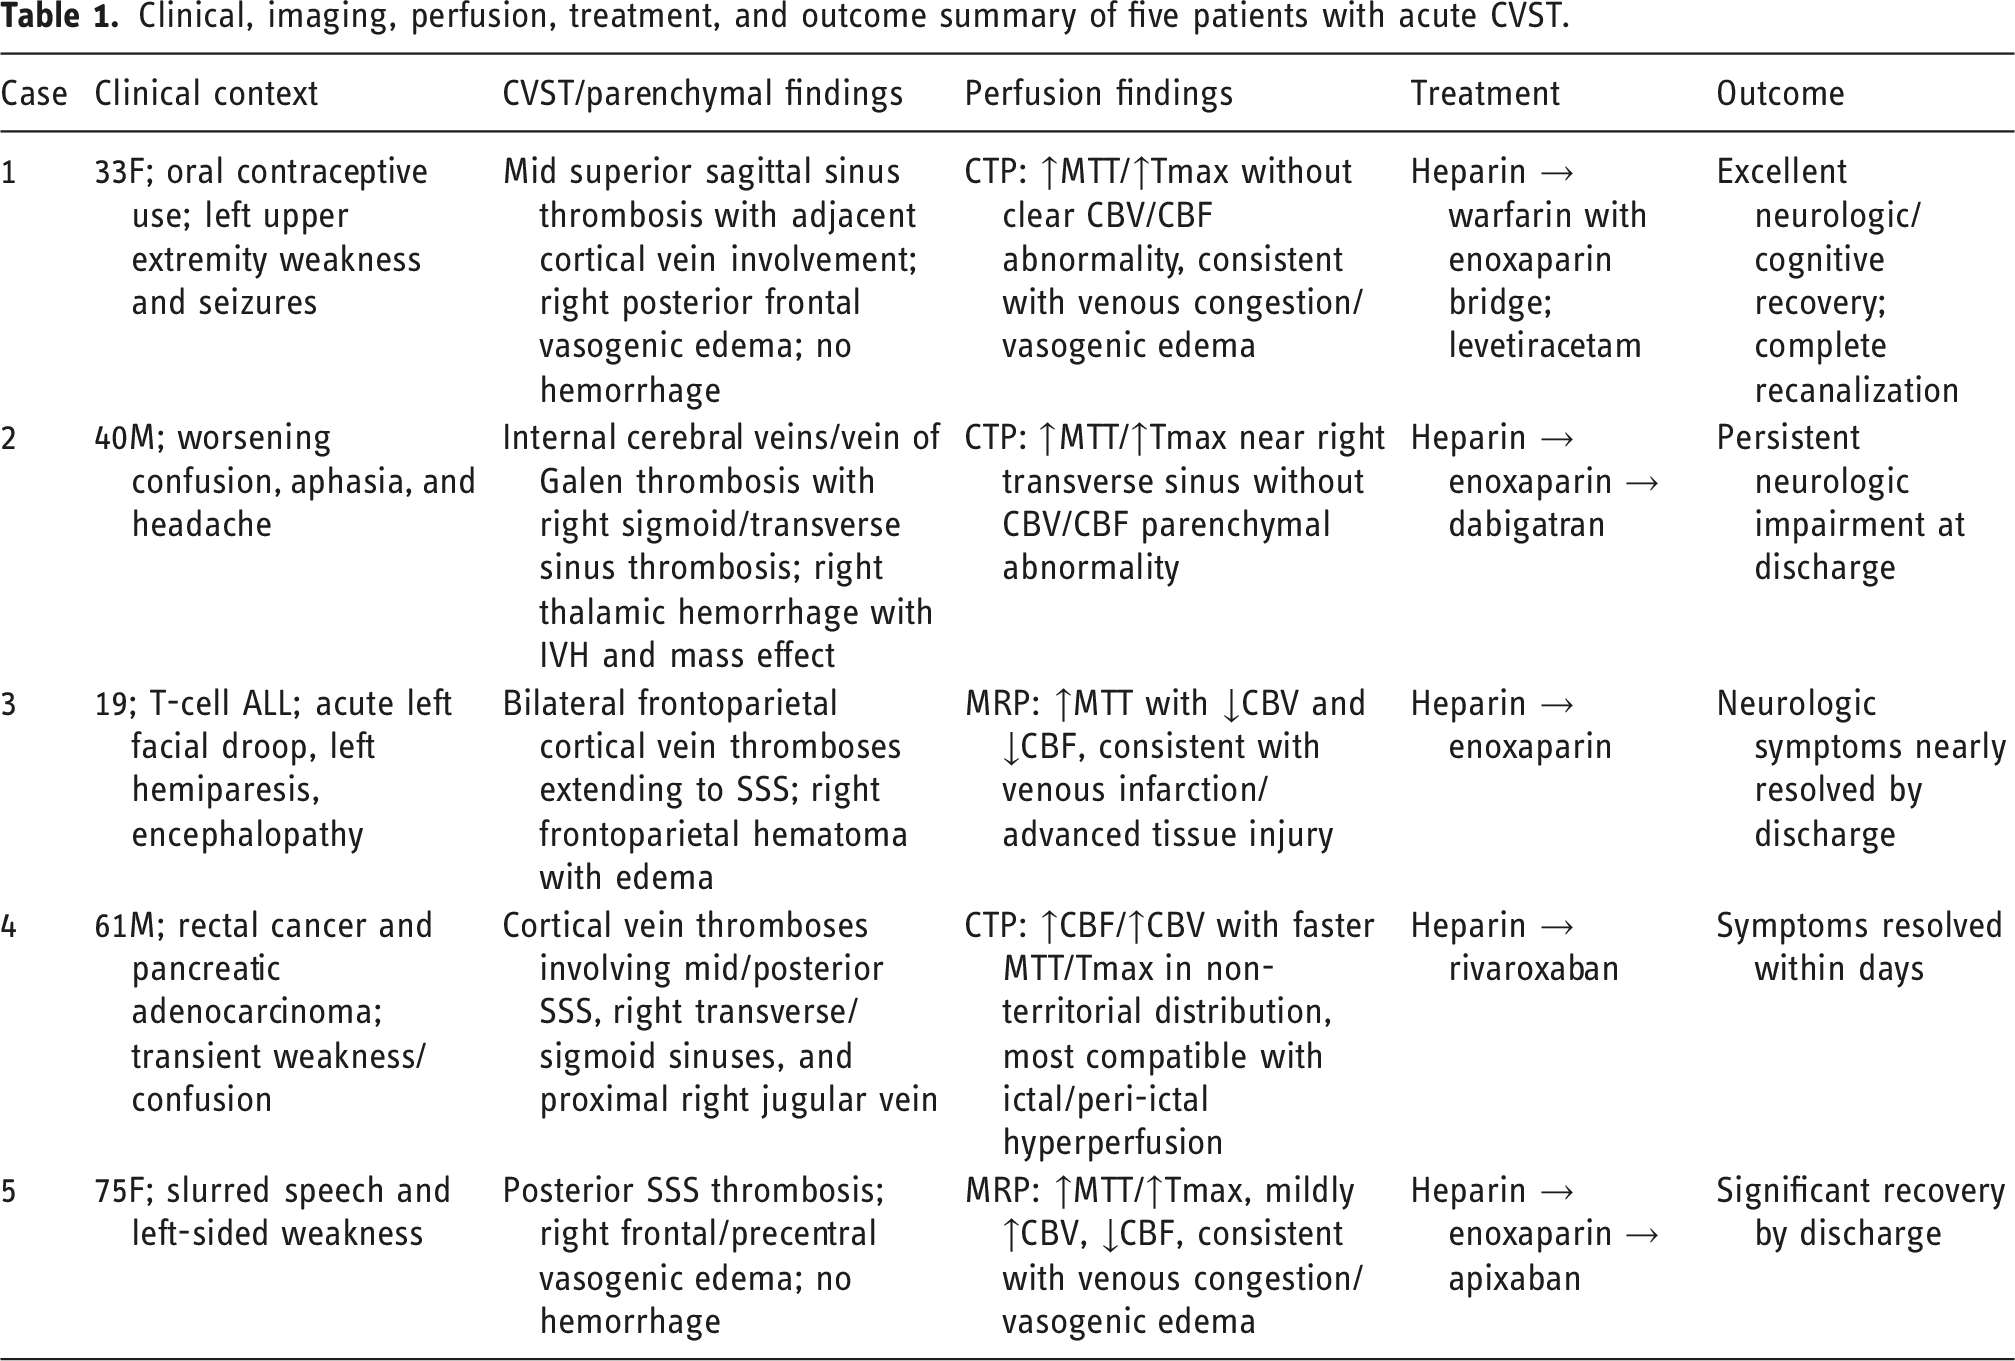
Clinical, imaging, perfusion, treatment, and outcome summary of five patients with acute CVST.
Case series
Case 1
A 33-year-old female on oral contraceptives presented with left upper extremity weakness and seizures. Last known well was 3 hours prior to arrival. MRV demonstrated a filling defect within the mid superior sagittal sinus, compatible with thrombosis (Figure 1(a)). T2 FLAIR, DWI, and ADC demonstrated hyperintensity in the posterior right frontal lobe, compatible with vasogenic edema (Figure 1(b)–(d)). SWI demonstrated signs of dural venous sinus thrombosis in the adjacent right greater than left cortical veins (Figure 1(e)). Case 1. MRV (a) demonstrating filling defect within the mid superior sagittal sinus compatible with thrombosis. FLAIR (b) hyperintensity in the posterior right frontal lobe compatible with vasogenic edema. DWI (c) and ADC (d) hyperintensity in the right frontal lobe, compatible with vasogenic edema. SWI (e) demonstrating signs of dural venous sinus thrombosis in the adjacent right greater than left cortical veins. On CT perfusion imaging, there is increased MTT (f) and Tmax (g) corresponding to the right posterior frontal lobe without clear CBV/CBF (h + i) abnormality.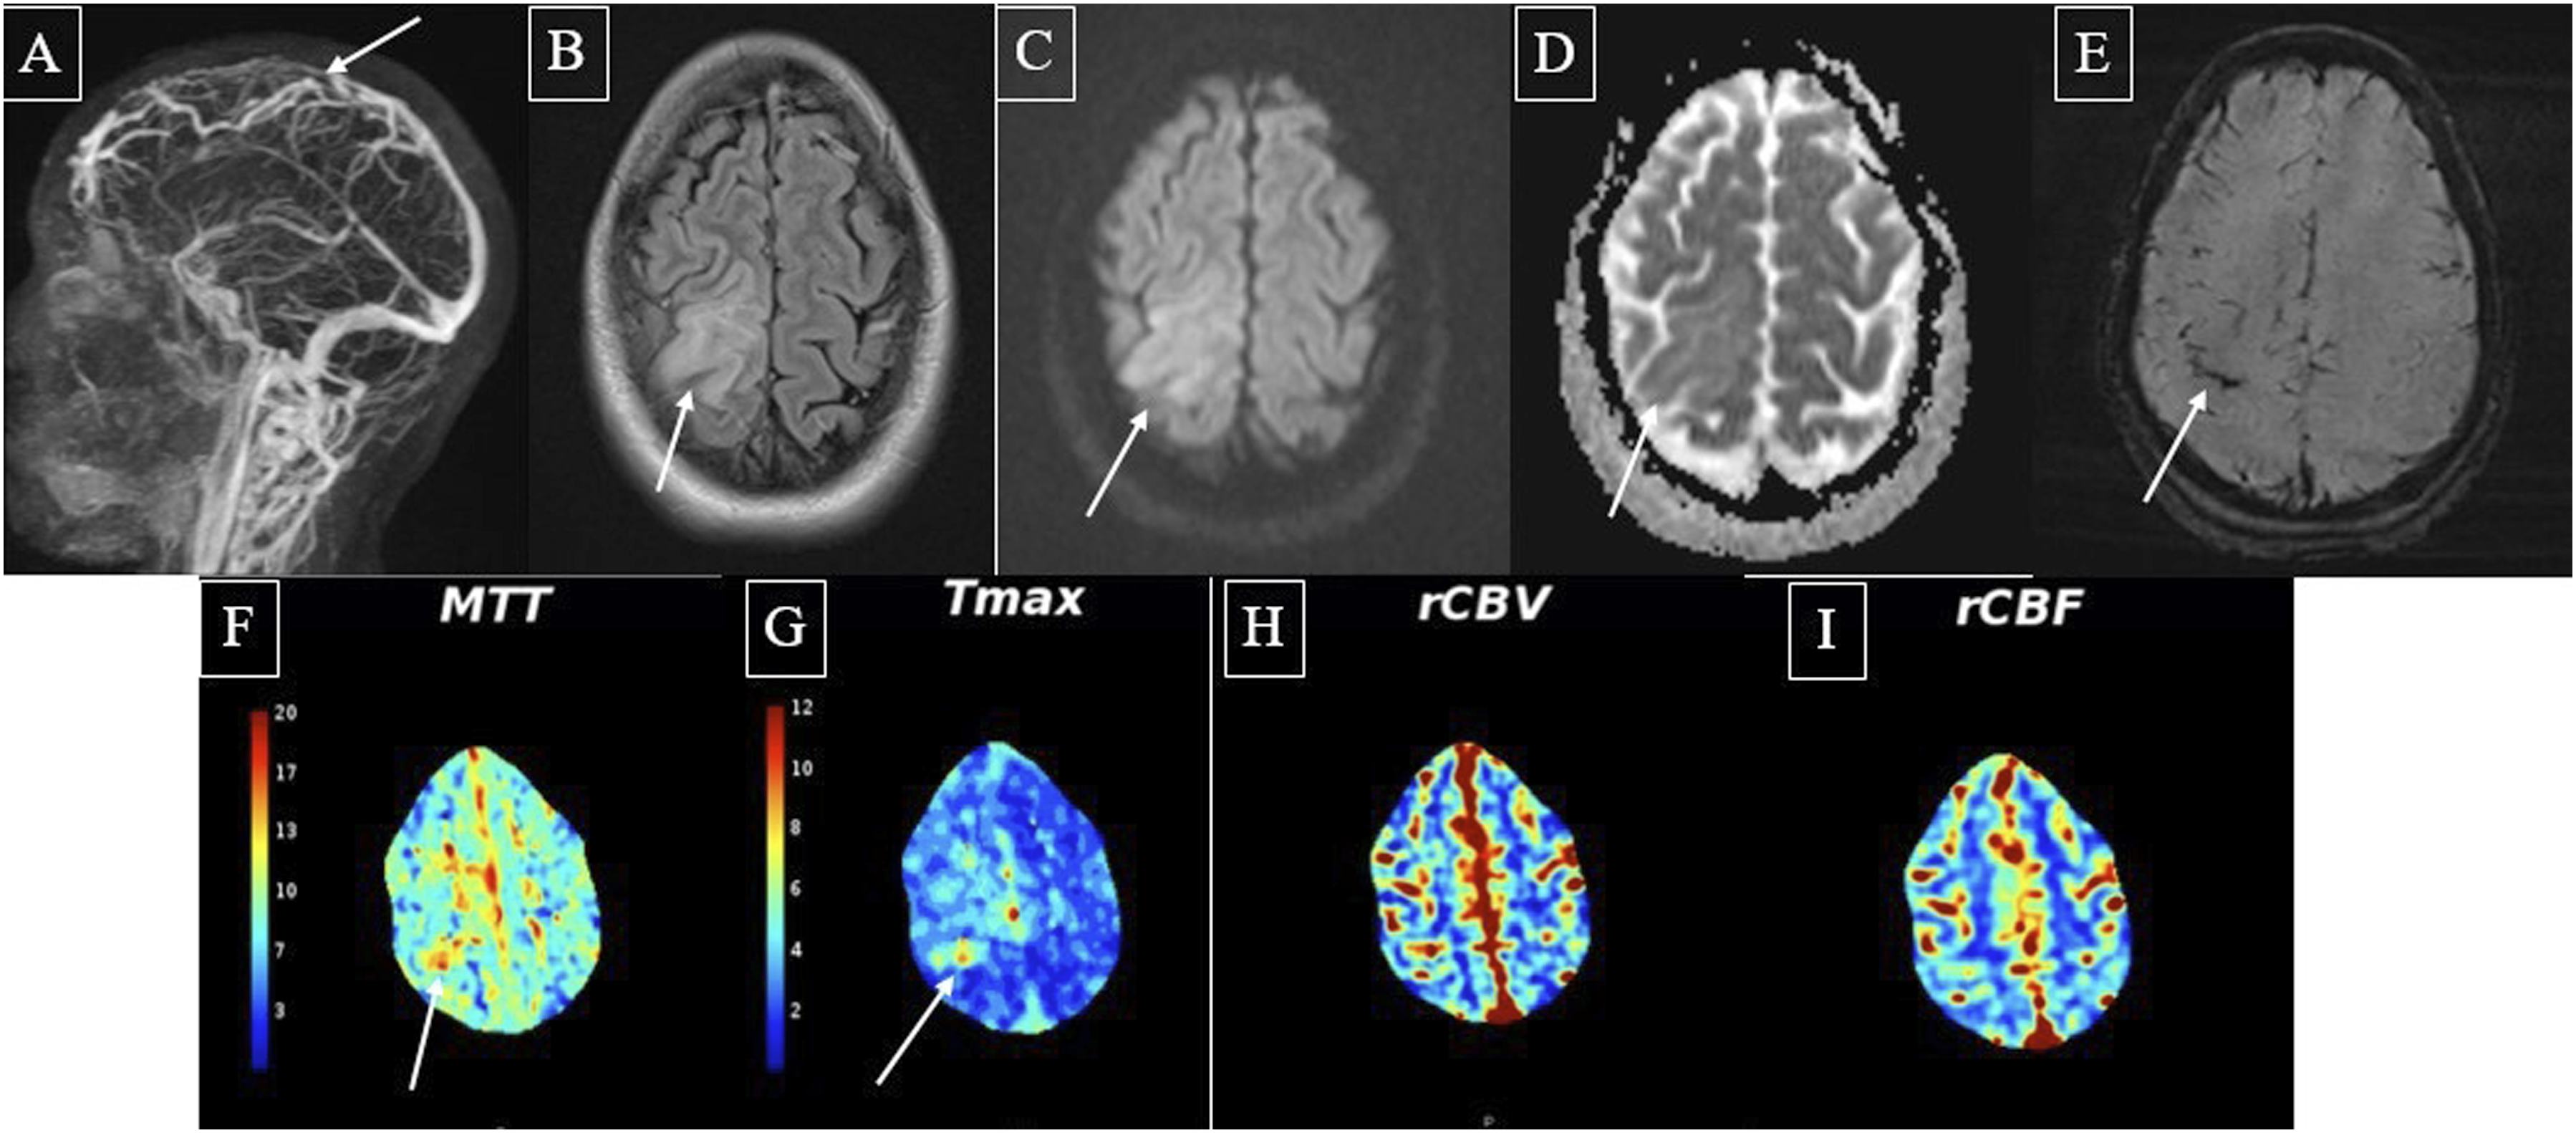
On CT perfusion imaging, there was increased MTT and Tmax corresponding to the right posterior frontal lobe without clear cerebral blood volume (CBV) or cerebral blood flow (CBF) abnormalities (Figure 1(f)–(i)).
She was treated with intravenous heparin, transitioned to warfarin with enoxaparin bridge, and started on levetiracetam for seizure prophylaxis. The patient demonstrated excellent neurological and cognitive recovery at the 3-month follow-up visit. Follow-up imaging showed complete recanalization of the superior sagittal sinus.
Case 2
A 40-year-old man with a history of stroke presented with worsening baseline confusion, aphasia, and headache. Last known well was 1 hour before arrival. Non-contrast CT showed a right thalamic hemorrhage with intraventricular extension and mass effect (Figure 2(a)). CTV demonstrated thrombosed internal cerebral veins and vein of Galen, which explained the thalamic hematoma (Figure 2(b)). Subsequent T1 post-contrast images and SWI showed thrombosis in the right sigmoid and transverse sinuses (Figure 2(c)–(e)). Case 2. Non-contrast CT (a) demonstrating a right thalamic hemorrhage with intraventricular extension and mass effect. CTV (b) demonstrating thrombosed internal cerebral veins and vein of Galen, which explains the thalamic hematoma. T1 post-contrast images (c + d) and SWI (e) demonstrating thrombosis in the right sigmoid and transverse sinuses. On CT perfusion imaging, there is increased MTT (f) and Tmax (g) localized to the site of the right transverse sinus. No CBV (h) or CBF (i) abnormality to suggest a venous parenchymal abnormality.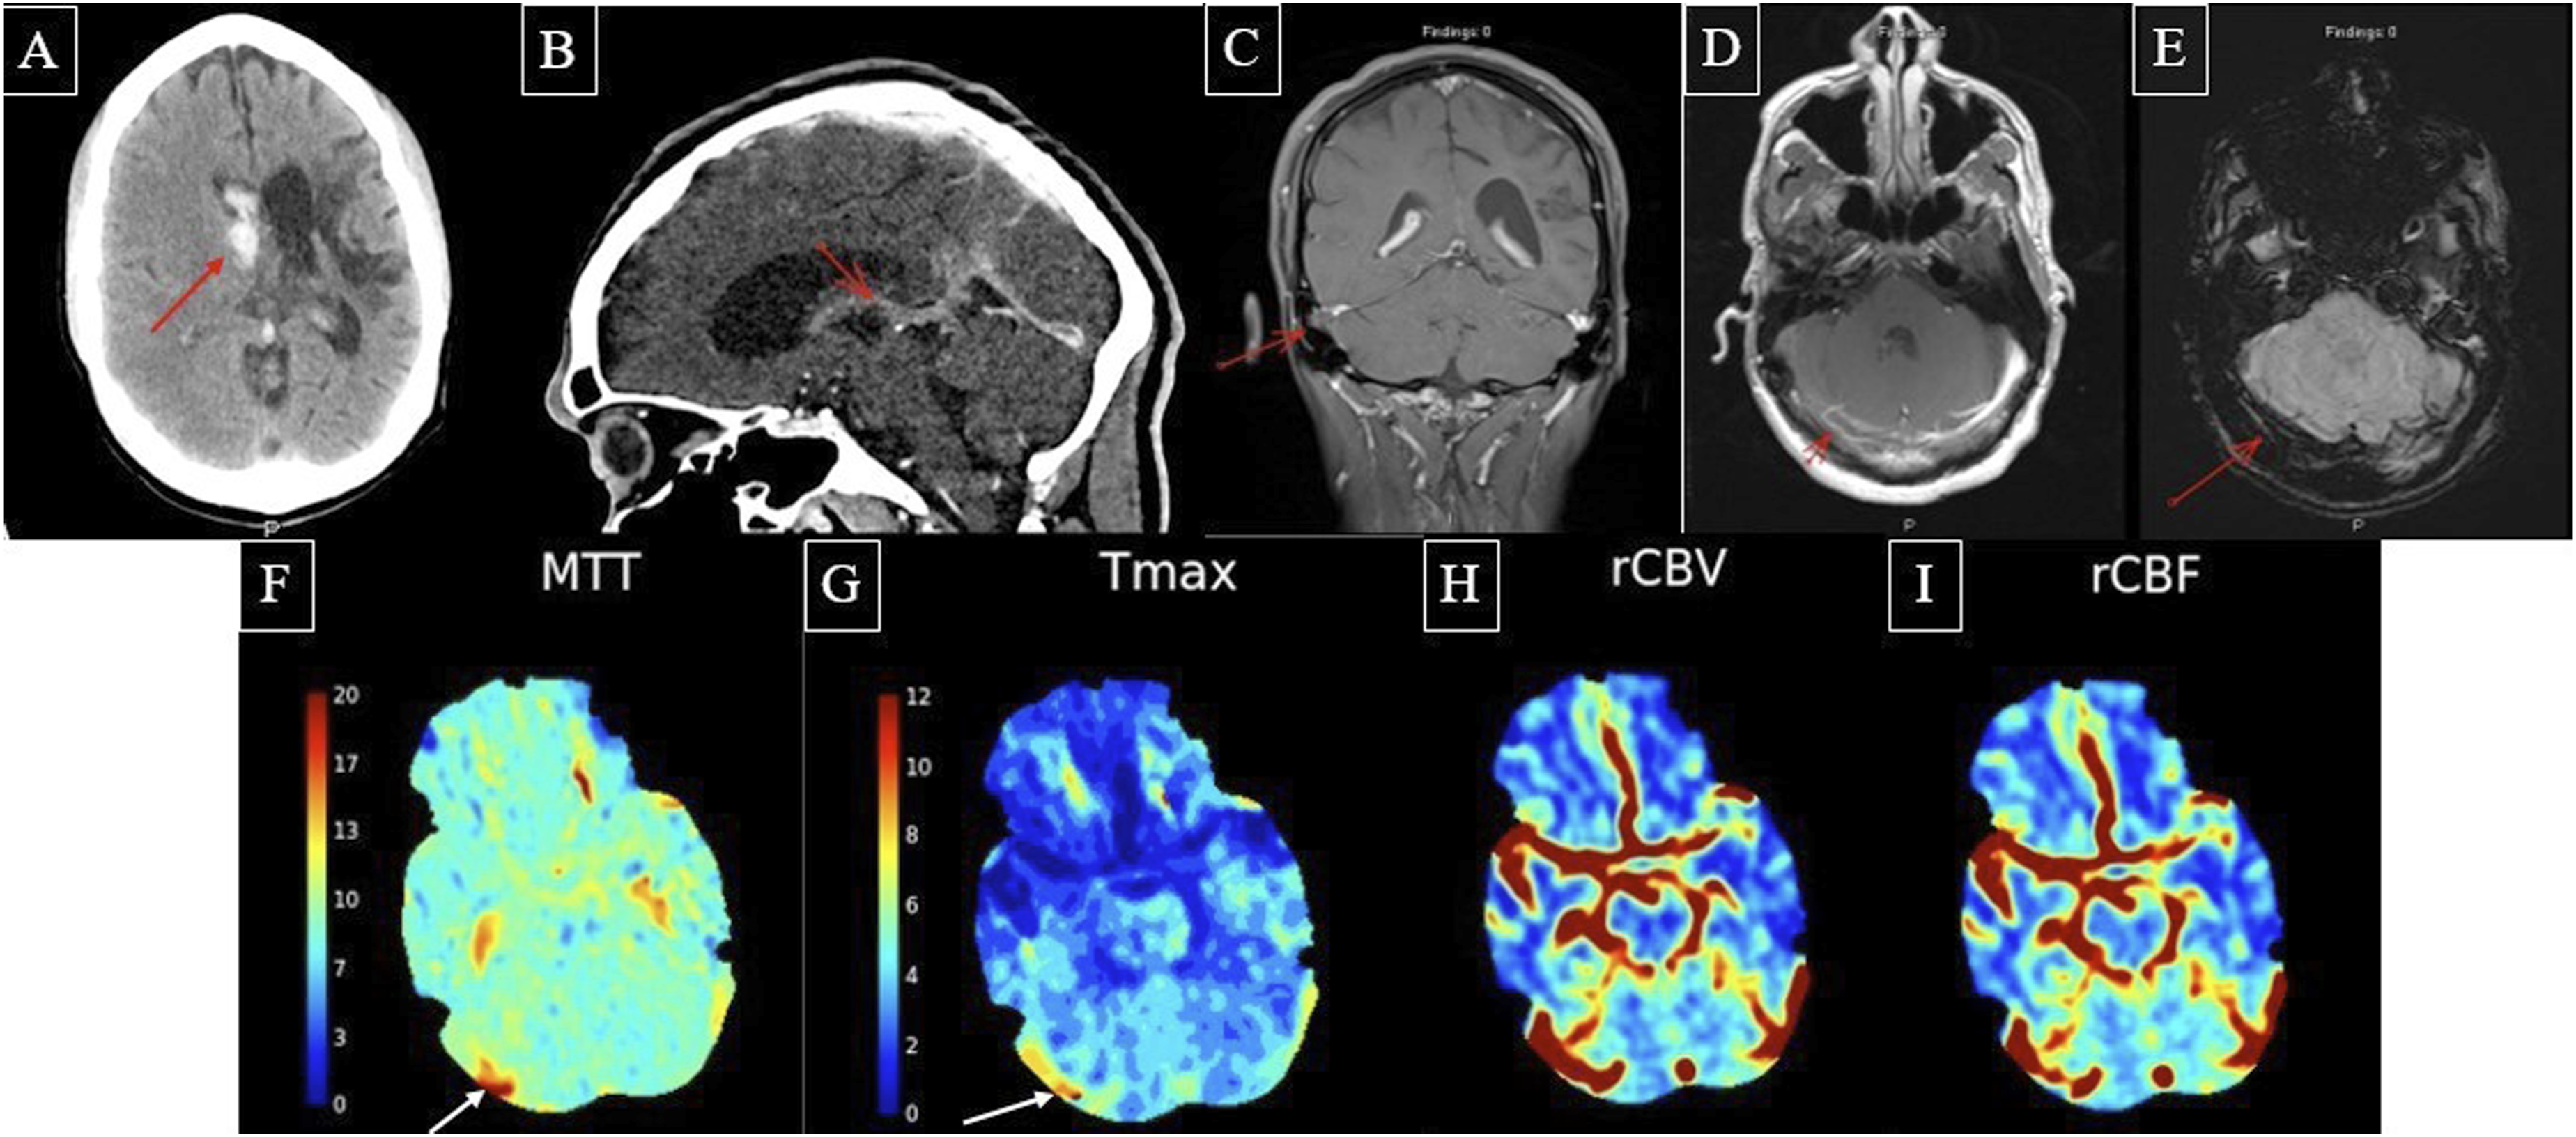
On CT perfusion imaging, there was increased MTT and Tmax localized to the site of the right transverse sinus (Figure 2(f)–(g)). There were no CBV or CBF abnormalities to suggest a venous parenchymal abnormality (Figure 2(h)–(i)).
He was started on heparin drip and transitioned to enoxaparin for 7 days. For long-term management, he was switched from aspirin and clopidogrel to dabigatran. Repeat CT imaging at 24 h showed no new bleeding. At discharge, the patient remained verbally limited, disoriented, and intermittently able to follow commands.
Case 3
A 19-year-old individual with a history of Ehlers-Danlos, supraventricular tachycardia, and newly diagnosed T-cell acute lymphoblastic leukemia developed acute left facial droop, left hemiparesis, and encephalopathy during hospitalization for a bone marrow biopsy.
Pre-contrast T1-weighted MRV demonstrated occlusive or near-occlusive thrombi in the bilateral frontoparietal cortical veins, seen as intrinsically T1-hyperintense and expanded veins (more pronounced on the right) (Figure 3(a)). Post-contrast MRV demonstrated that the thrombus extended to the superior sagittal sinus (Figure 3(b)). FLAIR showed a large right frontoparietal intraparenchymal hematoma extending through the precentral and postcentral gyri with surrounding vasogenic edema and mild leftward midline shift (Figure 3(c)). Case 3. Pre-contrast T1-weighted MRV (a) demonstrating occlusive or near-occlusive thrombi in the bilateral frontoparietal cortical veins, seen as intrinsically T1-hyperintense and expanded cortical veins (more pronounced on the right). Post-contrast MRV (b) demonstrating that the thrombus extends to the superior sagittal sinus. FLAIR (c) demonstrating a large right frontoparietal intraparenchymal hematoma extending through the precentral and postcentral gyri with surrounding vasogenic edema and mild leftward midline shift. On MR perfusion imaging, MTT maps (d + e) show transit delays in the bilateral parietal lobes. CBV maps (f + g) showing decreased CBV in both parietal lobes with corresponding decreased CBF (h + i).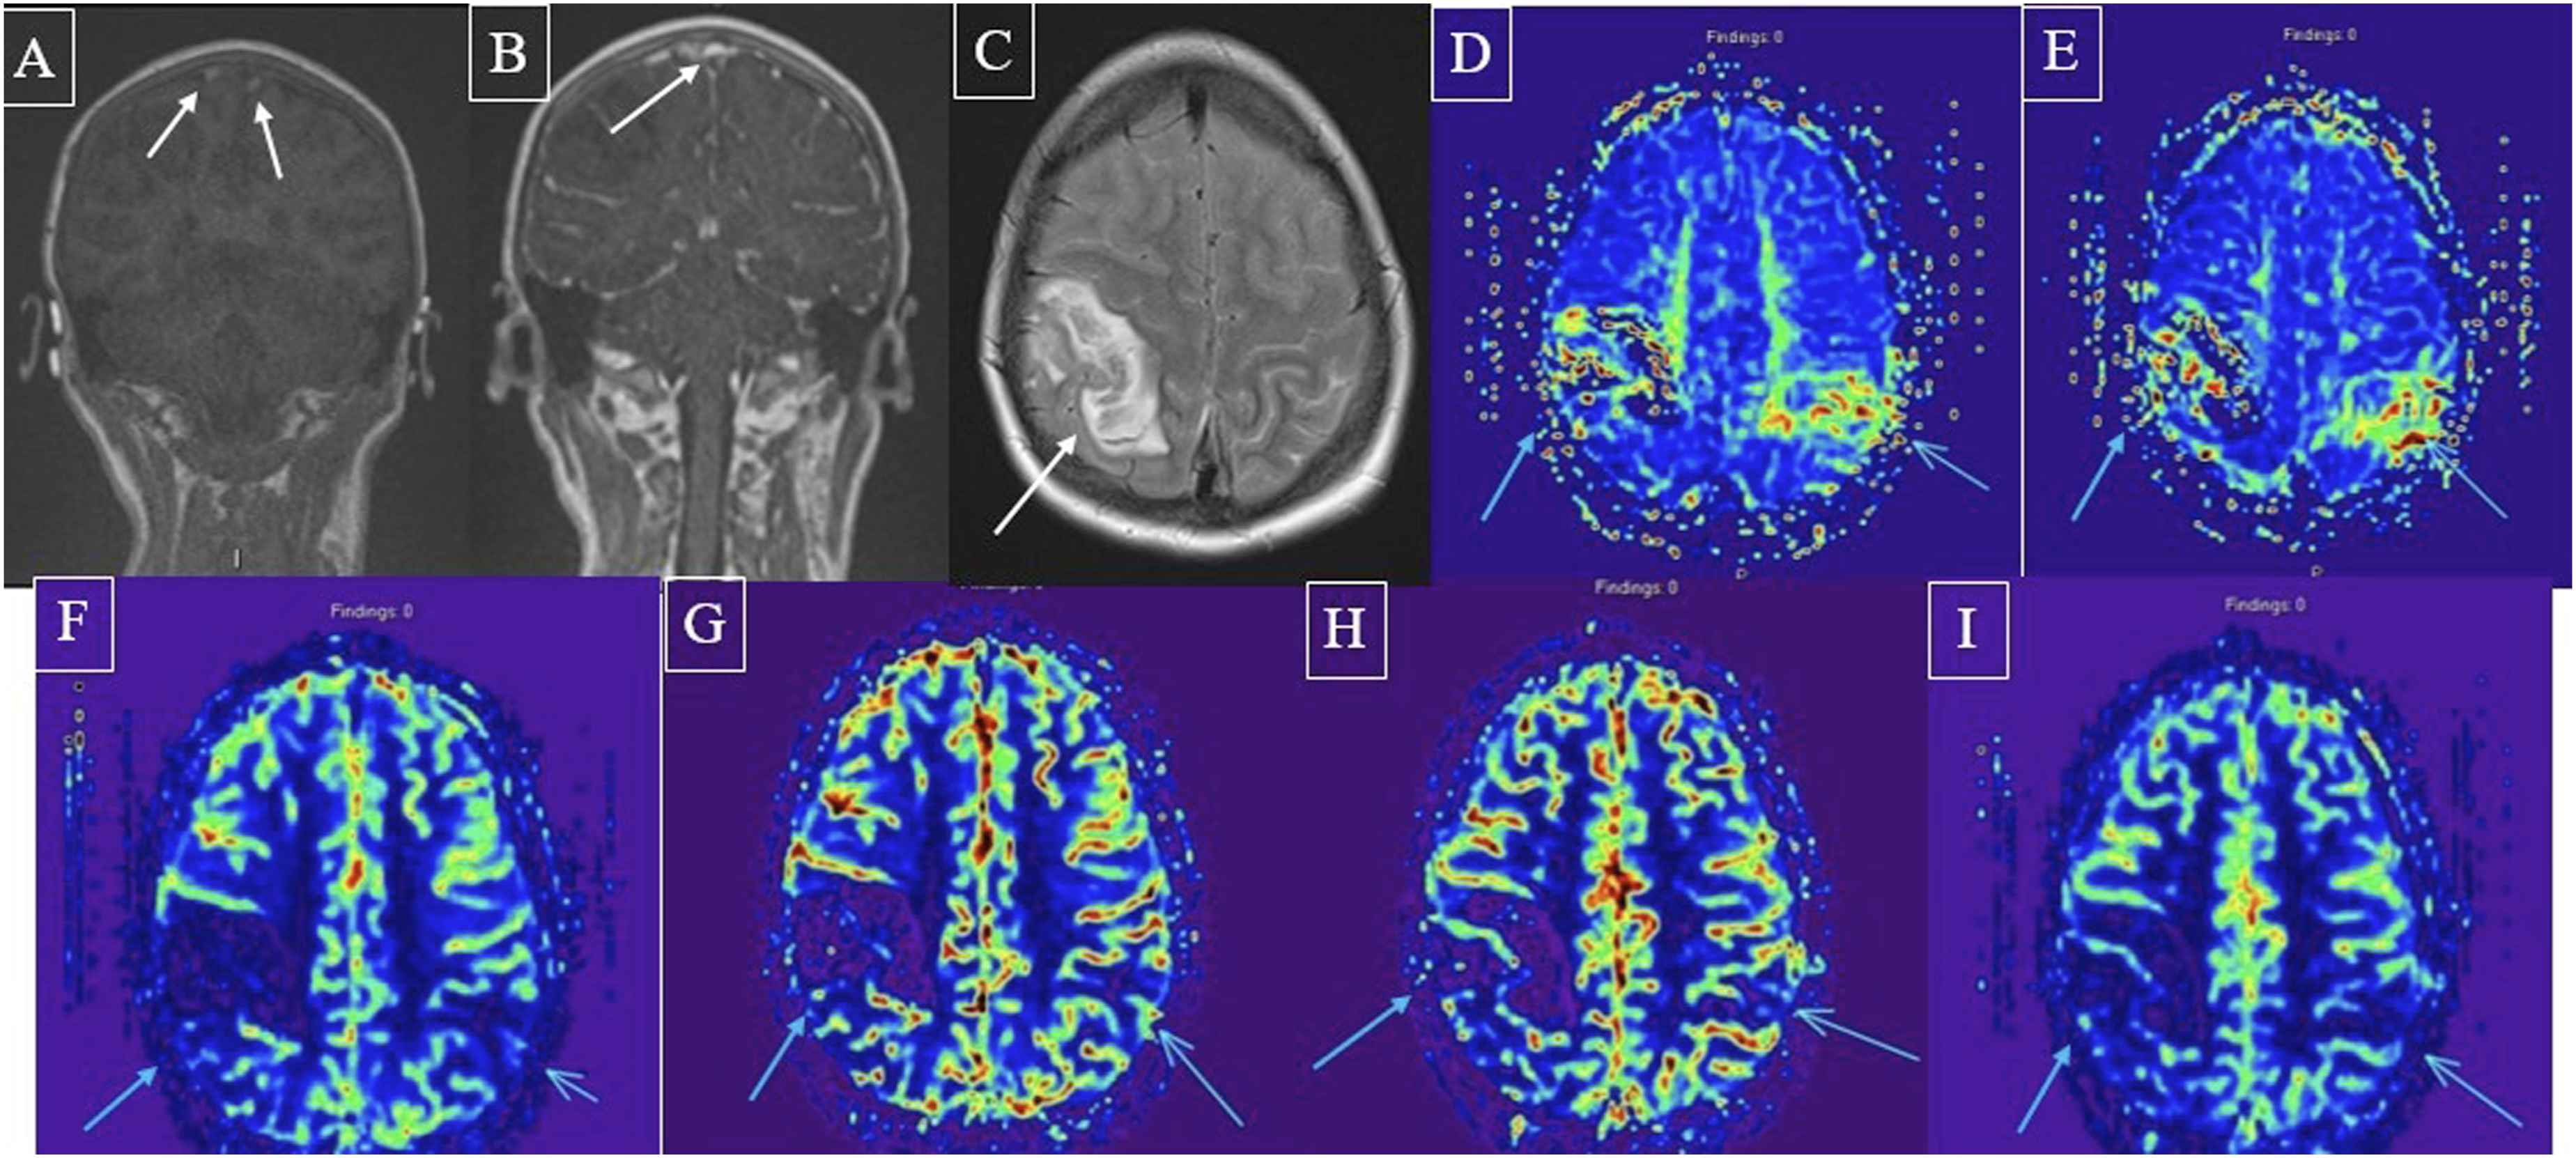
On MR perfusion imaging, MTT maps (Figure 3(d)–(e)) showed transit delays in the bilateral parietal lobes. CBV maps showed decreased CBV in both parietal lobes with corresponding decreased CBF (Figure 3(f)–(i)).
The stroke was attributed to hypercoagulability secondary to leukemia. They were treated with a heparin drip, later transitioned to subcutaneous enoxaparin, and neurological symptoms nearly resolved by discharge.
Case 4
A 61-year-old male with rectal cancer (status post-resection with ileostomy) and pancreatic adenocarcinoma was brought in after a 30-min episode of bilateral extremity weakness and confusion. Last known well was 30 min prior to arrival. FLAIR imaging revealed hyperintensities in the left superior parietal lobe and right middle frontal gyrus, compatible with venous edema/parenchymal injury in the setting of CVST (Figure 4(a)). MRV images demonstrated cortical vein thromboses in the mid and posterior sagittal sinus, right transverse sinus, right sigmoid sinus, and proximal right jugular vein (Figure 4(b)–(c)). Case 4. FLAIR (a) hyperintensity in the left superior parietal lobe and right middle frontal gyrus, compatible with venous edema/parenchymal injury in the setting of CVST. MRV images (b + c) showing cortical vein thrombosis in the mid and posterior sagittal sinus, right transverse sinus, right sigmoid sinus, and proximal right jugular vein. On CT perfusion imaging, there is increased CBF (d) and CBV (e) in the left parietal cortex with corresponding faster transit on MTT (f) and Tmax (g) in a non-territorial distribution, most compatible with ictal or peri-ictal hyperperfusion rather than a primary venous congestion pattern.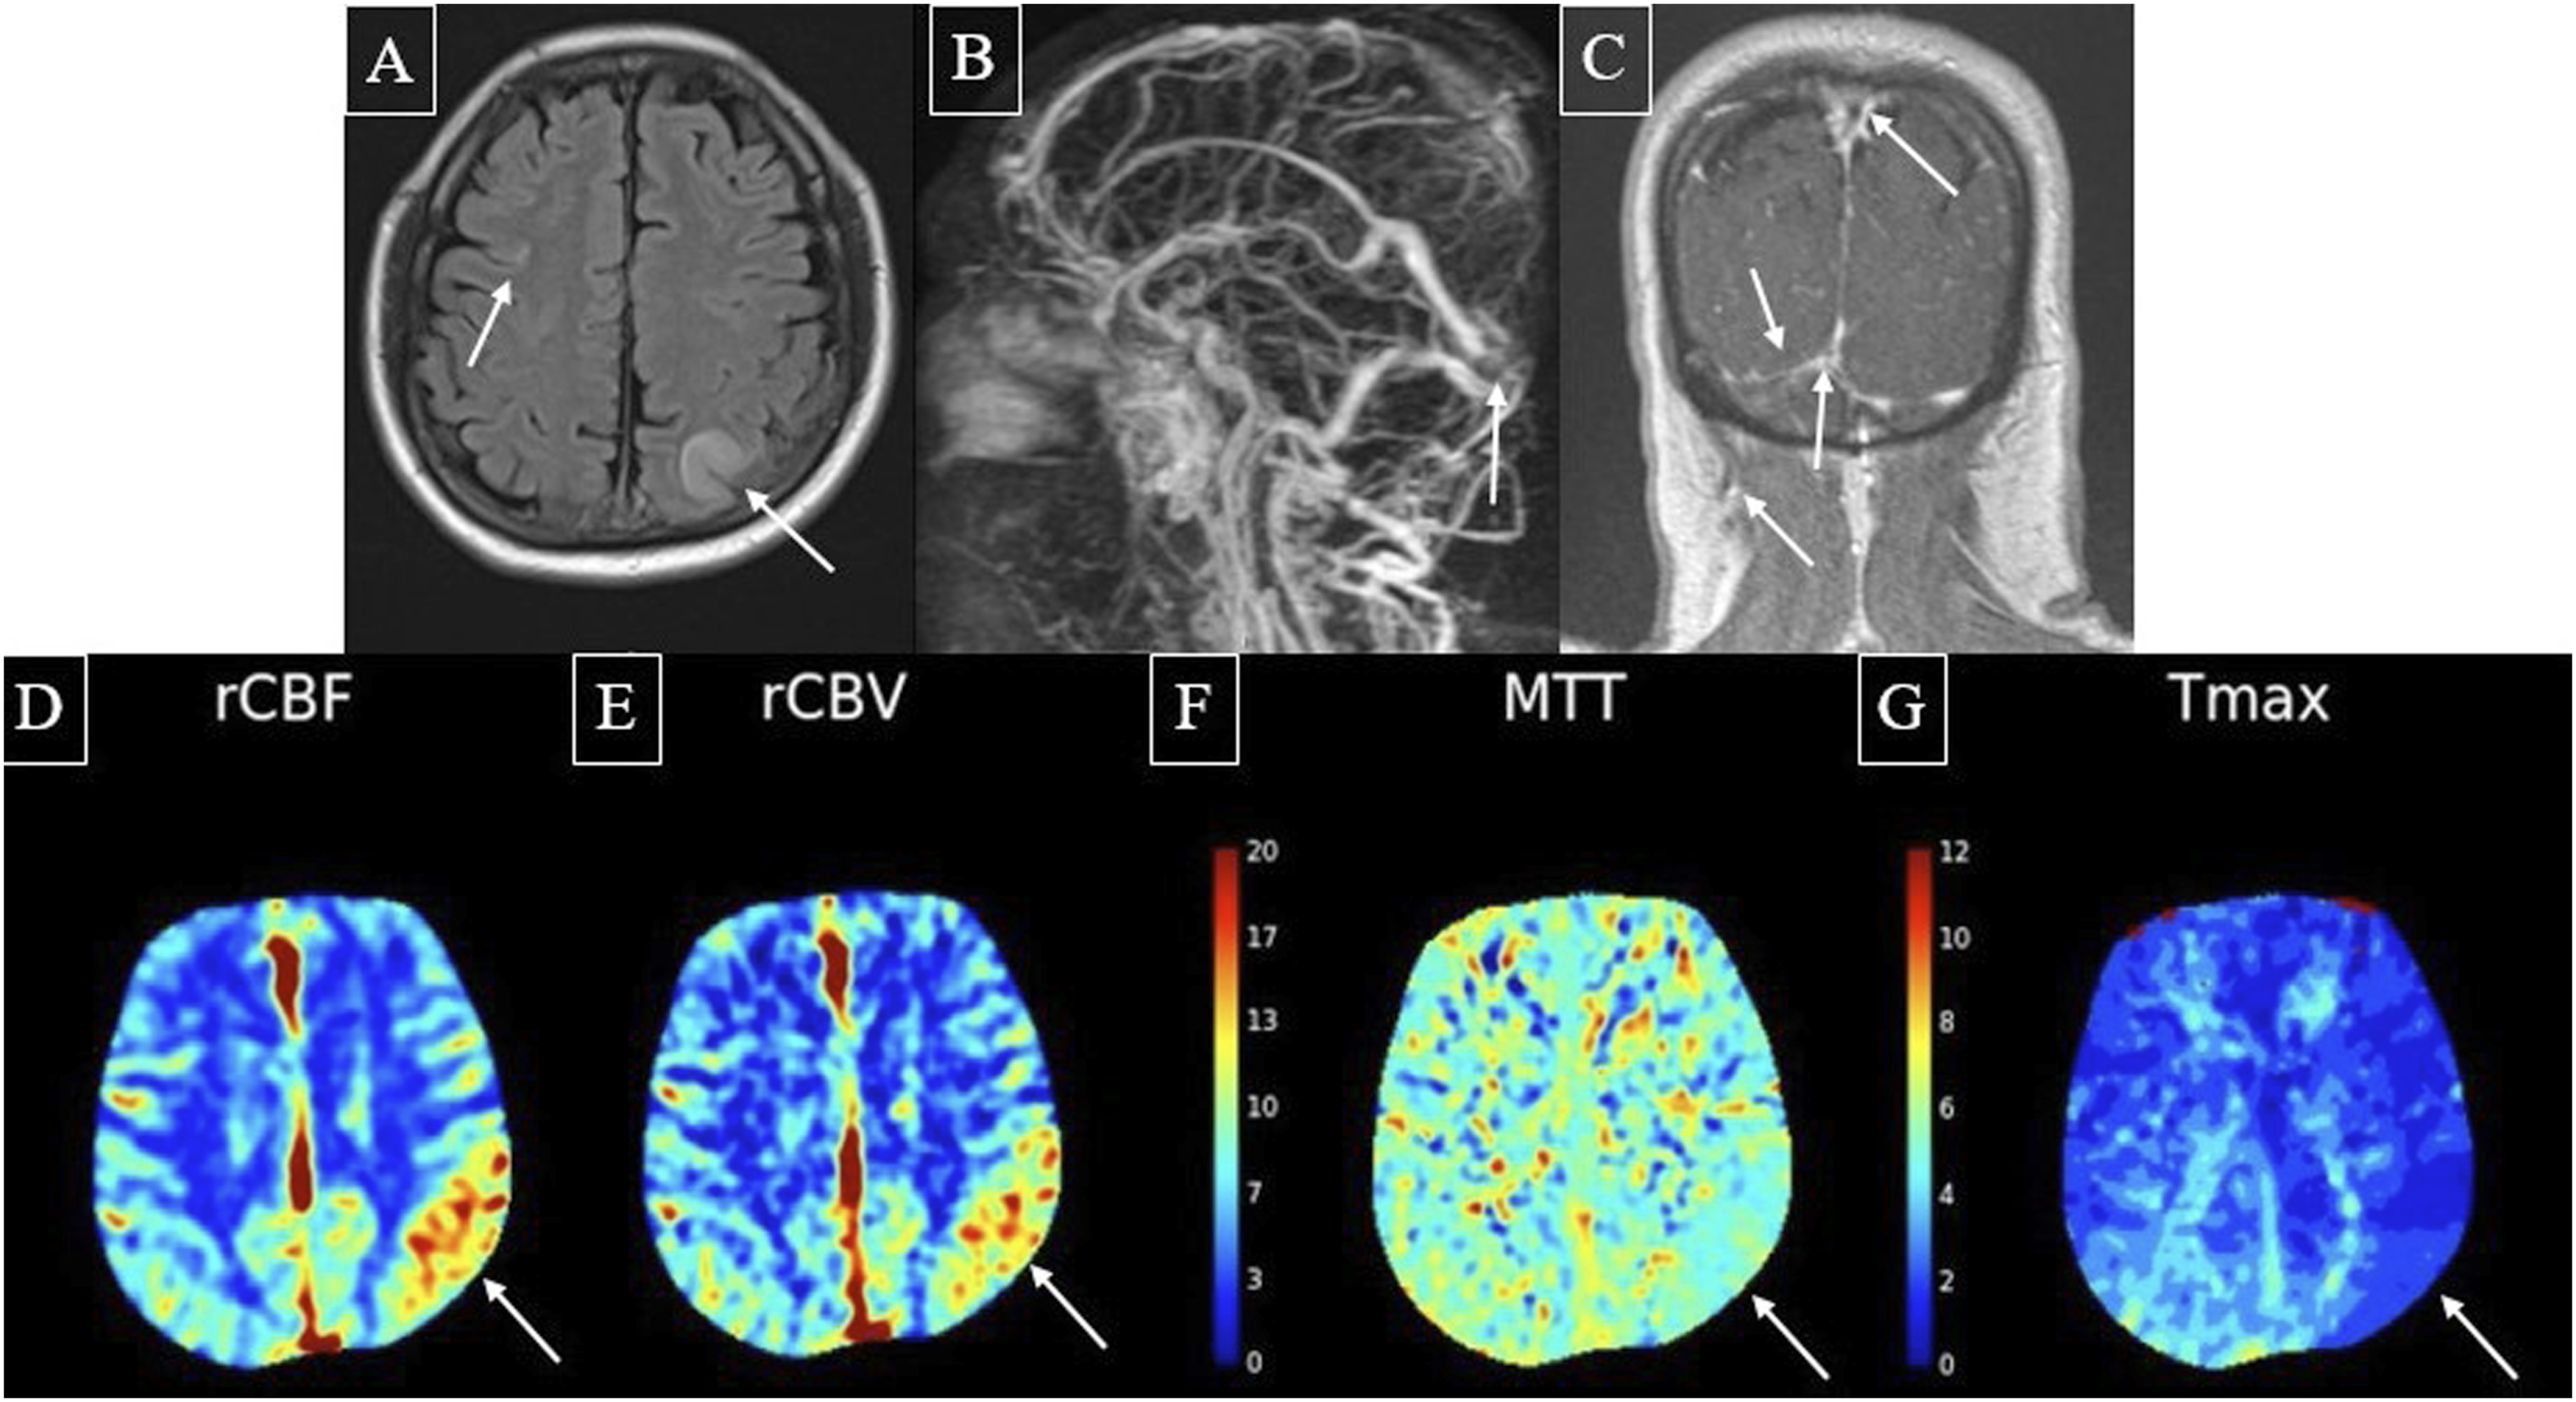
CT perfusion imaging revealed increased CBF and CBV in the left parietal cortex with corresponding faster transit on MTT and Tmax in a non-territorial distribution, most compatible with ictal or peri-ictal hyperperfusion rather than a primary venous congestion pattern (Figure 4(d)–(g)).
Based on the clinical history and imaging, his presentation was attributed to extensive CVST, with the perfusion pattern most suggestive of an ictal or peri-ictal state. The likely underlying etiology of CVST was hypercoagulability from malignancy.
He was treated with a heparin drip and was later transitioned to rivaroxaban. His symptoms resolved within a few days, and he was discharged on rivaroxaban with referral to a seizure clinic.
Case 5
A 75-year-old woman with breast cancer and hypertension presented with slurred speech and left-sided weakness on awakening. Last known well was the prior night, about 10 h prior to presentation.
FLAIR, DWI, and ADC imaging revealed hyperintensity in the right frontal lobe, involving the precentral gyrus, compatible with vasogenic edema (Figures 5A-C). SWI showed susceptibility artifact in the posterior superior sagittal sinus, corresponding to filling defect on the T1 post-contrast image (Figure 5(d)–(e)).
On MR perfusion imaging of the vertex, there was a region of mildly elevated CBV, decreased CBF, and increased MTT/Tmax, corresponding to the areas of FLAIR and DWI hyperintensity and compatible with a venous parenchymal abnormality with vasogenic edema (Figure 5(f)–(i)). Subsequent CTV imaging demonstrated superior sagittal sinus thrombosis (Figure 5(j)). Case 5. FLAIR (a) hyperintensity in the right frontal lobe, involving the precentral gyrus, compatible with vasogenic edema. DWI (b) and ADC (c) hyperintensity in the right frontal lobe, compatible with vasogenic edema. SWI (d) showing susceptibility artifact in the posterior superior sagittal sinus corresponding to filling defect on the T1 post-contrast image (e). At the vertex, there is a region of mildly elevated CBV (f), decreased CBF (g), and increased MTT/Tmax (h + i) corresponding to areas of FLAIR and DWI hyperintensity and compatible with a venous parenchymal abnormality with vasogenic edema. Subsequent CTV (j) demonstrating superior sagittal sinus thrombosis.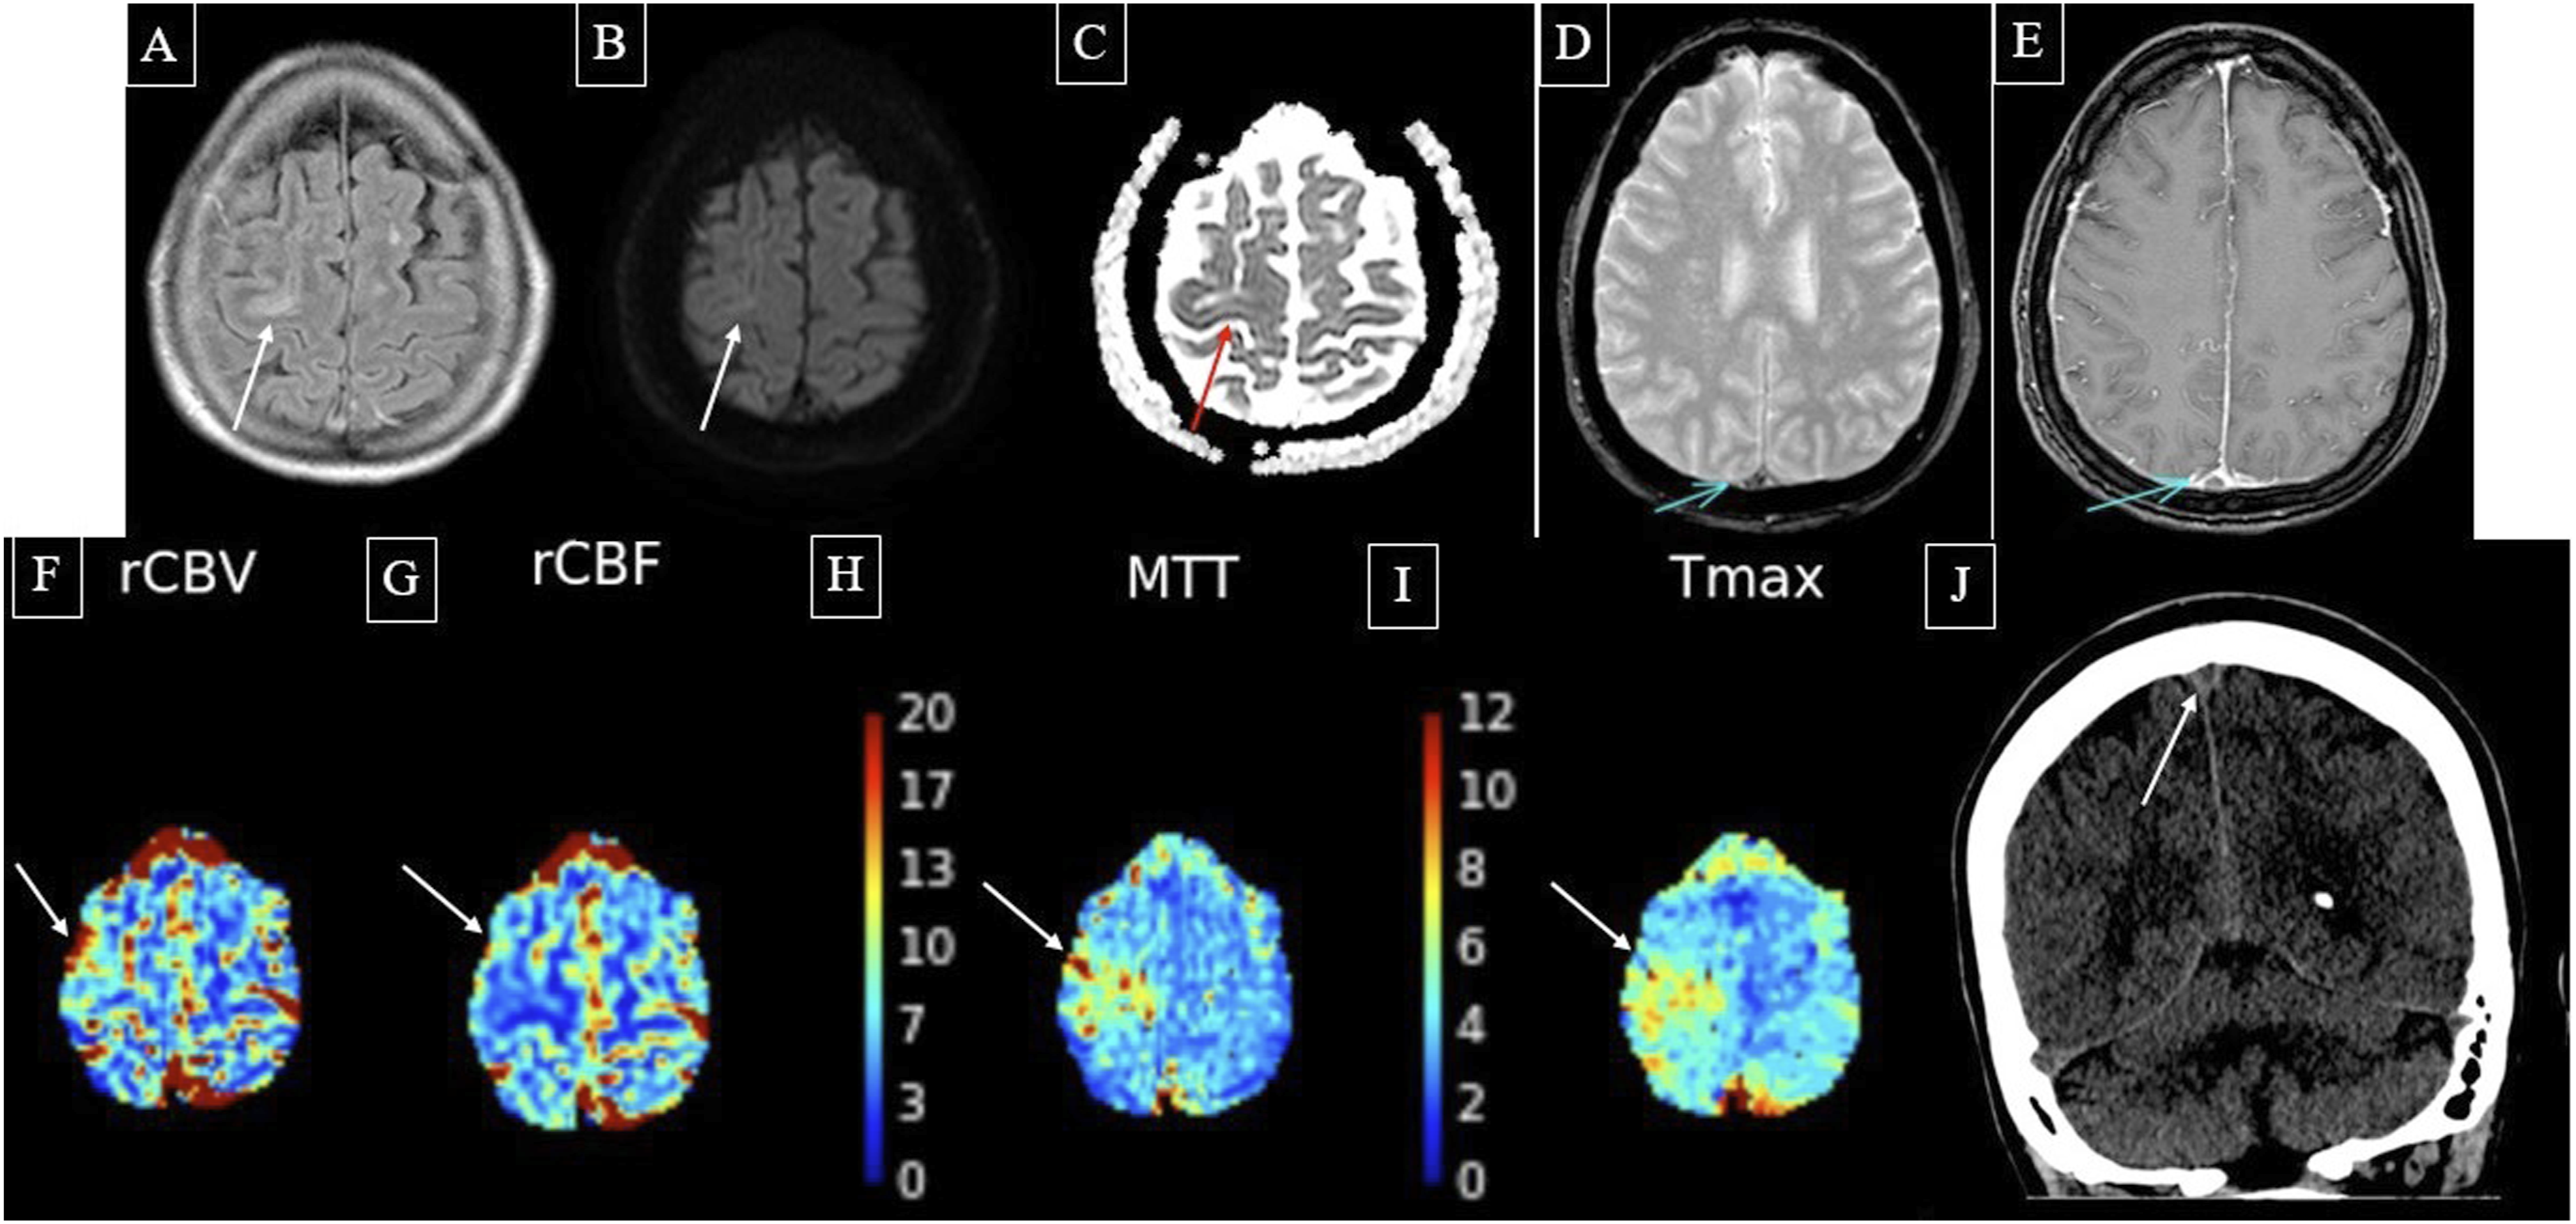
She was treated with heparin, then transitioned to enoxaparin, and finally to apixaban. She was discharged after 3 days with significant recovery. No underlying malignancy was identified on systemic workup.
Discussion
This case series illustrates the heterogeneous perfusion abnormalities that may be encountered in acute CVST and highlights the need to interpret these findings differently from arterial ischemic stroke. A unique strength of this series is the inclusion of patients evaluated with both CTP and MRP in real-world acute clinical settings.
The imaging workflows for these patients reflected varied clinical scenarios. Most patients presented through an emergency stroke pathway and underwent rapid CT-based evaluation, followed by MRI/MRV for additional anatomic characterization when clinically appropriate. One patient developed acute neurologic symptoms while hospitalized and proceeded directly to MRI. This variability reflects the retrospective and pragmatic nature of the series, but it also underscores that CVST-related perfusion abnormalities may be appreciable across both CT and MR perfusion techniques.
The most important observation from this series is that perfusion abnormalities in CVST should not be grouped under a single category of “hypoperfusion.” In arterial occlusion, prolonged transit time with reduced CBF and reduced CBV is commonly interpreted within an infarct core/penumbra paradigm.3–6 In CVST, however, venous outflow obstruction may produce prolonged MTT or Tmax because of impaired venous drainage, while CBV may be preserved or elevated due to venous engorgement and congestion.7–10
In this series, Cases 1 and 5 demonstrated a pattern most consistent with venous congestion or vasogenic edema: prolonged transit metrics with preserved or increased CBV, occurring in regions of parenchymal signal abnormality and followed by favorable clinical recovery. In contrast, Case 3 demonstrated prolonged transit time with decreased CBV and decreased CBF, suggesting more severe tissue-level perfusion failure compatible with venous infarction or advanced parenchymal injury. This distinction between venous congestion and venous infarction may be the most clinically useful contribution of perfusion imaging in CVST. Rather than simply identifying “hypoperfusion,” perfusion maps may help stratify whether the abnormal region represents potentially reversible venous congestion or more advanced venous infarction.7–10
Case 4 should be interpreted separately from the primary venous congestion/infarction spectrum. The increased CBF and CBV with faster transit time in a non-territorial cortical distribution is most compatible with ictal or peri-ictal hyperperfusion. This likely reflects an electrophysiologic complication of CVST rather than the direct hemodynamic effect of venous outflow obstruction. Its inclusion highlights an important diagnostic pitfall: in patients with CVST and seizures, hyperperfusion should not be mistaken for arterial reperfusion or interpreted as the dominant venous perfusion signature of CVST.11–13
The prognostic implications of perfusion findings in CVST remain uncertain and should be interpreted in the context of baseline parenchymal injury. In our series, patients with patterns suggestive of venous congestion or vasogenic edema generally had favorable recovery, whereas patients with hemorrhage or reduced CBV/CBF had more substantial parenchymal injury. However, the small sample size and heterogeneity of clinical presentations preclude firm prognostic conclusions. In particular, the outcome of Patient 2 was likely driven primarily by the large thalamic hemorrhage with intraventricular extension and mass effect rather than by the surrounding perfusion abnormality alone.
We acknowledge several limitations. This is a small retrospective case series, and the imaging protocols, acquisition timing, and clinical contexts were heterogeneous. Perfusion findings were interpreted qualitatively without ROI-based quantitative measurements, standardized thresholds, or reproducibility assessment. In addition, CTP and MRP were both included, which limits direct comparison across cases. Nevertheless, this heterogeneity reflects real-world acute stroke imaging practice, in which CVST may be encountered unexpectedly during evaluation for arterial stroke or seizure. Larger prospective studies with standardized acquisition protocols, quantitative perfusion metrics, and longitudinal imaging follow-up are needed to clarify the prognostic role of perfusion imaging in CVST.
Overall, perfusion imaging may provide valuable insights into the complex hemodynamic consequences of acute CVST. A practical interpretive approach is to distinguish delayed transit with preserved or elevated CBV, suggesting venous congestion, from delayed transit with decreased CBV and CBF, suggesting venous infarction or advanced tissue injury. Hyperperfusion should be interpreted separately, particularly when the clinical and imaging pattern suggests seizure-related hyperemia. Recognition of these distinct patterns may help radiologists avoid applying arterial stroke perfusion paradigms too rigidly to venous disease.
Footnotes
Consent to participate
The patients reported in the manuscript signed the informed consent/authorization for participation in research which includes the permission to use data collected in future research projects including presented case details and images used in this manuscript.
Funding
The authors received no financial support for the research, authorship, and/or publication of this article.
Declaration of conflicting interests
The authors declared no potential conflicts of interest with respect to the research, authorship, and/or publication of this article.