
Abstract
Neuroanatomy remains one of the most challenging areas in medical education, including neuroradiology, due to its complexity and limitations of traditional teaching methods. This study proposes a novel approach based on systematic image and video sequences to enhance the presentation, exploration, communication, learning, and teaching of neuroanatomy. Systematic image sequences are ordered sets of spatially and contextually correlated images characterized by five features: anatomical content, parcellation, annotation, location, and dimensionality. Five elementary sequence types are introduced: appearance, contextual, multi-dimensional, dissection, and special, which can be combined into composite (homogeneous/heterogeneous, uni-view/multi-view) sequences. These sequences are presented in interactive, single multi-image, and automated modes, and extended to video formats. The sequences were created using a high-resolution, fully parcellated 3D atlas of the human brain, head, and neck. 12 image sequences (51 images) and two video sequences are presented and discussed, along with references to three major resources of ready-to-use sequences: NOWinBRAIN repository (over 8600 3D neuroimages), ebook Neuroanatomy Made Easy (over 350 sequences), and the latest edition of Gray’s Anatomy/Chapter_28. The proposed sequences enhance visualization and understanding of anatomical structures and relationships. Appearance sequences improve recognition through parcellation and labeling, while contextual sequences reveal spatial relationships. Dissection and cortical opening sequences expose otherwise hidden structures, and multi-dimensional sequences bridge 2D radiology with 3D anatomy. Hence, the method elucidates complex anatomical organization, including cortico-vascular relationships, ventricular-venous alignment, and cranial nerve pathways. Overall, systematic image-video sequences provide a conceptually straightforward, easy-to-use, simply integrable, and cost-effective framework enhancing spatial understanding and interpretation, particularly in neuroradiology.
Keywords
Introduction
Radiology as a discipline is advancing at a pace that often exceeds the evolution of medical education, largely due to rapid technological innovation. This growing gap has prompted the development of various educational strategies, including team-based learning, hands-on training, case-based learning, flipped classroom models, and virtual PACS-based instruction. Among radiologic subspecialties, neuroradiology holds a central role in modern medicine, contributing significantly to the diagnosis and treatment of major neurological disorders. At its core lies neuroanatomy, a foundational yet consistently challenging subject, widely regarded and reported as one of the most difficult areas in medical education and training.1–5 For instance, a recent study has revealed that neuroanatomy is considered the most difficult for 79% of medical students and 80% of residents. 1 The inherent complexity of the human brain is not the only factor contributing to these challenges, and the methods of presenting, exploring, communicating, learning, and teaching neuroanatomy also play a significant role. For instance, the study 6 reported that learning neuroanatomy from traditional textbooks and lectures was perceived as “very, very hard and tough.”
In my view, the perceived difficulty of neuroanatomy arises from several interrelated factors. First, textbooks and research articles tend to rely heavily on dense textual descriptions of neuroanatomy, often at the expense of sufficiently rich and illustrative visual content. Second, 3D representations remain underutilized, despite substantial evidence that 3D volumetric visualization enables more accurate and efficient identification of brain structures compared to conventional 2D sectional approaches.7–9 Third, instructional practices frequently define unfamiliar structures in relation to multiple neighboring structures that are themselves unknown to the learner, intensifying cognitive load. Fourth, specific neuroanatomical structures and regions are often presented without adequate surrounding anatomical context, limiting the learner’s ability to integrate and spatially orient this information. Finally, there is a limited emphasis on image interpretation skills, such as neuroanatomical parcellation and systematic annotation, which could be effectively supported through the use of annotated brain atlases.
To address these challenges and alleviate the burden associated with learning neuroanatomy, there is a clear need for novel approaches to its presentation and exploration. Such innovations may arise from the adoption of advanced technologies, such as artificial intelligence and virtual or augmented reality, as well as from the development of new methods, and here we focus on the latter.
In this work, I propose a novel approach to the effective presentation, exploration, communication, learning, and teaching of neuroanatomy in neuroradiology. This approach is based on the use of multiple, multi-parameter, systematically organized, and spatially correlated image sequences, further extended into dynamic video sequences to enhance spatial understanding. The present study builds upon and extends the concepts introduced earlier in my ECR 2026 (European Congress of Radiology) presentation. 10
Below, I define a novel concept of systematic image sequences and introduce five types of elementary image sequences, four groups of composite image sequences, and three modes of presenting them. These systematic image sequences are illustrated, and their respective advantages are discussed. I also introduce the video sequences as an extension of this framework and provide illustrative examples. In addition, I provide three sources containing large collections of ready-to-use image sequences that I have previously created for the brain, extended to the head and neck. These include the public 3D neuroimage repository NOWinBRAIN, which contains more than 8600 images, the majority organized into hundreds of image sequences11–13; the ebook Neuroanatomy Made Easy featuring over 350 image sequences 14 ; and a brain chapter in the latest 43rd edition of Gray’s Anatomy. 15
Method and material
Method
Image features
An image is typically characterized by attributes such as size, resolution, and content. In this work, we consider an image to be an object described by the five key feature categories: anatomical content, parcellation (subdivision), annotation (labeling), location in a stereotactic space, and dimensionality. Within this framework, an image is treated not as a raw visual representation, but as an annotated and structured map of anatomical information.
Parcellation or subdivision of an image into its anatomic components is achieved and conveyed through the use of color. In non-parcellated images, structures, regions, and systems are displayed in a uniform, single color or as a gray-scale. In contrast, parcellated images employ multiple colors, with each anatomical structure and region assigned a distinct color that is consistently linked to its corresponding label.
Annotations in the form of labels typically provide the names of the parcellated structures and regions. Annotations in some brain atlases may also convey additional information, such as the diameters of blood vessels 16 or cranial nerves, structure description, 17 detailed accounts of anatomy and its variability with supporting references 18 , and description of disorders with their signs, symptoms, and syndromes. 19 Together, image parcellation and labeling determine image appearance. A parcellated and labeled image thus constitutes an annotated map, integrating structural delineation with descriptive information.
Location specifies the position of an image within a defined stereotactic space. In this work, all images are placed in the Talairach stereotactic space, with its origin at the anterior commissure. 20
Dimensionality refers to whether anatomical information is represented in two or three dimensions. Traditional sectional anatomy and radiologic tomographic scans are inherently 2D, whereas the human body, and particularly neuroanatomical structures encountered in neurosurgery, are fundamentally 3D.
Elementary image sequences
A systematic image sequence is defined as an ordered set of images that share the same size and are spatially and content-wise correlated within a common stereotactic space. Consecutive images in the sequence partially overlap in terms of content, parcellation, and/or annotations, while maintaining either constant or variable dimensionality. This structure allows the sequence to emphasize progressive changes across images while preserving their underlying continuity and coherence.
Based on variability in content, parcellation, annotations, spatial location, and dimensionality, five elementary types of systematic image sequences are introduced: appearance, contextual, multi-dimensional (2D–2D/3D), dissection, and special sequences.
In an appearance image sequence, anatomical content, spatial location, and dimensionality of images remain constant, while image appearance varies through changes in parcellation and/or annotation. The primary purpose of this sequence is to distinguish between original, non-parcellated and unlabeled (raw) images and their parcellated and/or annotated counterparts (i.e., annotated maps), thereby facilitating image interpretation. By directly comparing parcellated and labeled images with their non-parcellated and unlabeled counterparts, anatomical features that may be difficult to recognize in raw images become more apparent and easier to identify.
In a contextual image sequence, spatial location and dimensionality remain constant, while anatomical content, parcellation, and annotations partially overlap across consecutive images. The corresponding parcellation and labeling evolve in accordance with this overlap. Each subsequent image incrementally expands in content by including an equal or greater number of structures, thereby progressively revealing the surrounding anatomical context. At the same time, labels for previously introduced structures are maintained in fixed positions, ensuring continuity and facilitating comparison across the sequence.
In a dissection image sequence, the structure of interest remains constant, whereas the surrounding structure or structures that obscure it, is or are progressively dissected to gradually reveal and better expose the structure of interest. For example, to demonstrate the intracranial arteries hidden in the cerebral sulci, these arteries can be visualized in a sequence of images located at successive depths within the dissected cerebrum, allowing these vessels to become increasingly visible. The construction of a dissection sequence requires specification of the dissection direction, the location of the dissection plane, and the number and size of dissection steps, which together determine the progression and clarity of exposure.
A multi-dimensional image sequence integrates both planar and surface anatomy. Planar anatomy is typically derived from sectional or radiologic tomographic images, whereas surface anatomy is reconstructed in 3D to convey the shape, size, and course of structures, features that are particularly relevant in surgical contexts. This sequence is commonly represented as a 2D–2D/3D pair, comprising a planar image alongside a corresponding combined planar–surface representation, thereby linking sectional views with their 3D anatomical context.
A special image sequence is generated using dedicated techniques to create its component images. One example is a sequence based on cortical openings. 12 A cortical opening involves the removal of a selected region of the cortical mantle, typically a gyrus or lobule, to expose underlying structures that would otherwise remain obscured.
Composite image sequences
These five elementary image sequences can be combined to form composite (or combined) image sequences. From a content perspective, a composite image sequence may be formed either from the same elementary image sequence (resulting in a homogenous composite image sequence) or from various elementary image sequences (forming a heterogeneous composite image sequence). From the standpoint of viewing direction, such a combination may be generated either for the same view (yielding a uni-view composite image sequence) or for different views (resulting in a multi-view composite image sequence), for instance, across standard views including anterior, left, posterior, right, superior, and inferior, thereby providing a more comprehensive spatial understanding.
We further distinguish two special cases of composite image sequences. First, the hybrid image sequence, which is defined as a uni-view heterogeneous composite sequence comprising an appearance image sequence followed by a contextual image sequence. Second, this is an alternate image sequence containing a repetition of an image sub-sequence or sub-sequences for various labeling and/or parcellation, for example, by employing diverse cortical maps. Finally, the hybrid and alternate image sequences may further be combined, forming a hybrid-alternate image sequence.
Image sequence presentation modes
I introduce three modes for presenting an image sequence: interactive, single multi-image, and automated (animated).
In the interactive mode, users manually scroll through the images by moving them forward and/or backward at a self-controlled pace. This can be achieved by using standard image viewers (e.g., Windows Photo Viewer) or by arranging the sequence within presentation software (such as PowerPoint).
In the single multi-image mode, the entire image sequence is displayed simultaneously in a single composite view, offering an immediate “big picture” overview and enabling rapid visual comparison across all images.
In the automated mode, the images advance automatically at a predefined speed allowing for a continuous viewing experience. Animation can be achieved by converting an image sequence into an animated format, such as GIF or TIFF.
There are several professional tools for converting image sequences into looped animations with automated image scrolling. The Animated Graphics Interchange Format (GIF) is one of the most popular formats despite being 8-bit and can be generated, for example, by employing Animated GIF Maker at. 21 The Animated Portable Network Graphics (APNG) image format is 24-bit RGB color and can be created, for example, by using ASPOSE Animation Maker at. 22
Video sequences
Elementary image sequences consist of static images presented from a single viewpoint, while composite multi-view sequences extend this approach by depicting anatomy from multiple fixed perspectives. Video sequences represent a natural extension of these concepts, as by introducing the illusion of motion over time, they enable the dynamic visualization of anatomy across a continuous range of viewpoints.
Video sequences are typically presented in a single multi-video mode, allowing simultaneous comparison of corresponding dynamic representations. Although various types of video sequences can be envisaged, a particularly practical type is the appearance 2-video sequence, which juxtaposes the non-parcellated and unlabeled (raw) anatomy with its parcellated and labeled counterpart (i.e., an annotated anatomic dynamic map).
Material
To create the image and video sequences defined above, The Human Brain, Head and Neck in 2953 Pieces 16 is employed. This atlas was developed from multiple 3 and 7 T MRI and high-resolution CT scans of the same normal brain specimen. The acquired scans were segmented, reconstructed into 3D models, parcellated by color into about 3000 3D components, and fully labeled with names. The atlas was further empowered with a wide range of interactive functionalities, particularly enabling arbitrary composition and decomposition of 3D scenes for comprehensive and detailed anatomical exploration. 23
Results
The systematic image sequences defined above are illustrated here for the human brain, extended to the head and neck.
An example of an appearance image sequence is shown in Figure 1 as a 7-image sequence demonstrating the parcellated and labeled left cerebral hemisphere. This sequence employs three cortical maps corresponding to lobes, gyri, and combined gyri with sulci (including additionally poles and lobules), resulting in seven distinct appearance instances: one mono-color (non-parcellated), three multi-color (parcellated) but unlabeled, and three multi-color labeled images. Appearance 7-image sequence of the parcellated and labeled left cerebral hemisphere (left lateral view) illustrating various cortical maps. Row I) non-parcellated and unlabeled. Row II) parcellated into lobes (left) and labeled (right). Row III) parcellated into gyri (left) and labeled (right). Row IV) parcellated into both gyri and sulci (left) and labeled (right).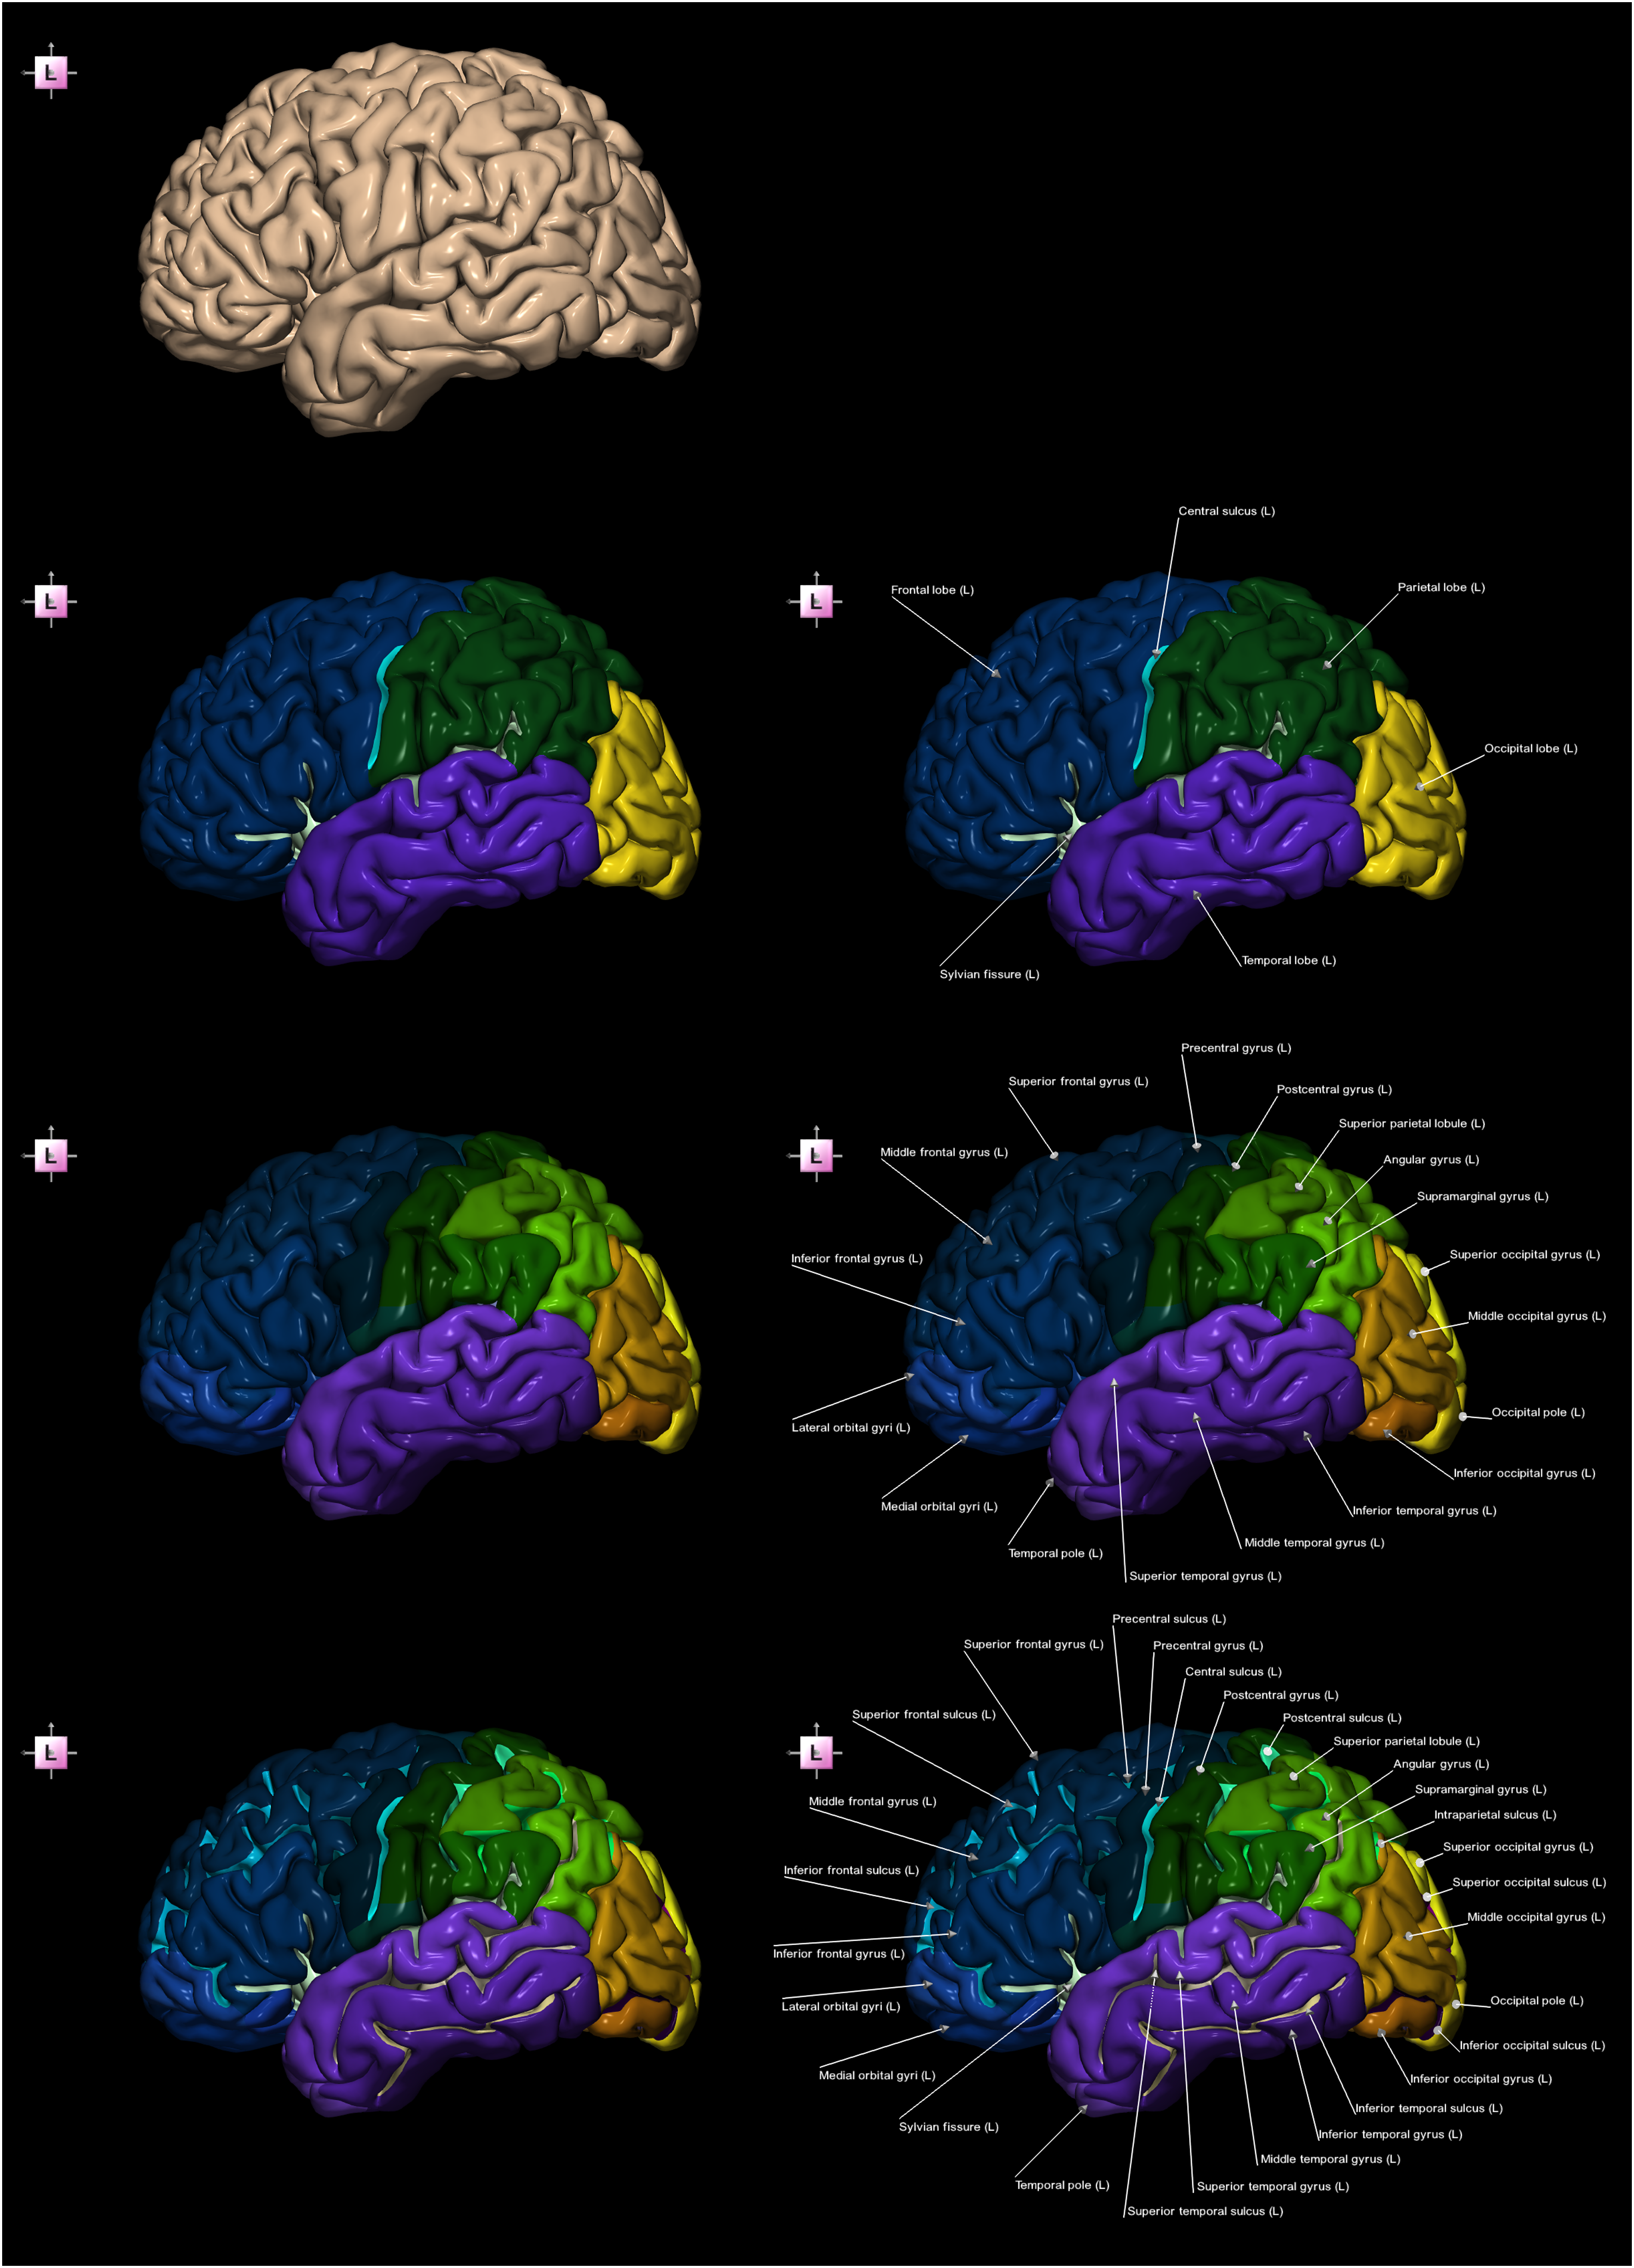
Another example of an appearance image sequence is illustrated in Figure 2, showing a 3-image sequence of the left cerebral superficial veins terminating in the dural sinuses (according to the cerebral vein classification proposed in
24
). Appearance 3-image sequence of the left superficial cerebral veins terminating in the dural sinuses (left lateral view). Top) non-parcellated and unlabeled. Middle) parcellated and unlabeled. Bottom) parcellated and labeled.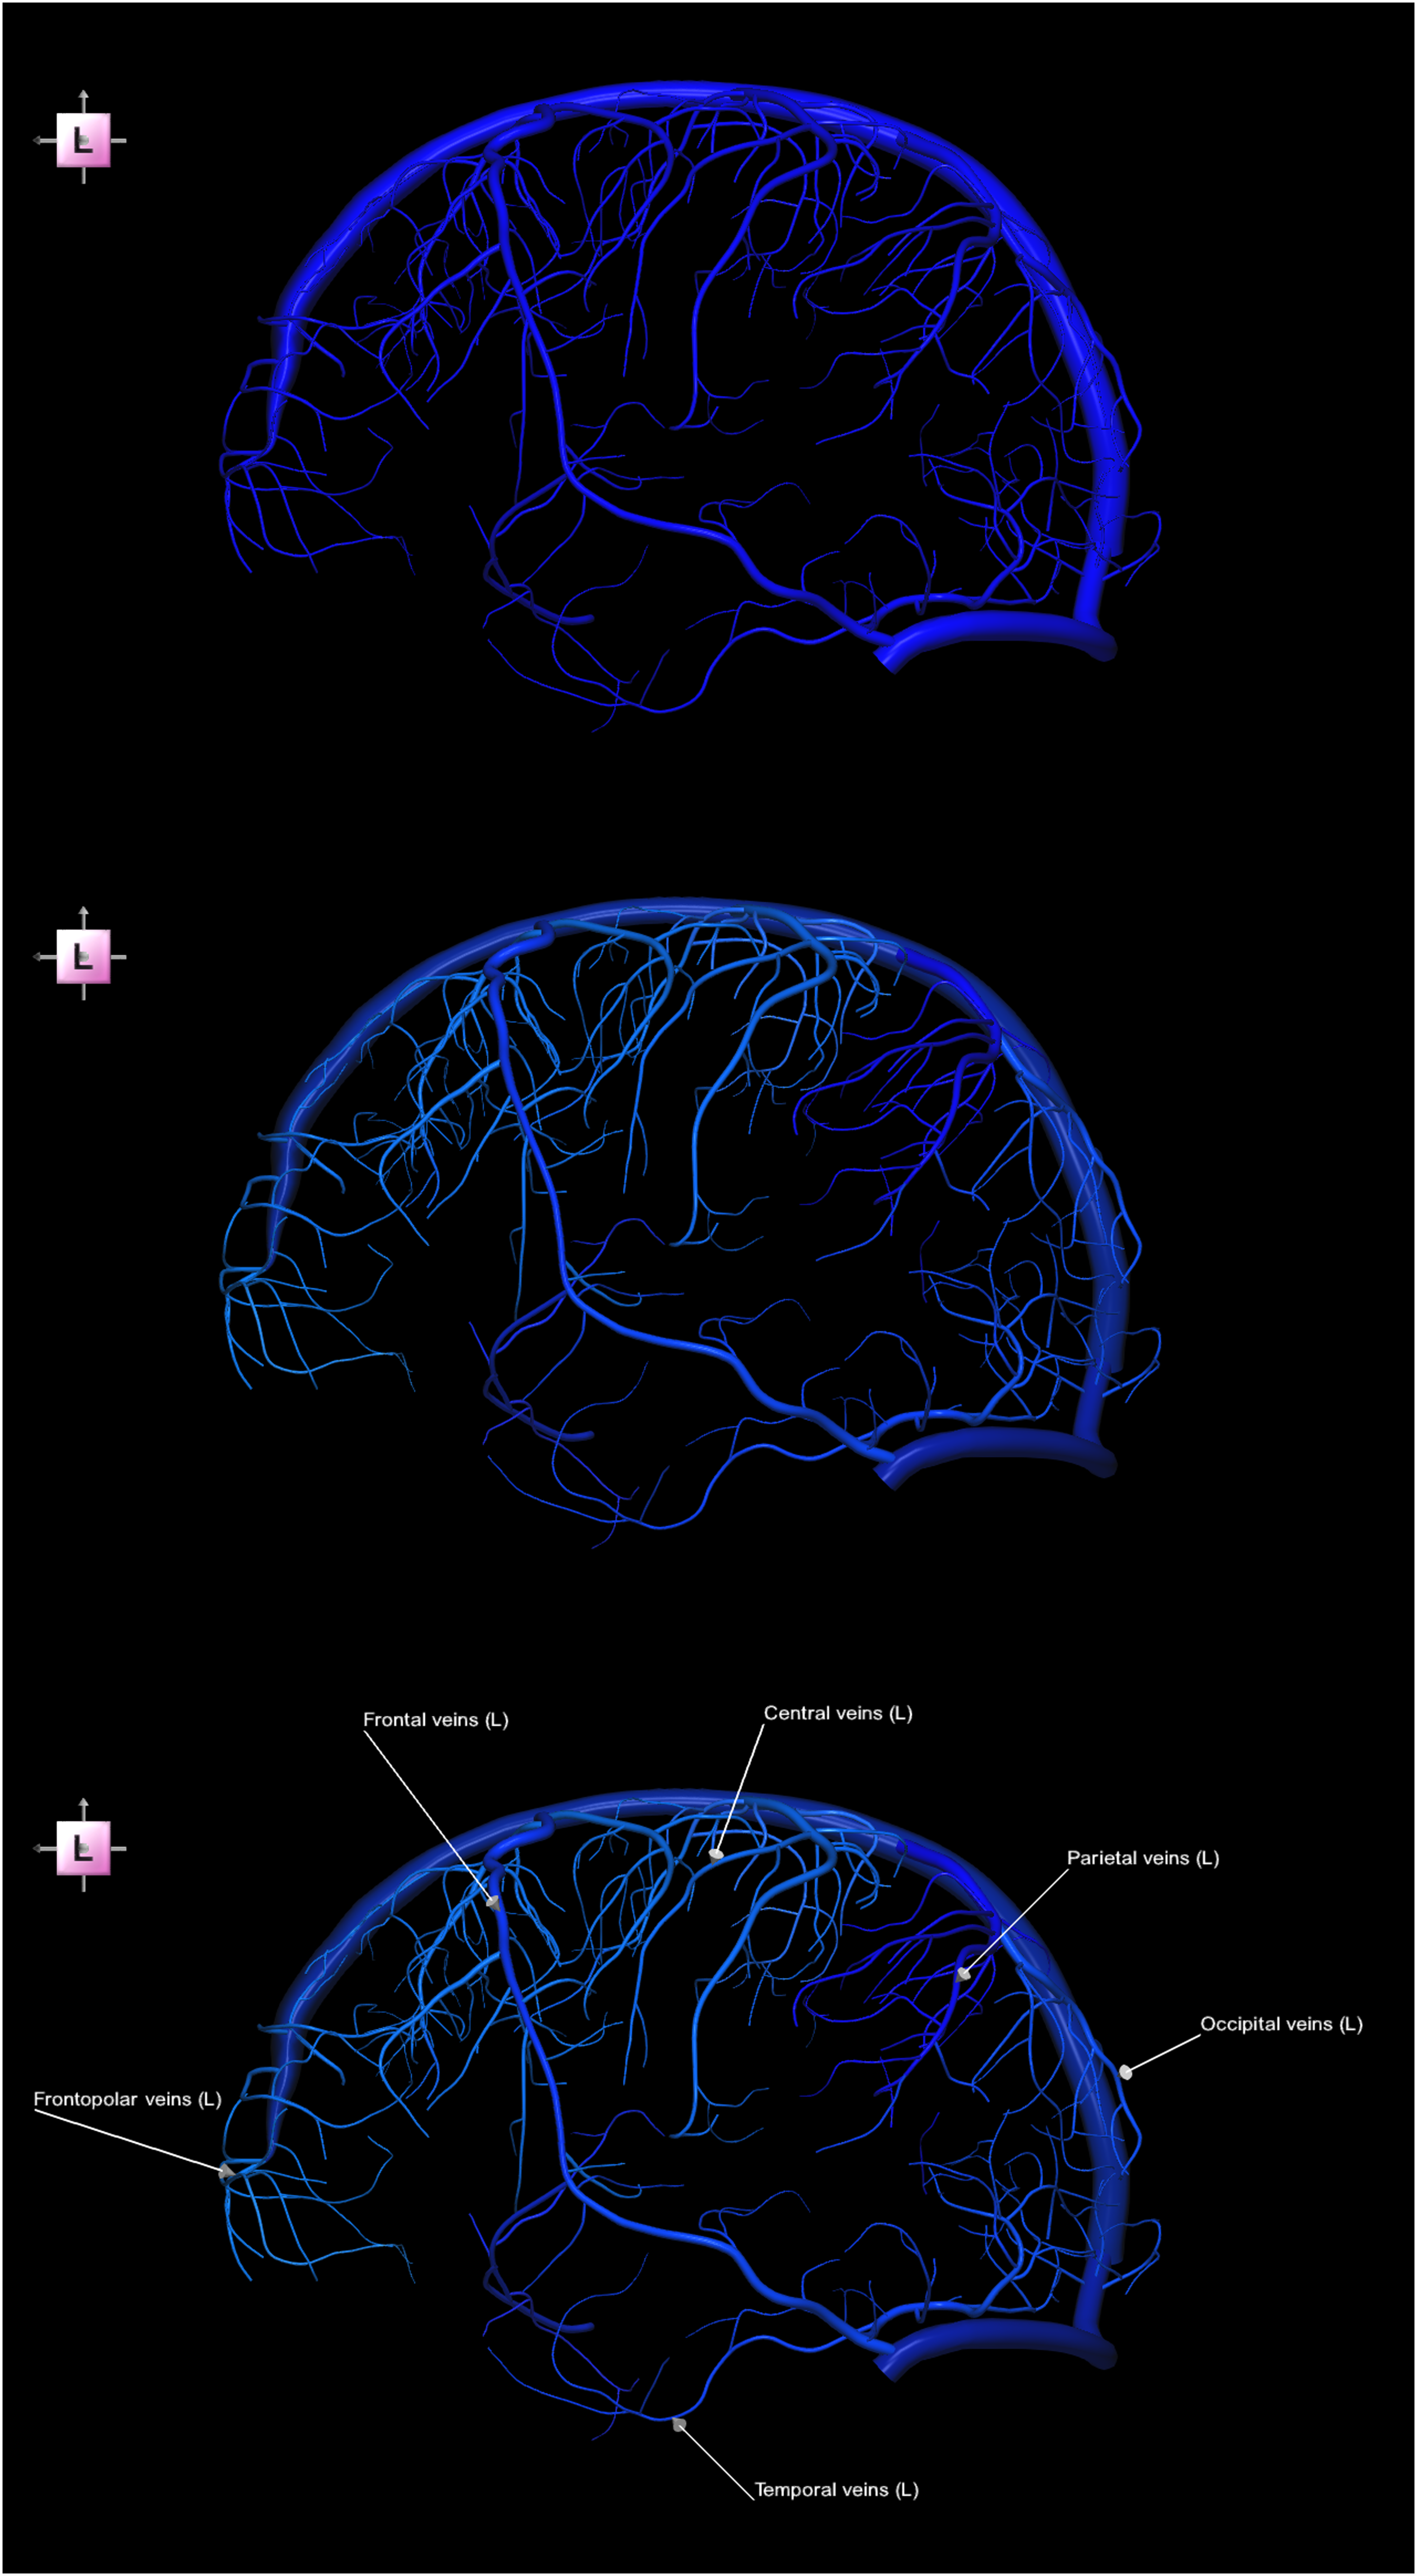
Although this appearance sequence illustrates vein grouping and naming, it does not convey the correspondence between specific vein groups and the cortical region they drain. Given that the naming of these venous groups reflects their corresponding vascular territories, this relationship is better illustrated using a contextual image sequence. Specifically, Figure 3 presents a contextual 3-image sequence in which the veins are shown within the framework of the parcellated cerebral cortex, thereby establishing a clear correspondence between venous structures and their drainage territories. Contextual 3-image sequence of the left superficial cerebral veins terminating in the dural sinuses together with the left cerebral cortex parcellated into lobes (left lateral view), illustrating that venous nomenclature corresponds to the vascular territories of drainage. Top) parcellated and labeled veins. Middle) parcellated and labeled veins and non-parcellated and unlabeled cortex. Bottom) parcellated and labeled veins and cortex.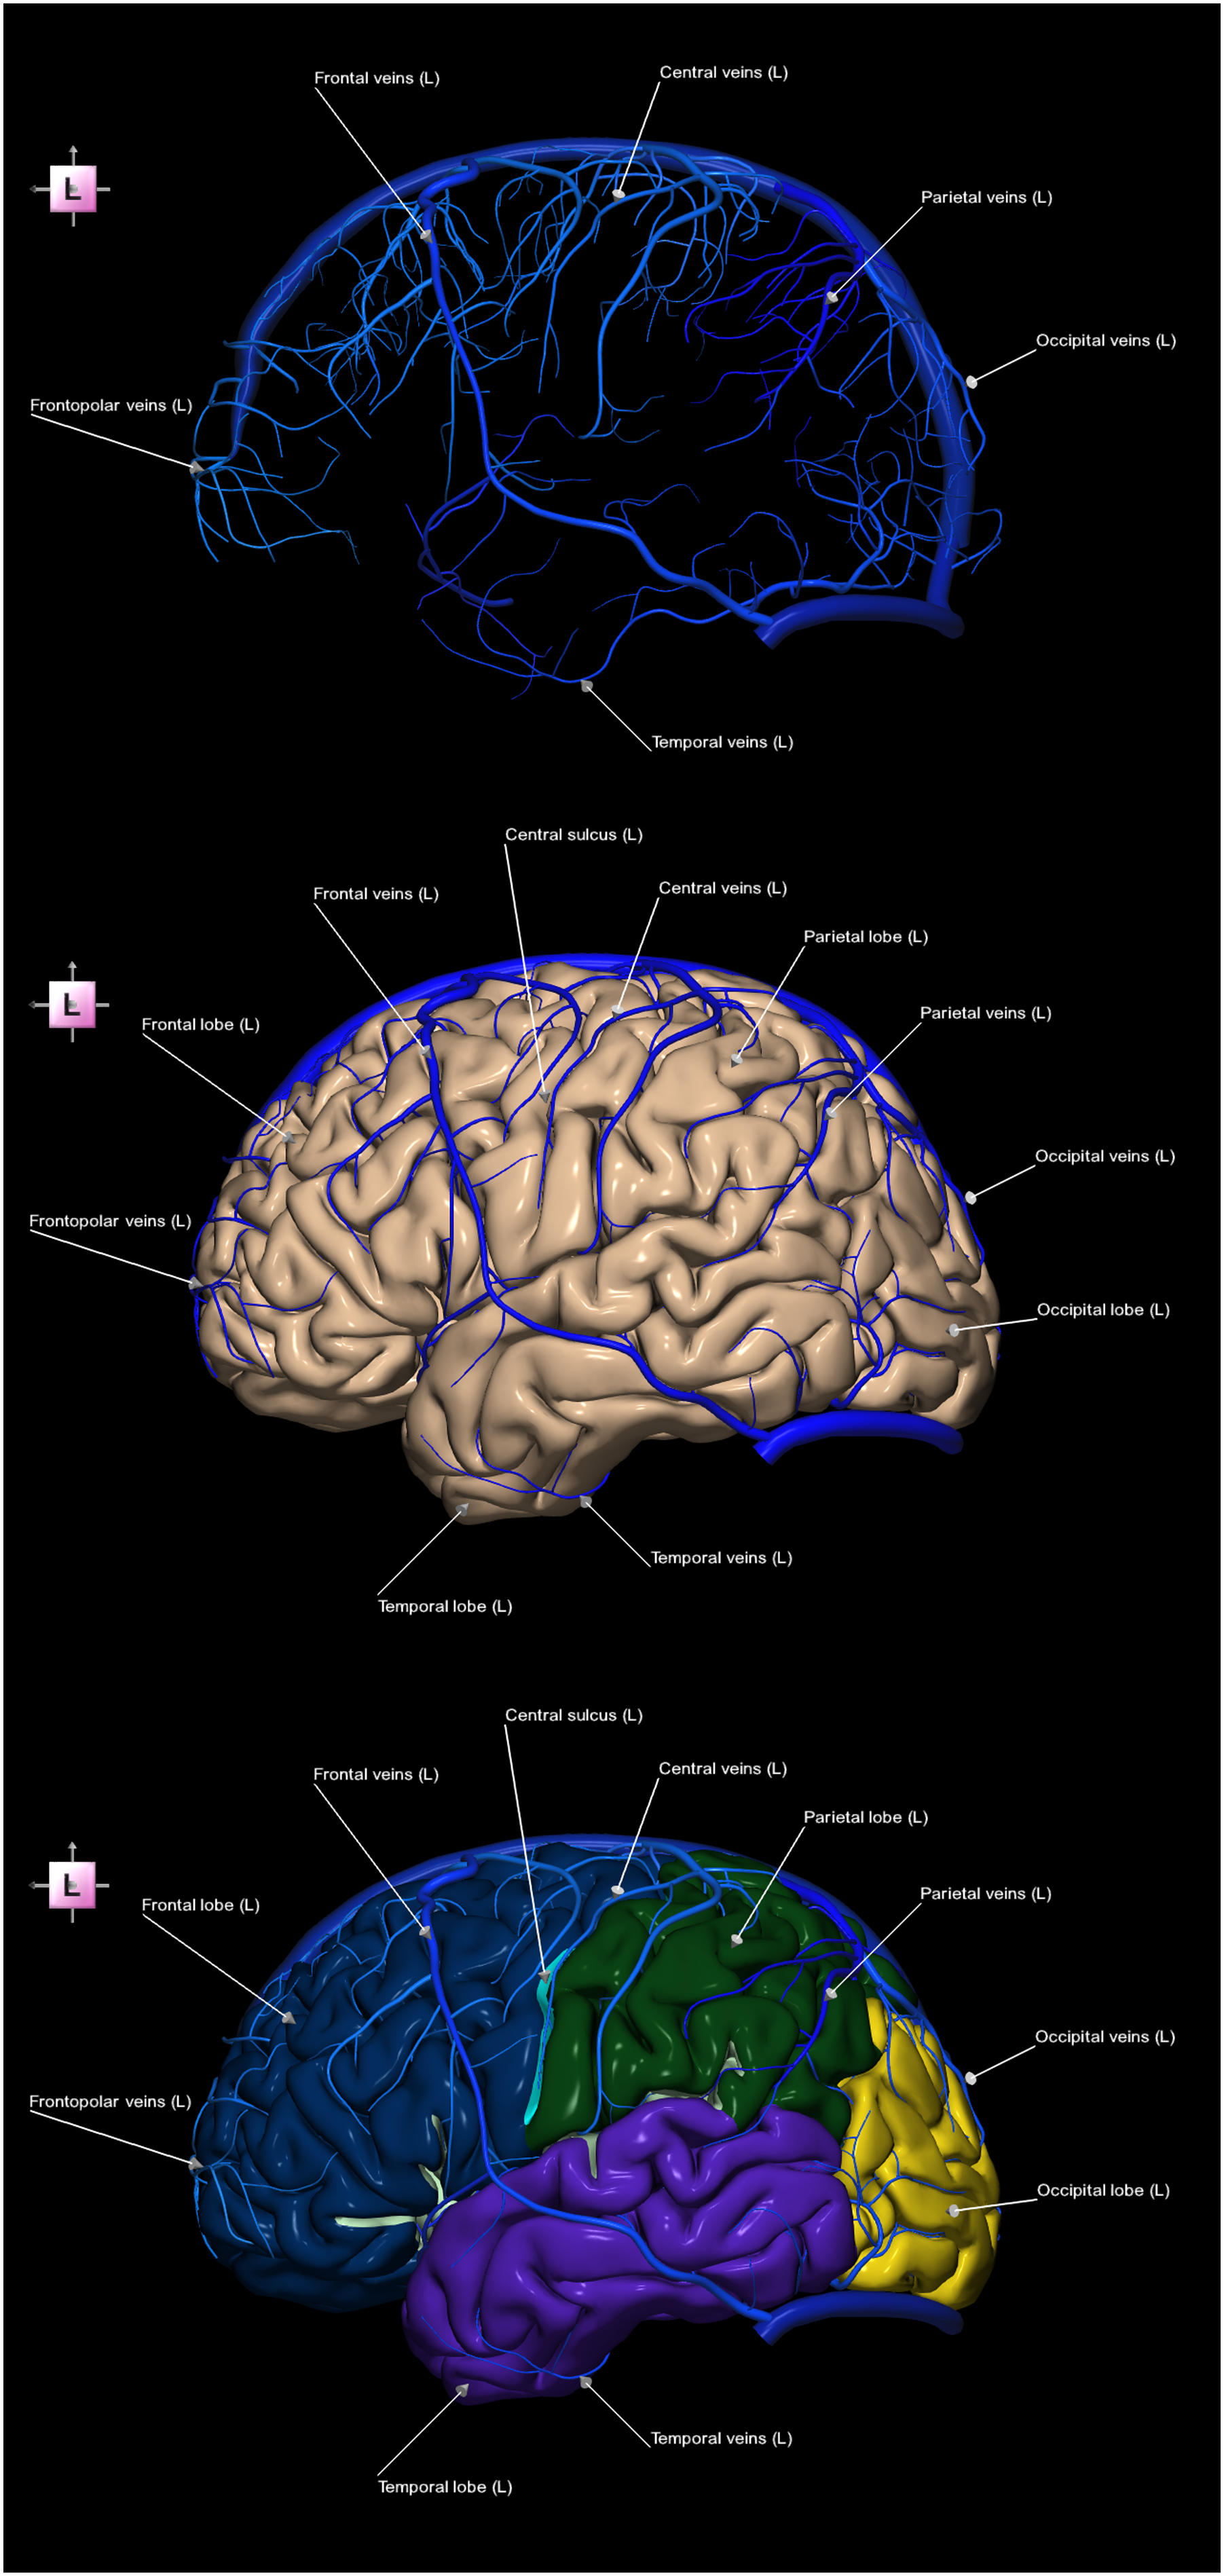
The combination of the two previously described venous image sequences forms a hybrid (appearance-contextual) image sequence, as illustrated in Figure 4. Hybrid appearance-contextual 3-image sequence of the left superficial veins terminating in the dural sinuses together with the left cerebral cortex parcellated into lobes (left lateral view), illustrating that the vein names correspond to the vascular territories they drain (note that this image sequence is a condensed version of the combined image sequences from Figures 2 and 3). Top) non-parcellated and unlabeled veins. Middle) parcellated and labeled veins. Bottom) parcellated and labeled veins and the cerebral cortex (parcellated into lobes).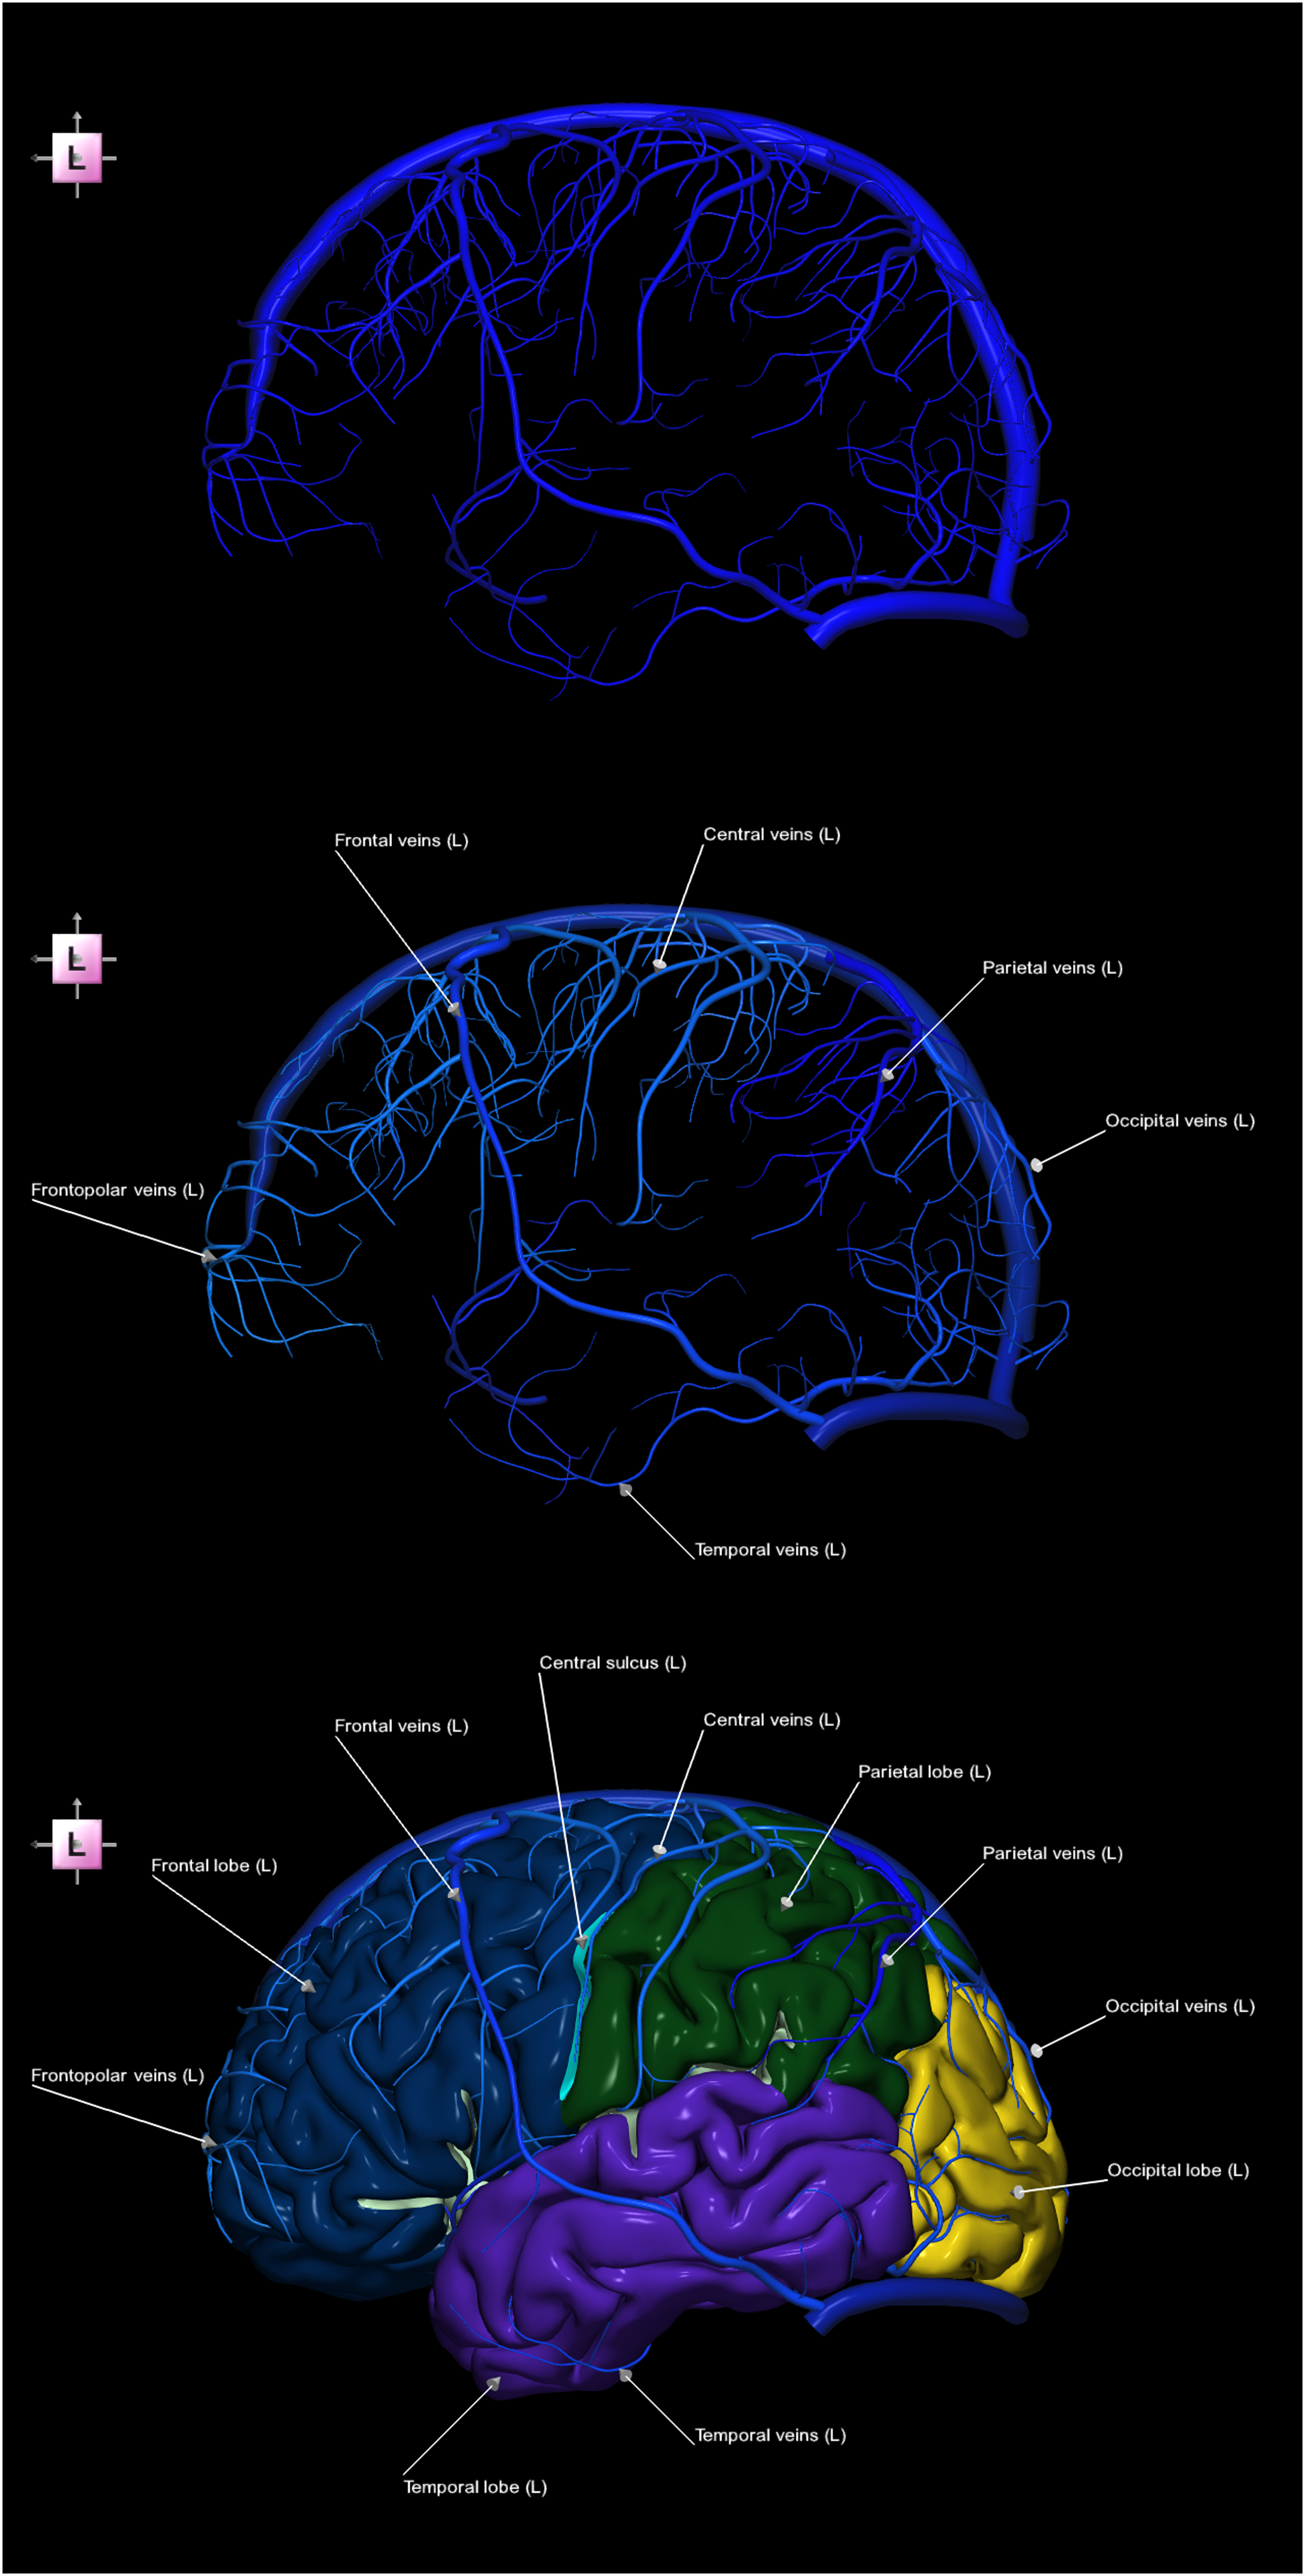
The naming of certain superficial cerebral veins terminating in the deep cerebral veins also follows that of the drained structures, as illustrated in Figure 5. Contextual 2-image sequence of the left superficial cerebral veins terminating in the deep cerebral veins alongside the left cerebral cortex parcellated into both gyri and sulci (right medial latero-basal view), illustrating that the nomenclature of specific superficial cerebral veins corresponds to the cortical structures they drain: Left) parcellated and labeled veins. Right) parcellated and labeled veins with the cortex parcellated and labeled into gyri and sulci.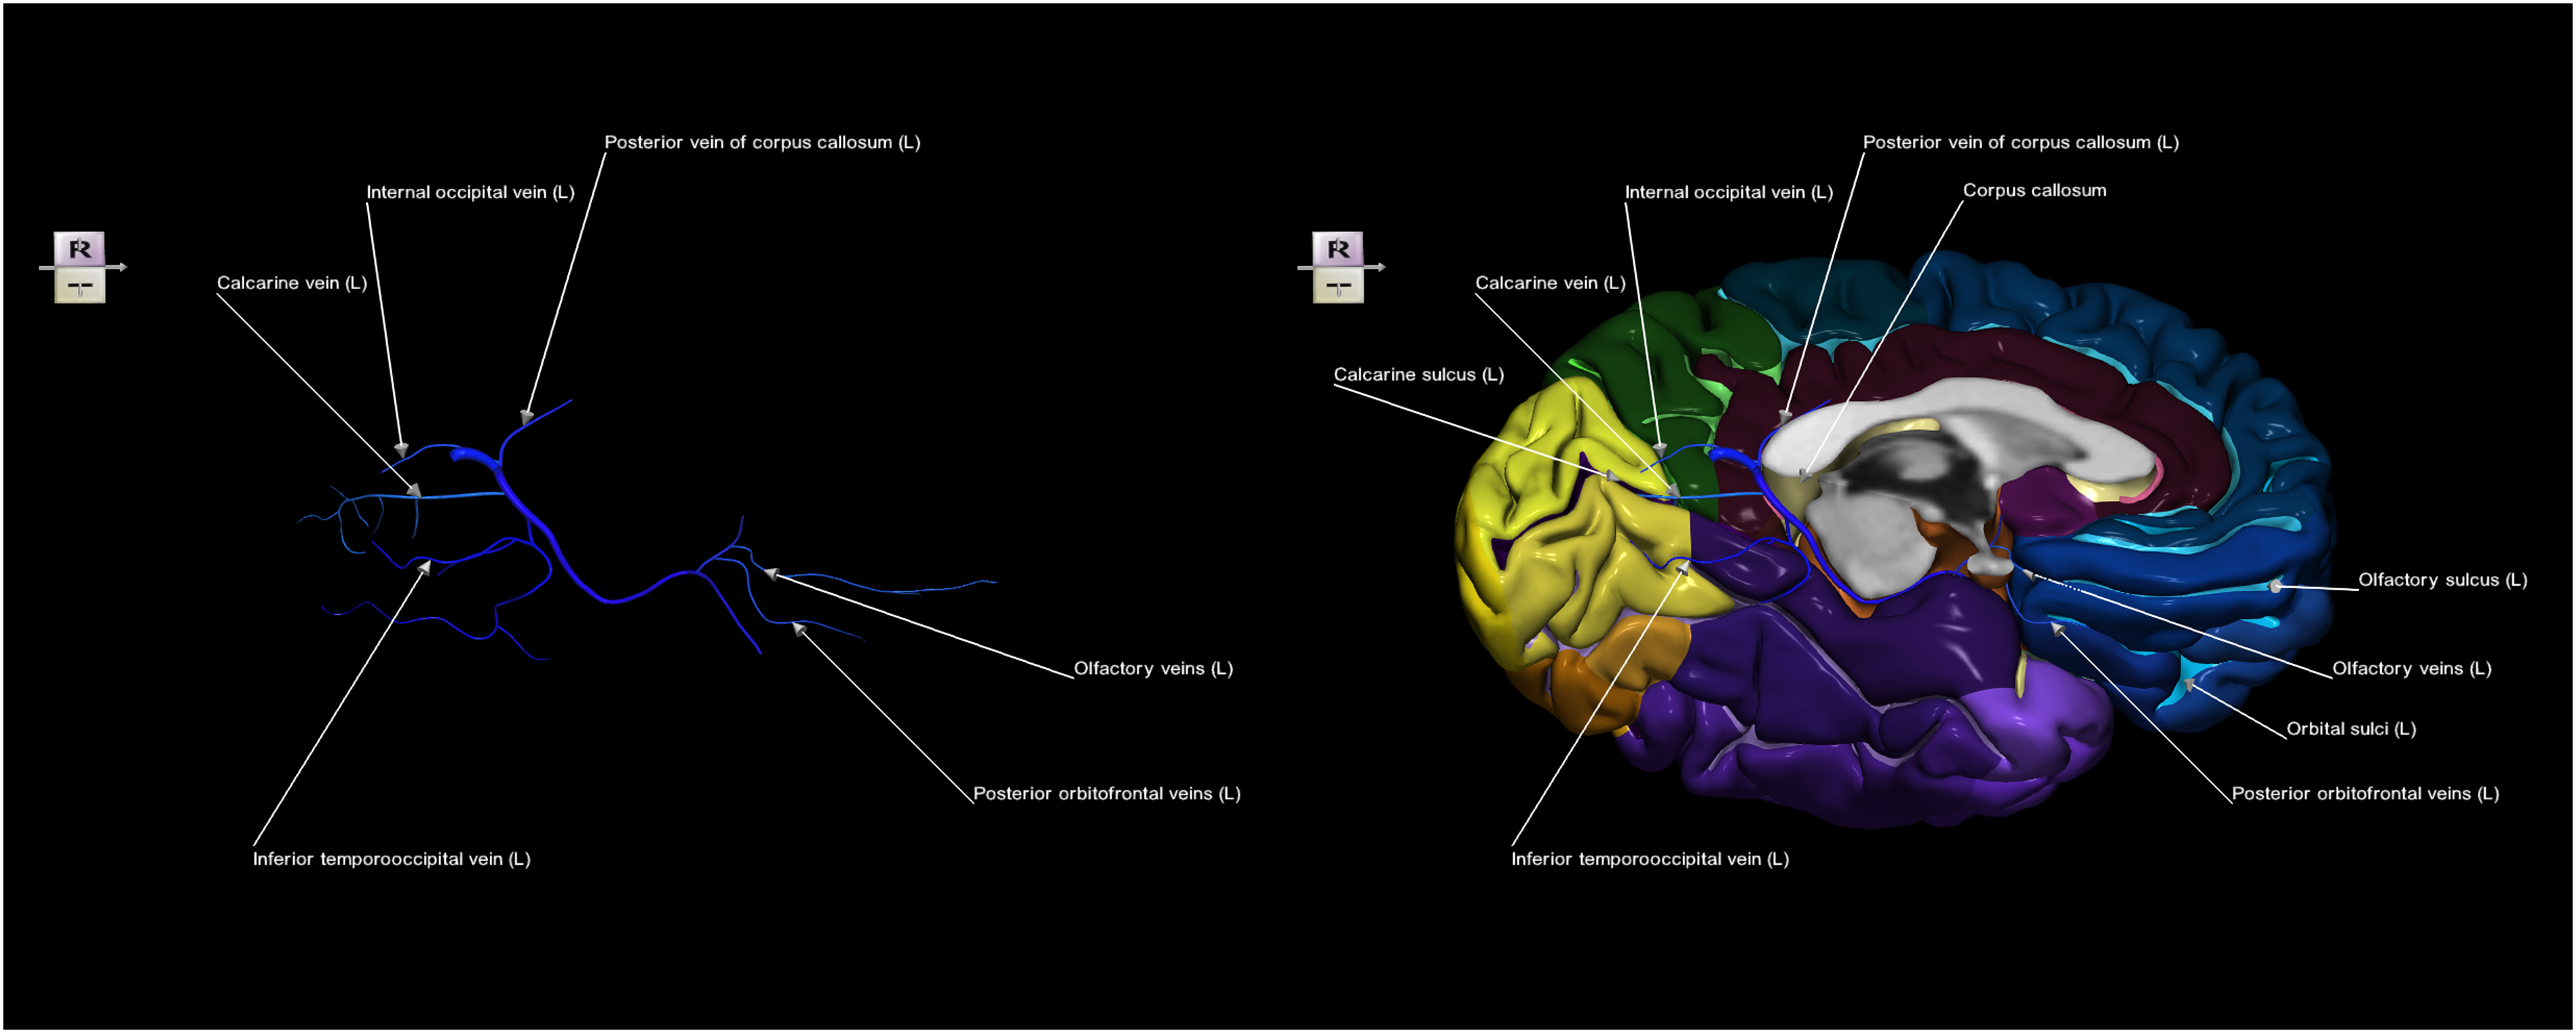
Analogous to the naming of superficial cerebral veins that terminate in the dural sinuses, certain cerebral arteries are also named according to the cortical regions they supply. Namely, Figure 6 presents a hybrid-alternate 6-image sequence demonstrating the left middle cerebral artery (MCA) and the left cerebral cortex, illustrating the naming convention of specific cerebral arteries according to the cortical regions they perfuse, including lobes, poles, gyri, and/or sulci. Hybrid-alternate 6-image sequence of the left middle cerebral artery (MCA) and the left cerebral cortex (left lateral view), demonstrating that the naming of certain cerebral arteries corresponds to the cortical regions they perfuse. Top left) non-parceled and unlabeled MCA. Top right) parcellated and unlabeled MCA. Middle left) parcellated and partially labeled MCA with the names derived from gyri, sulci, and poles. Middle right) parcellated and partially labeled MCA with the cortex parcellated into gyri, sulci, and poles. Bottom left) parcellated and partially labeled MCA with the names derived from lobes. Bottom right) parcellated and partially labeled MCA with the cortex parcellated into lobes. Note that images 1–3 form an appearance sub-sequence, images 3-4 and 5-6 form contextual sub-sequences, and the image pairs 3-4 and 5-6 represent alternate sub-sequences.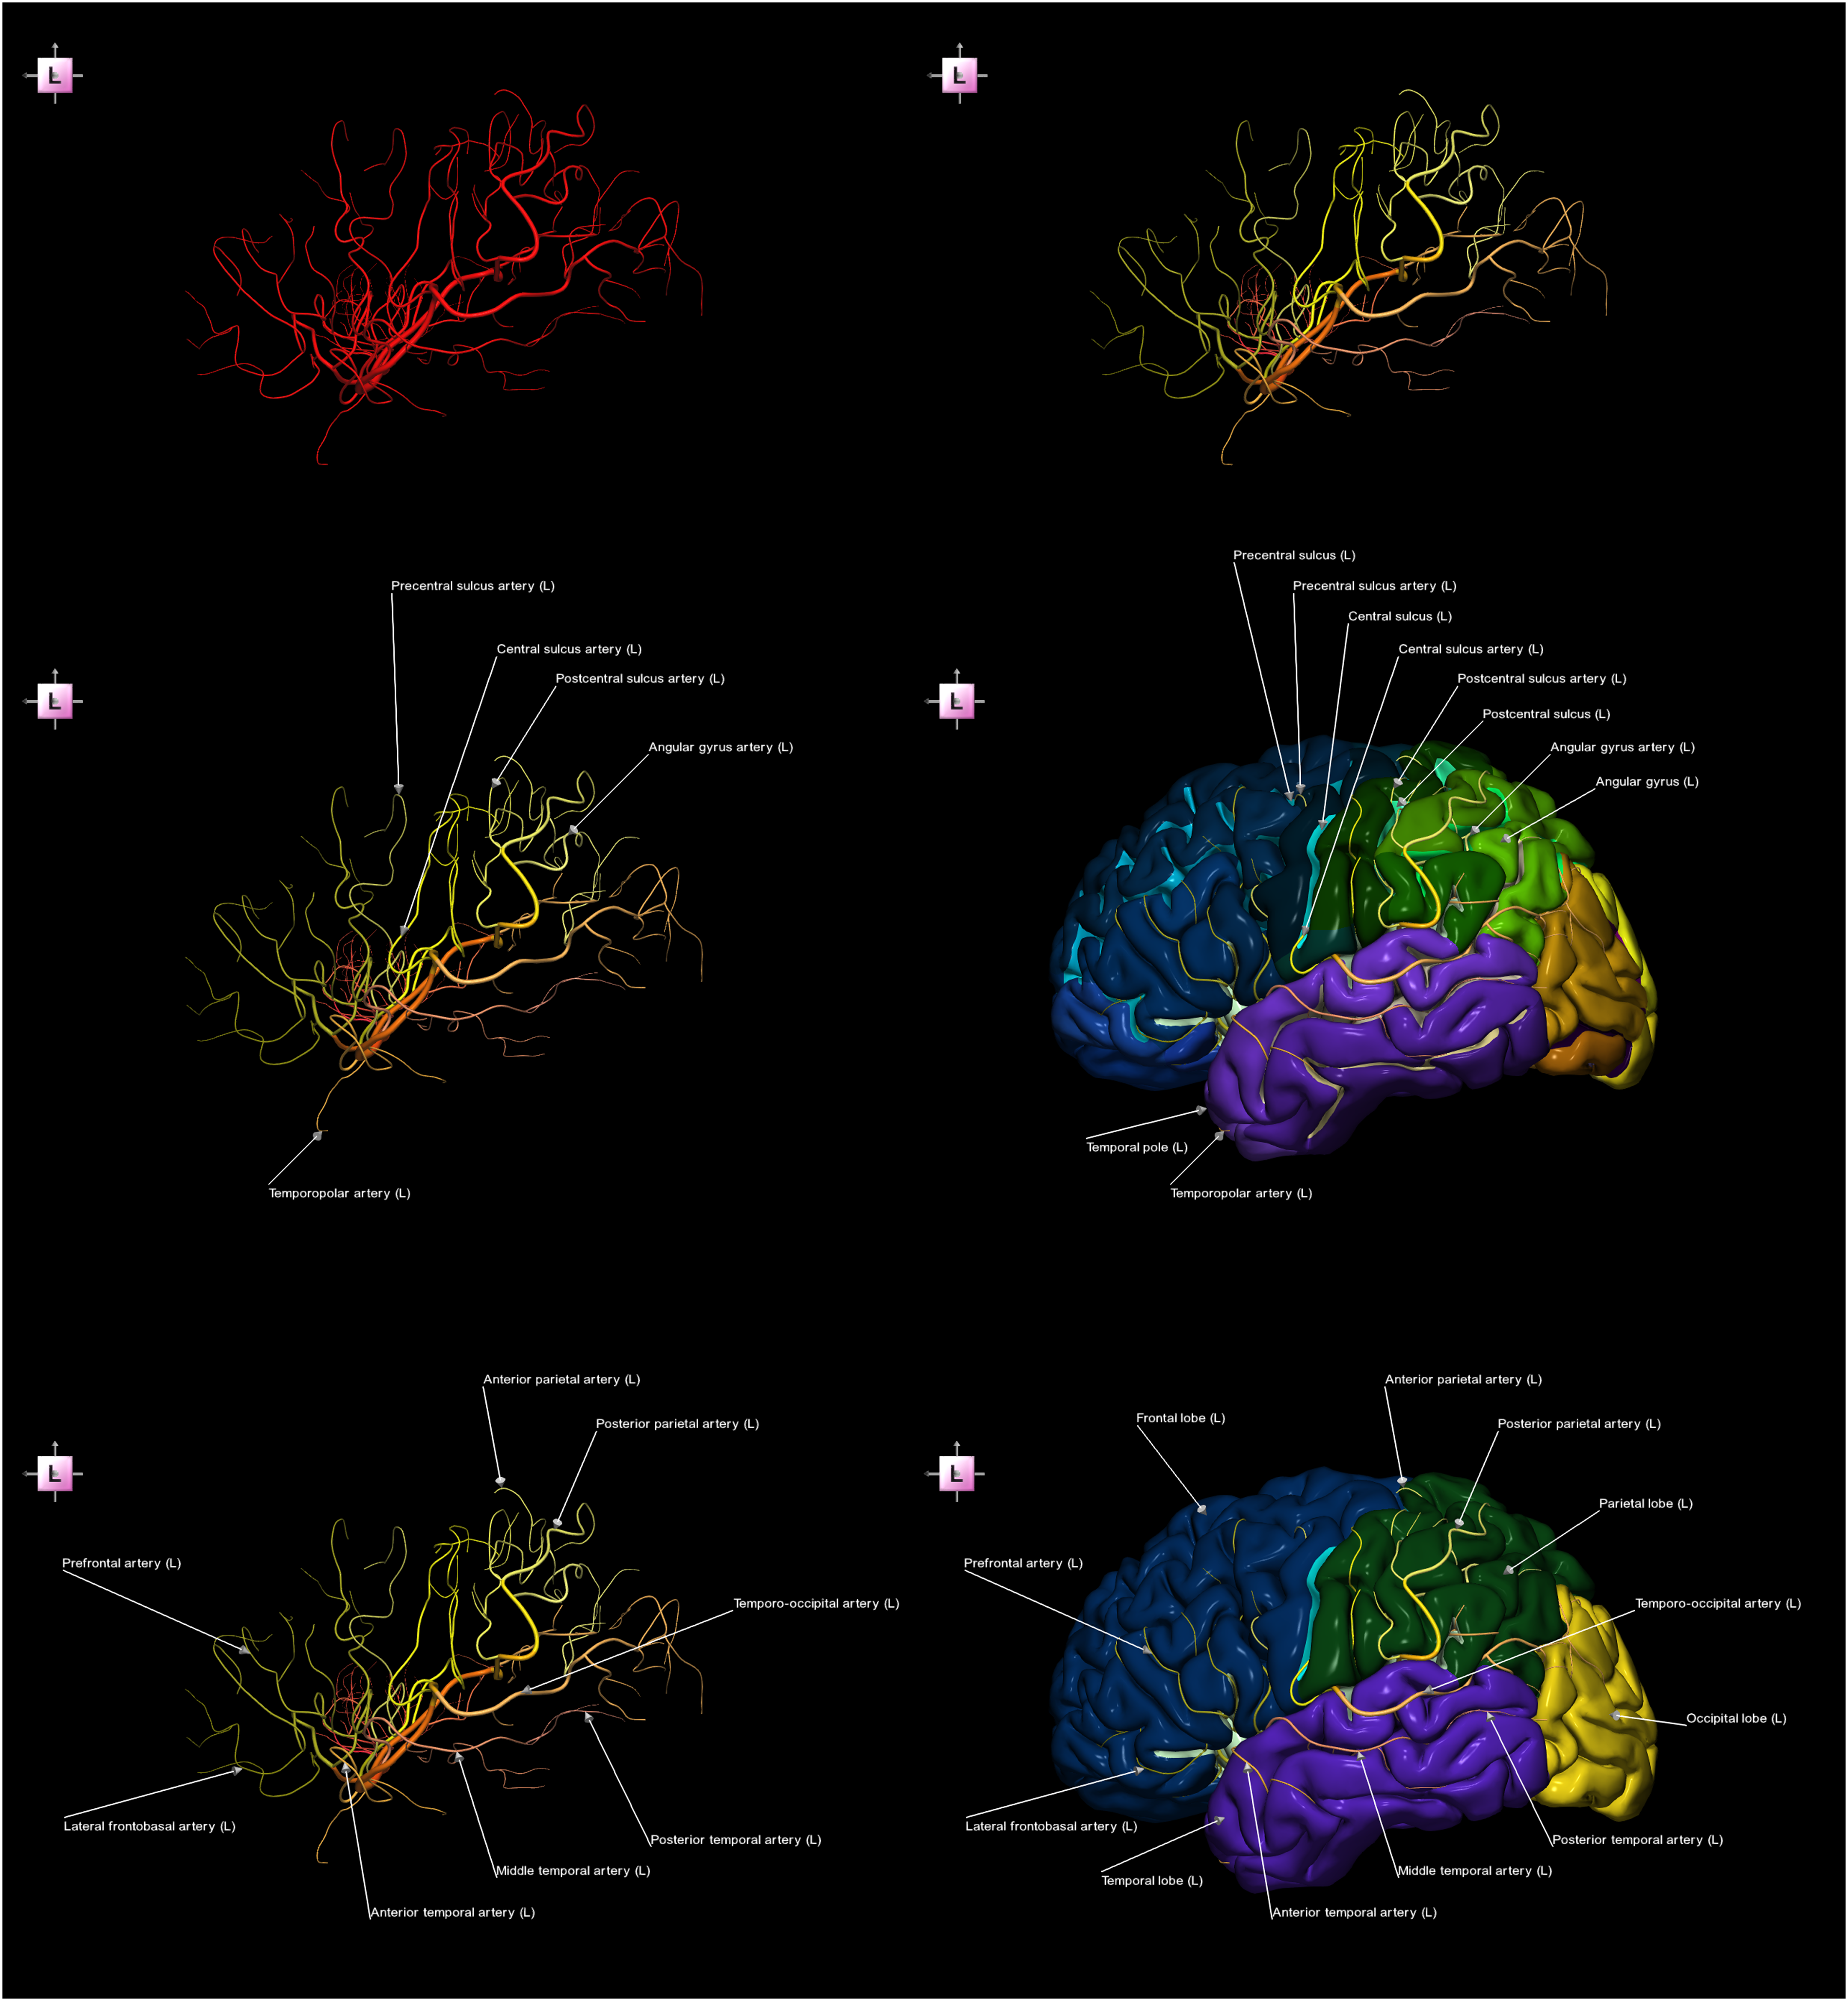
Another example of the cortical-vascular naming relationship is shown in Figure 7, featuring an alternate contextual 4-image sequence of the right anterior cerebral artery (ACA) and the right cerebral cortex. Alternate contextual 4-image sequence of the right anterior cerebral artery (ACA) and the right cerebral cortex (left medial view), demonstrating that cerebral arteries are named according to the structures and cortical regions (top) and the lobes (bottom) they supply. Top left) parcellated and partially labeled ACA with the names derived from cortical regions and structures. Top right) parcellated and partially labeled ACA with the cortex parcellated into gyri, sulci, and lobules and labeled. Bottom left) parcellated and partially labeled ACA with the names derived from lobes. Bottom right) parcellated and partially labeled ACA, with the cortex parcellated into lobes and labeled.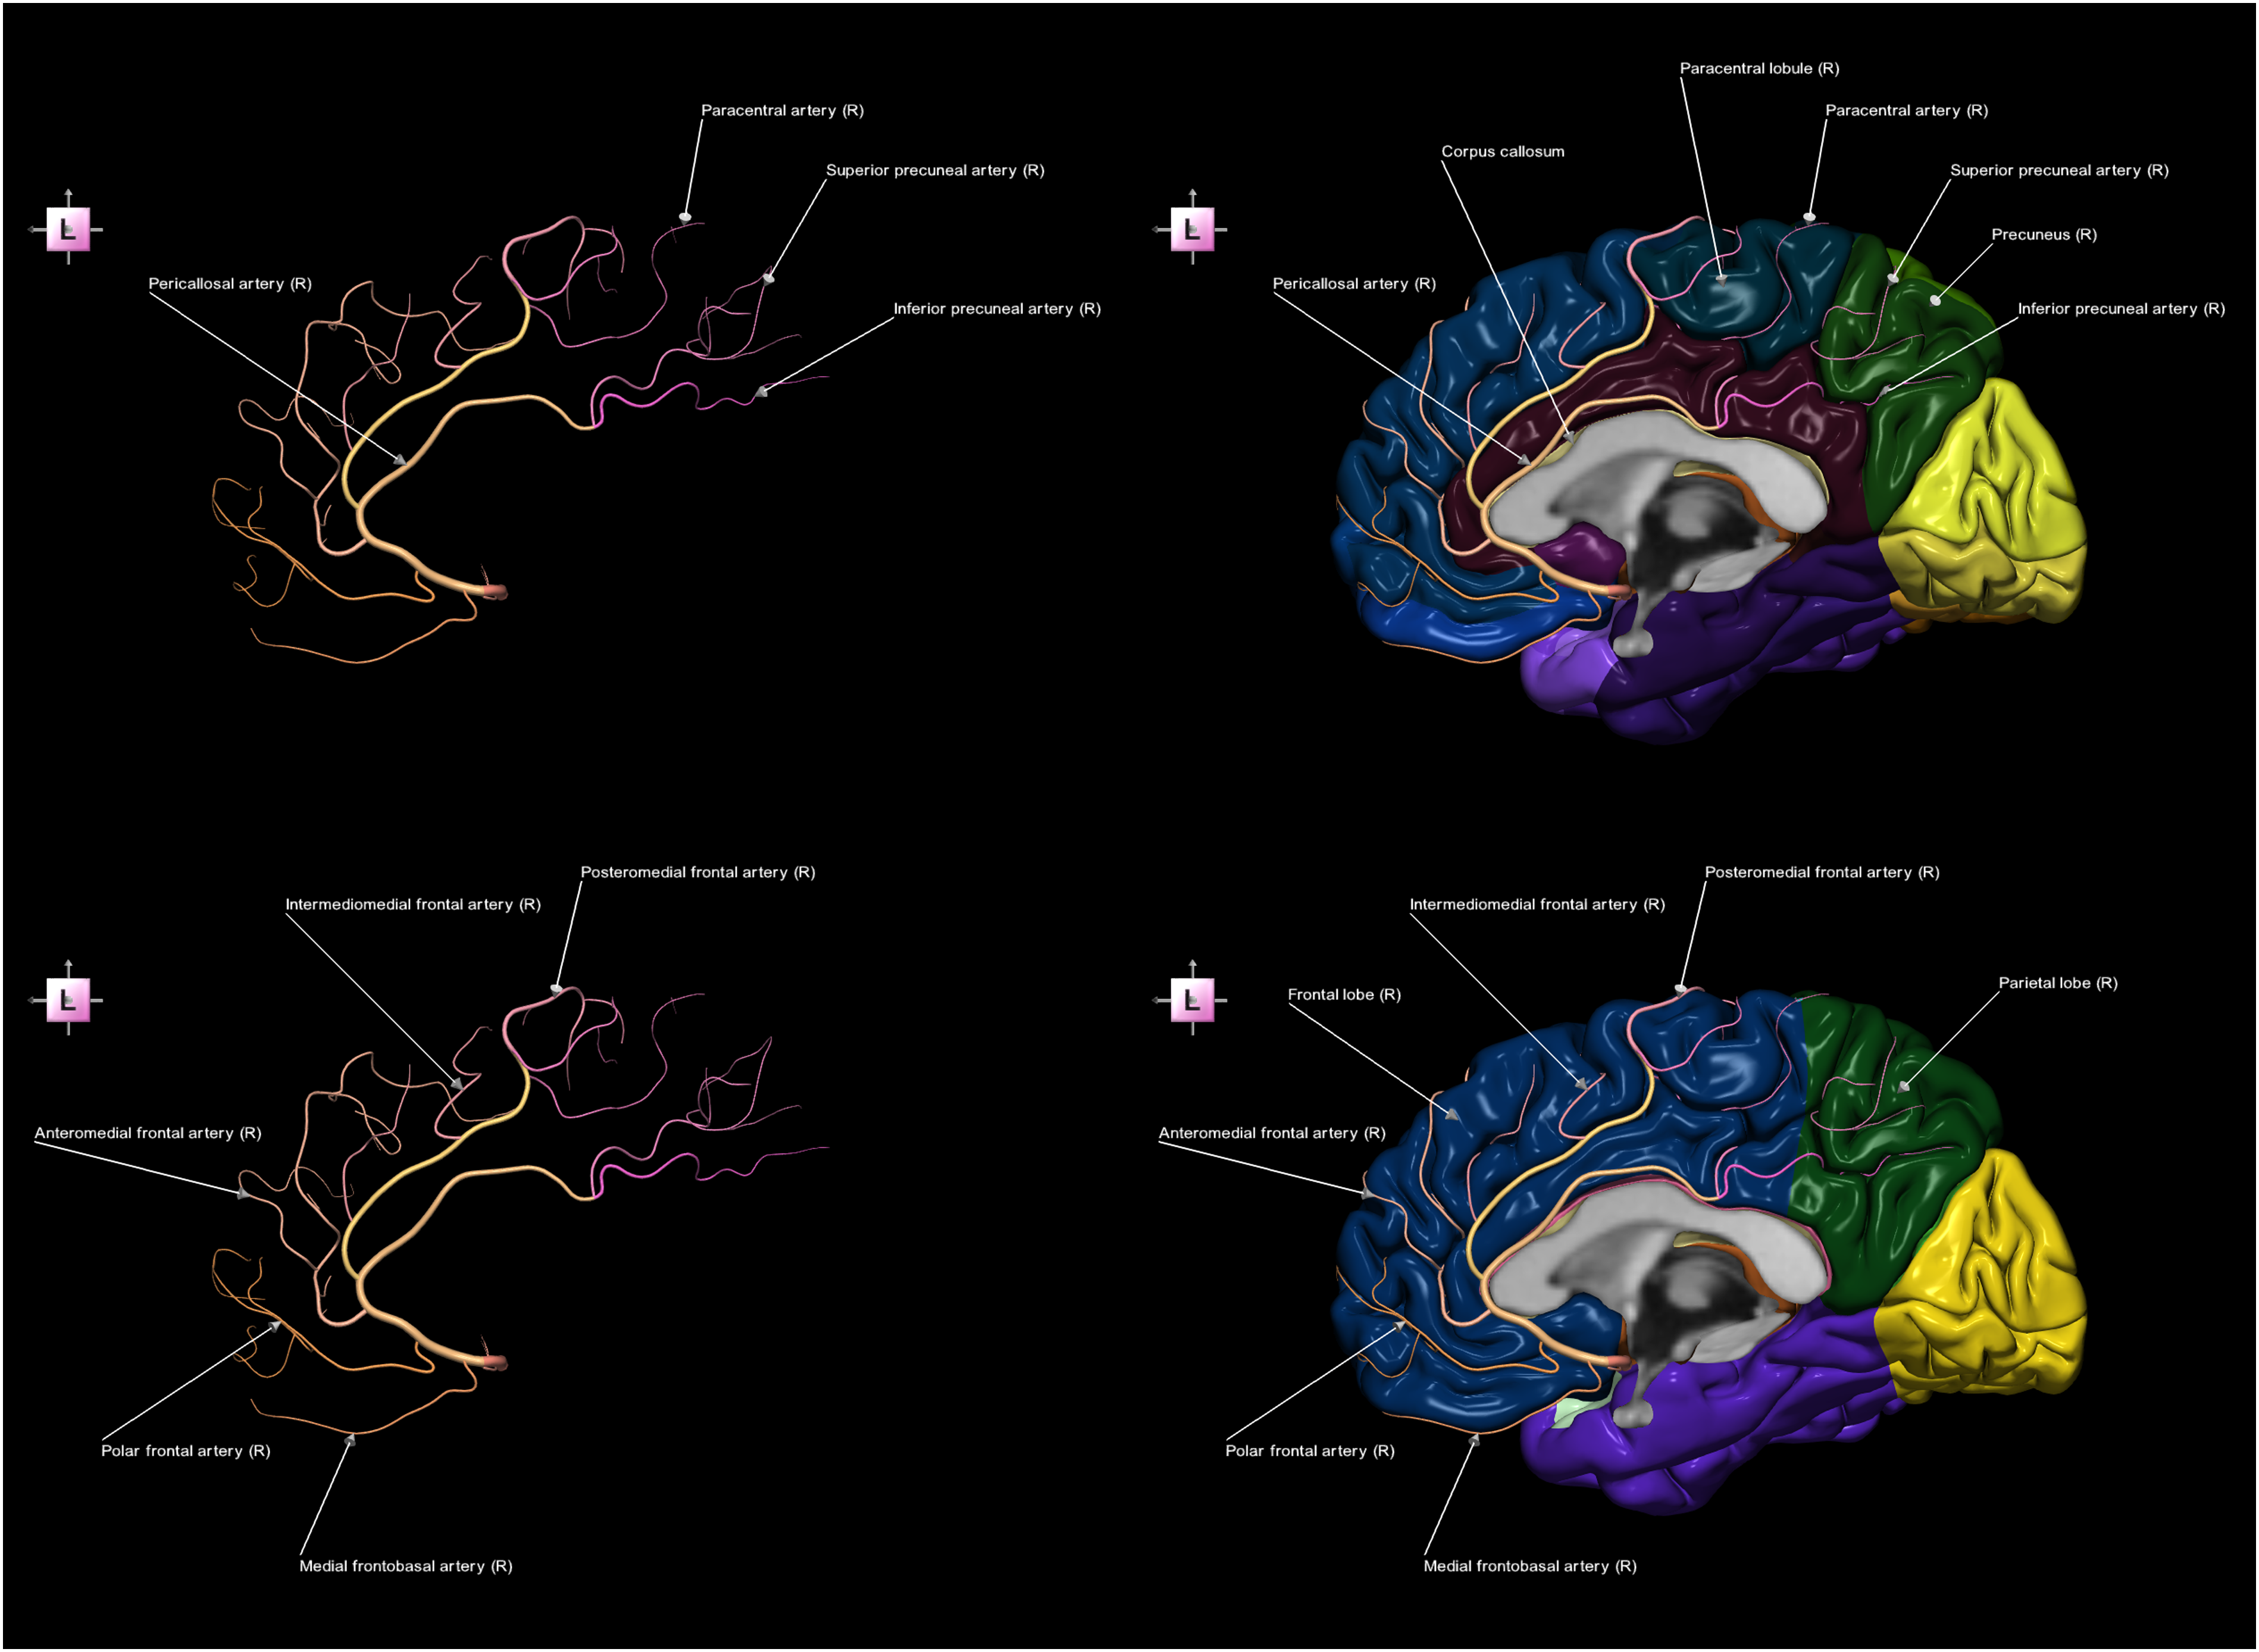
Figure 8 illustrates a dissection 6-image sequence exposing the left central sulcus artery, otherwise hidden deep in the central sulcus, through sagittal dissection of the left cerebral hemisphere. Dissection 6-image sequence of the left cerebral hemisphere exposing the left central sulcus artery, otherwise hidden deep in the central sulcus (left lateral view). The dissected images are spaced 5 mm (the last 3 mm) apart.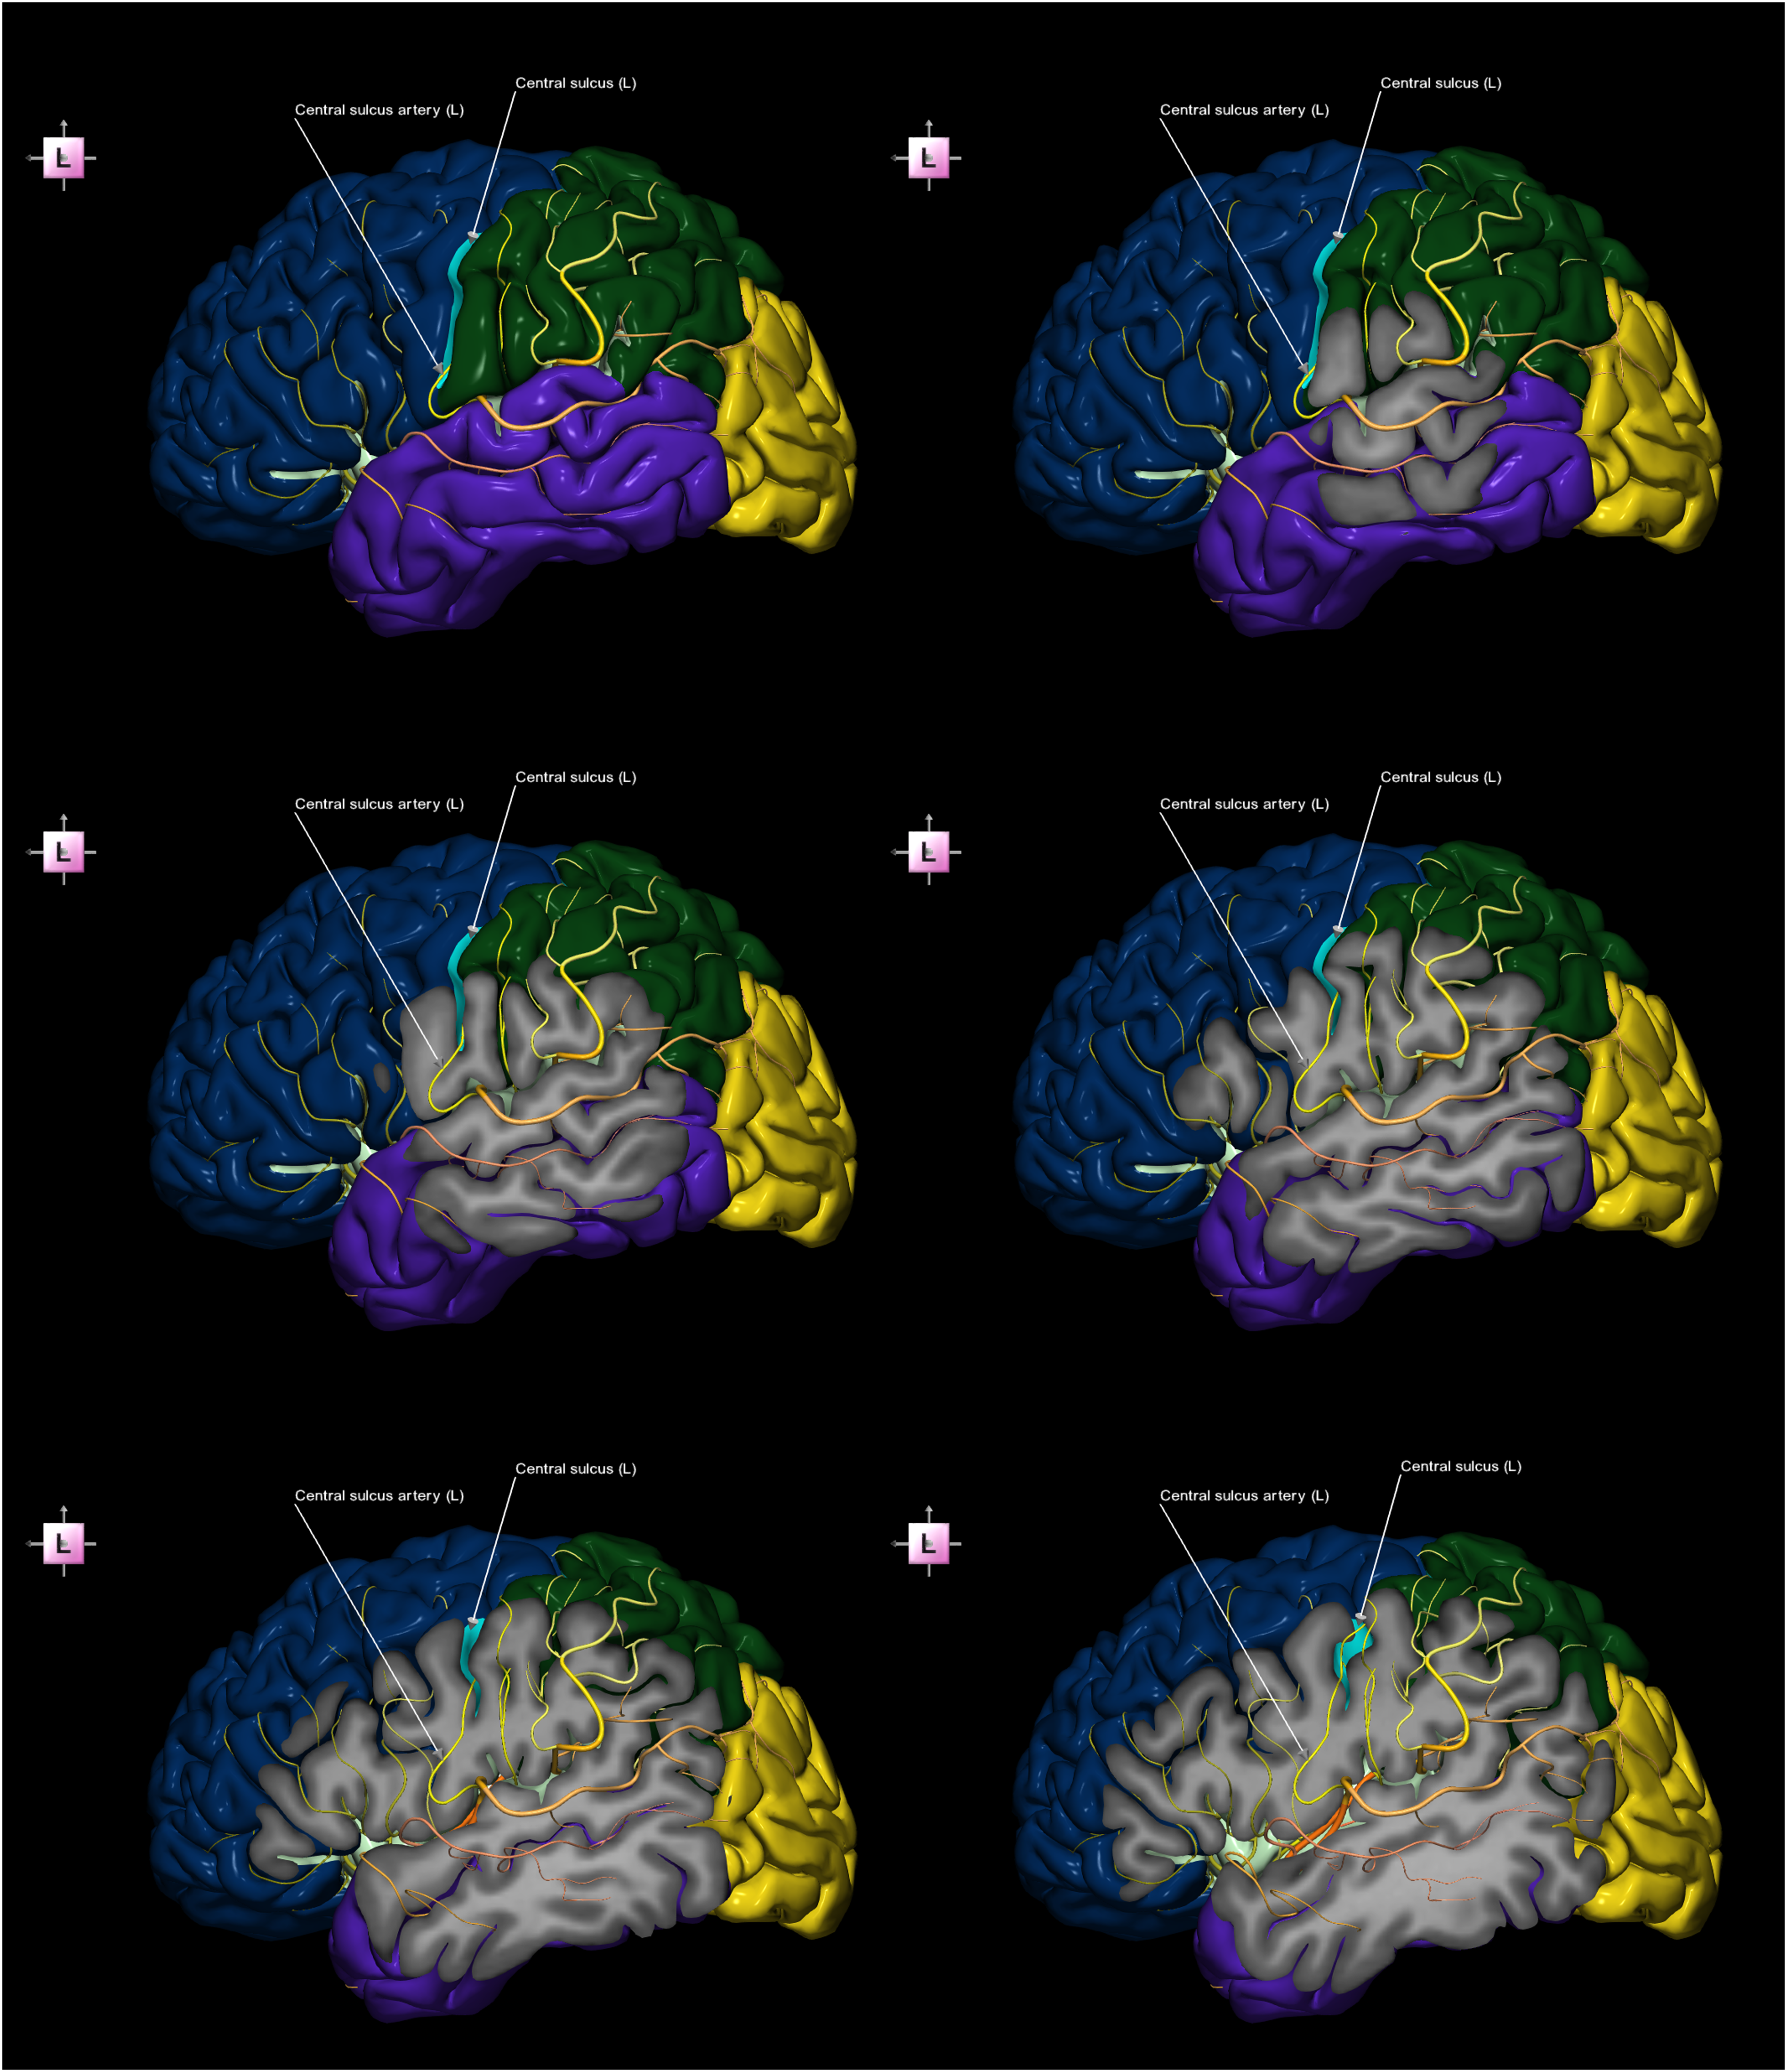
Figure 9 shows a composite context-special image sequence with the open (removed) postcentral gyrus exposing the posterior sulcus artery with its branches. Composite context-special 3-image sequence with cortical opening demonstrating the right cerebral hemisphere with the right postcentral gyrus opened to expose the right postcentral sulcus artery including its branches (fronto-supero-right view).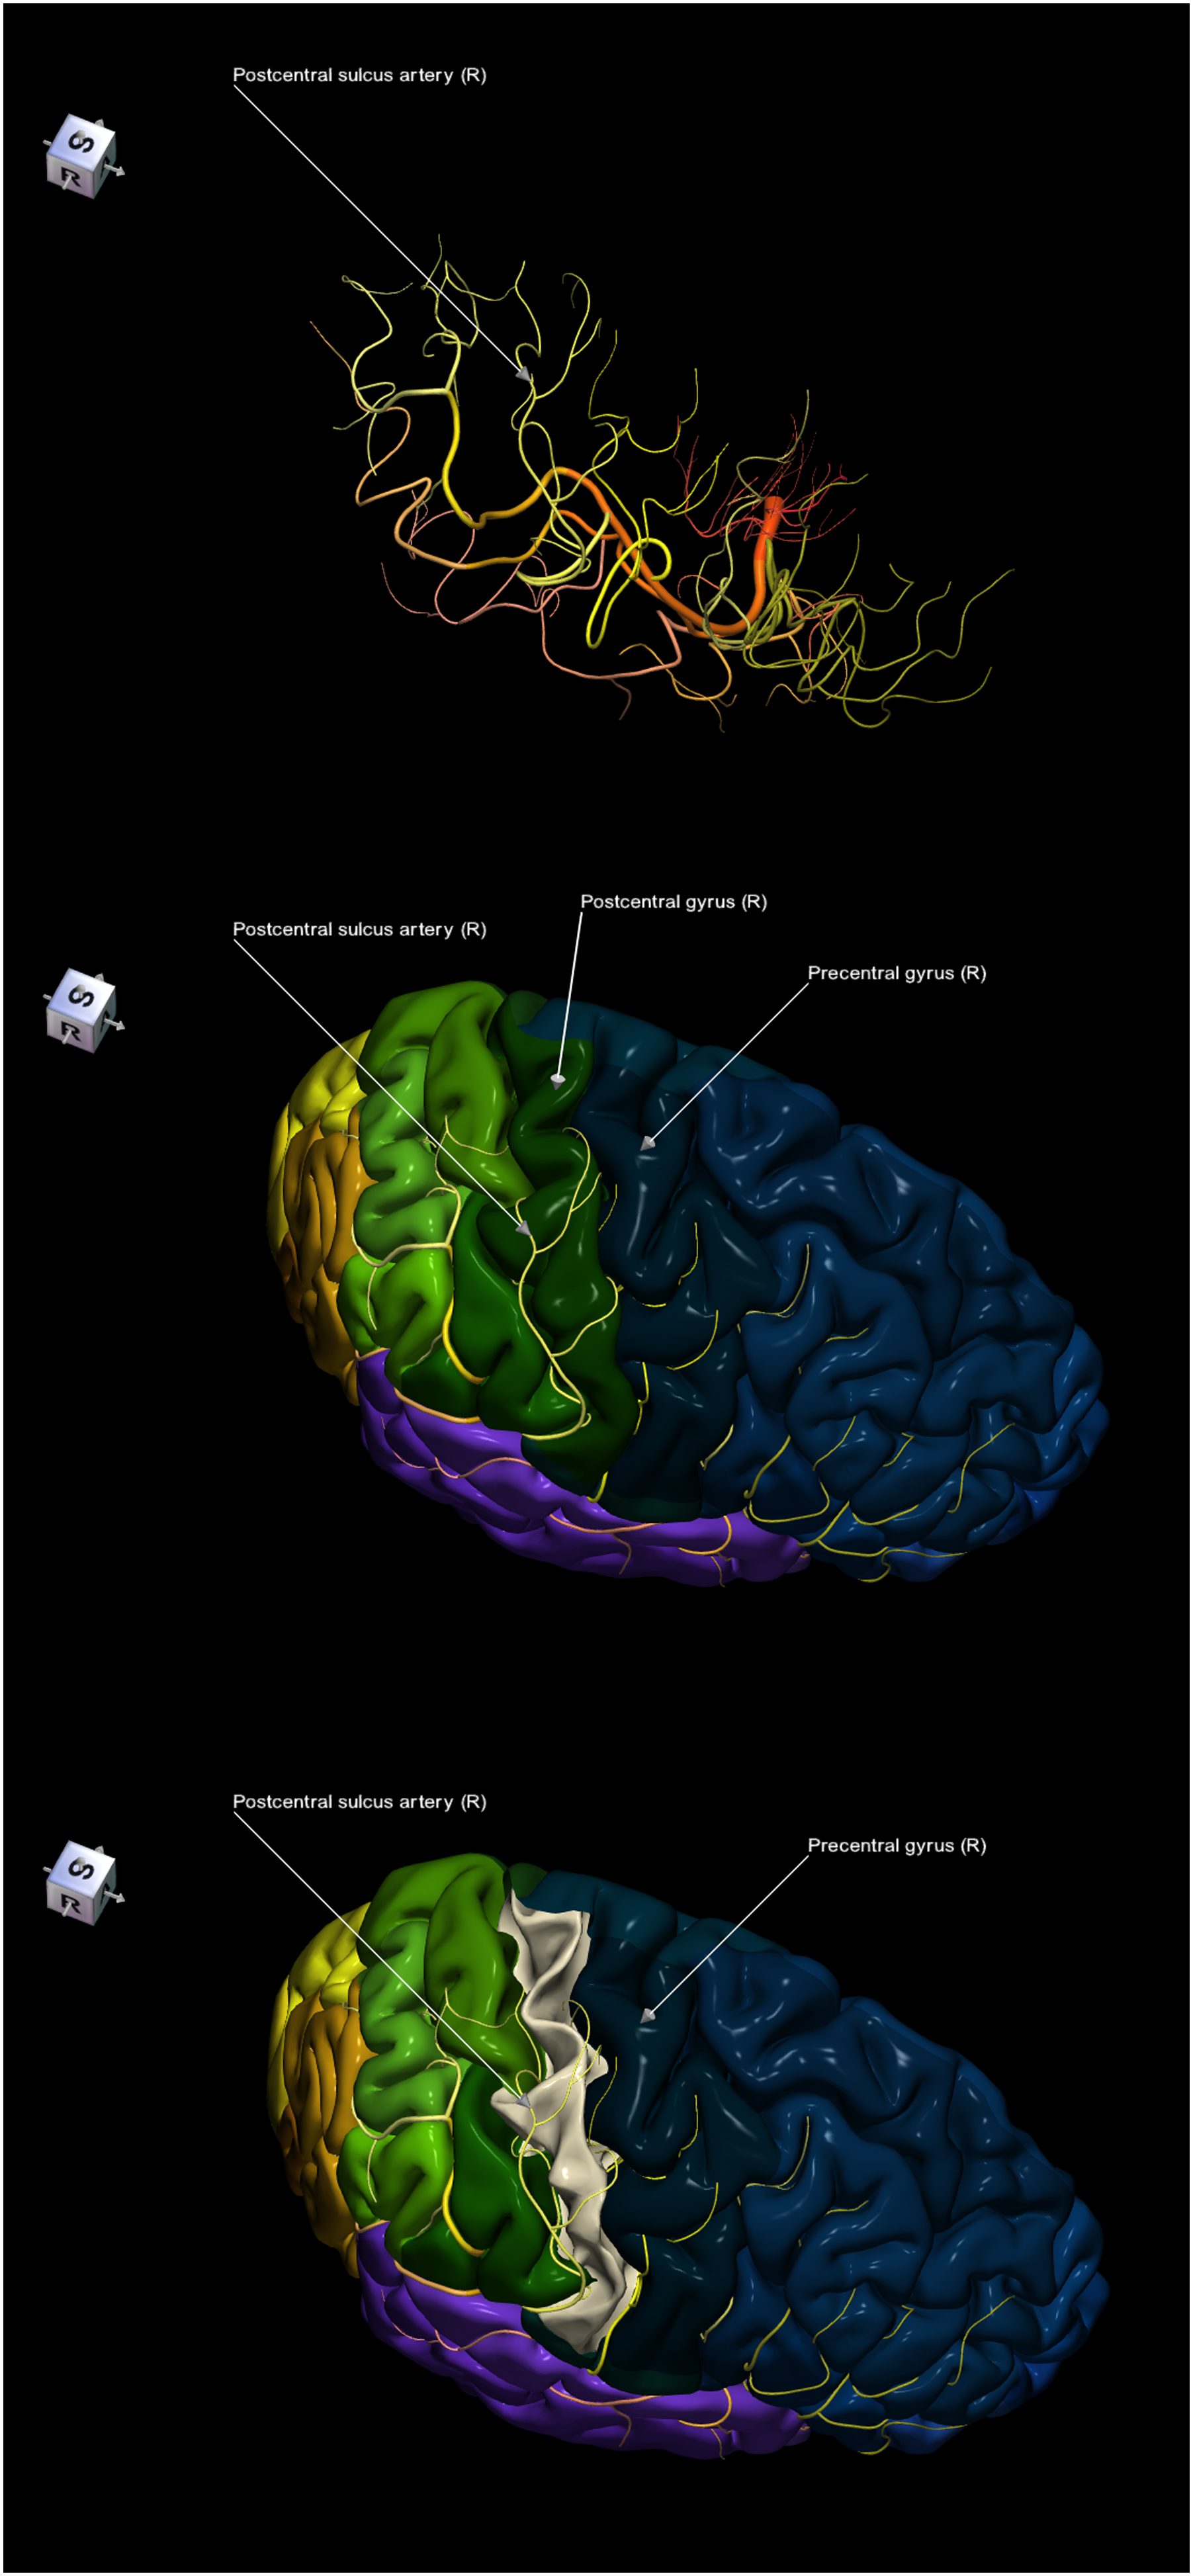
Figure 10 illustrates an example of a 2D-2D/3D image sequence depicting the caudate nucleus. 2D-2D/3D 2-image sequence demonstrating the caudate nucleus (anterior view). Left) 2D coronal image labeled. Right) 2D-2D/3D image labeled.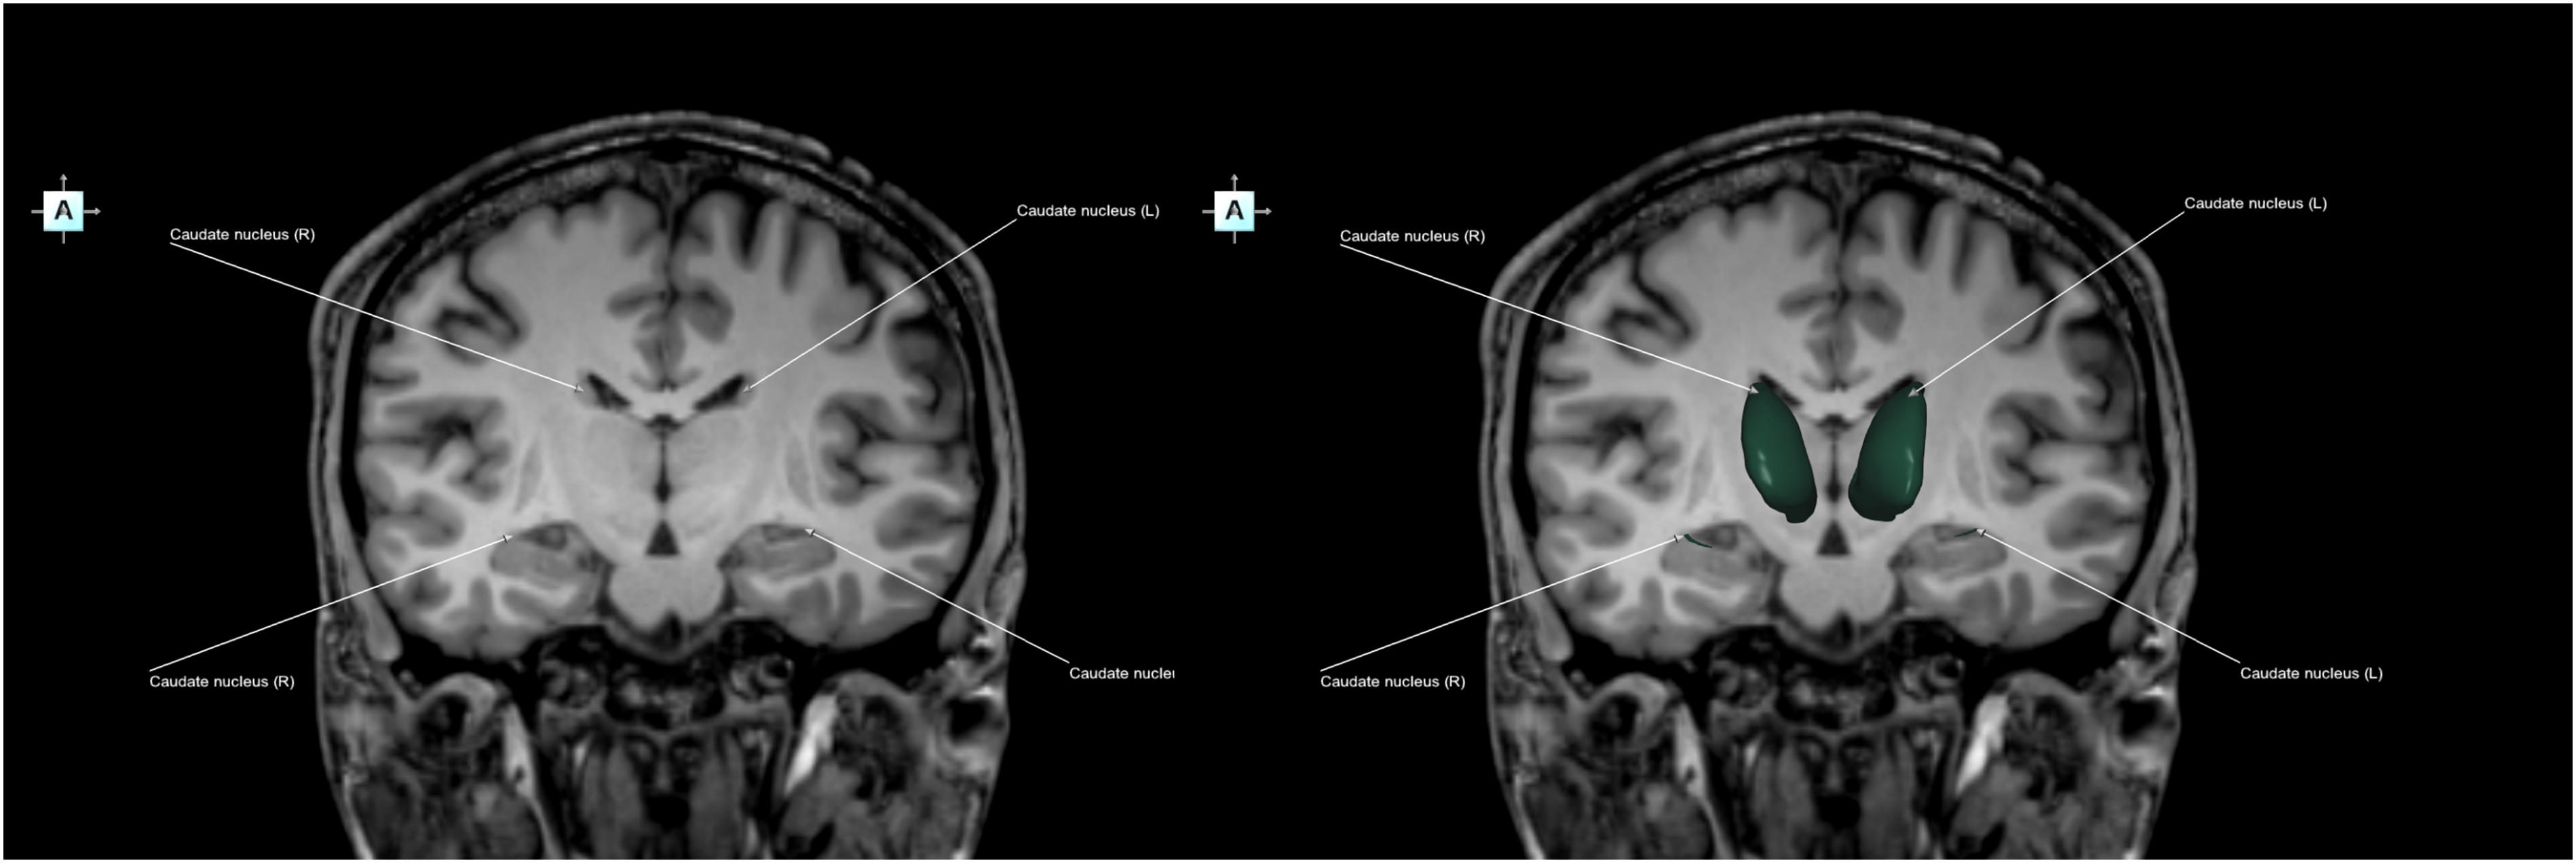
Figure 11 shows a composite multi-view hybrid 9-image sequence presenting the deep cerebral veins and the ventricular system, demonstrating that the majority of this complicated vascular network closely follows the walls of the ventricles. Composite multi-view hybrid image sequence presenting the deep cerebral veins in the context of the ventricular system, demonstrating that the majority of this complicated vascular network closely follows the walls of the ventricles. Non-parcellated and unlabeled veins (left column), parcellated and labeled veins (middle column), and parcellated and labeled veins with the lateral and third ventricles labeled (right column). Top row) anterior view. Middle row) left view. Bottom row) inferior view.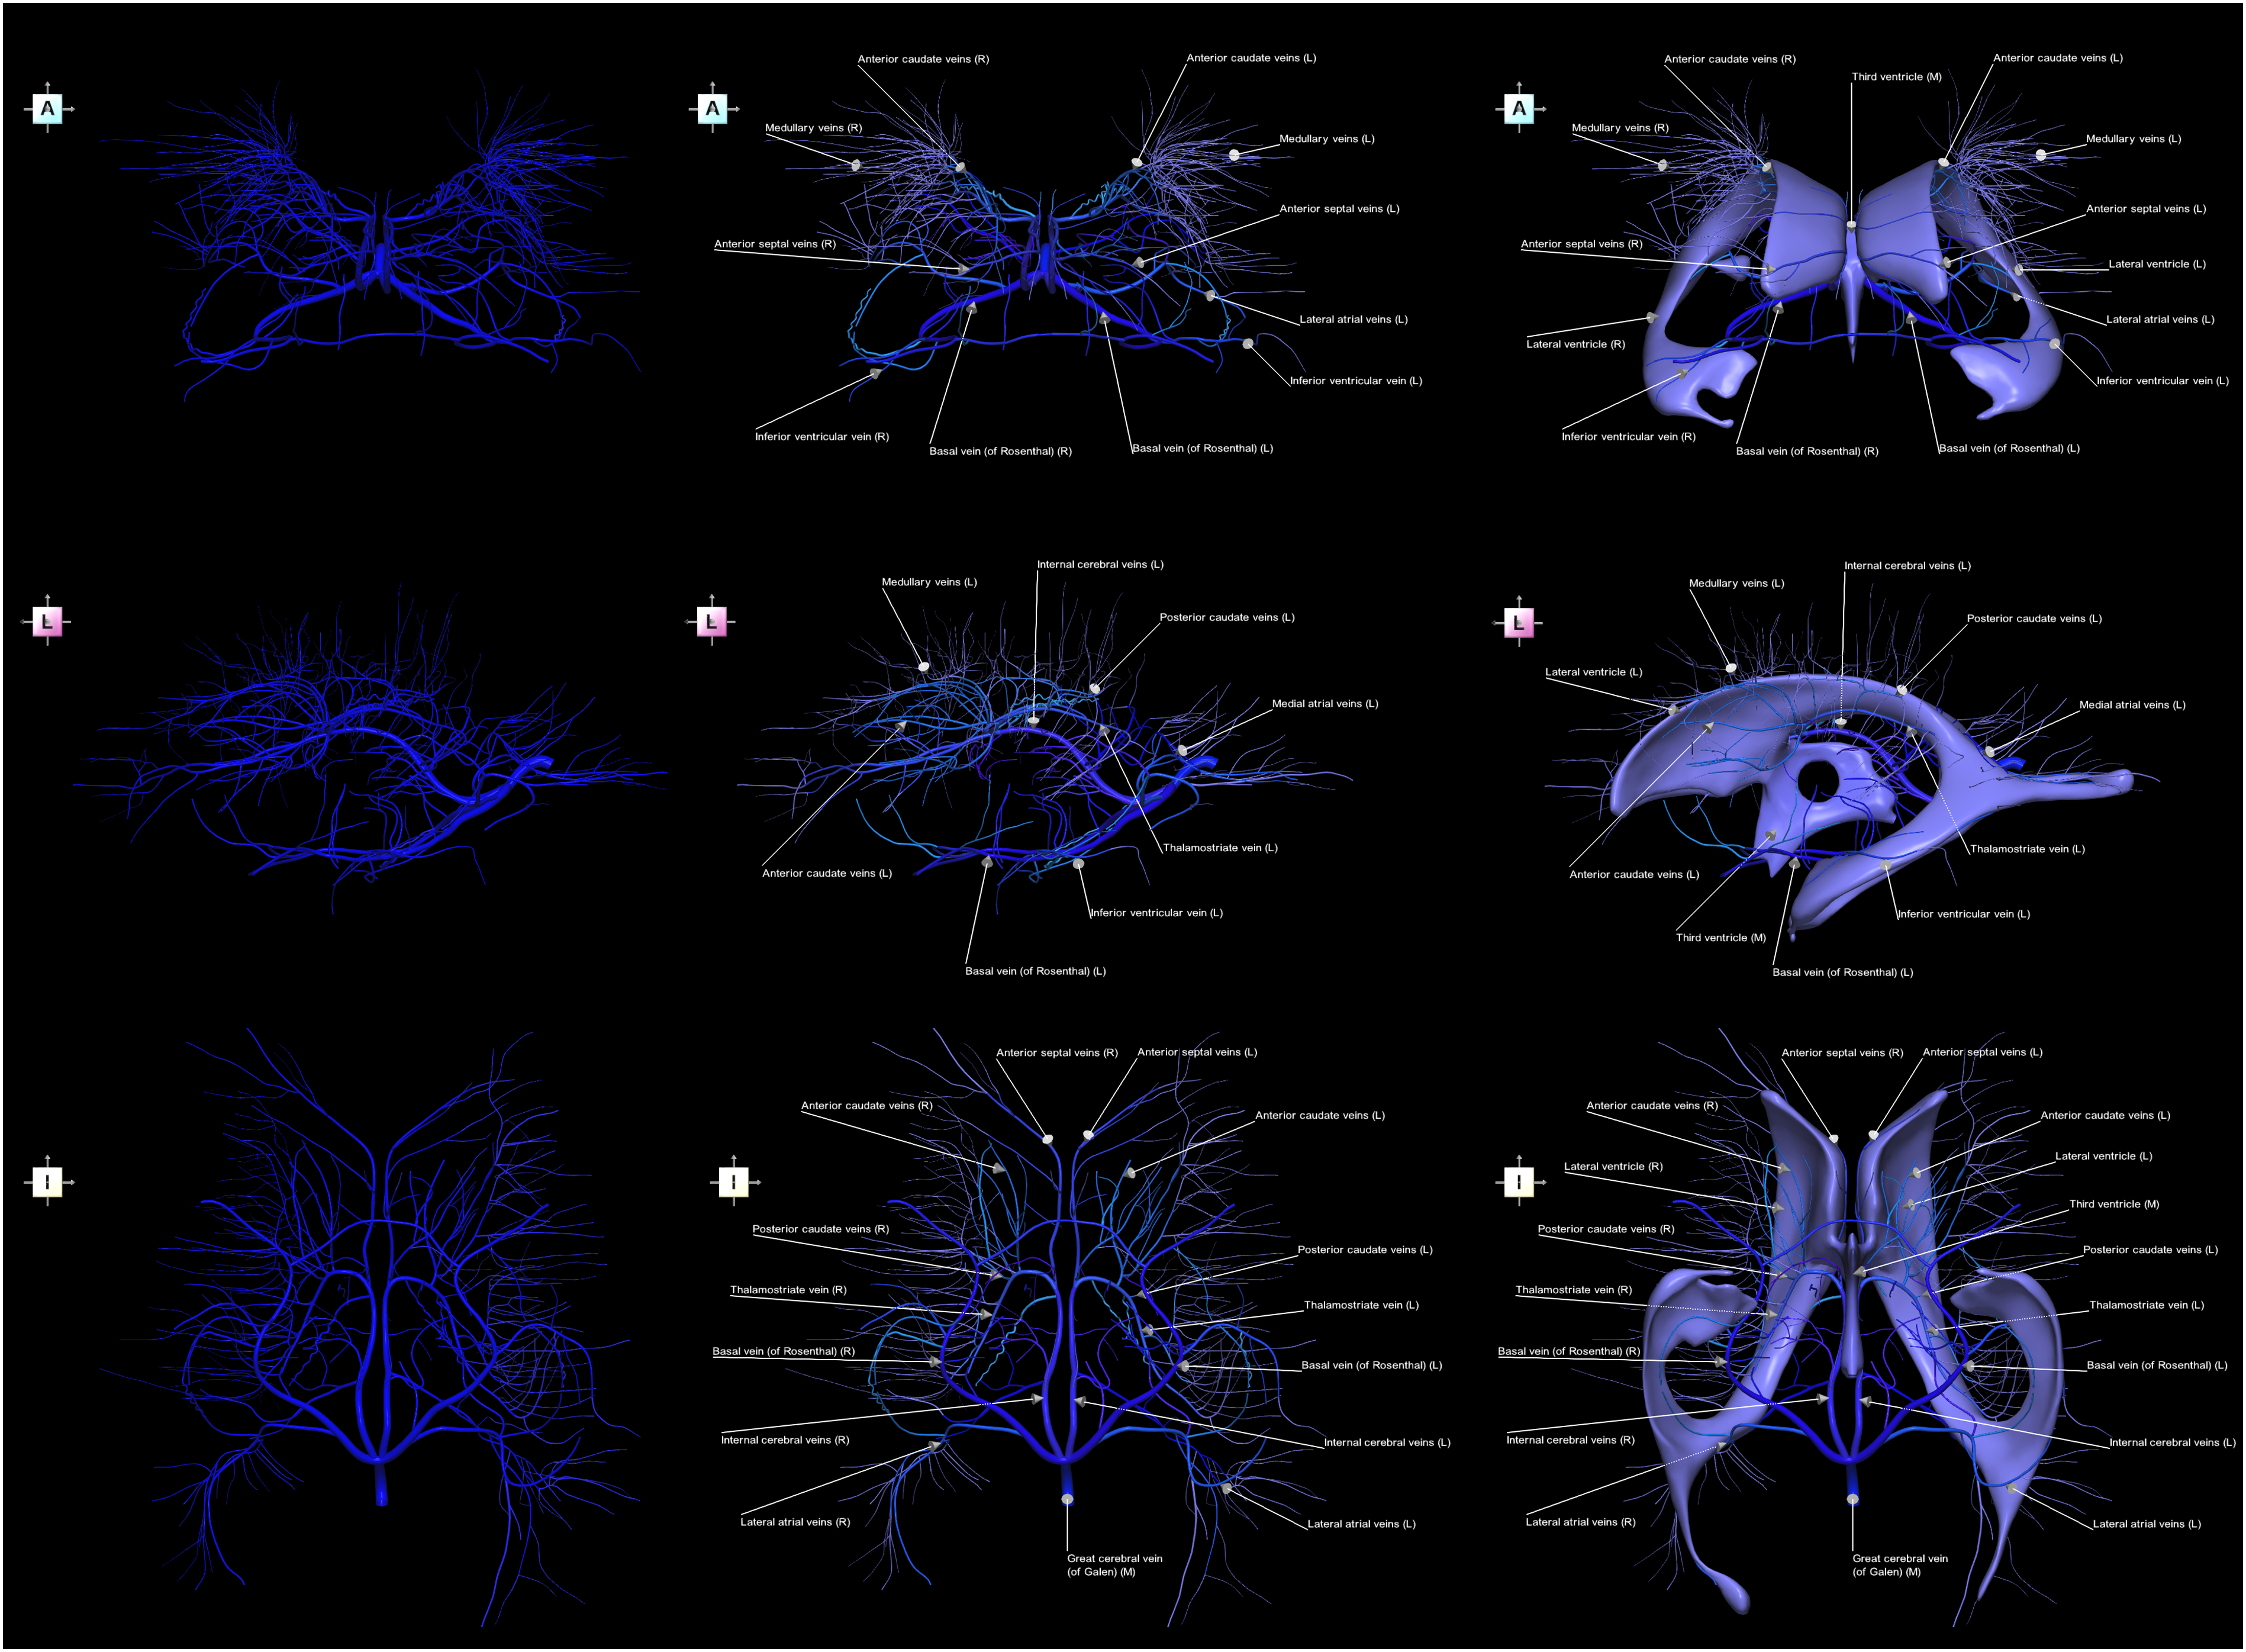
Figure 12 contains a hybrid image sequence presenting the facial nerve (CN VII) in the context of the skull and certain head muscles, illustrating that the cranial nerve nomenclature is derived from the muscular innervation of these nerves and the bones along which they course. Hybrid image sequence presenting the facial nerve (CN VII) in the context of the skull and selected head muscles (right lateral view), illustrating that the cranial nerve nomenclature is derived from the muscular innervation of these nerves and the bones along which they course. Top) non-parcellated and unlabeled facial nerve. Middle) parcellated and labeled facial nerve. Bottom) parcellated and labeled facial nerve with the skull, and selected head muscles (the buccinator and the posterior belly of digastric).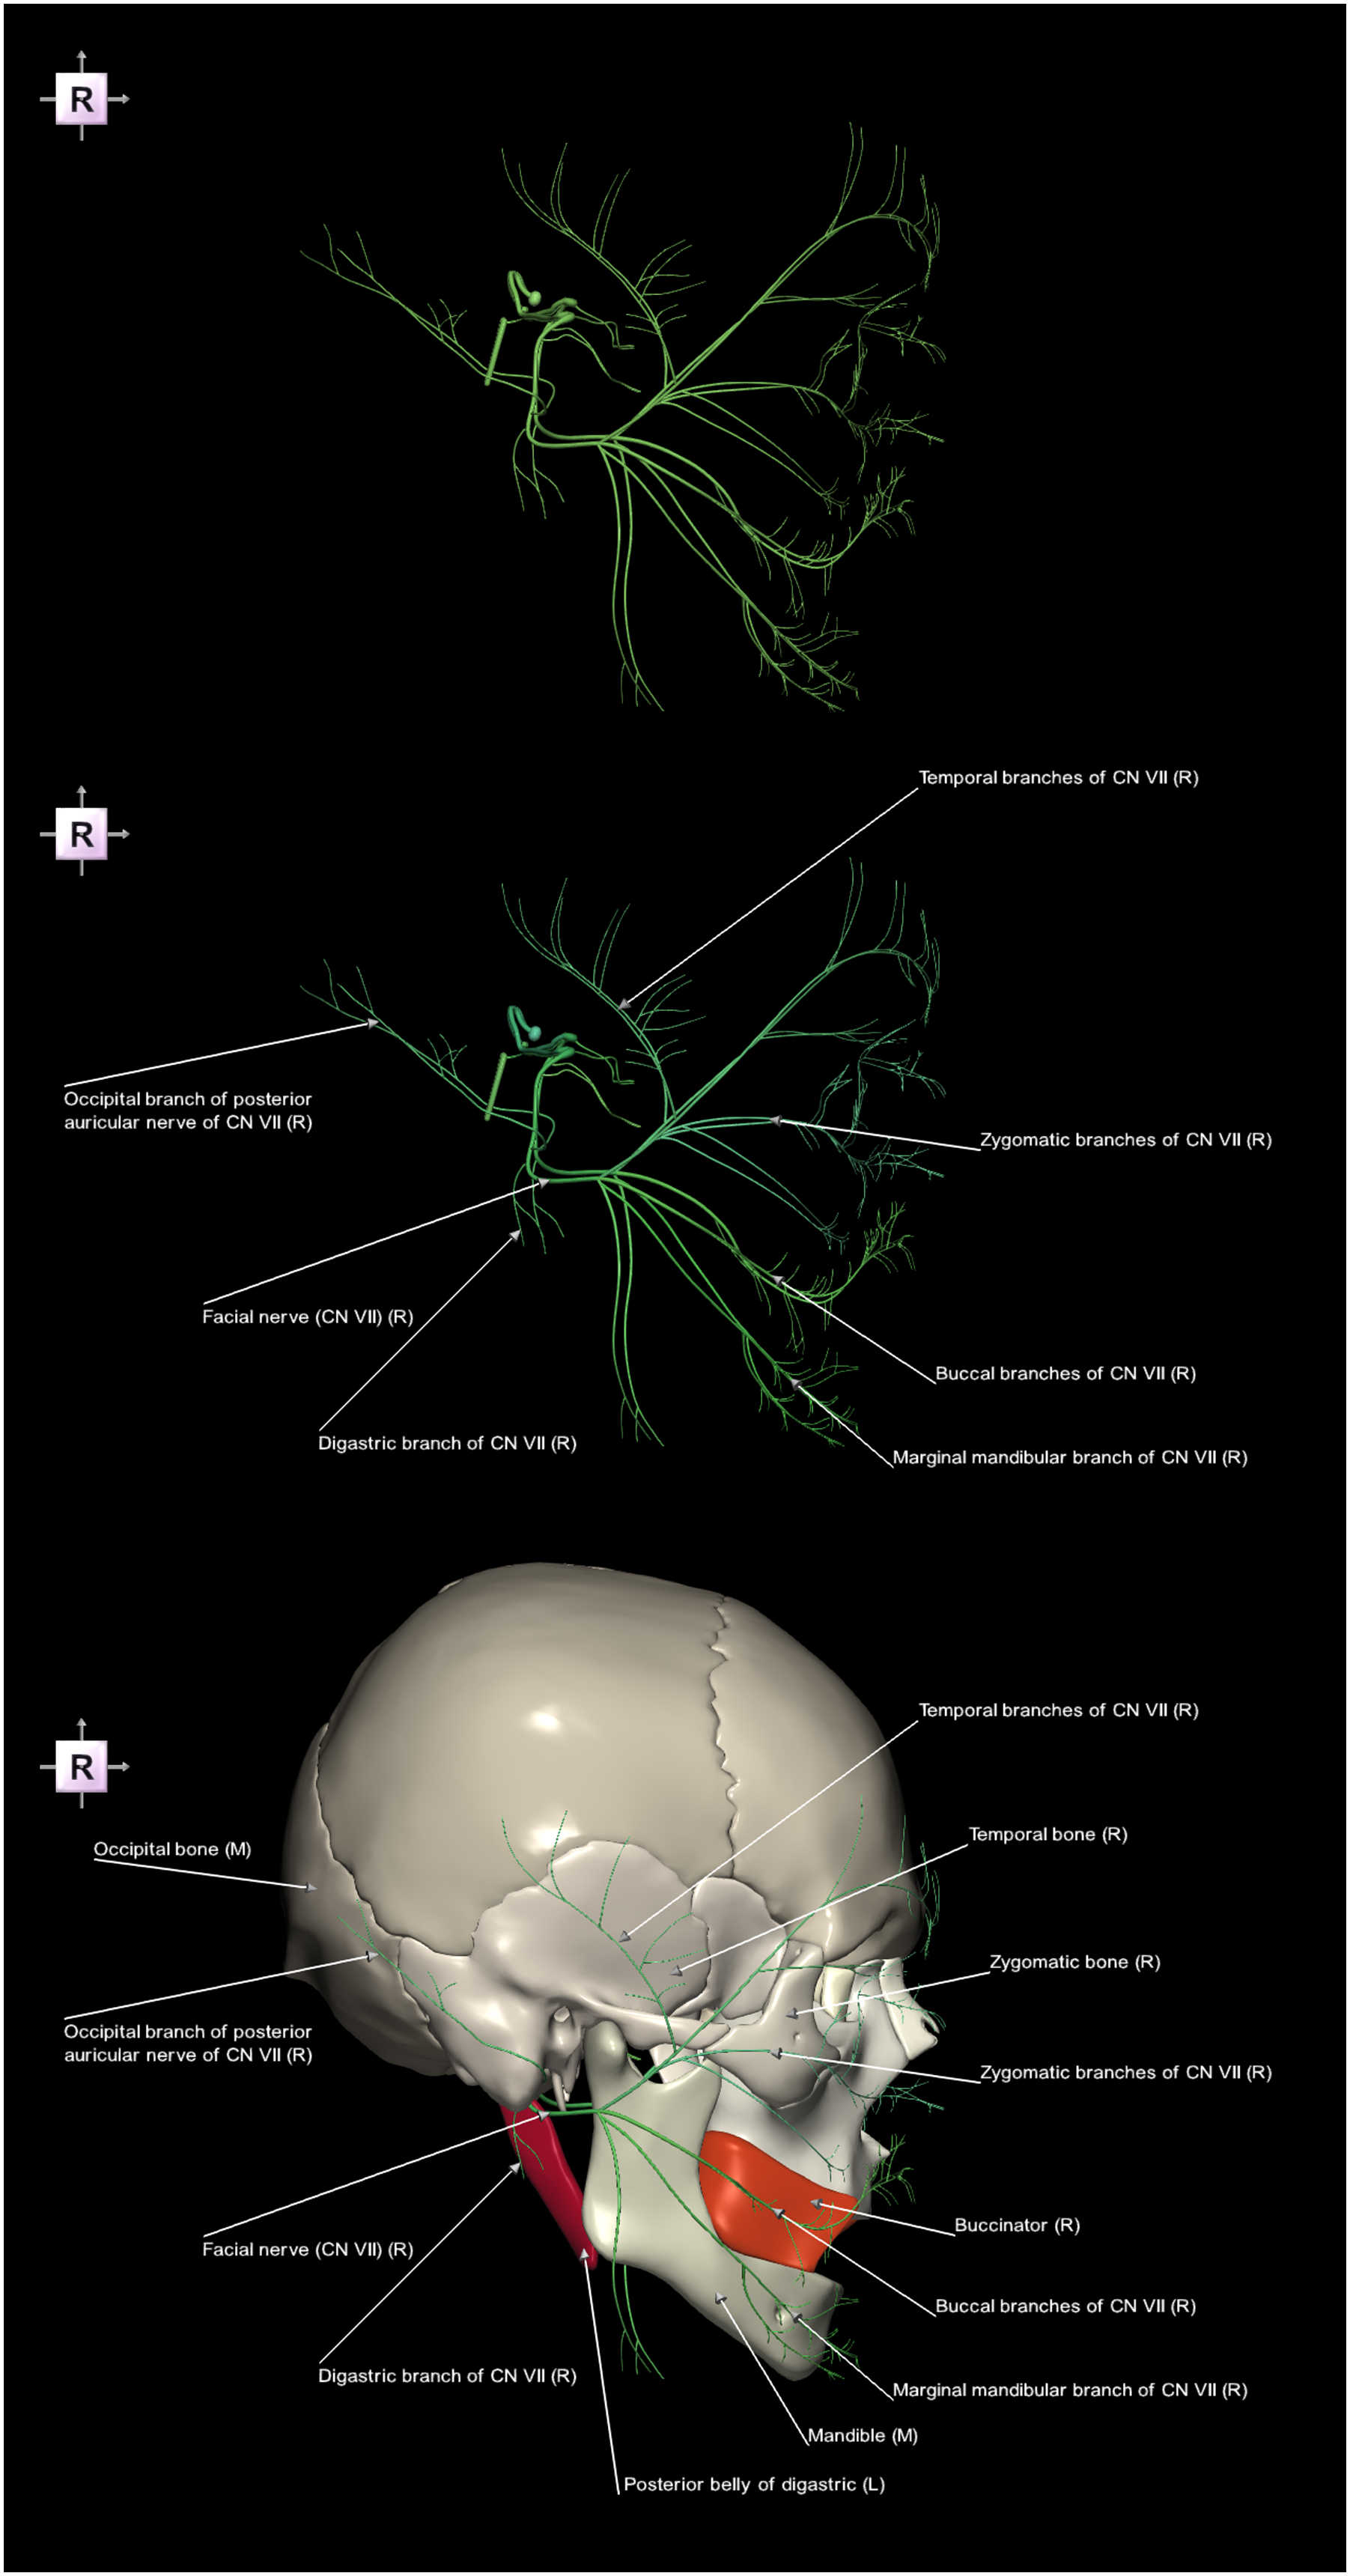
Note that Figures 1–12 demonstrate image sequences in the single multi-image mode. Additionally, 10 image sequences corresponding to Figures 1–7, 9, 11, and 12 are provided in automated mode as animated GIF images in the Supplementary Materials.
Moreover, two appearance 2-video sequences are included in the Supplementary Materials, demonstrating the cerebrum and the ventricular system. Each video presents a non-parcellated, unlabeled model on the left and a parcellated, labeled model on the right. These models are fully synchronized, each performing a complete rotation.
Discussion
To reduce the burden associated with neuroanatomy learning and to enhance its presentation, exploration, communication, and teaching two principal avenues can be pursued: the application of advanced technologies and/or the development of novel methodological approaches. Within the first avenue, several high-tech (though often costly) applications have been developed for teaching neuroanatomy, including virtual reality-based anatomy platforms25,26 and augmented reality systems that integrate radiology with anatomical visualization, such as the Magic Mirror system and the Anatomage. 27 Three-dimensional perception can further be enhanced through the use of 3D stereoscopic virtual models, particularly in the visualization of cerebral vasculature. 28 Furthermore, there is a growing interest in applying 3D printing and modeling to assist in neuroradiology education. 29
Within the second methodological avenue, some examples include novel methods to sulcal presentation. Specifically, a major challenge arises from the fact that approximately two-thirds of the cortical surface is buried within the sulcal walls, 30 so the standard presentation of the sulci on the outer cortical surface is largely incomplete. To overcome this limitation, I have earlier proposed two solutions: first, to present the cerebral sulci from the inside of the cerebrum 31 and second to use the white matter instead of the gray matter surface labeled with the sulci, which is shaped as the imprints of the volumetric sulci. 32
This work aligns with the second avenue, focusing on methodological approaches that facilitate the effective presentation, exploration, communication, learning, and teaching of neuroanatomy in neuroradiology. Neuroanatomy can be presented across a spectrum ranging from single images and sets of uncorrelated images to interactive 3D models and atlases, and further to immersive virtual and/or augmented reality applications. This work focuses on sets of spatially and contextually correlated images organized into systematic image sequences, extended to video sentences. Additionally, the emphasis is placed on simple, cost-effective methods that are easily accessible and have the potential for widespread use.
Five elementary types of systematic image sequences are introduced: appearance, contextual, multi-dimensional 2D-2D/3D, dissection, and special. These elementary image sequences can be combined to form four principal groups of composite image sequences: homogenous and heterogeneous, as well as uni-view and multi-view sequences. Two special forms of composite image sequences are a hybrid image sequence (an appearance followed by a contextual image sequence) and an alternate image sequence (repeated image sub-sequence or sub-sequences for various labeling and/or parcellation). These image sequences offer many advantages for the presentation and understanding of neuroanatomy as demonstrated in Figures 1–12.
The appearance image sequence in Figure 1 demonstrates how the same cortical surface can be parcellated in different ways, clearly highlighting key neuroanatomical features such as the boundaries between the lobes. Additionally, it provides an interpretative view of the cortical surface by delineating and naming the gyri and sulci, thereby offering a comprehensive understanding of cortical organization as a color-based parcellated and annotated map.
The appearance image sequence in Figure 2 demonstrates that parcellation of the veins facilitates the perception of venous grouping, while labeling additionally provides their nomenclature. As the naming of these veins corresponds to the vascular territories they drain, this relationship is further illustrated in the contextual image sequence in Figure 3, which clearly shows how the superficial cerebral veins drain their respective lobes. Specifically, the frontopolar and frontal veins drain the frontal lobe, and the temporal, parietal, and occipital veins drain the temporal, parietal, and occipital lobes, respectively, whereas the central veins drain the cortex adjacent to the central sulcus. Note that in contrast to the non-parceled cerebral cortex (Figure 3, middle), the parcellated cortex (Figure 3, bottom) serves as a vascular map or navigator for the superficial cerebral veins, thereby facilitating the understanding of their neurovascular anatomy. The hybrid venous image sequence in Figure 4 combines the advantages of its component sequences, integrating the grouping and labeling of the fully visible vessels from the appearance image sequence with their cortical contextual mapping from the contextual image sequence. Similarly, the hybrid image sequence in Figure 5 demonstrates that the calcarine vein is responsible for venous drainage of the calcarine sulcus region, whereas the olfactory veins and posterior orbitofrontal veins drain the olfactory sulcus and orbital sulci regions, respectively. In addition to cortical territories, some veins drain corresponding non-cortical structures, such as the posterior vein of the corpus callosum, which drains the corpus callosum, and the amygdalar vein, which drains the amygdala.
The naming of certain cerebral arteries similarly reflects the cortical regions they supply, as illustrated by the hybrid-alternate image sequence for the MCA in Figure 6 and by the alternate contextual image sequence for the ACA in Figure 7. Then, Figure 6, middle, shows the precentral, central, and postcentral sulcus arteries in relation to the corresponding precentral, central, and postcentral sulci; the angular gyrus artery against the angular gyrus; and the temporopolar artery against the temporal pole. In Figure 6, bottom, the anterior and posterior parietal arteries are presented against the parietal lobe; the prefrontal and lateral frontobasal arteries against the frontal lobe; the anterior, middle, and posterior temporal arteries against the temporal lobe; and the temporo-occipital artery against the temporal and occipital lobes. Note that the identification and naming of individual cerebral arteries is not easy without an appropriate cortical map, as illustrated in Figure 6, top. In Figure 7, the paracentral artery supplies the paracentral lobule, whereas the superior and inferior precuneal arteries supply the precuneus. Moreover, the pericallosal artery surrounds the corpus callosum within the sulcus of corpus callosum. Additionally, branches of the ACA supplying the frontal lobe include the root “front” in their names (i.e., the medial frontobasal artery, polar frontal artery, anteromedial frontal artery, intermediomedial frontal artery, and posteromedial frontal artery).
The cortico-vascular relationship demonstrated on the medial cortical surface (Figure 7) reveals almost the entire course of the arteries, however, on the lateral surface (Figure 6), the arteries with their branches running deep in the sulci are not completely visible, as about two-thirds of the cortical surface is hidden deeply in the walls of the sulci. Then, the dissection image sequence is able to expose the otherwise hidden structures (Figure 8). An alternative approach to dissections is cortical opening, 12 as either the dissection image sequence or the special image sequence with cortical opening (Figure 9) is suitable to reveal the arteries hidden in the cerebral sulci. The special image sequence with cortical opening generally has a shorter sequence, typically of two images (normal and open), and provides a smaller and localized span (a specific cortical region rather than a dissection over the entire brain).
The 2D-2D/3D image sequence shown in Figure 10 demonstrates the spatial correlation between a radiologic slice and the actual shape and course of the imaged structures, effectively extending their representation into 3D and thereby bridging 2D neuroradiology with 3D neuroanatomy/neurosurgery. Moreover, this image sequence facilitates the localization and distinguishes the neighboring structures with the overlapping intensity, such as the tail of the caudate nucleus and the hippocampus.
It should be noted that integrating radiology with anatomy has been widely recognized and recommended as an effective approach in medical education.33–35
Several studies have demonstrated the neuroeducational superiority of employing 3D virtual neuroanatomic models over traditional 2D sectional neuroanatomy.7,8 Moreover, certain studies quantitatively confirm that combining 3D neuroanatomy and 2D sectional neuroanatomy is an effective method of neuroeducation.36–39
The network of the deep cerebral veins appears complex and seemingly disorganized (aside from its approximate left-right symmetry) and it retains this appearance even after parcellation and labeling (Figure 11, left and middle columns). However, when visualizing this network in the context of the ventricular system (Figure 11, right column), its spatial organization becomes more evident, as the majority of these veins course along the walls of the ventricles. Specifically, for the paired veins located along both the left and right lateral ventricles, the anterior septal veins follow dorsally and the anterior caudate veins laterally the frontal (anterior) horns; the thalamostriate veins and the posterior caudate veins run along the ventral surfaces of the bodies; the medial atrial veins follow the lateral surfaces of the bodies and atria, while the lateral atrial veins run along the medial surfaces of the atria and the superior surfaces of the occipital (posterior) horns; and the inferior ventricular veins follow the dorsal surfaces of the temporal (inferior) horns. Moreover, the internal cerebral veins course along the superior margin of the third ventricle.
Similarly, the branches of the CN VII also appear complex and seemingly unorganized (apart from their approximate left-right symmetry) even after their parcellation and labeling (Figure 12, top and middle). However, by placing the CN VII within the context of the skull (Figure 12, bottom), it becomes apparent that most of the branches follow the shape of the skull. Moreover, the nomenclature of certain CN VII branches reflects their anatomical relationships with surrounding bones and head muscles. Specifically, the temporal branches of CN VII follow the temporal bone, the zygomatic branches of CN VII course along the zygomatic bone, the marginal mandibular branch of CN VII follows the mandible, and the occipital branch of posterior auricular nerve of CN VII follows the occipital bone. Additionally, the buccal branches of CN VII innervate the buccinator, and the digastric branch of CN VII innervates the posterior belly of digastric.
The appearance, contextual, and multi-dimensional 2D-2D/3D image sequences are incremental, with each successive image introducing additional information. Specifically, the appearance image sequence is incremental in terms of parcellation and/or annotation, with possible alternate image sub-sequences for diverse parcellation maps (see Figure 1); the contextual image sequence is incremental in terms of anatomic content, and the multi-dimensional 2D-2D/3D image sequence is incremental in terms of dimensionality.
Within contextual image sequences, which capture anatomical proximity relationships, three distinct types of these relationships can be distinguished: parcellation-dependent, shape-dependent, and structure-dependent. Parcellation-dependent relationships are exhibited, for example, by the cerebral arteries and superficial veins against diverse cortical parcellations serving as cortical maps (see Figures 4–7). Shape-dependent relationships are exhibited, for instance, by the deep cerebral veins in relation to the ventricular system (see Figure 11), as well as the facial nerve against the skull (see Figure 12). Examples of structure-dependent relationships are the posterior vein of the corpus callosum in relation to the corpus callosum (see Figure 5), the pericallosal artery against the corpus callosum (see Figure 7), and the buccal branches of CN VII in relation to the buccinator (see Figure 12).
The above examples demonstrate that the proposed image sequences offer several advantages, including enhanced visualization of anatomical relationships, improved spatial understanding, and more effective communication of complex neuroanatomical structures. Moreover, these image-video sequences are conceptually straightforward, user-friendly, and readily integrable into teaching materials and/or digital textbooks/platforms, as well as can be viewed on both computers and mobile devices. The use of color-coding to parcellate 3D images, along with annotations, provides clear distinctions between various structures and regions presented as color maps that enhance structure and region identification and image understanding. These sequences also facilitate the identification and visualization of anatomical proximity relationships, including parcellation-dependent, shape-dependent, and structure-dependent. Such image-video sequences are particularly valuable for medical students, residents, and educators, improving both comprehension and interpretation of complex neuroanatomical structures.
The introduced image sequences can be especially beneficial for neuroradiology teaching, as they mimic how radiologists actually read imaging studies by scrolling through slices and observing changes across space or time. Moreover, by transforming static illustrations into dynamic representations of brain anatomy, these image and video sequences help students grasp spatial relationships and develop the visual skills essential for neuroradiological practice.
Although the systematic image sequences introduced here are novel, there exist in radiology other types of sequential image presentations. Note, for instance, that tomographic images, such as CT, MRI, and PET, are, in fact, image sequences. Other well-known image sequences are image layers employed in radiology, anatomy, surgery, medical education, and art illustration. Image layers, also termed layer-by-layer digital anatomy and peeling away structures, refer to educational reconstructions where anatomy is presented in stacked layers, from superficial to deep, such as skin, fascia, muscles, organs, vessels, and bones. Layered imaging has become an important tool in medical education because it allows students to explore anatomy in a structured, sequential manner that mirrors the true organization of the human body. The presentation of structures as discrete layers eliminates the visual overlap inherent in traditional 2D resources and provides a clearer understanding of spatial relationships. Experience from the Visible Human Project, including applications such as Anatomica Travelogue, 40 demonstrates that layered digital datasets enable learners to “peel away” anatomical structures without distortion, improving comprehension of depth and topology. 41
The goals of layered and systematic image sequences are broadly similar, namely to enhance spatial understanding, reduce cognitive load, focus attention, and facilitate comprehension of complex anatomical regions. However, they differ in their organizing principles and underlying characteristics. Layered image sequences follow a depth-based progression, revealing anatomical structures across successive layers, and isolate one system at a time. In contrast, systematic image sequences are organized according to anatomical and pedagogical logic rather than depth, presenting relationships, parcellations, annotations, and organizational patterns in a structured manner. In particular, systematic sequences function as parcellated and annotated maps that integrate structural delineation with descriptive information. They comprise spatially and thematically correlated images, emphasize progressive variation across consecutive images while preserving overall continuity and coherence, demonstrate parcellation-, shape-, and structure-dependent anatomical relationships, and offer a greater diversity of representational formats. Note, for instance, that the opening in the special image sequence can be considered a local layer peeling.
Taxonomy-wise, image sequences can be classified as follows: - Raw image sequences (RIS) formed by tomographic images, such as CT, MRI, PET, and SPECT; - Layered image sequences (LIS) as depth-related images of a body; - Systematic image sequences (SIS) as defined here; - Combined RIS + SIS image sequences, where every raw image is supplemented with additional labeled/non-parcellated, unlabeled/parcellated, and/or labeled/parcellated instances; - Combined LIS + SIS image sequences, where every layered image is supplemented with additional labeled/non-parcellated, unlabeled/parcellated, and/or labeled/parcellated instances;
forming three groups: raw image sequences (RIS), reconstructed image sequences (LIS and SIS), and combined image sequences (RIS + SIS and LIS + SIS).
Systematic image sequences can be presented in three modes: interactive (as manually scrollable image sets), single multi-image, and automated animation, whereas video sequences are presented in a single multi-video mode. In the interactive mode, image sequences can be repeatedly scrolled forward and backward at a user-controlled speed, thereby providing the most effective means for exploring their content and incremental changes between images.
Although this article presents only a limited number of examples of systematic image and video sequences, I have already created large collections of ready-to-use image sequences covering the brain and extending to the head and neck. These image sequences are available through three main sources. Hundreds of diverse image sequences, presented in both single multi-image and animated modes, are available in the NOWinBRAIN 3D neuroimage repository, which contains above 8600 images organized into 12 galleries.11–13 This repository is freely available and easily accessible online at https://www.nowinbrain.org/ and is intended for a broad spectrum of users in medicine and beyond. To my best knowledge, NOWinBRAIN represents the largest repository of 3D human brain images extended to the head and neck (and created consistently by a single author). For comparison, Frank Netter produced about 4000 images covering the entire human body. 42 In addition, over 350 image sequences are available in my ebook Neuroanatomy Made Easy, 14 comprising more than 1000 3D neuroimages and 100 videos. Furthermore, selected image sequences are included in Chapter 28 of the recent 43rd edition of Gray’s Anatomy. 15
A limitation of this work is the absence of quantitative validation. The advantages attributed to the introduced SIS are, at this stage, supported primarily by qualitative observations and explanations rather than quantitative evidence. Conducting a rigorous quantitative evaluation would constitute a separate study requiring a dedicated experimental design, carefully selected use cases, and multiple cohorts of medical students and trainees. Nevertheless, given that SIS and LIS share broadly similar educational goals, and that SIS offer several structural and practical advantages over LIS, it is reasonable to expect that SIS will gain comparable acceptance and become similarly well-established in medical education, particularly given that hundreds of ready-to-use SIS are already available for the brain. This extensive, immediately deployable resource base substantially lowers the barrier to adoption and provides educators with a rich pool of materials that can be integrated directly into teaching and training.
Summary
Enhancing neuroanatomy learning and teaching can be pursued through advanced technologies and novel methodological approaches. This work focuses on the latter, emphasizing simple and cost-effective methods that facilitate the presentation, exploration, and communication of neuroanatomy. The work introduces systematic image sequences as sets of spatially and contextually correlated images organized to progressively convey anatomical information, and extends this framework naturally into video formats. Five elementary image sequence types are defined: appearance, contextual, multi-dimensional 2D-2D/3D, dissection, and special. They can be combined into composite (homogeneous/heterogeneous and uni-view/multi-view) sequences, including hybrid and alternate forms, providing a flexible framework for representing complex neuroanatomical relationships.
A defining feature of these sequences is their incremental structure, in which each image adds information through parcellation, contextualization, annotation, and/or dimensional extension. They also enable highlighting different types of anatomical relationships: parcellation-dependent, shape-dependent, and structure-dependent, thereby improving conceptual clarity. The use of color-coding and annotation further enhances visualization by transforming complex anatomy into intuitive, map-like representations.
These image-video sequences are conceptually straightforward, user-friendly, widely accessible, and easily integrable into educational materials and digital platforms. They are particularly valuable for neuroradiology training, as they replicate the process of interpreting imaging studies through sequential image navigation. By converting static representations into dynamic, structured visualizations, they significantly improve spatial understanding, interpretation skills, and the overall effectiveness of neuroanatomy education. A large collection of ready-to-use image sequences covering the brain and extending to the head and neck is already available across three sources.
Although demonstrated here for brain anatomy, the proposed methodology is readily generalizable to other organs, provided that the underlying virtual body models are parcellated, labeled, composable, and virtually dissectible.
Supplemental material
Supplemental material
Footnotes
Author’s contributions
Conceptualization, methodology, definition of systematic image and video sequences, creation of systematic image and video sequences, and manuscript writing. This is my labor of love and a free contribution to society.
Funding
The author received no financial support for the research, authorship, and/or publication of this article.
Declaration of conflicting interests
The author declared no potential conflicts of interest with respect to the research, authorship, and/or publication of this article.
Data Availability Statement
Supplemental material
Supplemental material for this article is available online.
References
Supplementary Material
Please find the following supplemental material available below.
For Open Access articles published under a Creative Commons License, all supplemental material carries the same license as the article it is associated with.
For non-Open Access articles published, all supplemental material carries a non-exclusive license, and permission requests for re-use of supplemental material or any part of supplemental material shall be sent directly to the copyright owner as specified in the copyright notice associated with the article.