
Abstract
Background and aim
Dietary habits significantly affect not only individuals’ health but also environmental sustainability indicators such as carbon emissions and water usage. This study aimed to evaluate diet quality and environmental effects in vegan, vegetarian and omnivorous adults.
Methods
This cross-sectional study included 77 vegans, 28 vegetarians and 72 omnivores. Healthy eating index (HEI) was used to determine the diet quality of individuals. Carbon and water footprint values were calculated.
Results
In HEI scores, it was determined that vegans and vegetarians had higher scores than omnivores in whole fruits, total vegetables, greens and beans and seafood and plant protein scores (p < 0.05). Omnivores had highest values in carbon footprint and vegans had lowest values, while omnivores had the highest values in water footprint and vegetarians had the lowest values (p < 0.05). Carbon footprint values had a negative relationship with whole fruits scores, total vegetables scores, greens and beans scores, whole grains scores, seafood and plant protein scores and fatty acids scores; and a positive relationship with dairy scores, total protein scores, refined grains scores, added sugars scores and saturation fats scores (p < 0.05), while water footprint values had a negative relationship with whole fruits scores, total vegetables scores, whole grains scores and saturation fats scores; and a positive relationship with dairy scores, total protein scores, refined grains scores, added sugars scores and saturation fats scores (p < 0.05).
Conclusion
These study findings showed that diet quality and diet type are determinants of carbon and water footprint values.
Introduction
Food production and consumption involve a complex system. This system includes multiple stages such as agricultural and livestock activities, processing, distribution, preparation, consumption, and waste management.1,2 It is known that the average daily energy requirements of a person depend on various factors such as physical activity level, lifestyle, gender, age, body weight, geographical location and cultural characteristics. 2 Healthy and adequate food consumption depends on several factors. These include individual lifestyle, marketing strategies, and economic conditions. 3 Nutritional choices play a major role in the link between longevity and health.3,4 In addition, the relationship between nutritional choice, resource consumption and environmental impacts is gaining importance. 5 In this context, diets characterized by the reduction or elimination of animal foods have recently become popular.6,7 While a vegetarian diet involves the removal of meat, fish and some animal products from the diet, a vegan diet means the complete removal of all animal products, including milk, dairy products and eggs, from the diet.8,9 One of the main motivations for consumers to adopt a vegetarian or vegan diet is the environmental impact.7,10 To determine the environmental impact of eating habits and/or daily diets, Life Cycle Assessments (LCA) data are generally used, which systematically evaluates the environmental aspects of a product or production system. Greenhouse gas emissions, carbon footprint and water footprint that can be learned with this data system are one of the biggest indicators of this. 11
Carbon footprint is often used to indicate greenhouse gas emissions. 12 It is defined as the total amount of greenhouse gases, particularly carbon dioxide, emitted by an activity or product over a specific period 13 Although carbon dioxide (CO2) is the greenhouse gas that has the greatest impact on greenhouse gases and is a carbon footprint precursor, methane (CH4) and nitrous oxide (N2O) are other greenhouse gases that also contribute to the carbon footprint. 14 The term water footprint refers to the amount of water used for an activity or product and refers to the total water consumed by a single process, product, company, or a country, population, or humanity.15,16 Plant-based foods are generally characterized by significantly smaller water footprints per equal nutrient value than animal-based foods.16,17 In this context, vegan and vegetarian diets, which are included in sustainable nutrition, are considered more environmentally friendly compared to diets rich in meat.5,18 Reducing the consumption of animal foods, especially beef, and increasing plant-based food intake may support a transition toward more sustainable dietary patterns.1,19 It is stated that this nutritional choice will not only result in a significant reduction in water and carbon footprint, but will also be associated with measurable health benefits. 20 Individuals following vegetarian or vegan diets have a lower risk of type 2 diabetes, obesity, and coronary heart disease. They are also reported to have a longer life expectancy.4,9 At this point, a relationship has been found between diet quality and environmental impact, indicating that a nutritional shift towards plant-based diets leads to a lower environmental impact.21–23 However, environmental sustainability must also be compatible with maintaining an overall healthy diet. 24 However, vegan and vegetarian diets may increase the risk of inadequate macro and micronutrient intake due to reduced consumption of animal products. This risk can be minimized with a well-planned and balanced diet. 25 On the other hand, it is stated that omnivorous diets, which are high in terms of greenhouse gas emissions, may be low in terms of healthy eating index and diet quality, even though they are rich in certain micro and macro nutrients. 26 Therefore, it should be noted that Healthy Eating Index (HEI) component scores reflect the relative quality of dietary intake in accordance with dietary guidelines, rather than absolute nutrient or food consumption levels, as they are calculated using a density-based approach (e.g., per 1000 kcal) and assess adherence to dietary recommendations. 27
In light of this information, it is important to investigate the various health and sustainability dimensions of such diets in terms of transforming food systems and achieving the Sustainable Development Goals (SDGs). The aim of this study is to evaluate diet quality and environmental effects in vegan, vegetarian and omnivorous adults.
Methods
General plan of the research and sample selection
The sample of this cross-sectional study consists of adult vegans, vegetarians and omnivores between the ages of 19–64. In determining the sample size to be included in the study, a study conducted with similar methods in the literature was taken as basis and the significance level (α) was selected as 0.05 and the power (1-β) as 0.90. 28 According to this result, the sample calculation was determined as 165. Inclusion criteria were defined as being between 19 and 64 years of age, self-identifying as vegan, vegetarian, or omnivorous for at least one year, and willingness to participate voluntarily. Individuals who reported pregnancy or lactation, current use of special medical diets (e.g., renal, diabetic, or weight-loss therapeutic diets), or incomplete dietary data were excluded from the study. Participants with diagnosed chronic diseases that could substantially affect dietary intake (such as cancer, chronic kidney disease, or severe gastrointestinal disorders) were also excluded when self-reported. In accordance with the inclusion and exclusion criteria, the sample number was finally determined as 177 individuals in total. Research data were obtained using the questionnaire form and face-to-face interview technique. Participants were informed before the study, the study was conducted with those who volunteered to participate in the study and a consent form was signed. Ethics Committee Approval number 7/361, dated 09.04.2025 was received from Clinical Research Ethics Committee in accordance with the Declaration of Helsinki criteria.
Evaluation of nutritional status and anthropometric measurements
Participants were questioned about all foods and beverages they consumed in the last 24 h using the 24-h reminder method. Portion models of foods, household measurements such as water glass, tea glass, coffee cup, mug, tablespoon, level, heaping, ladle, dessert spoon, small size, medium size, large size, etc. were used as a reminder using known net amounts. In addition, all individuals participating in the study were questioned about their food consumption frequency, including animal and plant milk and dairy products, meat-eggs-legumes, vegetables and fruits, bread and cereals, beverages, oil, sugar and desserts. The recorded food and beverages were calculated in grams using the Nutrition Information Systems Package Program (BEBIS). Through this program, the energy intake of individuals and their macro and micro nutrients were determined. Body mass index (BMI) was determined for the study by dividing body weight (kg) by the square of height (kg/m2) from the measured body weight and height information of the individuals, and using height (cm) and body weight (kg) information. Underweight was defined as less than 18.5 kg/m2, normal as 18.5–24.9 kg/m2, overweight as 25.00–29.9 kg/m2, and obesity as 30.0–39.9 kg/m2. 29
Healthy eating index
The Healthy Eating Index (HEI), developed in the United States to promote health and prevent chronic diseases and updated every five years, focuses on dietary quality based on healthy choices such as whole grains, seafood, and plant proteins, and pays more attention to the ratio of unsaturated to saturated fatty acids. 30 The ‘Healthy Eating Index’, which is based on the American Dietetic Guide, was created by the United States Department of Agriculture (USDA) and evaluates diet quality. There are 13 groups in the HEI-2015 form, 9 of which indicate adequacy and 4 indicate limitations. If the score is above 80, the diet is considered “good quality”, if it is between 51–80, the diet is considered “adequate diet quality (needs improvement)”, and if it is below 51, the diet is considered “a poor diet quality (significant revision required)”.31–36 The difference between the current form of the healthy eating index, HEI-2015, and the 2010 form is that the energy coming from empty energy sources (20 points) in the category where limited intake is desired is evaluated separately as energy coming from added sugar (10 points) and saturated fats (10 points). 30 It was stated that no changes were made in terms of calculation between HEI-2015 and HEI-2020. 37
Determination of carbon footprint
There are different methodologies in the literature regarding the calculation of greenhouse gas emissions from food consumption. In this study, the average carbon footprint factors published in the literature were used for food categories produced using traditional production methods. Since there is no data specific to Turkey regarding greenhouse gas emissions and carbon footprint factors of foods, calculations were made using carbon footprint factors compiled as a result of meta-analysis. 38 In the literature, carbon footprint factors for each food are found as kg-product. Each of the food-specific factors was converted to grams of product in order to calculate the greenhouse gas emissions of one portion of the recipes. Spices and various flavoring food products were not included in the greenhouse gas emission calculations of the dishes because they are present in trace amounts and do not have carbon footprint factors. Similarly, the recipes do not include wheat, tomato paste, salt, spices, fresh yeast, pomegranate syrup, vinegar, cream, baking soda, sweetener and mastic gum, as they do not have specific carbon footprint factors. 39
Determination of water footprint
The concept of water footprint was first introduced by Hoekstra in 2002 to capture water usage of products and services along their supply chains. 40 Methodologies for calculating the water footprint of products have also been developed by Hoekstra et al. In the case of agricultural products, the water footprint is usually expressed in m3/ton or liter/kg. Other ways to express the water footprint of a product are water volume/kcal (for food products in the context of diets) or water volume/joule (for electricity or fuels). 41 In this study, water footprint factors obtained as a result of literature review were used to calculate the water footprint of each of the nutrients in the food consumption of individuals, agricultural products and animal products.42,43 Among the ingredients in the recipes; wheat, tail fat, tallow, mushroom, tomato paste, salt, spices, fresh yeast, pomegranate syrup, vinegar, cream, baking soda, sweetener and mastic gum are not included in the calculation as they do not have specific water footprint factors.
Statistical analysis
The data obtained from the study were analyzed using SPSS 27.0 program. Descriptive data are given as number (n), percentage (%), arithmetic mean (x̄) and standard deviation (SD). The suitability of the variables to normal distribution was examined with the Kolmogorov-Smirnov test. Pearson Chi-square test was used to compare categorical data. One way ANOVA method was used in the analysis of comparisons between groups. Pairwise group comparisons were performed using post-hoc tests following one-way ANOVA, and statistically significant differences between groups were determined using Tukey and Tamhane's T2 tests, depending on variance homogeneity. For the evaluation the relationship between the carbon and water footprint and HEI scores lineer regression model was used. A value of p ≤ 0.05 was accepted as statistical in the analyses.
Results
Demographic characteristics of individuals are given in Table 1. According to the table, 26% of vegans and 27.8% of omnivores were overweight and obese, and 17.9% of vegetarians were in the underweight group (p = 0.026).
Demographic characteristics of the groups.
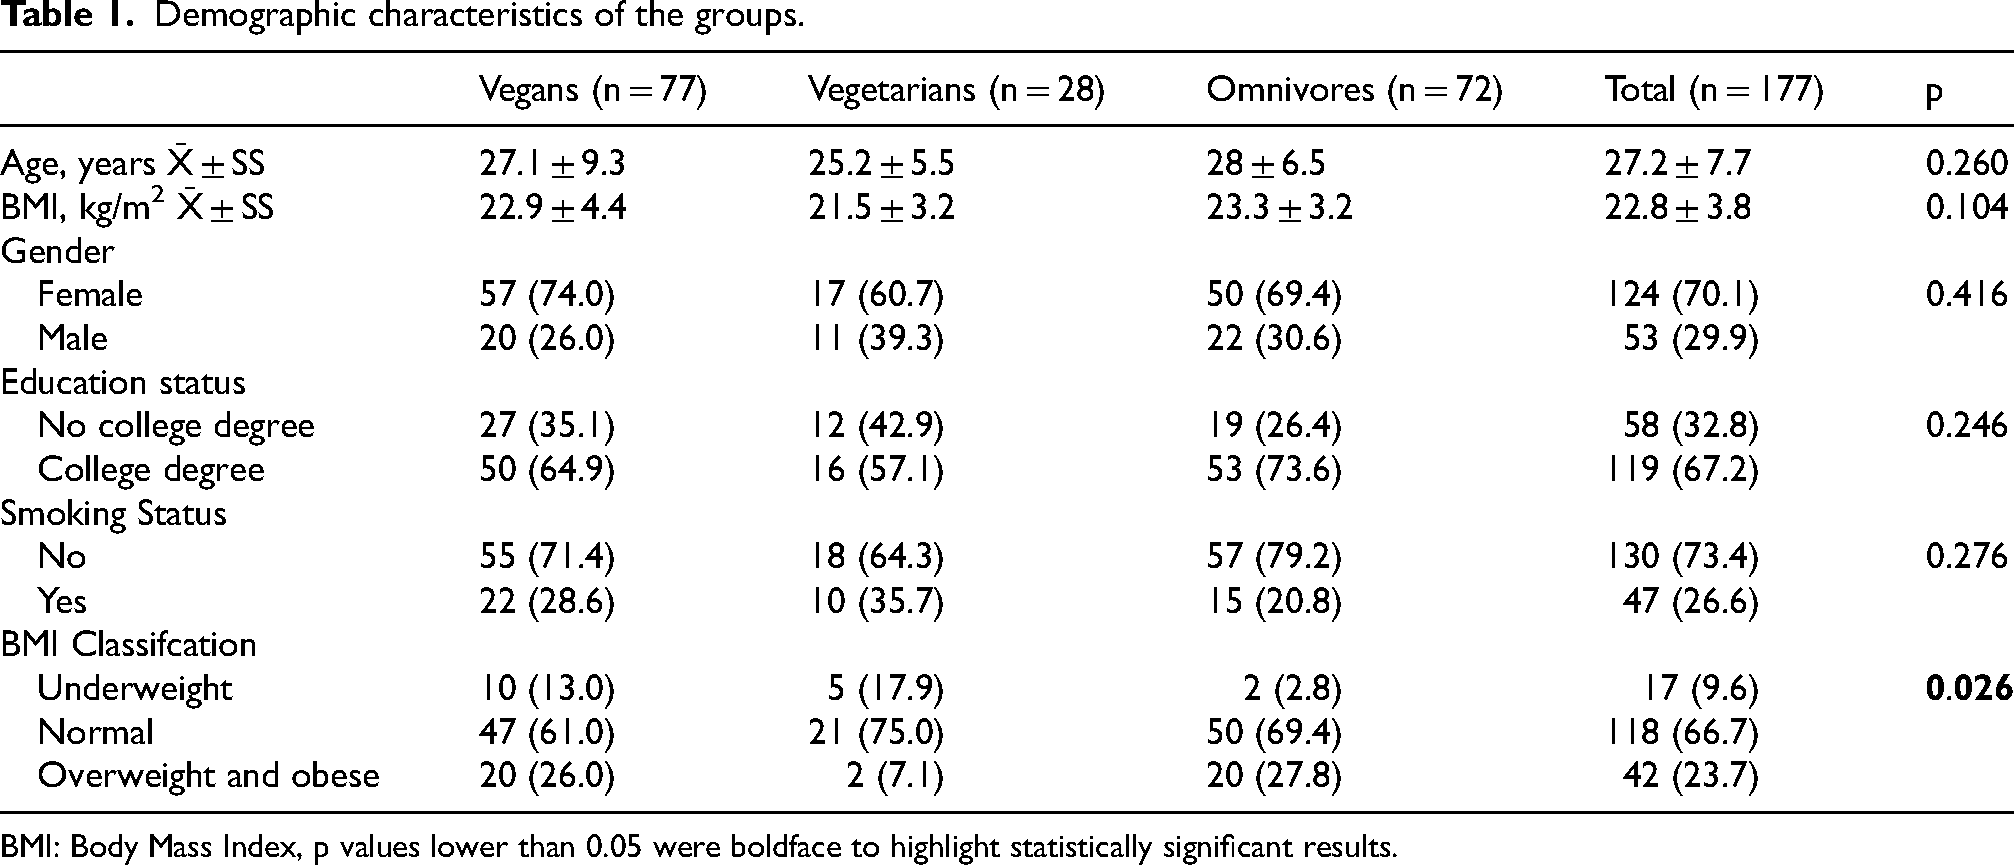
BMI: Body Mass Index, p values lower than 0.05 were boldface to highlight statistically significant results.
The evaluation of diet quality of the groups is shown in Table 2. According to the table, statistically significant results were obtained in all values except sodium and total fruit values. In general, in HEI scores, it was determined that vegans and vegetarians had higher scores compared to omnivores in whole fruits, total vegetables, greens and beans and seafood and plant protein scores (p < 0.05).
Diet quality of groups.
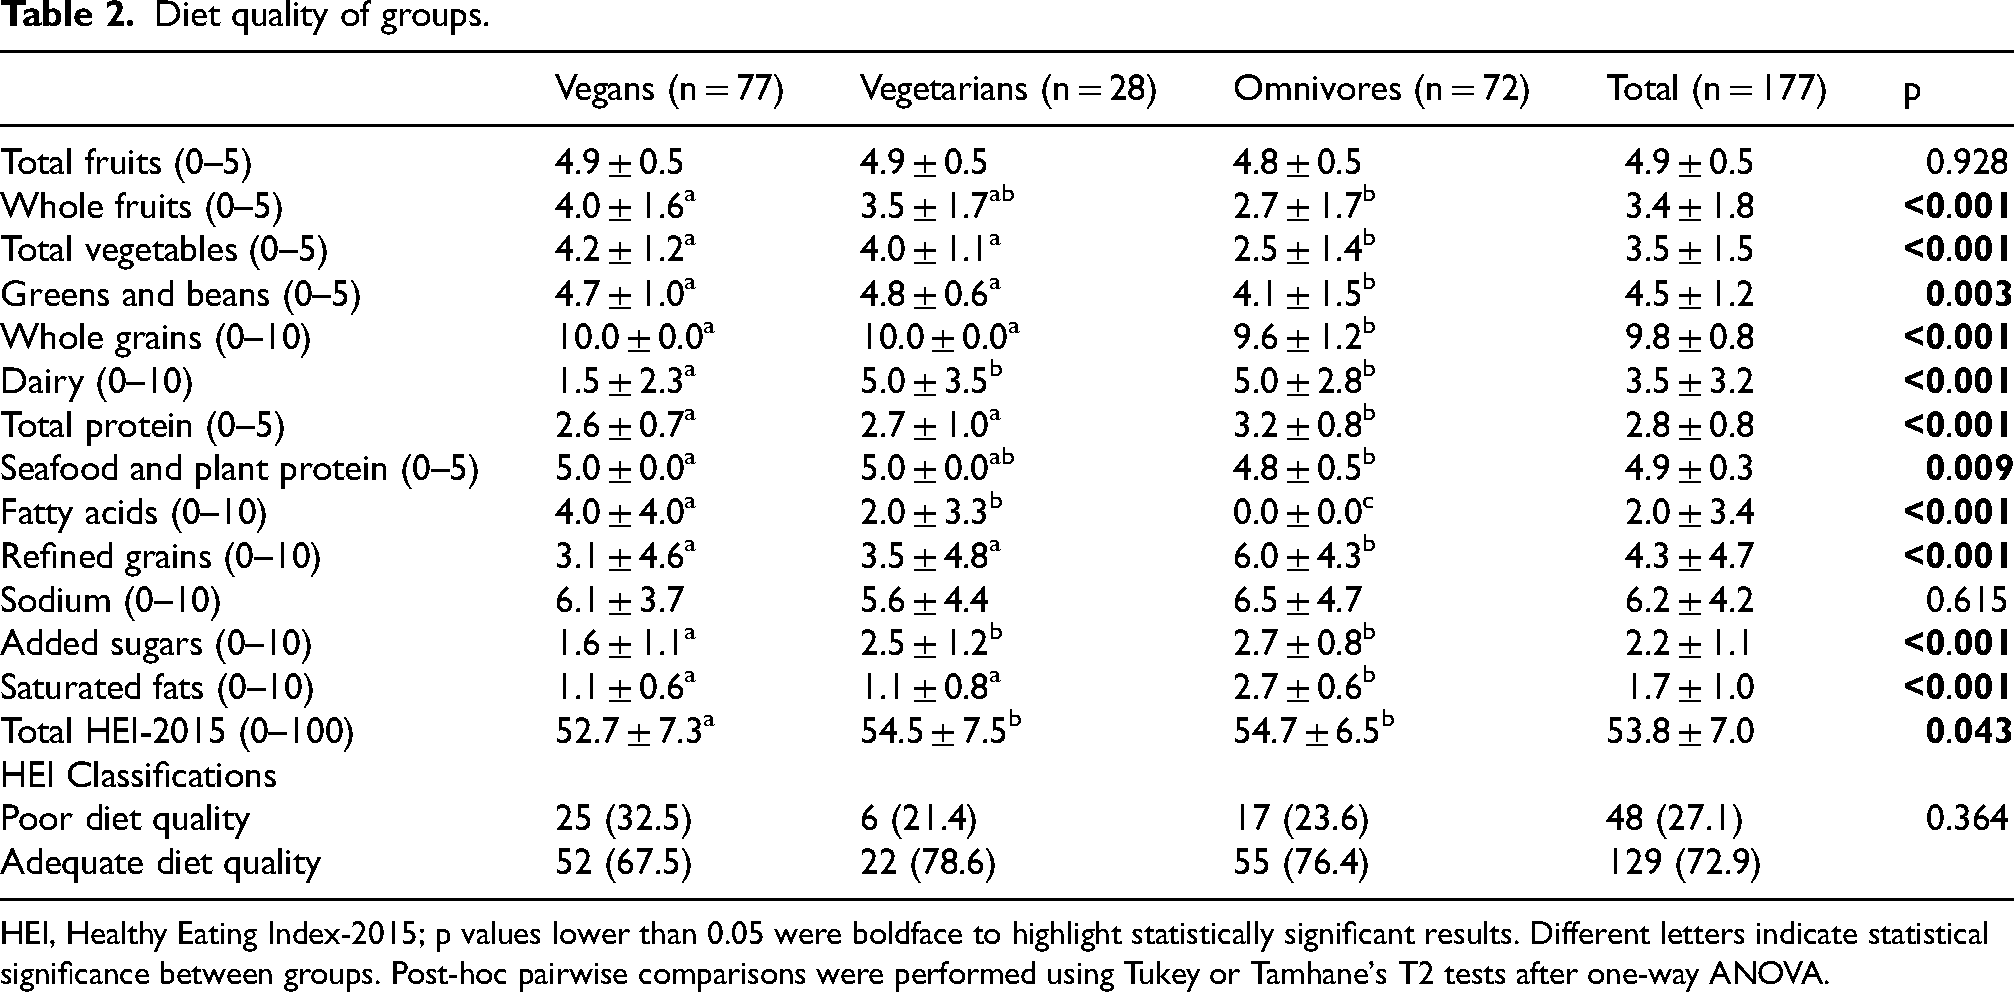
HEI, Healthy Eating Index-2015; p values lower than 0.05 were boldface to highlight statistically significant results. Different letters indicate statistical significance between groups. Post-hoc pairwise comparisons were performed using Tukey or Tamhane's T2 tests after one-way ANOVA.
Energy and nutrient values of the groups are shown in Figure 1. It was observed that the highest energy, carbohydrate, protein, cholesterol, zinc and calcium intake was in omnivores. It was determined that the highest fiber, vegetable protein and magnesium intake was in vegans and vegetarians, respectively (p < 0.05).
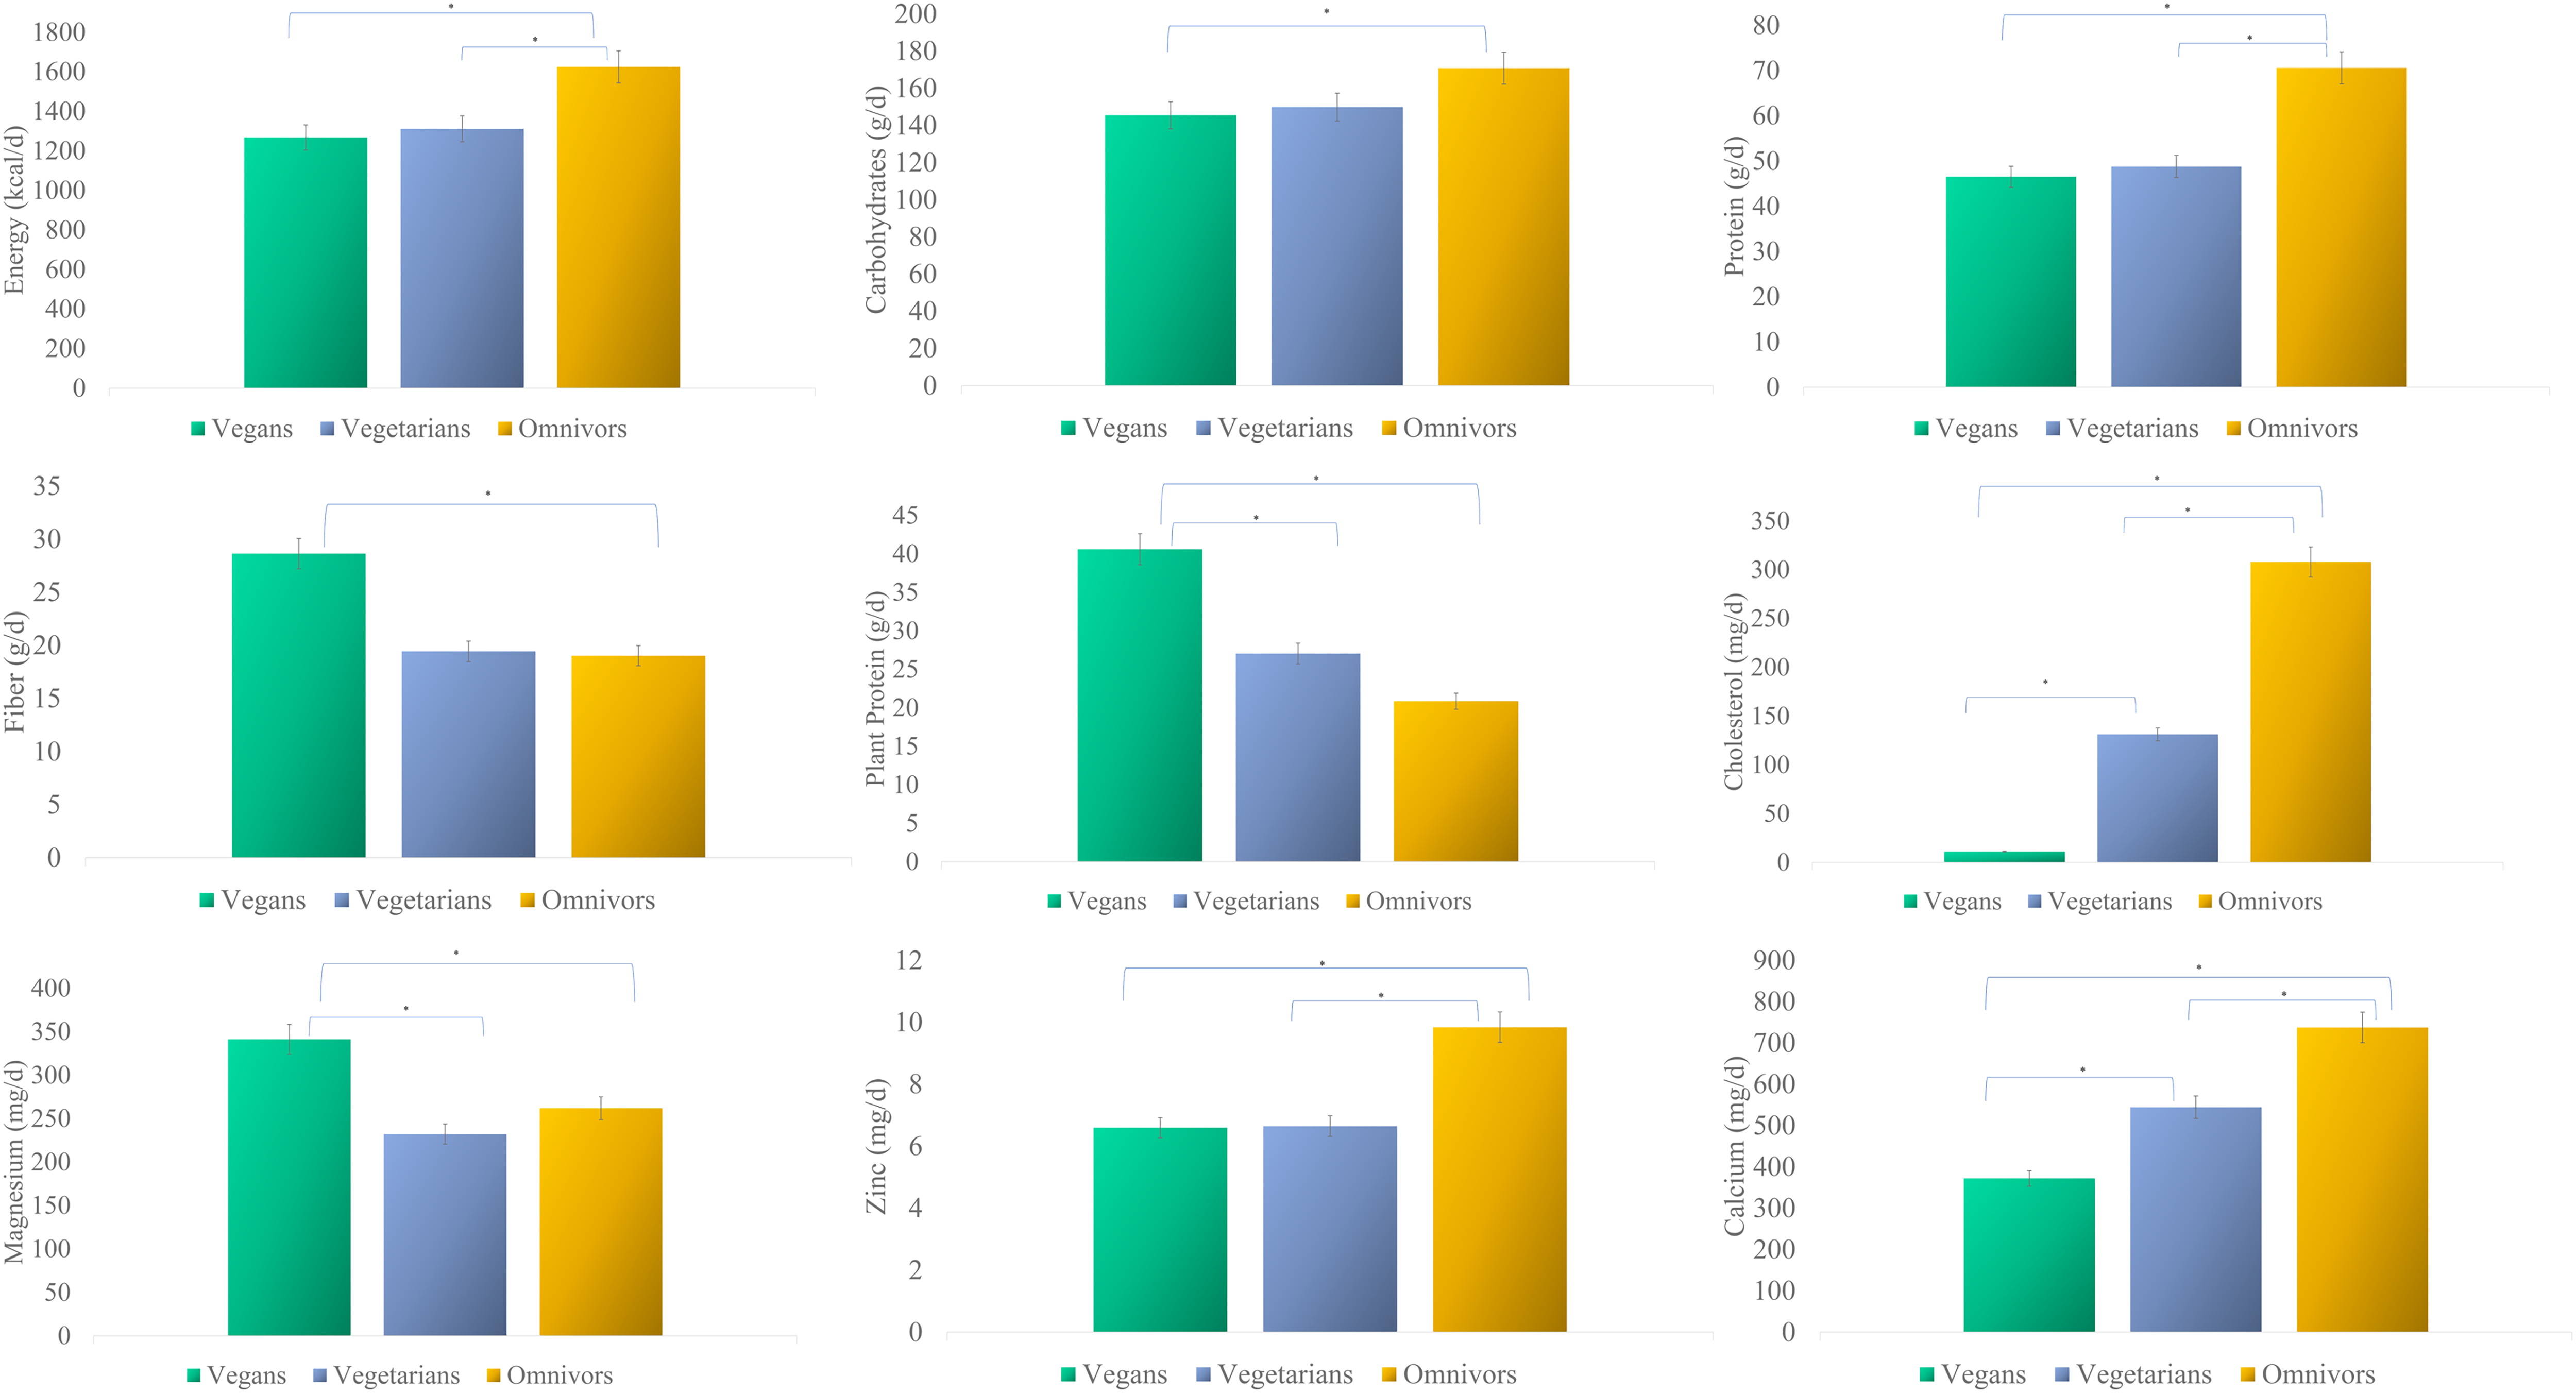
Energy and nutritional values of the groups.
Carbon and water footprint values of the groups are shown in Table 3. Omnivores have the highest values in carbon footprint, while vegans have the lowest values. Omnivores have the highest values in water footprint, while vegetarians have the lowest values (p < 0.001).
Carbon and water footprint values of groups.
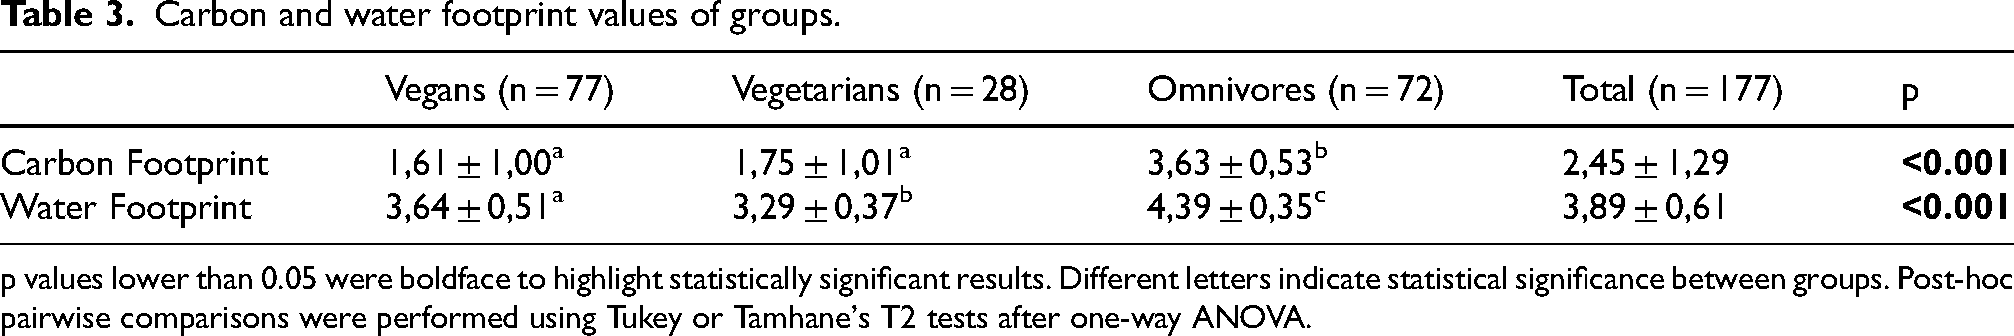
p values lower than 0.05 were boldface to highlight statistically significant results. Different letters indicate statistical significance between groups. Post-hoc pairwise comparisons were performed using Tukey or Tamhane's T2 tests after one-way ANOVA.
According to the HEI classification, greenhouse gas and water footprint values of the groups are shown in Figure 2. According to the HEI classification, in those with adequate diet quality compared to those with poor diet quality, an increase in carbon footprint values was detected in vegans and a decrease in vegetarians and omnivores, while a decrease in water footprint values was detected in vegans and vegetarians and an increase in omnivores (p < 0.05).
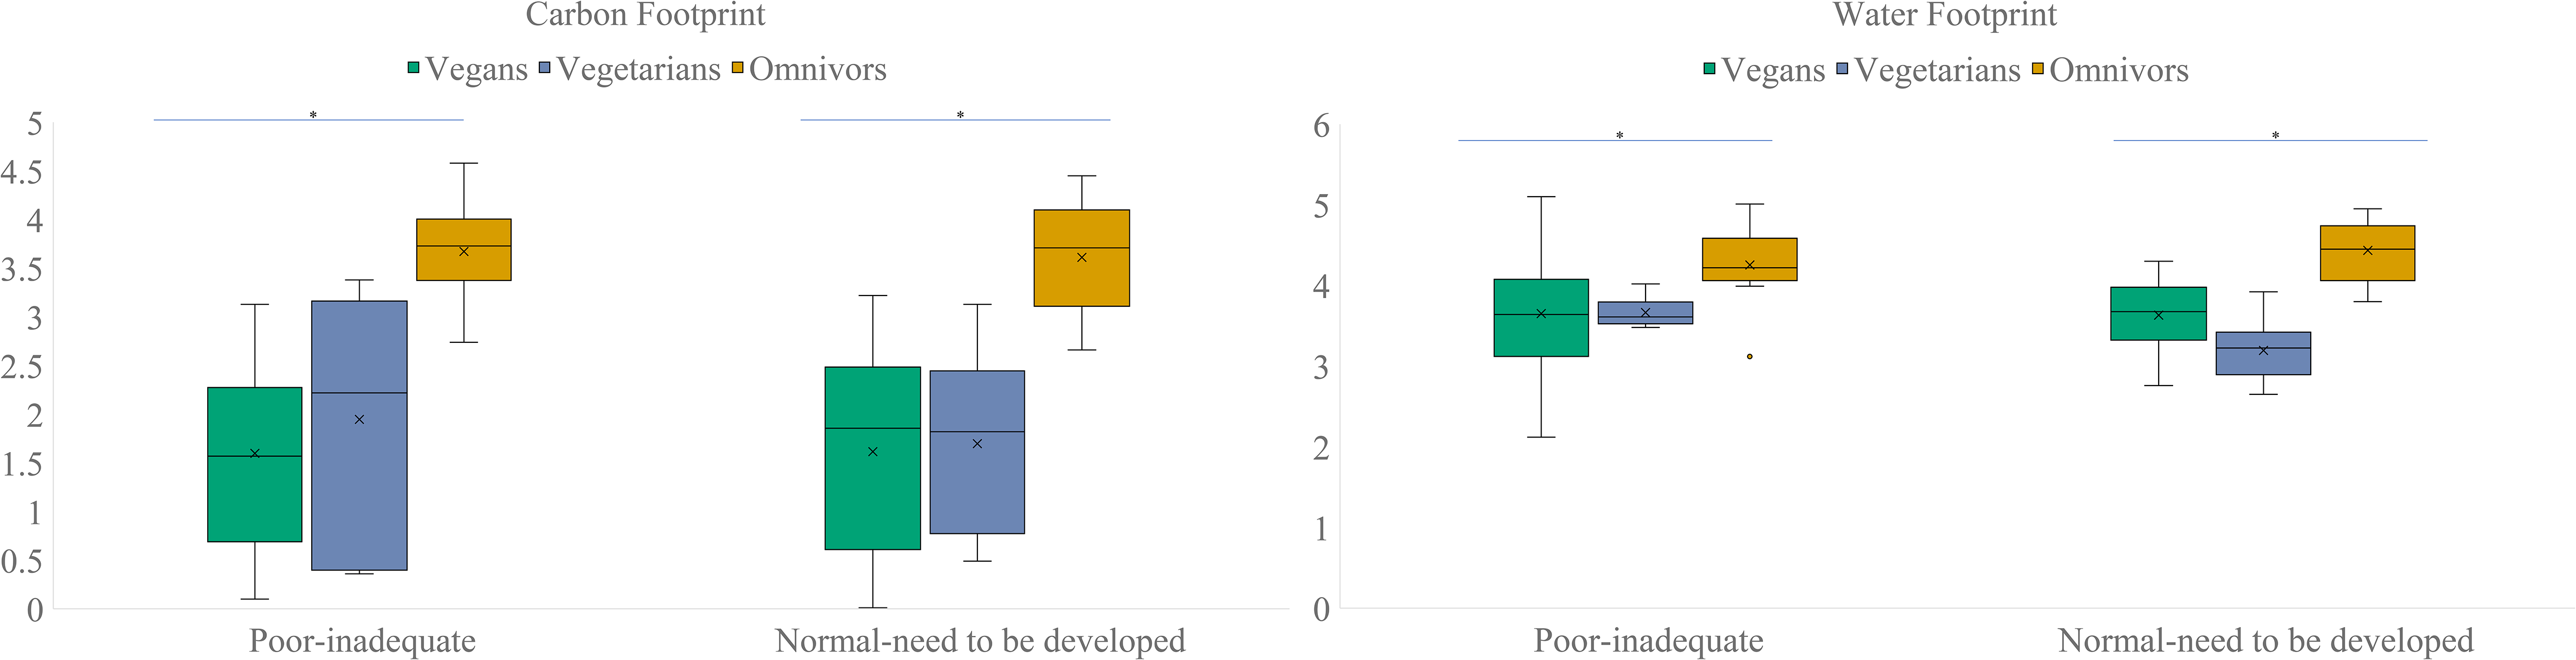
Carbon and water footprint values of groups according to HEI classification.
Table 4 shows the effect of HEI scores on carbon and water footprint values by Linear Regression Analysis. According to the table, carbon footprint values have a negative relationship with whole fruits scores, total vegetables scores, greens and beans scores, whole grains scores, seafood and plant protein scores and fatty acids scores; and a positive relationship with dairy scores, total protein scores, refined grains scores, added sugars scores and saturation fats scores (p < 0.05). Water footprint values have a negative relationship with whole fruits scores, total vegetables scores, whole grains scores and fatty acids scores; and a positive relationship with dairy scores, total protein scores, refined grains scores, added sugars scores and saturation fats scores (p < 0.05).
Examining the effect of HEI scores on carbon and water footprint values using Linear Regression Analysis.
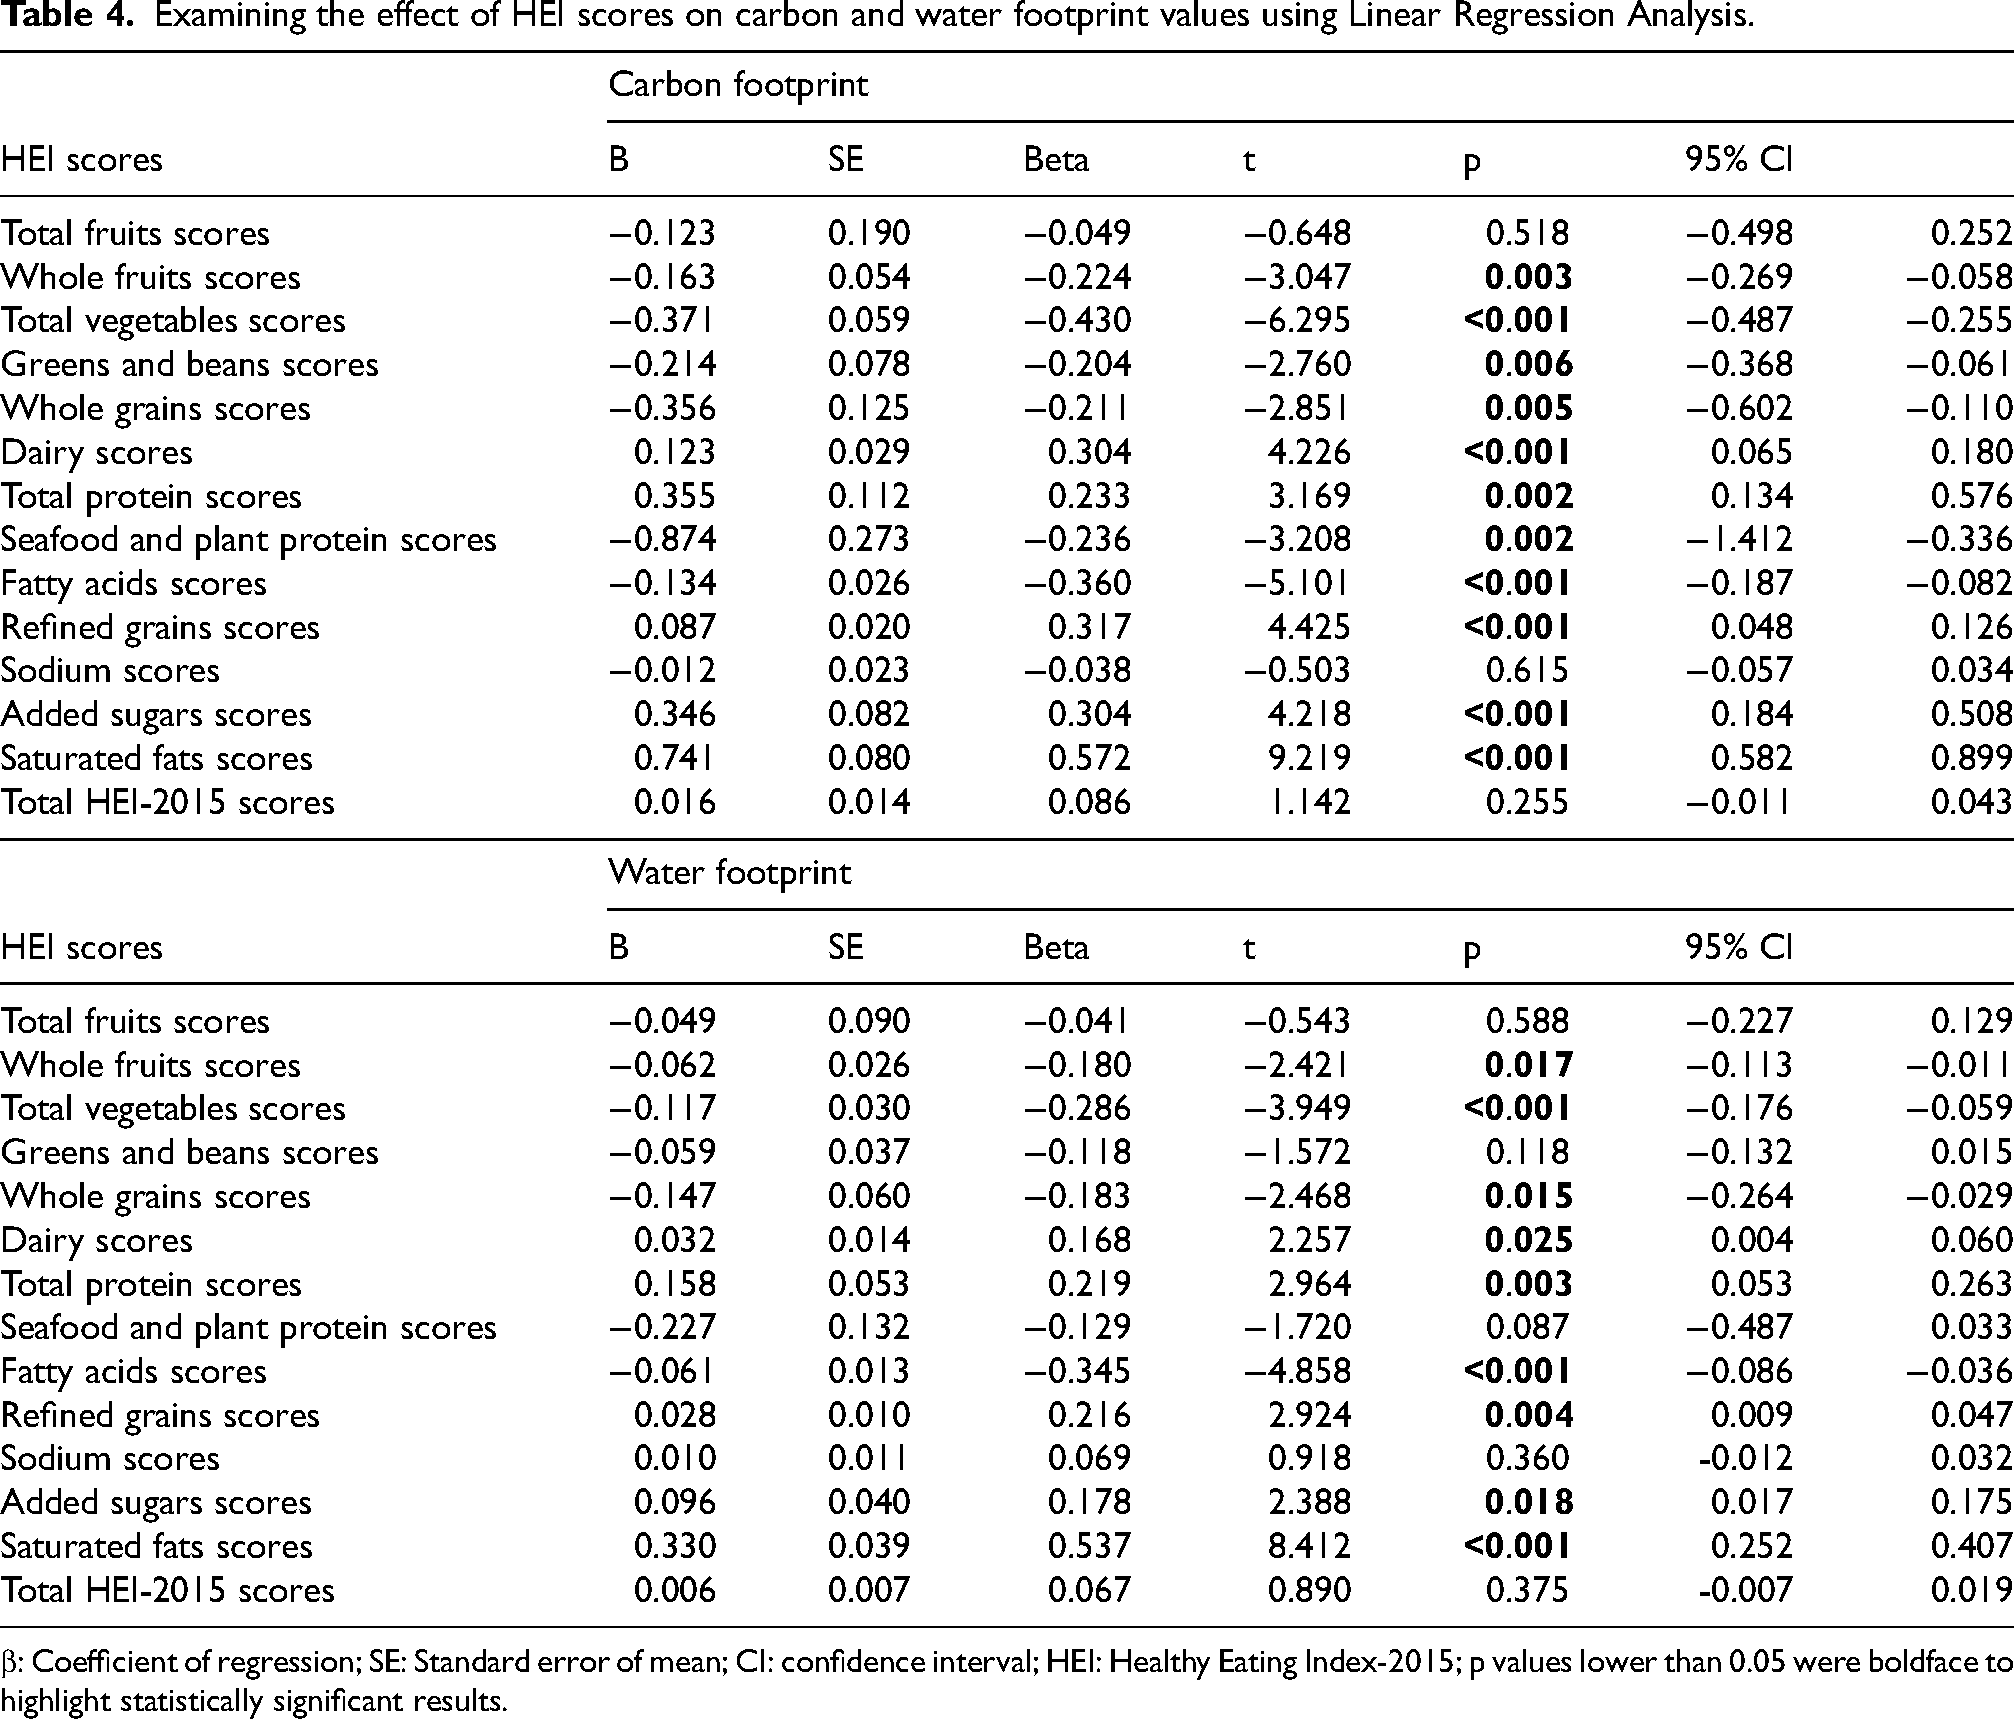
β: Coefficient of regression; SE: Standard error of mean; CI: confidence interval; HEI: Healthy Eating Index-2015; p values lower than 0.05 were boldface to highlight statistically significant results.
Discussion
This study compared dietary quality and environmental impacts among vegan, vegetarian, and omnivore individuals. Accordingly, the results of this study showed that diet quality was generally similar across all groups and corresponded to adequate diet quality. When plant-based diet groups were compared, vegetarians had relatively higher diet quality within the adequate range, while approximately 27.1% of participants in all groups had poor diet quality. In terms of environmental impacts, omnivore diets showed higher carbon and water footprints, while vegan diets showed lower carbon footprints. The lower water footprint in the vegetarian group was also noteworthy. Diet quality was also found to be closely related to carbon and water footprint values so these findings suggest that diet quality may serve as a key linking factor between nutritional patterns and both environmental sustainability and health-related outcomes.
Gender is a significant variable in the study population, and studies on vegans, vegetarians, and omnivores have reported that female participants are in the majority. 44 Similarly, in this study, the number of women is greater than the number of men (Table 1). Women's greater interest in health and nutrition issues may increase their likelihood of adopting these lifestyles. The literature reports that the average age of vegan and vegetarian individuals is lower than that of omnivores.45,46 This study also shows that the omnivore group has a higher average age (Table 1). It has been previously shown that age differences can affect food choices, nutrient intake, and lifestyle behaviors, altering both dietary quality and environmental impact indicators.47,48 One important consideration in this study is the relatively wide age range of participants (19–64 years). Age is known to influence dietary habits, energy requirements, metabolism, and health-related behaviors. Therefore, differences in diet quality and environmental impact across dietary groups may be partially affected by age-related factors. In the study by Grygorczuk et al. (2024), it was reported that vegan, vegetarian, and omnivore individuals were more likely to have a university degree. 45 Similarly, the proportion of university graduate participants was high in this study (Table 1). This suggests that education level may be related to dietary preferences and health awareness. Leshem and Shaul (2022), however, reported that the number of non-smokers was lower among these groups. 49 In contrast, smoking status was found to be similar among the groups in this study (Table 1). This difference can be explained by the effect of increased health awareness, legal regulations, and changing social norms on reducing smoking. In another study, the average BMI of omnivorous individuals was determined to be higher than vegan and vegetarian individuals. 50 This study contains similar results (Table 1). Vegan and vegetarian individuals are generally more conscious of their health-oriented nutritional preferences than omnivores. This awareness, combined with portion control, healthy food choices and regular physical activity habits, can contribute to a lower BMI. In a study conducted by Junqueira (2020), it was determined that omnivores were in the group with obese and overweight individuals, while vegetarians were mostly in the group with thin individuals. 51 In another study conducted with vegan vegetarians and omnivores, it was determined that vegan and omnivorous individuals were more in the overweight and obese group than in the vegetarian group. 52 Similar results were reached in this study (Table 1) (p < 0.05). Despite vegans’ plant-based diet, their tendency to choose more processed and refined foods can cause body weight gain. The lower body weight of vegetarian individuals can be explained by their more balanced and diverse diet by consuming a limited amount of animal products.
Veganism stands out as a healthy dietary model due to its low saturated fat content and rich composition of fruits, vegetables, whole grains, and legumes. 53 Consistent with this study, previous research has also shown that vegan individuals similarly have low saturated fat and high plant-based food consumption.54–56 Furthermore, compared to meat-eaters, vegetarians have been reported to consume less dairy, added sugar, and saturated fat; and more plant-based protein, unsaturated fat, and in some studies, seafood. 57 Another study comparing vegan and omnivore individuals found that the vegan group had higher consumption levels of healthy carbohydrate sources such as vegetables, fruits, and whole grains, and lower consumption levels of refined grains. 58 Similar findings obtained in this study (Table 2) can be considered a natural reflection of the plant-based dietary preferences of vegan and vegetarian individuals. It is known that plant-based dietary patterns (including vegan and vegetarian diets) are not homogeneous and can show significant differences in terms of diet quality and composition. Indeed, current evidence shows that the health effects of these diets depend not only on the exclusion of animal products but also on the overall diet quality. In this regard, Kwiatkowska et al. (2022) reported significant heterogeneity in lifestyle, cardiovascular risk, and metabolic outcomes among individuals following a plant-based diet. 52 Similarly, findings from the EPIC-Oxford cohort also reveal that the long-term health effects of vegetarian and vegan diets are not always positive and are largely dependent on diet quality. 50 While the literature reports that vegetarian and vegan individuals generally have higher HEI scores than omnivores, there are inconsistencies in this regard. Some studies show that only vegetarians have higher scores, while others report that both vegan and vegetarian groups have higher values.57,59 In this study, the finding that omnivores achieved comparable or even higher total HEI-2015 scores than vegans and vegetarians is noteworthy (Table 2) and may be explained by the greater dietary diversity associated with omnivorous eating patterns, which can facilitate a more balanced intake of macro- and micronutrients.These findings suggest that plant-based diets may vary considerably in terms of their healthfulness. The health and environmental impacts of these diets depend not only on the exclusion of animal products but also on diet quality, degree of processing, and nutritional diversity. Therefore, the findings of the present study, particularly regarding HEI scores and environmental indicators, should be interpreted with consideration of overall diet quality rather than dietary classification alone. Additionally, the consumption of both animal- and plant-based foods in omnivorous diets may contribute to greater dietary diversity and a more balanced intake of protein, vitamins, and minerals. In contrast, vegan and vegetarian individuals may face challenges in achieving a sufficiently diverse dietary pattern if their food choices are limited or rely heavily on processed plant-based alternatives. The increasing availability and convenience of processed plant-based foods may further contribute to suboptimal dietary quality in these groups. Although statistically significant differences were observed in several HEI-2015 components in this study (Table 2), the differences in total HEI scores between dietary groups were relatively modest, and the majority of participants were classified as having diets that adequate. This suggests that component-level differences may not necessarily translate into substantial differences in overall diet quality. Furthermore, emerging evidence indicates that plant-based diets are not inherently associated with superior diet quality, and that their healthfulness largely depends on the quality and composition of the foods consumed.50,60 Therefore, the results of the present study highlight the importance of evaluating overall diet quality rather than relying solely on dietary classification.
Omnivorous, vegetarian and vegan diets contain significant differences in energy and nutrients.54,61,62 While environmentally sustainable dietary patterns, particularly plant-based diets, are often associated with lower carbon and water footprints, their nutritional adequacy should also be carefully considered. Evidence suggests that reducing animal-based food consumption may lead to lower intakes of certain essential nutrients, such as vitamin B12, iron, calcium, and omega-3 fatty acids, if not properly planned.63,64 Literature reports that omnivorous individuals have higher protein and cholesterol intake, while vegan and vegetarian individuals have higher fiber and magnesium intake.45,57 Similarly, in this study, energy, carbohydrate, protein, cholesterol, zinc, and calcium intake were highest in omnivores; fiber, plant protein, and magnesium intake were highest in vegans and vegetarians, respectively (Figure 1). These findings show that the differences in macro and micronutrients between the dietary groups are largely consistent with the literature. Omnivorous diets, being rich in animal sources, increase energy, protein, cholesterol, and calcium intake; while vegan and vegetarian diets, due to their plant-based sources, excel in fiber, plant protein, and magnesium. These results suggest that each dietary model offers advantages in terms of specific nutrients, and the observed differences are related to dietary composition. Therefore, it can be said that the optimal approach for health is to obtain nutrients from balanced and high-quality sources. Diet quality is closely linked not only to environmental sustainability but also to cardiovascular health outcomes. Previous studies indicate that differences in cardiovascular risk profiles among vegans, vegetarians, and omnivores are largely driven by overall diet quality and lifestyle factors rather than dietary exclusion alone.9,52,60 Therefore, interpreting dietary patterns requires consideration of both health and environmental dimensions simultaneously. Therefore, diets that are environmentally sustainable are not inherently nutritionally optimal. Conversely, diets that provide adequate macro- and micronutrient intake may, in some cases, be associated with higher environmental impacts. This highlights a potential trade-off between environmental sustainability and nutritional adequacy. In this context, achieving both health and sustainability goals requires well-balanced dietary patterns that emphasize nutrient-dense food choices, dietary diversity, and appropriate planning rather than focusing solely on dietary classification.
Scientific studies show that diets with lower animal product consumption have a smaller environmental footprint and increase sustainability.65,66 Indeed, Góralska-Walczak et al. (2023) reported that vegan and vegetarian individuals had a lower carbon footprint than omnivores. 19 Similarly, other studies have reported that omnivores have higher carbon and water footprints. 67 The findings obtained in this study are also consistent with the literature, and it was determined that the carbon and water footprints were significantly higher in the omnivore group (Table 3). This situation can be explained by the fact that animal food production is associated with intensive land use and high levels of fossil fuel, water, and feed requirements. Therefore, it can be said that omnivore diets rich in meat and dairy products have a higher environmental burden.
Studies on dietary preferences show that different diets have significant effects on carbon and water footprints. Plant-based diets (vegan and vegetarian) are reported to be advantageous in terms of both reducing environmental damage and supporting sustainability; these diets generally have lower carbon and water footprints compared to omnivores.19,67,68 Indeed, a study conducted in the Netherlands showed that replacing meat and dairy products in diets with entirely plant-based alternatives reduced the carbon footprint. 69 Similarly, studies comparing different diets have found that the lowest carbon and water footprints are found in vegan and vegetarian diets. 70 In this study, as the diet quality moved from low to higher classes, an increase in the carbon footprint of vegans and a decrease in the carbon footprint of vegetarians and omnivores were observed. In terms of water footprint, a decrease was observed in vegans and vegetarians, while an increase was observed in omnivores (Figure 2). It is widely believed that reducing animal-based foods will subsequently lead to a reduction in protein intake, so ideally alternative protein sources should be added instead, and in this context, the use of alternative plant-based foods (such as legumes) is a way to reduce the environmental impact of a healthy diet in terms of carbon footprint. 68 However, considering the differences in findings, changes in diets can vary greatly, especially in terms of environmental impact and water use, and the water footprint can increase with the effect of certain food groups (such as increasing legumes) in vegan and vegetarian diets, which are considered healthy sustainable diets. However, implementing other changes, such as reducing more animal-based foods and food waste, can significantly reduce the carbon and water footprint compared to adopting a healthy diet alone.
Literature has shown that diets with lower consumption of animal products generally reduce carbon footprint and land use.20,71 However, it has also been reported that some plant-based diets may have a relatively high water footprint. 72 Indeed, Auclair and Burgos (2021) stated that plant-based foods (fruits, vegetables, legumes, and whole grains) have a low impact on carbon footprint, while other studies have shown that vegan and vegetarian diets have a lower carbon footprint compared to omnivores.72,73 On the other hand, diets with a high carbon footprint are generally associated with the consumption of added sugar and refined grains; In diets with a low carbon footprint, it has been reported that saturated fat and sodium intake may be lower, but sugar intake may be higher.26,74–76 Modeling studies on dietary composition have shown that replacing meat with legumes and reducing certain grain groups can reduce the water footprint, while meat and dairy products are the groups that contribute most to the water footprint.77,78 However, it has also been noted that reducing meat and replacing it with dairy products may not lead to a significant improvement in the water footprint. 79 In addition, refined grains and sugars are among the important components that increase the water footprint after meat and dairy products. 80 While the water footprint findings in this study are consistent with the literature, differences were observed in carbon footprint and added sugar and saturated fat intake (Table 4). When all these findings are considered together, it is understood that healthy eating may not always lead to more environmentally sustainable results; environmental impacts depend not only on the type of diet but also on the consumption of processed foods and general dietary habits.
In conclusion, this study highlights that while plant-based diets are associated with lower environmental impacts, their nutritional adequacy depends largely on diet quality and composition. Diet quality emerged as a key factor linking nutritional intake with environmental sustainability, emphasizing that achieving optimal health and environmental outcomes requires well-balanced and carefully planned dietary patterns rather than reliance on dietary classification alone.
Limitation
This study has several limitations. Due to its cross-sectional design, causal relationships between dietary patterns, diet quality, and environmental impact indicators cannot be established. The wide age range of participants (19–64 years) may have introduced variability in dietary intake and lifestyle behaviors. Dietary intake was assessed using a single 24-h recall, which may not fully reflect habitual intake and is subject to recall bias. In addition, carbon and water footprint calculations were based on secondary literature data rather than country-specific factors, which may limit generalizabilityFinally, potential confounding factors such as physical activity level, socioeconomic status, and lifestyle behaviors were not included in the analysis and may have influenced both diet quality and environmental impact outcomes.
Conclusion
This study revealed limited differences in dietary quality among vegan, vegetarian, and omnivorous adults. A large majority of participants in all dietary groups were categorized as having adequate. Significant differences in total HEI scores were limited between groups, with omnivorous individuals exhibiting similar or higher total HEI scores in some instances. In terms of environmental impact, omnivorous diets showed the highest carbon and water footprint values, while vegan diets were associated with the lowest carbon footprint and vegetarian diets with the lowest water footprint. The findings indicated that higher HEI scores were generally associated with lower carbon and water footprints for several diet quality components, suggesting a partial relationship between diet quality and environmental impact. Overall, the results suggest that dietary patterns differ not only in nutritional quality but also in their environmental burden, based on the observed data. In conclusion, dietary changes are an important component of a sustainable future. Therefore, more research is needed in various contexts to optimize meatless diets to achieve maximum health and low environmental impact.
Footnotes
Acknowledgments
There is no acknowledgments.
Ethics approval
Ethics Committee Approval number 7/361, dated 09.04.2025 was received from Clinical Research Ethics Committee in accordance with the Declaration of Helsinki criteria.
Consent to participate
The purpose and protocol of this study were explained to all participants, and written informed consent was obtained.
Consent for publication
There is no conflict of interest between the authors.
Author contributions
Conceptualisation: GEK, YV; Methodology: GEK, YV; Investigation, GEK, YV; Writing: GEK, YV, Review and Editing, GEK, YV; Supervision, GEK, YV; Data Provision: GEK, YV.
Funding
The authors received no financial support for the research, authorship, and/or publication of this article.
Declaration of conflicting interests
The authors declared no potential conflicts of interest with respect to the research, authorship, and/or publication of this article.
Data availability
Data will be made available on request